CISA & CoCoRaHS Citizen Science Condition Monitoring Project
|
|
|
- Dwain Whitehead
- 5 years ago
- Views:
Transcription
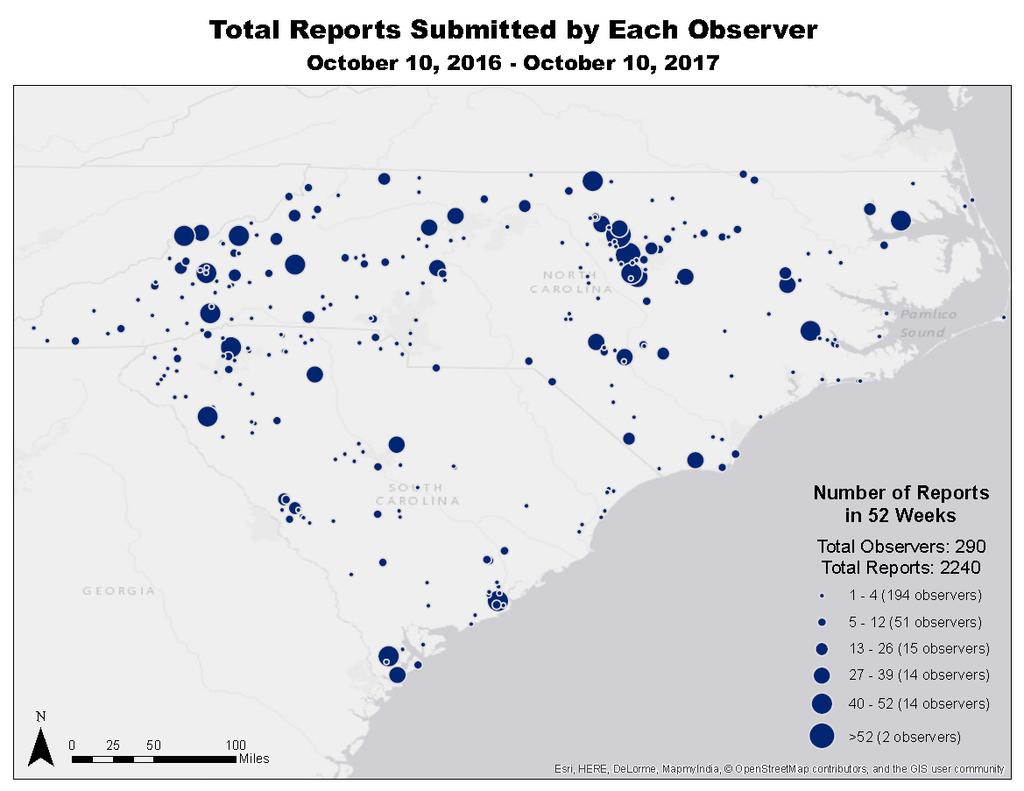
1 Carolinas Integrated Sciences & Assessments Department of Geography, University of South Carolina Columbia, SC (803) CISA & CoCoRaHS Citizen Science Condition Monitoring Project Evaluation Background Materials The following pages include information about CoCoRaHS observers in North and South Carolina who have submitted condition monitoring reports over the study period, October 2016 to October 2017, to include: A map of observer locations and number of reports submitted A timeline of the study period showing the number of condition monitoring reports submitted each week in conjunction with potential factors which may have influenced report submission (e.g., drought conditions, other extreme events, communications and outreach materials) An analysis of condition monitoring scale bar selections in comparison to other, objective drought indices Six individual observer case studies We will use these materials during the feedback discussion as we talk through different elements of the pilot program. If you are completing the online survey on your own, links are provided within the survey to various parts of this document for you to reference while taking the survey. 1
2 2

3 Potential Factors Influencing Carolinas Condition Monitoring Report Submission Drought categories represents drought conditions throughout both North and South Carolina during the study period, October 2016 October

4 CoCoRaHS Condition Monitoring Scale Bar Analysis One question potential users of condition monitoring reports often ask is how well observations match with objective drought indices. To help answer this question, Rebecca Ward, Extension Climatologist with the State Climate Office of North Carolina, completed an assessment to compare CoCoRaHS observer s scale bar selections with two objective drought indices, the Standardized Precipitation Index (SPI) and the Standardized Precipitation- Evapotranspiration Index (SPEI). The analysis was completed for the study period, October 1, 2016 to October 10, 2017 (data through 9am EDT on the ending date). SPI and SPEI were obtained for the grid points closest to each station for timescales of 1, 2, 3, 6, 9, and 12 months. All instances where a reporter did not select a scale bar value were removed (31 reports). In total, there are 2,231 reports from 288 observers. Of these observers, o 106 submitted one report only o 46 submitted only two reports o 23 submitted only 3 reports o 82 observers submitted 6 or more reports Guidance for observers instructs them to submit weekly. The remaining 82 observers were subset to those who had submitted at least 27 reports (or for approximately half of the weeks within the study period) and who had an average reporting interval between 5 and 9 days (7 days ±2). This resulted in a list of 17 observers, (5 in SC and 12 in NC). Combined, these 17 observers account for 36% of all submitted reports for the study period. Condition Monitoring Scale Bar Correlations with the Standardized Precipitation Index & Standardized Precipitation-Evapotranspiration Index All 288 Observers Subset of 17 Consistent Observers SPI-CM SPEI-CM SPI-CM SPEI-CM Pearson Spearman Pearson Spearman For the whole set of observers, correlations are slightly higher than those for the smaller set of consistent observers. Overall, observer scale bar selections correlate more strongly with shorter-term drought index durations, though there are cases for individual observers where this is not the case (see case study observer pages below). Additionally, while SPI and SPEI are similarly correlated with condition monitoring scale bar selections, SPEI has a slightly higher correlation, which may indicate the role of temperature in observers reporting. 4
5 Case Study Observers Six observers were selected as case studies due to demonstrated consistency in submitting condition monitoring reports (number and frequency) and inclusion of a variety of information in their reports. Observers selected for case study are marked with red stars on map above. Each Observer page includes the following information: CoCoRaHS Station Name and Number Table of observer characteristics Word Cloud created using the observer s condition monitoring reports Results table from Condition Monitoring Scale Bar Analysis o The highest correlations between an observer s scale bar selections and the drought indices (SPI & SPEI) are highlighted. Time scales for the closest correlations vary by observer. Pie chart of condition monitoring report content with respect to the 10 impact reporting categories available to select on the CoCoRaHS Condition Monitoring report form and the National Drought Impact Reporter. o The number of category references refers to self-selected report categories in the observer s reports submitted between October 1, 2016 and October 10, Examples of the observers condition monitoring reports 5
 Anderson Upper Savannah River CoCoRaHS Observer Since July 19, 2009 2016-2017 Water Year Days Reported 354 Condition Monitoring Reporter Since October 23,2016 Condition Monitoring Reports")
6 SC-AN-21 (Anderson 10.5 SE) Anderson Upper Savannah River CoCoRaHS Observer Since July 19, Water Year Days Reported 354 Condition Monitoring Reporter Since October 23,2016 Condition Monitoring Reports Submitted thru October 10, October 23, 2016: We have had only 0.08 inches of rainfall in October so far and only about 2 inches since the beginning of September. Between lack of rain and high temperatures (we hit 90 a couple days this week) grass in the yard is brown and I'm regularly watering young plants in the yard. My brother-in-law is also concerned about feeding his cattle and sheep. The garden is finished producing but the ground is too hard and dry to weed. Our pecans have started to fall, especially with the strong winds we've experienced as this most recent cold front came through. November 6, 2016: Another week with no rain. My brother-in-law is selling a few calves to help with the food situation. Temperatures are a little more moderate than they have been, at least yesterday was in the upper 60s to low 70s. Drought maps from the weather channel show our area in severe drought but other areas are much worse. January 1, 2017: Happy New Year! This week as I was working in the garden I noticed that, even though we haven't had a ton of rain, the soil is still relatively damp. I guess the cooler temps have allowed the rain that we've had to stay in the soil longer. The pecan crop is harvested weighing in at about 230 pounds of cracked pecans! Obviously a dry October and November didn't affect it. 6
 Richland Lower Broad River CoCoRaHS Observer Since March 23, 2008 2016-2017 Water Year Days Reported 339 Condition Monitoring Reporter Since November 10, 2013 Condition Monitoring Reports")
7 SC-RC-12 (Columbia 6.7N) Richland Lower Broad River CoCoRaHS Observer Since March 23, Water Year Days Reported 339 Condition Monitoring Reporter Since November 10, 2013 Condition Monitoring Reports Submitted through October 10, October 15, 2016: For the first half of October, all of our precipitation (5.25") came from Hurricane Matthew. We see no evidence of water stress in any of our plant life. Even the plants in pots have required relatively little care. Growth has slowed, but we attribute that to significantly lower temperatures, especially at night. December 3, 2016: After 15 straight zeros, we recorded 1.23" on November 30 and December 1. Again, because everything is going dormant, we don't see stress in plants. It was a good soaker, so it helped the soil, which was quite dusty. April 8, 2017: We just completed the first week in April and already have close to 3". The lion's share of it fell in two intense and relatively quick-hitting thunderstorm events and, since so much water ran off, things don't seem exceptionally moist. No problems here with hail or twisters, but we've heard that folks west of here got one or both. October 7, 2017: Reported our first rain this morning after 15 zeros. We've had 0.07" since Sep 14. The lawn looks stressed in most places; it probably would look worse, but milder temperatures at the end of the growing season have helped mitigate evaporation. 7


8 SC-CR-88 (Charleston 2.0 S) Charleston Stono River CoCoRaHS Observer Since November Water Year Days Reported 365 Condition Monitoring Reporter Since December 1, 2013 Condition Monitoring Reports Submitted through October 52 10, October 23, 2016: With no rain at all for two weeks since being soaked by Hurricane Matthew, the soil in the raised bed vegetable garden is dry enough to require supplemental watering. December : With more than 2 inches of rain mid-week, water stood in low places like storm ditches for a day or so but soaked in well after that. Plants in the vegetable garden are doing well. March 19, 2017: Continuing weeks with very limited rainfall leaves soil quite dry. Supplemental watering in the vegetable garden is required both for new transplants and for newly planted seed beds. July 20, 2017: With several weeks of multi-inch rain, the ground is now saturated, with water standing in low places like storm water ditches. September 3, 2017: Standing water again. Plants in the vegetable garden continue to do well except that frequent rain all Summer has meant more damage from mildew diseases that thrive in wet conditions. 8
 Durham Haw River CoCoRaHS Observer Since September 5, 2007 2016-2017 Water Year Days Reported 364 Condition Monitoring Reporter Since June 1, 2015 Condition Monitoring Reports Submitted through")
9 NC-DH-6 (Durham 1.2 NW) Durham Haw River CoCoRaHS Observer Since September 5, Water Year Days Reported 364 Condition Monitoring Reporter Since June 1, 2015 Condition Monitoring Reports Submitted through October 53 10, October 17, 2016: Although no rain the past week the lots of soil moisture remains from the more than 5 1/2" or slow rain (Mostly Matthew), the week before. December 4, 2016: With just.15" this week, and only.87" since Matthew (since 10/10, about 8 weeks) conditions remain dry. However, since most plant growth has slowed or stopped, very little effect. Even winter annuals seem to be looking healthy except in v. dry, sunny exposed areas. February 26, 2017: With no rain this week and only.97" for the month we have definitely reached the drier than normal category. This has been exacerbated by the much higher than normal temps, often 20 above normal. Am having to water newly planted garner seed (peas), and many of the newly planted/transplanted perennials (mostly woody), that we have put in this winter. May 28, 2017: With 2.80" this week (and 6.58" for the month to date), we have slipped back into the mildly wet. Places where water stands are wet and even this all the rains have been nice and slow, there has been some run off due to the on occasion saturated top soil. Plant growth is lush! 9
 Craven Middle Neuse River CoCoRaHS Observer Since March 10, 2013 2016-2017 Water Year Days Reported 325 Condition Monitoring Reporter Since May 17, 2013 Condition Monitoring Reports Submitted")

10 NC-CN-31 (New Bern 8.8 W) Craven Middle Neuse River CoCoRaHS Observer Since March 10, Water Year Days Reported 325 Condition Monitoring Reporter Since May 17, 2013 Condition Monitoring Reports Submitted through October 10, October 2, 2016: abnormally wet: corn that wasn't harvested last week - is now standing in the fields which are wet; lower temps at night - but still hot and humid during the daytimes so Air Conditioners running; fire threat level must be low - everything is wet, and the fall dry leaves haven't really started yet; Blooming - morning glories / magnolias / golden rod / some eleagnus / wild aster / some groundsel; Does have abandoned their now 7 month or so old offspring / Squirrels are burrowing their finds into the ground; MOSQUITOS are AWFUL this year; leaves continue to change color and are beginning to fall - especially oak Tourism: mostly not impacted, although some events were held this week because previous weekend was impacted (mostly high school football games); Normal rivers are higher than normal. September 10, 2017: This past week has seen a continuation of a couple nice days, followed by a day or so of rain. The rain accumulations have been enough to make it difficult to mow - standing water areas in some places. THIS was especially concerning as the original predicted forecast for Hurricane Irma's track was directly at our area. It is now MUCH REMOVED from our concerns. Pending the anticipated arrival of Hurricane Irma, the corn farmers were scrambling, on very wet ground, to harvest their crops prior to the anticipated storm; 10
 Madison French Broad River CoCoRaHS Observer Since November 21, 2008 2013-2014 Water Year Days Reported 351 Condition Monitoring Reporter Since June 26, 2014 Condition Monitoring Reports")

11 NC-MS-5 (Marshall 13.6 NNW) Madison French Broad River CoCoRaHS Observer Since November 21, Water Year Days Reported 351 Condition Monitoring Reporter Since June 26, 2014 Condition Monitoring Reports Submitted through October 10, November 12, 2016: Despite the prolonged lack of rain--only.05" in the last week, only.22" for this month-- we still have growing grass! Our spring & creek continue to run. However, a state of emergency and a total fire ban have been issued for the 25 western counties of NC. Over 20 forest are burning causing evacuations, excessive smoke, and closures of roads, trails, and state parks. The air quality is considered unhealthy for sensitive people. Last week the winds brought some of that smoke thickly across our county. Fall color is essentially over. Our forest trees are mostly bare, with just a few oaks and beeches hanging on to their leaves as is typical. The woods are quiet --only a few crickets and bird chirps. We continue to have heavy dew in the morning which was heavy frost the last two days. Our garden plants are growing without additional water. We expect a hard freeze tonight. January 22, 2017: The week some rain has fallen every other day for a total of.65. Warm weather (50s & 60s) with rain brought the wood frogs to our pond to mate on January 20. In the 13 years that I ve been keeping records at this pond, only one year was earlier (Jan. 17, 2013). The average date for the wood frogs return is Feb. 18. Today the frogs are still singing and one large mass of eggs had been laid. Some birds are starting to sing their spring songs. Greens in the garden are actually growing. 11
What Can Citizen Scientists Tell Us about Drought?
 What Can Citizen Scientists Tell Us about Drought? Using CoCoRaHS to Improve the Monitoring and Reporting of Drought Impacts Amanda Farris, Kirsten Lackstrom Carolinas Integrated Sciences & Assessments
Condition Monitoring: A New System for Drought Impacts Reporting through CoCoRaHS
 Condition Monitoring: A New System for Drought Impacts Reporting through CoCoRaHS Amanda Farris Carolinas Integrated Sciences & Assessments (CISA) University of South Carolina WERA 1012 Annual Conference
CoCoRaHS Condition Monitoring
 CoCoRaHS Condition Monitoring CISA Carolinas Integrated Sciences & Assessments CISA works with a variety of stakeholders across North and South Carolina to incorporate climate information into water, public
CoCoRaHS Condition Monitoring. Webinar with Carolinas Observers January 25, 2017
 CoCoRaHS Condition Monitoring Webinar with Carolinas Observers January 25, 2017 Amanda Kirsten David Ellie & Meghan Project Partners CoCoRaHS Condition Monitoring Overview Regular reports describing how
Improving Understanding of Drought Impacts through Citizen Science
 Improving Understanding of Drought Impacts through Citizen Science Amanda Brennan, Janae Davis, Kirstin Dow, Kirsten Lackstrom, Sumi Selvaraj North Carolina Water Resources Research Institute Annual Meeting
What Can Citizen Scientists Tell Us about Drought?
 What Can Citizen Scientists Tell Us about Drought? Amanda Brennan, Kirstin Dow, Benjamin Haywood, Kirsten Lackstrom American Meteorological Society Annual Meeting January 13, 2016 New Orleans, LA Today
November 2018 Weather Summary West Central Research and Outreach Center Morris, MN
 November 2018 Weather Summary Lower than normal temperatures occurred for the second month. The mean temperature for November was 22.7 F, which is 7.2 F below the average of 29.9 F (1886-2017). This November
The hydrologic service area (HSA) for this office covers Central Kentucky and South Central Indiana.
 for this office covers Central Kentucky and South Central Indiana.") January 2012 February 13, 2012 An X inside this box indicates that no flooding occurred within this hydrologic service area. January 2012 continued the string of wet months this winter. Rainfall was generally
January 2012 February 13, 2012 An X inside this box indicates that no flooding occurred within this hydrologic service area. January 2012 continued the string of wet months this winter. Rainfall was generally
but 2012 was dry Most farmers pulled in a crop
 After a winter that wasn t, conditions late in the year pointed to a return to normal snow and cold conditions Most farmers pulled in a crop but 2012 was dry b y M i k e Wr o b l e w s k i, w e a t h e
The Pennsylvania Observer
 The Pennsylvania Observer October 1, 2015 September 2015 - Pennsylvania Weather Recap By: Quinn Lease The month of September will be remembered for its above normal temperatures and dry conditions that
September 2018 Weather Summary West Central Research and Outreach Center Morris, MN
 September 2018 Weather Summary The mean temperature for September was 60.6 F, which is 1.5 F above the average of 59.1 F (1886-2017). The high temperature for the month was 94 F on September 16 th. The
The Pennsylvania Observer
 The Pennsylvania Observer May 31, 2012 May 2012 - Pennsylvania Weather Recap By: Paul Knight The majority of the fifth month had temperatures averaging well above seasonal levels with two distinct hot
2011 Year in Review TORNADOES
 2011 Year in Review The year 2011 had weather events that will be remembered for a long time. Two significant tornado outbreaks in April, widespread damage and power outages from Hurricane Irene in August
As in 2008, greater than normal rainfall occurred in 2009, resulting in optimum
 2009 Weather at the Arboretum Bob Famiglietti As in 2008, greater than normal rainfall occurred in 2009, resulting in optimum soil moisture conditions at the Arboretum. Excellent growth rates were recorded
CoCoRaHS. Carolina PAGES Hurricane Matthew in South Carolina. CoCoRaHS Observers Activity During Hurricane Matthew.
 Carolina CoCoRaHS SUMMER 2017 Hurricane Matthew in South Carolina H urricane Matthew was the first South Carolina hurricane landfall since Hurricane Charley and Gaston came ashore in 2004. It made landfall
Weather Conditions during the 1992 Growing Season
 Weather Conditions during the 1992 Growing Season Item Type text; Article Authors Brown, P.; Russell, B. Publisher College of Agriculture, University of Arizona (Tucson, AZ) Journal Cotton: A College of
Natural Disasters and Storms in Philadelphia. What is a storm? When cold, dry air meets warm, moist (wet) air, there is a storm.
 air, there is a storm.") Natural Disasters and Storms in Philadelphia 1. What is a natural disaster? 2. Does Philadelphia have many natural disasters? o Nature (noun) everything in the world not made No. Philadelphia does not
Natural Disasters and Storms in Philadelphia 1. What is a natural disaster? 2. Does Philadelphia have many natural disasters? o Nature (noun) everything in the world not made No. Philadelphia does not
NIDIS Intermountain West Drought Early Warning System October 30, 2018
 10/30/2018 NIDIS Drought and Water Assessment NIDIS Intermountain West Drought Early Warning System October 30, 2018 Precipitation The images above use daily precipitation statistics from NWS COOP, CoCoRaHS,
Champaign-Urbana 1999 Annual Weather Summary
 Champaign-Urbana 1999 Annual Weather Summary ILLINOIS STATE WATER SURVEY 2204 Griffith Dr. Champaign, IL 61820 wxobsrvr@sws.uiuc.edu Maria Peters, Weather Observer A major snowstorm kicked off the new
Above normal temperatures and precipitation continue across the HSA
 NWS Form E-5 (PRES. BY NWS Instruction 10-924) MONTHLY REPORT OF HYDROLOGIC CONDITIONS HYDROLOGIC SERVICE AREA (HSA) MONTH YEAR TO: Hydrologic Information Center, W/OS31 NOAA s National Weather Service
CoCoRaHS Condition Monitoring. Presentation to NC CoCoRaHS Observers February 21, 2014
 CoCoRaHS Condition Monitoring Presentation to NC CoCoRaHS Observers February 21, 2014 Today s Presentation Heather Dinon Aldridge NC State Climate Office Amanda Brennan CISA Communications & Outreach Weather
NIDIS Intermountain West Drought Early Warning System January 16, 2018
 NIDIS Drought and Water Assessment NIDIS Intermountain West Drought Early Warning System January 16, 2018 Precipitation The images above use daily precipitation statistics from NWS COOP, CoCoRaHS, and
The Climate of Payne County
 The Climate of Payne County Payne County is part of the Central Great Plains in the west, encompassing some of the best agricultural land in Oklahoma. Payne County is also part of the Crosstimbers in the
NIDIS Intermountain West Drought Early Warning System September 4, 2018
 NIDIS Drought and Water Assessment NIDIS Intermountain West Drought Early Warning System September 4, 2018 Precipitation The images above use daily precipitation statistics from NWS COOP, CoCoRaHS, and
UNITED STATES AND SOUTH AMERICA OUTLOOK (FULL REPORT) Thursday, December 28, 2017
 Thursday, December 28, 2017") T-storm Weather Summary Despite scattered t-storms Sat.-Sun. in central and northern areas in Argentina, more will likely be needed especially in sunflower areas of the southwest. Some t-storms likely
T-storm Weather Summary Despite scattered t-storms Sat.-Sun. in central and northern areas in Argentina, more will likely be needed especially in sunflower areas of the southwest. Some t-storms likely
Community Collaborative Rain, Hail & Snow Network
 Community Collaborative Rain, Hail & Snow Network NWS Gray and Matt Spies September 2016 Hello Observers! This is the first edition of a newsletter that we will be sending out to our current CoCoRaHS observers.
Climate Outlook through 2100 South Florida Ecological Services Office Vero Beach, FL September 9, 2014
 Climate Outlook through 2100 South Florida Ecological Services Office Vero Beach, FL September 9, 2014 Short Term Drought Map: Short-term (
NIDIS Intermountain West Drought Early Warning System August 8, 2017
 NIDIS Drought and Water Assessment 8/8/17, 4:43 PM NIDIS Intermountain West Drought Early Warning System August 8, 2017 Precipitation The images above use daily precipitation statistics from NWS COOP,
The Climate of Marshall County
 The Climate of Marshall County Marshall County is part of the Crosstimbers. This region is a transition region from the Central Great Plains to the more irregular terrain of southeastern Oklahoma. Average
Champaign-Urbana 2001 Annual Weather Summary
 Champaign-Urbana 2001 Annual Weather Summary ILLINOIS STATE WATER SURVEY 2204 Griffith Dr. Champaign, IL 61820 wxobsrvr@sws.uiuc.edu Maria Peters, Weather Observer January: After a cold and snowy December,
2018 Year in Review for Central and Southeast Illinois By: Chris Geelhart, Meteorologist National Weather Service, Lincoln IL
 By: Chris Geelhart, Meteorologist National Weather Service, Lincoln IL While 2018 featured some significant out-of-season weather, including below zero temperatures in April and 90-degree highs in early
Northwest Outlook October 2016
 Northwest Outlook October 2016 Rainfall Opportunities and Challenges Rainfall over the month of September presented some challenges for the fall harvest while other producers benefitted. Figure 1a shows
NIDIS Intermountain West Drought Early Warning System November 13, 2018
 NIDIS Intermountain West Drought Early Warning System November 13, 2018 Precipitation The images above use daily precipitation statistics from NWS COOP, CoCoRaHS, and CoAgMet stations. From top to bottom,
May 2016 Volume 23 Number 5
 The Weather Wire May 2016 Volume 23 Number 5 Contents: Winter Summary Current Colorado and West-wide Snow Pack Drought Monitor April Summary/Statistics May Preview Snowfall Totals Winter Summary The Front
CLIMATE. UNIT TWO March 2019
 CLIMATE UNIT TWO March 2019 OUTCOME 9.2.1Demonstrate an understanding of the basic features of Canada s landscape and climate. identify and locate major climatic regions of Canada explain the characteristics
National Wildland Significant Fire Potential Outlook
 National Wildland Significant Fire Potential Outlook National Interagency Fire Center Predictive Services Issued: September, 2007 Wildland Fire Outlook September through December 2007 Significant fire
CISA & CoCoRaHS. June This month's newsletter includes: 20 Years of CoCoRaHS!
 CISA & CoCoRaHS Condition Monitoring Newsletter This month's newsletter includes: 20 Years of CoCoRaHS! Information about our next Carolinas' Condition Monitoring Observer Call A Southeast Regional Climate
The Climate of Bryan County
 The Climate of Bryan County Bryan County is part of the Crosstimbers throughout most of the county. The extreme eastern portions of Bryan County are part of the Cypress Swamp and Forest. Average annual
Champaign-Urbana 1998 Annual Weather Summary
 Champaign-Urbana 1998 Annual Weather Summary ILLINOIS STATE WATER SURVEY Audrey Bryan, Weather Observer 2204 Griffith Dr. Champaign, IL 61820 wxobsrvr@sparc.sws.uiuc.edu The development of the El Nìno
Local Precipitation Variability
 Local Precipitation Variability Precipitation from one storm can vary from neighborhood to neighborhood. What falls in your yard may not fall in the next. The next time it rains see how the precipitation
The Climate of Seminole County
 The Climate of Seminole County Seminole County is part of the Crosstimbers. This region is a transition region from the Central Great Plains to the more irregular terrain of southeastern Oklahoma. Average
Champaign-Urbana 2000 Annual Weather Summary
 Champaign-Urbana 2000 Annual Weather Summary ILLINOIS STATE WATER SURVEY 2204 Griffith Dr. Champaign, IL 61820 wxobsrvr@sws.uiuc.edu Maria Peters, Weather Observer January: January started on a mild note,
A Preliminary Severe Winter Storms Climatology for Missouri from
 A Preliminary Severe Winter Storms Climatology for Missouri from 1960-2010 K.L. Crandall and P.S Market University of Missouri Department of Soil, Environmental and Atmospheric Sciences Introduction The
The Colorado Drought : 2003: A Growing Concern. Roger Pielke, Sr. Colorado Climate Center.
 The Colorado Drought 2001-2003: 2003: A Growing Concern Roger Pielke, Sr. Colorado Climate Center Prepared by Tara Green and Odie Bliss http://climate.atmos.colostate.edu 2 2002 Drought History in Colorado
September 2005 Climate Summary
 Ashley Brooks (765) 494-6574 Oct 5, 2005 http://iclimate.org September 2005 Climate Summary September 1-7 A cold front came through on the 1 st of the month, however little moisture was associated with
A summary of the weather year based on data from the Zumwalt weather station
 ZUMWALT PRAIRIE WEATHER 2016 A summary of the weather year based on data from the Zumwalt weather station Figure 1. An unusual summer storm on July 10, 2016 brought the second-largest precipitation day
CISA & CoCoRaHS Condition Monitoring Newsletter
 Page 1 of 9 Click this link to open the e-mail in a browser. Click here CISA & CoCoRaHS Condition Monitoring Newsletter Dear CoCoRaHS Observer, Happy spring! We hope that you have been enjoying the azaleas,
2012 Growing Season. Niagara Report. Wayne Heinen
 2012 Growing Season Niagara Report Wayne Heinen Overview The 2012 growing season was a phenomenal one for grapes. Vines entered bud break in good shape following a mild winter. The spring of 2012 was similar
2012 Growing Season Weather Summary for North Dakota. Adnan Akyüz and Barbara A. Mullins Department of Soil Science October 30, 2012
 2012 Growing Season Weather Summary for North Dakota Adnan Akyüz and Barbara A. Mullins Department of Soil Science October 30, 2012 Introduction The 2012 growing season (the period from April through September)
over the next three weeks could lower this estimate significantly. Near perfect conditions are needed to realize this projected yield.
 Peanuts across the V-C region experienced excessive rainfall in many areas as a result of Hurricane Florence. Rainfall was particularly heavy in southeastern North Carolina and northeastern South Carolina.
NIDIS Intermountain West Drought Early Warning System October 17, 2017
 NIDIS Drought and Water Assessment NIDIS Intermountain West Drought Early Warning System October 17, 2017 Precipitation The images above use daily precipitation statistics from NWS COOP, CoCoRaHS, and
July 2007 Climate Summary
 Dan Bowman (765) 494-6574 Sep 3, 2007 http://www.iclimate.org Summary July 2007 Climate Summary The month of July ended as a very unusual month. Many events occurred during the month of July that is not
NIDIS Intermountain West Drought Early Warning System February 12, 2019
 NIDIS Intermountain West Drought Early Warning System February 12, 2019 Precipitation The images above use daily precipitation statistics from NWS COOP, CoCoRaHS, and CoAgMet stations. From top to bottom,
Climate Outlook through 2100 South Florida Ecological Services Office Vero Beach, FL January 13, 2015
 Climate Outlook through 2100 South Florida Ecological Services Office Vero Beach, FL January 13, 2015 Short Term Drought Map: Short-term (
CropCast Corn and Soybean Report Kenny Miller Tuesday, March 14, 2017
 Accumulated Rainfall (inches) Accumulated GDDs Temperature ( F)/Wind Speed (mph) Precipitation (inches) CropCast Corn and Soybean Report Kenny Miller Tuesday, March 14, 2017 Peoria, IL Regional Forecast
Climate Change Impact on Air Temperature, Daily Temperature Range, Growing Degree Days, and Spring and Fall Frost Dates In Nebraska
 EXTENSION Know how. Know now. Climate Change Impact on Air Temperature, Daily Temperature Range, Growing Degree Days, and Spring and Fall Frost Dates In Nebraska EC715 Kari E. Skaggs, Research Associate
Precipitation. Standardized Precipitation Index. NIDIS Intermountain West Drought Early Warning System September 5, 2017
 9/6/2017 NIDIS Drought and Water Assessment NIDIS Intermountain West Drought Early Warning System September 5, 2017 Precipitation The images above use daily precipitation statistics from NWS COOP, CoCoRaHS,
The Climate of Murray County
 The Climate of Murray County Murray County is part of the Crosstimbers. This region is a transition between prairies and the mountains of southeastern Oklahoma. Average annual precipitation ranges from
UNITED STATES AND SOUTH AMERICA WEATHER ROUNDUP Sunday, December 17, 2017
 T-storm Weather Summary Extreme heat was followed by heavy rain in some key areas of Argentina yesterday. T-storms affect much of the driest Argentina, southern Brazil, and Paraguay through 7 to 10 days,
January 25, Summary
 January 25, 2013 Summary Precipitation since the December 17, 2012, Drought Update has been slightly below average in parts of central and northern Illinois and above average in southern Illinois. Soil
October Dear CoCoRaHS Observer,
 1 of 9 10/23/2015 8:49 AM Click this link to open the e-mail in a browser. Click here October 2015 In This Issue Climate Update for the Carolinas Historic Rainfall and Flooding in South Carolina Dear CoCoRaHS
Chiang Rai Province CC Threat overview AAS1109 Mekong ARCC
 Chiang Rai Province CC Threat overview AAS1109 Mekong ARCC This threat overview relies on projections of future climate change in the Mekong Basin for the period 2045-2069 compared to a baseline of 1980-2005.
The Climate of Pontotoc County
 The Climate of Pontotoc County Pontotoc County is part of the Crosstimbers. This region is a transition region from the Central Great Plains to the more irregular terrain of southeast Oklahoma. Average
NIDIS Intermountain West Drought Early Warning System November 21, 2017
 NIDIS Drought and Water Assessment NIDIS Intermountain West Drought Early Warning System November 21, 2017 Precipitation The images above use daily precipitation statistics from NWS COOP, CoCoRaHS, and
The Climate of Texas County
 The Climate of Texas County Texas County is part of the Western High Plains in the north and west and the Southwestern Tablelands in the east. The Western High Plains are characterized by abundant cropland
New Hampshire State Climate Office Dr. Mary D. Stampone, State Climatologist
 New Hampshire State Climate Office Dr. Mary D. Stampone, State Climatologist University of New Hampshire c/o Department of Geography 73 Main Street Durham, NH 03824 Phone: 603-862-3136 Fax: 603-862-4362
CISA & CoCoRaHS Condition Monitoring Newsletter
 Page 1 of 8 CISA & CoCoRaHS Condition Monitoring Newsletter Dear CoCoRaHS Observer, Aside from the regular regional climate update, this month's newsletter features a drought decision maker that CISA has
It is never so good as expected and never so bad as feared.
 2018 General: The weather conditions in the Baltics and Scandinavia have not been perfect - not enough rain and high temperatures after drilling. As Scandinavia and Baltics was the area where there was
Extending Learning Beyond the Classroom
 Extending Learning Beyond the Classroom School is out, but learning continues! GRADE 1 Clayton County Public Schools Department of Curriculum, Instruction, & Assessment DR. EBONY T. LEE Director of Curriculum,
2011 National Seasonal Assessment Workshop for the Eastern, Southern, & Southwest Geographic Areas
 2011 National Seasonal Assessment Workshop for the Eastern, Southern, & Southwest Geographic Areas On January 11-13, 2011, wildland fire, weather, and climate met virtually for the ninth annual National
Extreme Weather and Climate Change: the big picture Alan K. Betts Atmospheric Research Pittsford, VT NESC, Saratoga, NY
 Extreme Weather and Climate Change: the big picture Alan K. Betts Atmospheric Research Pittsford, VT http://alanbetts.com NESC, Saratoga, NY March 10, 2018 Increases in Extreme Weather Last decade: lack
UNITED STATES AND SOUTH AMERICA OUTLOOK (FULL REPORT) Wednesday, April 18, 2018
 Wednesday, April 18, 2018") T-storm Weather Summary Coolness continues over the next week in much of the central U.S., most likely producing the coldest April since 1907 in the Corn Belt, but followed by seasonable to mild weather
T-storm Weather Summary Coolness continues over the next week in much of the central U.S., most likely producing the coldest April since 1907 in the Corn Belt, but followed by seasonable to mild weather
1 What Is Climate? TAKE A LOOK 2. Explain Why do areas near the equator tend to have high temperatures?
 CHAPTER 17 1 What Is Climate? SECTION Climate BEFORE YOU READ After you read this section, you should be able to answer these questions: What is climate? What factors affect climate? How do climates differ
TEXAS WILDLAND FIRE POTENTIAL WINTER/SPRING 2018/2019
 TEXAS WILDLAND FIRE POTENTIAL WINTER/SPRING 2018/2019 Texas A&M Forest Service Predictive Services Prepared December 12 th 2018 Brad Smith Luke Kanclerz Scott Breit Tom Spencer Mike Dunivan 2 Fire Potential
The Pennsylvania Observer
 The Pennsylvania Observer June 2, 2010 May 2010 Pennsylvania Weather Recap This month completed one of the warmest springs on record in Pennsylvania. With about 75% of the days averaging above normal,
January 2006 Climate Summary
 Ashley Brooks (765) 494-6574 Feb 9, 2006 http://www.iclimate.org January 1-3 January 2006 Climate Summary Unseasonably warm conditions welcomed in the New Year with highs in the 40s across the northern
The hydrologic service area (HSA) for this office covers Central Kentucky and South Central Indiana.
 for this office covers Central Kentucky and South Central Indiana.") NWS Form E-5 (04-2006) NATIONAL OCEANIC AND ATMOSPHERIC ADMINISTRATION (PRES. BY NWS Instruction 10-924) NATIONAL WEATHER SERVICE MONTHLY REPORT OF HYDROLOGIC CONDITIONS HYDROLOGIC SERVICE AREA (HSA) Louisville
NWS Form E-5 (04-2006) NATIONAL OCEANIC AND ATMOSPHERIC ADMINISTRATION (PRES. BY NWS Instruction 10-924) NATIONAL WEATHER SERVICE MONTHLY REPORT OF HYDROLOGIC CONDITIONS HYDROLOGIC SERVICE AREA (HSA) Louisville
Central Ohio Air Quality End of Season Report. 111 Liberty Street, Suite 100 Columbus, OH Mid-Ohio Regional Planning Commission
 217 218 Central Ohio Air Quality End of Season Report 111 Liberty Street, Suite 1 9189-2834 1 Highest AQI Days 122 Nov. 217 Oct. 218 July 13 Columbus- Maple Canyon Dr. 11 July 14 London 11 May 25 New Albany
Flooding in Western North Carolina: Some Spatial, Hydrologic, and Seasonal Characteristics CAUTION!! Outline. Basic Flood Facts.
 Flooding in Western North Carolina: Some Spatial, Hydrologic, and Seasonal Characteristics J. Greg Dobson CAUTION!! National Environmental Modeling and Analysis Center RENCI at UNC-Asheville Engagement
The Pennsylvania Observer
 The Pennsylvania Observer April 2, 2009 March 2009 Pennsylvania Weather Recap Prepared by Curt Harpster For the month of March the saying, In like a lion and out like a lamb really fit the pattern quite
UNITED STATES AND SOUTH AMERICA SNAPSHOT REPORT Thursday, December 21, 2017
 T-storm Weather Summary A small but key corn and soybean area in western Argentina was wetter than expected overnight. T-storms affect varying areas of South America at varying times into January, but
The Pennsylvania Observer
 The Pennsylvania Observer August 3, 2015 July 2015 - Pennsylvania Weather Recap By: Arthur Person Although this seventh month of 2015 was fairly normal across Pennsylvania as a whole, the details reveal
The Climate of Haskell County
 The Climate of Haskell County Haskell County is part of the Hardwood Forest. The Hardwood Forest is characterized by its irregular landscape and the largest lake in Oklahoma, Lake Eufaula. Average annual
The hydrologic service area (HSA) for this office covers Central Kentucky and South Central Indiana.
 for this office covers Central Kentucky and South Central Indiana.") MONTH YEAR January 2011 February 15, 2011 X An X inside this box indicates that no flooding occurred within this hydrologic service area. January 2011 was drier than normal in all locations in the area.
MONTH YEAR January 2011 February 15, 2011 X An X inside this box indicates that no flooding occurred within this hydrologic service area. January 2011 was drier than normal in all locations in the area.
Minnesota s Climatic Conditions, Outlook, and Impacts on Agriculture. Today. 1. The weather and climate of 2017 to date
 Minnesota s Climatic Conditions, Outlook, and Impacts on Agriculture Kenny Blumenfeld, State Climatology Office Crop Insurance Conference, Sep 13, 2017 Today 1. The weather and climate of 2017 to date
What is insect forecasting, and why do it
 Insect Forecasting Programs: Objectives, and How to Properly Interpret the Data John Gavloski, Extension Entomologist, Manitoba Agriculture, Food and Rural Initiatives Carman, MB R0G 0J0 Email: jgavloski@gov.mb.ca
Winter CoCoRaHS:
 Winter 2017-2018 CoCoRaHS: Hello one and all, Here is your quarterly Colorado CoCoRaHS newsletter from your friendly state coordinator: Winter can be cold, and the short days can wear on us all. I ve been
CISA & CoCoRaHS Condition Monitoring Newsletter
 Page 1 of 10 Click this link to open the e-mail in a browser. Click here CISA & CoCoRaHS Condition Monitoring Newsletter Dear CoCoRaHS Observer, Summer is almost here, marked by kids and grandkids getting
UNITED STATES AND SOUTH AMERICA SNAPSHOT REPORT Wednesday, December 20, 2017
 T-storm Weather Summary T-storms affect all growing areas of South America at one time or another over the next two weeks, but abovenormal rainfall is only likely for corn and soybeans in southern Brazil
Current Climate Trends and Implications
 Current Climate Trends and Implications Dr. Mark Seeley Professor emeritus Department of Soil, Water, and Climate University of Minnesota St Paul, MN 55108 Crop Insurance Conference September 12, 2018
NIDIS Intermountain West Drought Early Warning System April 24, 2018
 NIDIS Intermountain West Drought Early Warning System April 24, 2018 Precipitation The images above use daily precipitation statistics from NWS COOP, CoCoRaHS, and CoAgMet stations. From top to bottom,
Weather and Climate 1. Elements of the weather
 Weather and Climate 1 affect = to have an effect on, influence, change altitude = the height of a place above the sea axis = the line around which an object rotates certain = special consist of = to be
SOUTHERN CLIMATE MONITOR
 SOUTHERN CLIMATE MONITOR MARCH 2011 VOLUME 1, ISSUE 3 IN THIS ISSUE: Page 2 to 4 Severe Thunderstorm Climatology in the SCIPP Region Page 4 Drought Update Page 5 Southern U.S. Precipitation Summary for
The Climate of Grady County
 The Climate of Grady County Grady County is part of the Central Great Plains, encompassing some of the best agricultural land in Oklahoma. Average annual precipitation ranges from about 33 inches in northern
Arizona Climate Summary May 2018 Summary of conditions for April 2018
 April 2018 Temperature and Precipitation Summary Arizona Climate Summary May 2018 Summary of conditions for April 2018 April 1 st 16 th : April was a very dry month across Arizona. Several low pressure
NIDIS Intermountain West Drought Early Warning System December 11, 2018
 NIDIS Drought and Water Assessment NIDIS Intermountain West Drought Early Warning System December 11, 2018 Precipitation The images above use daily precipitation statistics from NWS COOP, CoCoRaHS, and
The Climate of Kiowa County
 The Climate of Kiowa County Kiowa County is part of the Central Great Plains, encompassing some of the best agricultural land in Oklahoma. Average annual precipitation ranges from about 24 inches in northwestern
NATIONAL WEATHER SERVICE
 January 2016 February 9, 2016 This was a dry month across the HSA despite one large and several smaller snowfalls. Most locations ended up 1-2 inches below normal for the month. The driest locations at
CropCast Corn and Soybean Report Kenny Miller Friday, March 17, 2017
 Accumulated Rainfall (inches) Accumulated GDDs Temperature ( F)/Wind Speed (mph) Precipitation (inches) CropCast Corn and Soybean Report Kenny Miller Friday, March 17, 2017 Peoria, IL Regional Forecast
Highlights of the 2006 Water Year in Colorado
 Highlights of the 2006 Water Year in Colorado Nolan Doesken, State Climatologist Atmospheric Science Department Colorado State University http://ccc.atmos.colostate.edu Presented to 61 st Annual Meeting