Year 10 Unit G Revision Questions You can use a calculator on any question.
|
|
|
- Rudolf Hutchinson
- 5 years ago
- Views:
Transcription
 21, 36, 78, 45, 12, 19, 18, 17, 56, 60 c.) 1.9, 1.4, 1.3, 1.5, 1.4, 2.0, 1.1, 1.9, 1.2, 1.6, 2.3, 0.9 2.) The table below shows the favourite flavour of ice- cream of a group of students.")
 Draw a pie- chart for the data. 3.) The table below shows the number of legs that various chickens caught locally had. Number of legs 0 1 2 3 4 Frequency 7 11 16 1 1 a.")
1 Year 10 Unit G Revision Questions You can use a calculator on any question. 1.) Find the mode, median, mean, range and interquartile range of each of the following lists. a.) 11, 13, 13, 16, 16, 17, 19, 20, 24, 24, 24, 25, 30 b.) 21, 36, 78, 45, 12, 19, 18, 17, 56, 60 c.) 1.9, 1.4, 1.3, 1.5, 1.4, 2.0, 1.1, 1.9, 1.2, 1.6, 2.3, ) The table below shows the favourite flavour of ice- cream of a group of students. Flavour Frequency Vanilla 7 Chocolate 10 Strawberry 4 Orange 6 Lemon 1 Tree 2 a.) What is the modal flavor? b.) What percentage of the group chose strawberry flavor? c.) Draw a bar chart for the data. d.) Draw a pie- chart for the data. 3.) The table below shows the number of legs that various chickens caught locally had. Number of legs Frequency a.) Find the modal number of legs. b.) Find the median number of legs c.) Find the mean number of legs. d.) Find the range of the number of legs. e.) Find the interquartile range of the number of legs. 4.) The table below shows the distribution of the weight of some frogs. Weight (w g) 0 < w < w < w < w < w < w < w 250 Frequency a.) Calculate an estimate of the mean weight of the frogs. b.) Draw a cumulative frequency curve for the weight of the frogs. c.) Use your graph to calculate the median and interquartile range of the weight of the frogs. d.) Use your graph to estimate percentage of frogs that weighed more that 110g. e.) Draw a histogram for the data.
2 5.) The table below shows the time that it took a group of Year 10 students to annoy Mr. K from the start of the lesson. Time (t secs) 0 < t 5 5 < t < t < t < t < t < w 90 Number of students a.) Use the data given to calculate an estimate of the mean time. b.) Draw a histogram for the data in the table. c.) From your histogram estimate the number of people who took between 15 and 25 seconds to annoy Mr. Knowles. 6.) The table below shows the number of times that a frog cried each day over the course of 50 days. Number of times Frequency For the data given in the table, find the mean, median, mode, range and interquartile range. 7.) The cumulative frequency curve below shows the marks achieved by students in a French test. a.) How many students sat the test? b.) How many students scored between 20 and 30 marks? c.) Estimate the median mark in the test. d.) The French teacher decided that 80% of those who sat the test should pass the test. What does this mean the pass mark for the test should be?
 Calculate an estimate of the mean age of the girls. c.) Valeria says that to find the mean of all the people in the school you only need to add the answers to (a.) and (b.")
3 8.) A dance school has the following numbers of students. Ages 5 10 Ages Ages Ages 17+ Boys Girls a.) Calculate an estimate of the mean age of the boys. b.) Calculate an estimate of the mean age of the girls. c.) Valeria says that to find the mean of all the people in the school you only need to add the answers to (a.) and (b.) together and divide by 2. Is Valeria correct? You must explain your answer. 9.) A class of 14 students sat an English test. The teacher said that if the mean score is at least 60 marks there will be a party. Thirteen students sit the test and get an average mark of 58. How much will the fourteenth student have to get in the test so that the class can have the party? 10.) A football team has 8 English and 3 Scottish players. The mean height of the English players is 1.85m and the mean height of the Scottish players is 1.94m. What is the mean height of the whole team? 11.) The histogram below shows the height of some very small people. a.) How many people had a height less that 90cm? b.) Approximately how many people had a height between 85cm and 100cm?
 Five numbers have a range of 13, a median of 10, a mode of 10, a mean of 11.8 and the second largest number is 12. Find the five numbers. 14.")
 Draw a line graph for this data. (b.")
4 12.) Create frequency tables for the histograms shown in parts (a.) and (b.) a.) b.) 13.) Five numbers have a range of 13, a median of 10, a mode of 10, a mean of 11.8 and the second largest number is 12. Find the five numbers. 14.) The data below shows the temperature in a city every hour on a given day. Time 8am 9am 10am 11am 12pm 1pm 2pm 3pm 4pm Temperature 7ºC 9ºC 12ºC 14ºC 16ºC 17ºC 17ºC 15ºC 13ºC (a.) Draw a line graph for this data. (b.) Johnny looks at the weather app on his phone, for this city on that day, and it says the maximum temperature was 18ºC. Johnny then says that the data in the table above must be wrong. Is Johnny correct?

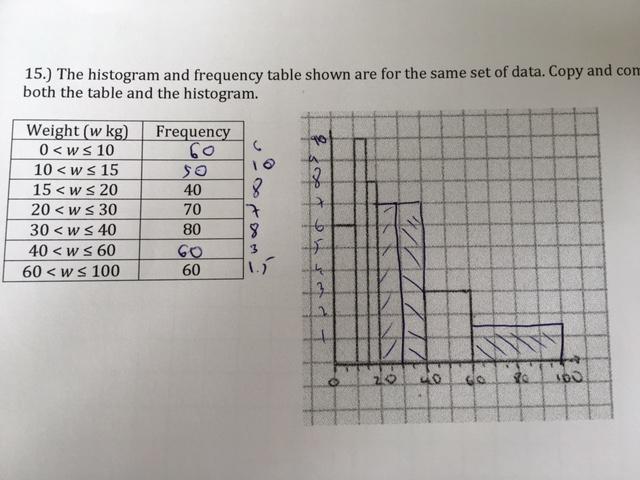
5 15.) The histogram and frequency table shown are for the same set of data. Copy and complete both the table and the histogram. Weight (w kg) Frequency 0 < w < w < w < w < w < w < w
 Mode = 24 Median = 19")


 Mode = 1.4 & 1.")

 d.")


 2 b.) 1.5 c.")
6 e.) ANSWERS!!! Ex. A 1a.) Mode = 24 Median = 19 Mean = 19.4 Range = 19 IQR = = 9.5 b.) Mode = No Mode! Median = 28.5 Mean = 36.2 Range = 66 IQR = 38 c.) Mode = 1.4 & 1.9 Median = 1.45 Mean = 1.54 Range = 1.4 IQR = a.) Chocolate b.) 13.3% c.) d.) Frequency Vanilla Chocolate Strawberry Orange Lemon Tree Flavour Lemon Tree Vanilla Orange Strawberry Chocolate 3a.) 2 b.) 1.5 c.) 1.39 d.) 4 e.) 1 4a.) g b.) c.) Median = 118 (approx.), IQR = 80 (approx.) d.) 57.6% (approx.)
 1.87m 11.) Weight (h cm) Frequency 65 < h 75 2 75 < h 80 7 80 < h 90 21 90 < h 105 15 105 < h 110 12 12a.) Weight (w kg) Frequency 0 < w 20 80 20 < w 30 30 30 < w 40 25 40 < w 80 20 b.")
7 5a.) 21.0 b.) c.) 29 6.) Mean = 5.36 Mode = 6 Median = 6 Range = 5 IQR = 2 7a.) 60 b.) 22 c.) 25 (approx.) d.) 14 (approx.) 8a.) 10.4 b.) 11.9 c.) No! There are more girls than boys, etc. 9.) ) 1.87m 11.) Weight (h cm) Frequency 65 < h < h < h < h < h a.) Weight (w kg) Frequency 0 < w < w < w < w b.) Weight (h cm) Frequency 100 < h < h < h < h < h ) 7, 10, 10, 112, 20 14a.) Temperature (ºC) am 9am 10am 11am 12pm 1pm 2pm 3pm 4pm Time b.) Data in table is only for every hour. Temperature could have been higher between 1pm and 2pm. Therefore Johnny is wrong.
8 15.)
Chapter 4 Statistics
 Chapter 4 Section 4.1The mean, mode, median and Range The idea of an average is extremely useful, because it enables you to compare one set of data with another set by comparing just two values their averages.
IB Questionbank Mathematical Studies 3rd edition. Grouped discrete. 184 min 183 marks
 IB Questionbank Mathematical Studies 3rd edition Grouped discrete 184 min 183 marks 1. The weights in kg, of 80 adult males, were collected and are summarized in the box and whisker plot shown below. Write
3, 8, 4, x, y and z. Find a value for each of x, y and z. [5]
![3, 8, 4, x, y and z. Find a value for each of x, y and z. [5]](/thumbs/87/96041667.jpg "3, 8, 4, x, y and z. Find a value for each of x, y and z. [5]") 9 (a) The number of people living in six houses is 3, 8, 4, x, y and z. The median is 7W. The mode is 8. The mean is 7. Find a value for each of x, y and z. [5] (b) The grouped frequency table below shows
9 (a) The number of people living in six houses is 3, 8, 4, x, y and z. The median is 7W. The mode is 8. The mean is 7. Find a value for each of x, y and z. [5] (b) The grouped frequency table below shows
Revision Topic 13: Statistics 1
 Revision Topic 13: Statistics 1 Averages There are three common types of average: the mean, median and mode. The mode (or modal value) is the data value (or values) that occurs the most often. The median
(a) Find the value of x. (4) Write down the standard deviation. (2) (Total 6 marks)
 Find the value of x. (4) Write down the standard deviation. (2) (Total 6 marks)") 1. The following frequency distribution of marks has mean 4.5. Mark 1 2 3 4 5 6 7 Frequency 2 4 6 9 x 9 4 Find the value of x. (4) Write down the standard deviation. (Total 6 marks) 2. The following table
1. The following frequency distribution of marks has mean 4.5. Mark 1 2 3 4 5 6 7 Frequency 2 4 6 9 x 9 4 Find the value of x. (4) Write down the standard deviation. (Total 6 marks) 2. The following table
Data 1 Assessment Calculator allowed for all questions
 Foundation Higher Data Assessment Calculator allowed for all questions MATHSWATCH All questions Time for the test: 45 minutes Name: Grade Title of clip Marks Score Percentage Clip 84 D Data collection
2. Mrs. Johnson asked her 6th-grade students to form a number pattern using these rules.
 6 th Grade Practice Test Objective 1.1 1. Dale used these steps to form a number pattern. 1. The first term is 3. 2. The second term is 5. 3. Each term after the second is the sum of the two terms just
Data 1 Assessment Calculator allowed for all questions
 Foundation Higher Data Assessment Calculator allowed for all questions MATHSWATCH All questions Time for the test: 4 minutes Name: MATHSWATCH ANSWERS Grade Title of clip Marks Score Percentage Clip 84
additionalmathematicsstatisticsadditi onalmathematicsstatisticsadditionalm athematicsstatisticsadditionalmathem aticsstatisticsadditionalmathematicsst
 additionalmathematicsstatisticsadditi onalmathematicsstatisticsadditionalm athematicsstatisticsadditionalmathem aticsstatisticsadditionalmathematicsst STATISTICS atisticsadditionalmathematicsstatistic
Number of fillings Frequency q 4 1. (a) Find the value of q. (2)
 Find the value of q. (2)") 1. The table below shows the frequency distribution of the number of dental fillings for a group of 25 children. Number of fillings 0 1 2 3 4 5 Frequency 4 3 8 q 4 1 Find the value of q. Use your graphic
1. The table below shows the frequency distribution of the number of dental fillings for a group of 25 children. Number of fillings 0 1 2 3 4 5 Frequency 4 3 8 q 4 1 Find the value of q. Use your graphic
Chapters 1 & 2 Exam Review
 Problems 1-3 refer to the following five boxplots. 1.) To which of the above boxplots does the following histogram correspond? (A) A (B) B (C) C (D) D (E) E 2.) To which of the above boxplots does the
Algebra 1. Statistics and the Number System Day 3
 Algebra 1 Statistics and the Number System Day 3 MAFS.912. N-RN.1.2 Which expression is equivalent to 5 m A. m 1 5 B. m 5 C. m 1 5 D. m 5 A MAFS.912. N-RN.1.2 Which expression is equivalent to 5 3 g A.
Topic 5: Statistics 5.3 Cumulative Frequency Paper 1
 Topic 5: Statistics 5.3 Cumulative Frequency Paper 1 1. The following is a cumulative frequency diagram for the time t, in minutes, taken by students to complete a task. Standard Level Write down the median.
Topic 2 Part 3 [189 marks]
![Topic 2 Part 3 [189 marks]](/thumbs/78/77156991.jpg "Topic 2 Part 3 [189 marks]") Topic 2 Part 3 [189 marks] The grades obtained by a group of 13 students are listed below. 5 3 6 5 7 3 2 6 4 6 6 6 4 1a. Write down the modal grade. Find the mean grade. 1b. Write down the standard deviation.
Topic 2 Part 3 [189 marks] The grades obtained by a group of 13 students are listed below. 5 3 6 5 7 3 2 6 4 6 6 6 4 1a. Write down the modal grade. Find the mean grade. 1b. Write down the standard deviation.
STRAND E: STATISTICS. UNIT E4 Measures of Variation: Text * * Contents. Section. E4.1 Cumulative Frequency. E4.2 Box and Whisker Plots
 STRAND E: STATISTICS E4 Measures of Variation Text Contents * * Section E4.1 E4.2 Box and Whisker Plots E4 Measures of Variation E4.1 * frequencies are useful if more detailed information is required about
Statistics Add Ins.notebook. November 22, Add ins
 Add ins We have LOADS of things we need to know for the IGCSE that you haven't learnt as part of the Bavarian Curriculum. We are now going to shoehorn in some of those topics and ideas. Nov 12 11:50 Main
1. For which of these would you use a histogram to show the data? (a) The number of letters for different areas in a postman s bag.
 The number of letters for different areas in a postman s bag.") Data Handling 1. For which of these would you use a histogram to show the data? (a) The number of letters for different areas in a postman s bag. (b) The height of competitors in an athletics meet. (c)
Data Handling 1. For which of these would you use a histogram to show the data? (a) The number of letters for different areas in a postman s bag. (b) The height of competitors in an athletics meet. (c)
Algebra Midyear Test What to Know
 Algebra Midyear Test What to Know All topics and problems are for BOTH Algebra 8 and Algebra 8R students unless otherwise noted. Thinking with Mathematical Models Make a table and a graph to represent
1. This pie chart shows how the children in Class 6 best like their potatoes cooked.
 1. This pie chart shows how the children in Class 6 best like their potatoes cooked. 32 children took part in the survey. Look at the four statements below. For each statement put a tick ( ) if it is correct.
IB MATH SL Test Review 2.1
 Name IB MATH SL Test Review 2.1 Date 1. A student measured the diameters of 80 snail shells. His results are shown in the following cumulative frequency graph. The lower quartile (LQ) is 14 mm and is marked
Mean, Median, Mode, Range
 For more awesome GCSE and A level resources, visit us at www.savemyexams.co.uk Mean Median Mode - Range Question Paper 2 Level IGCSE Subject Maths (0580) Exam Board Cambridge International Examinations
Lesson One Hundred and Sixty-One Normal Distribution for some Resolution
 STUDENT MANUAL ALGEBRA II / LESSON 161 Lesson One Hundred and Sixty-One Normal Distribution for some Resolution Today we re going to continue looking at data sets and how they can be represented in different
Review Packet for Test 8 - Statistics. Statistical Measures of Center: and. Statistical Measures of Variability: and.
 Name: Teacher: Date: Section: Review Packet for Test 8 - Statistics Part I: Measures of CENTER vs. Measures of VARIABILITY Statistical Measures of Center: and. Statistical Measures of Variability: and.
Descriptive Statistics and Probability Test Review Test on May 4/5
 Descriptive Statistics and Probability Test Review Test on May 4/5 1. The following frequency distribution of marks has mean 4.5. Mark 1 2 3 4 5 6 7 Frequency 2 4 6 9 x 9 4 Find the value of x. Write down
Foundations of Math 1 Review
 Foundations of Math 1 Review Due Wednesday 1/6/16. For each of the 23 questions you get COMPLETELY correct, you will receive a point on an extra assessment grade. **All regular credit must be completed
Data: the pieces of information that have been observed and recorded, from an experiment or a survey
 SESSION 13: STATISTICS KEY CONCEPTS: Collecting, organising and representing data Measures of central tendency Measures of dispersion X-PLANATION Data: the pieces of information that have been observed
STATISTICS. 1. Measures of Central Tendency
 STATISTICS 1. Measures o Central Tendency Mode, median and mean For a sample o discrete data, the mode is the observation, x with the highest requency,. 1 N F For grouped data in a cumulative requency
E9.2 Histograms, Bar Charts, Pictograms, Scatter Diagrams & Frequency Distributions
 E9.2 Histograms, Bar Charts, Pictograms, Scatter Diagrams & Frequency Distributions Question Paper Level IGCSE Subject Maths (0580) Exam Board Cambridge International Examinations (CIE) Level Core Topic
TeeJay Publishers General Homework for Book 3G Ch 12 - statistics. Statistics. Number of Women
 Statistics Homework Chapter 1 Eercise 1 1. This bar chart shows the popularity of TV Soaps indicated by a group of women. How many Eastenders fans were there? What was the most popular soap? What was the
Representations of Data - Edexcel Past Exam Questions
 Representations of Data - Edexcel Past Exam Questions 1. The number of caravans on Seaview caravan site on each night in August last year is summarised as follows: the least number of caravans was 10.
Mean, Mode, Median and Range. I know how to calculate the mean, mode, median and range.
 Starter 1) The small box has a volume of 24cm. The boxes are similar. Find the new volume of the box. 2 3cm 9cm 2 2) What is the turning point of the graph y = (x - 9) + 4 Today we are revising... How
Unit 1: Statistics and Probability (Calculator)
") Write your name here Surname Other names Pearson Edexcel GCSE Centre Number Candidate Number Mathematics B Unit 1: Statistics and Probability (Calculator) Monday 9 June 2014 Morning Time: 1 hour 15 minutes
Write your name here Surname Other names Pearson Edexcel GCSE Centre Number Candidate Number Mathematics B Unit 1: Statistics and Probability (Calculator) Monday 9 June 2014 Morning Time: 1 hour 15 minutes
Descriptive Statistics Class Practice [133 marks]
![Descriptive Statistics Class Practice [133 marks]](/thumbs/86/93966613.jpg "Descriptive Statistics Class Practice [133 marks]") Descriptive Statistics Class Practice [133 marks] The weekly wages (in dollars) of 80 employees are displayed in the cumulative frequency curve below. 1a. (i) (ii) Write down the median weekly wage. Find
Descriptive Statistics Class Practice [133 marks] The weekly wages (in dollars) of 80 employees are displayed in the cumulative frequency curve below. 1a. (i) (ii) Write down the median weekly wage. Find
IB Questionbank Mathematical Studies 3rd edition. Bivariate data. 179 min 172 marks
 IB Questionbank Mathematical Studies 3rd edition Bivariate data 179 min 17 marks 1. The heat output in thermal units from burning 1 kg of wood changes according to the wood s percentage moisture content.
Topic 2 Part 1 [195 marks]
![Topic 2 Part 1 [195 marks]](/thumbs/78/77157107.jpg "Topic 2 Part 1 [195 marks]") Topic 2 Part 1 [195 marks] The distribution of rainfall in a town over 80 days is displayed on the following box-and-whisker diagram. 1a. Write down the median rainfall. 1b. Write down the minimum rainfall.
Topic 2 Part 1 [195 marks] The distribution of rainfall in a town over 80 days is displayed on the following box-and-whisker diagram. 1a. Write down the median rainfall. 1b. Write down the minimum rainfall.
1. Consider the independent events A and B. Given that P(B) = 2P(A), and P(A B) = 0.52, find P(B). (Total 7 marks)
 = 2P(A), and P(A B) = 0.52, find P(B). (Total 7 marks)") 1. Consider the independent events A and B. Given that P(B) = 2P(A), and P(A B) = 0.52, find P(B). (Total 7 marks) 2. In a school of 88 boys, 32 study economics (E), 28 study history (H) and 39 do not
1. Consider the independent events A and B. Given that P(B) = 2P(A), and P(A B) = 0.52, find P(B). (Total 7 marks) 2. In a school of 88 boys, 32 study economics (E), 28 study history (H) and 39 do not
LC OL - Statistics. Types of Data
 LC OL - Statistics Types of Data Question 1 Characterise each of the following variables as numerical or categorical. In each case, list any three possible values for the variable. (i) Eye colours in a
Frequency and Histograms
 Warm Up Lesson Presentation Lesson Quiz Algebra 1 Create stem-and-leaf plots. Objectives Create frequency tables and histograms. Vocabulary stem-and-leaf plot frequency frequency table histogram cumulative
STAT 200 Chapter 1 Looking at Data - Distributions
 STAT 200 Chapter 1 Looking at Data - Distributions What is Statistics? Statistics is a science that involves the design of studies, data collection, summarizing and analyzing the data, interpreting the
Five people were asked approximately how many hours of TV they watched per week. Their responses were as follows.
 Exit icket Sample Solutions Five people were asked approximately how many hours of V they watched per week. heir responses were as follows. 1. Find the mean number of hours of V watched for these five
MEP Y7 Practice Book B
 8 Quantitative Data 8. Presentation In this section we look at how vertical line diagrams can be used to display discrete quantitative data. (Remember that discrete data can only take specific numerical
Grade Tennessee Middle/Junior High School Mathematics Competition 1
 Grade 7 008 Tennessee Middle/Junior High School Mathematics Competition. Which statement is always true? The greatest common factor of two prime numbers is. The greatest common factor of a prime and composite
(c) Plot the point ( x, y ) on your scatter diagram and label this point M. (d) Write down the product-moment correlation coefficient, r.
 Plot the point ( x, y ) on your scatter diagram and label this point M. (d) Write down the product-moment correlation coefficient, r.") 1. The heat output in thermal units from burning 1 kg of wood changes according to the wood s percentage moisture content. The moisture content and heat output of 10 blocks of the same type of wood each
1. The heat output in thermal units from burning 1 kg of wood changes according to the wood s percentage moisture content. The moisture content and heat output of 10 blocks of the same type of wood each
GRAIN SIZE ANALYSIS OF SEDIMENT
 GRAIN SIZE ANALYSIS OF SEDIMENT Purpose To determine the percentage by weight of each of the size fractions present in a sediment and then to use this information to make deductions about the parent rock,
2 a Ramesh is doing a survey to measure the time taken to solve a puzzle. He records the time taken in minutes.
 Cambridge Essentials Mathematics Core 9 S End-of-unit Test S End-of-unit Test Here are five numbers. Find the following. the mode 0 4 20 4 the median the mean the range 2 a Ramesh is doing a survey to
STATISTICS INDEX NUMBER
 NAME SCHOOL INDEX NUMBER DATE STATISTICS KCSE 1989 2012 Form 4 Mathematics Answer all the questions 1. 1989 Q12 P1 The table below shows the defective bolts from 40 samples No. of detective 0 1 2 3 4 5
[ ] Strand 1 of 5. 6 th Year Maths Ordinary Level. Topics: Statistics Probability
![[ ] Strand 1 of 5. 6 th Year Maths Ordinary Level. Topics: Statistics Probability](/thumbs/84/90998956.jpg "[ ] Strand 1 of 5. 6 th Year Maths Ordinary Level. Topics: Statistics Probability") 6 th Year Maths Ordinary Level Strand 1 of 5 [ ] Topics: Statistics Probability No part of this publication may be copied, reproduced or transmitted in any form or by any means, electronic, mechanical,
6 th Year Maths Ordinary Level Strand 1 of 5 [ ] Topics: Statistics Probability No part of this publication may be copied, reproduced or transmitted in any form or by any means, electronic, mechanical,
Determining the Spread of a Distribution Variance & Standard Deviation
 Determining the Spread of a Distribution Variance & Standard Deviation 1.3 Cathy Poliak, Ph.D. cathy@math.uh.edu Department of Mathematics University of Houston Lecture 3 Lecture 3 1 / 32 Outline 1 Describing
Statistics Revision Questions Nov 2016 [175 marks]
![Statistics Revision Questions Nov 2016 [175 marks]](/thumbs/89/100576925.jpg "Statistics Revision Questions Nov 2016 [175 marks]") Statistics Revision Questions Nov 2016 [175 marks] The distribution of rainfall in a town over 80 days is displayed on the following box-and-whisker diagram. 1a. Write down the median rainfall. 1b. Write
Statistics Revision Questions Nov 2016 [175 marks] The distribution of rainfall in a town over 80 days is displayed on the following box-and-whisker diagram. 1a. Write down the median rainfall. 1b. Write
Sem. 1 Review Ch. 1-3
 AP Stats Sem. 1 Review Ch. 1-3 Name 1. You measure the age, marital status and earned income of an SRS of 1463 women. The number and type of variables you have measured is a. 1463; all quantitative. b.
Cumulative Frequency & Frequency Density
 For more awesome GCSE and A level resources, visit us at www.savemyexams.co.uk Frequency & Frequency Density Diagrams Question Paper 2 Level IGCSE Subject Maths (0580) Exam Board Cambridge International
Review for the Algebra EOC
 Review for the Algebra EOC The test is Thursday, January 26 th, 2017 The answer key for this review booklet can be found at: www.mrshicklin.pbworks.com 1. A 1,500-gallon tank contains 200 gallons of water.
OCR Maths S1. Topic Questions from Papers. Representation of Data
 OCR Maths S1 Topic Questions from Papers Representation of Data PhysicsAndMathsTutor.com 12 The back-to-back stem-and-leaf diagram below shows the number of hours of television watched per week by each
Unit 2: Lesson 10 Measures of Spread Name:
 Unit 2: Lesson 10 Measures of Spread Name: Part 1: Mean Absolute Deviation (nice, but not the measure of spread we ll use ) The heights, in inches, of the players on a basketball team are given below.
Chapter 1:Descriptive statistics
 Slide 1.1 Chapter 1:Descriptive statistics Descriptive statistics summarises a mass of information. We may use graphical and/or numerical methods Examples of the former are the bar chart and XY chart,
General Certificate of Secondary Education Higher Tier June 2014
 Centre Number Surname Candidate Number For Examiner s Use Other Names Candidate Signature Examiner s Initials Pages Mark Mathematics General Certificate of Secondary Education Higher Tier June 2014 43601H
1 You may NOT use a calculator. 2 Full credit will be given only where the solution contains appropriate working. 3 Square-ruled paper is provided.
 X00/0 NATIONAL QUALIFICATIONS 008 TUESDAY, 0 MAY.00 PM.5 PM MATHEMATICS INTERMEDIATE Units, and Paper (Non-calculator) Read carefully You may NOT use a calculator. Full credit will be given only where
STRAND E: STATISTICS E2 Data Presentation
 STRAND E: STATISTICS E2 Data Presentation Text Contents * * Section E2.1 Pie Charts E2.2 Line Graphs E2.3 Stem and Leaf Plots E2.4 Graphs: Histograms E2 Data Presentation E2.1 Pie Charts Pie charts, which
Chapter 3. Data Description
 Chapter 3. Data Description Graphical Methods Pie chart It is used to display the percentage of the total number of measurements falling into each of the categories of the variable by partition a circle.
Instructions. Information. Advice
 Instructions Use black ink 7C or ball-point pen. Fill in the boxes at the top of this page with your name, centre number and candidate number. Answer all questions. Answer the questions in the spaces provided
1 Descriptive Statistics (solutions)
") 1 Descriptive Statistics (solutions) 1. Below is a list of test scores for a small class: 100, 98, 97, 94, 100, 90, 4 (a) What is the average test score x? Answer: 83.3 (b) What is the median test score
1 Descriptive Statistics (solutions) 1. Below is a list of test scores for a small class: 100, 98, 97, 94, 100, 90, 4 (a) What is the average test score x? Answer: 83.3 (b) What is the median test score
The Normal Distribution. Chapter 6
 + The Normal Distribution Chapter 6 + Applications of the Normal Distribution Section 6-2 + The Standard Normal Distribution and Practical Applications! We can convert any variable that in normally distributed
UNIT 5 ~ Probability: What Are the Chances? 1
 UNIT 5 ~ Probability: What Are the Chances? 1 6.1: Simulation Simulation: The of chance behavior, based on a that accurately reflects the phenomenon under consideration. (ex 1) Suppose we are interested
H2 Mathematics Probability ( )
") H2 Mathematics Probability (208 209) Practice Questions. For events A and B it is given that P(A) 0.7, P(B) 0. and P(A B 0 )0.8. Find (i) P(A \ B 0 ), [2] (ii) P(A [ B), [2] (iii) P(B 0 A). [2] For a third
H2 Mathematics Probability (208 209) Practice Questions. For events A and B it is given that P(A) 0.7, P(B) 0. and P(A B 0 )0.8. Find (i) P(A \ B 0 ), [2] (ii) P(A [ B), [2] (iii) P(B 0 A). [2] For a third
Determining the Spread of a Distribution
 Determining the Spread of a Distribution 1.3-1.5 Cathy Poliak, Ph.D. cathy@math.uh.edu Department of Mathematics University of Houston Lecture 3-2311 Lecture 3-2311 1 / 58 Outline 1 Describing Quantitative
Determining the Spread of a Distribution
 Determining the Spread of a Distribution 1.3-1.5 Cathy Poliak, Ph.D. cathy@math.uh.edu Department of Mathematics University of Houston Lecture 3-2311 Lecture 3-2311 1 / 58 Outline 1 Describing Quantitative
Percentile: Formula: To find the percentile rank of a score, x, out of a set of n scores, where x is included:
 AP Statistics Chapter 2 Notes 2.1 Describing Location in a Distribution Percentile: The pth percentile of a distribution is the value with p percent of the observations (If your test score places you in
Unit 1 Answers. 1.1 Two-way tables and bar charts. 1.2 Averages and range. KS3 Maths Progress Delta 1
 Unit 1 Answers 1.1 Two-way tables and bar charts 1 a, b, c, d mp3 mp4 Total Mahoud 17 12 29 Fahid 34 8 42 Total 51 20 71 2 a 3 b 8 dogs c fish d David s class b 40 students c e.g. Hockey; while fewer people
Foundation Mathematics. 9 March Examination Paper. Time: 2 hours
 Foundation Mathematics 9 March 06 Examination Paper Answer ALL questions. Clearly cross out surplus answers. Time: hours The maximum mark for this paper is 00. Any reference material brought into the examination
Chapter 6 Group Activity - SOLUTIONS
 Chapter 6 Group Activity - SOLUTIONS Group Activity Summarizing a Distribution 1. The following data are the number of credit hours taken by Math 105 students during a summer term. You will be analyzing
Paper 1. Mathematics test. Calculator not allowed. First name. Last name. School. Pupil number KEY STAGE TIER
 Ma KEY STAGE 3 TIER 5 7 2002 Mathematics test Paper 1 Calculator not allowed Please read this page, but do not open your booklet until your teacher tells you to start. Write your name and the name of your
Variables. Lecture 12 Sections Tue, Feb 3, Hampden-Sydney College. Displaying Distributions - Qualitative.
 Lecture 12 Sections 4.3.1-4.3.2 Hampden-Sydney College Tue, Feb 3, 2008 Outline 1 2 3 4 5 Exercise 4.2, p. 219 Determine whether the following variables are qualitative, quantitative discrete, or quantitative
CHAPTER 1 Univariate data
 Chapter Answers Page 1 of 17 CHAPTER 1 Univariate data Exercise 1A Types of data 1 Numerical a, b, c, g, h Categorical d, e, f, i, j, k, l, m 2 Discrete c, g Continuous a, b, h 3 C 4 C Exercise 1B Stem
(a) Calculate an estimate for the mean price paid for a new computer. (b) Calculate the value by the end of the third year.
 Calculate an estimate for the mean price paid for a new computer. (b) Calculate the value by the end of the third year.") Mean from grouped Freque Question 1 National curriculum reference: NA2e,3e,3j, HD4b Date: June 1999 Paper: 6 Ben asked 50 people how much they paid for a new computer. The results are shown in this frequency
Mean from grouped Freque Question 1 National curriculum reference: NA2e,3e,3j, HD4b Date: June 1999 Paper: 6 Ben asked 50 people how much they paid for a new computer. The results are shown in this frequency
A collection of 9-1 Maths GCSE Sample and Specimen questions from AQA, OCR, Pearson-Edexcel and WJEC Eduqas. Name: Total Marks:
 Scatter Graphs A collection of 9-1 Maths GCSE Sample and Specimen questions from AQA, OCR, Pearson-Edexcel and WJEC Eduqas. Name: Total Marks: 1. The graph shows the number of ice creams sold in a shop
SAMPLE. Casualties vs magnitude. Magnitude of Earthquakes
 Earthquakes are caused by shifting tectonic plates, the mosaic-like sections of the earth s surface. Different interactions between adjacent plates are responsible for mountain ranges, valleys, volcanoes,
Data Presentation. Naureen Ghani. May 4, 2018
 Data Presentation Naureen Ghani May 4, 2018 Data is only as good as how it is presented. How do you take hundreds or thousands of data points and create something a human can understand? This is a problem
Chapter2 Description of samples and populations. 2.1 Introduction.
 Chapter2 Description of samples and populations. 2.1 Introduction. Statistics=science of analyzing data. Information collected (data) is gathered in terms of variables (characteristics of a subject that
Paper 3 Unseen Topics
 Paper 3 Unseen Topics This is a collection of questions based on the topics that are so far UNSEEN or are usually more prominent Make sure you revise all topics as it is very likely topics from Paper 1
What is statistics? Statistics is the science of: Collecting information. Organizing and summarizing the information collected
 What is statistics? Statistics is the science of: Collecting information Organizing and summarizing the information collected Analyzing the information collected in order to draw conclusions Two types
85 Essential Questions at C to D. Grade C. Clip 102
 T) a) t + t b) t t c) 6y + w y d) 6y t e) e e f) m m g) 8 Essential Questions at C to D y y ( to are non-calculator) Clip 0 a) t b) 8t c) y + w d) 8yt or 8ty e) e f) m g) y h) y h) 6y y S) a) t + 8t b)
STRAND E: Data Analysis. UNIT E2 Data Presentation: Text. Contents. Section. E2.1 Pie Charts. E2.2 Line Graphs. E2.3 Stem and Leaf Plots
 STRAND E: Data Analysis E2 Data Presentation Text Contents Section E2.1 Pie Charts E2.2 Line Graphs E2.3 Stem and Leaf Plots E2.4 Graphs: Histograms E2. * Histograms with Unequal Class Intervals E2 Data
National 5 Portfolio Applications Standard Deviation and Scattergraphs
 National 5 Portfolio Applications 1.4 - Standard Deviation and Scattergraphs N5 Section A - Revision This section will help you revise previous learning which is required in this topic. R1 I can calculate
Example 2. Given the data below, complete the chart:
 Statistics 2035 Quiz 1 Solutions Example 1. 2 64 150 150 2 128 150 2 256 150 8 8 Example 2. Given the data below, complete the chart: 52.4, 68.1, 66.5, 75.0, 60.5, 78.8, 63.5, 48.9, 81.3 n=9 The data is
Mathematics A *P43380A0132* Pearson Edexcel GCSE P43380A. Paper 2 (Calculator) Foundation Tier. Friday 13 June 2014 Morning Time: 1 hour 45 minutes
 Foundation Tier. Friday 13 June 2014 Morning Time: 1 hour 45 minutes") Write your name here Surname Other names Pearson Edexcel GCSE Centre Number Mathematics A Paper 2 (Calculator) Friday 13 June 2014 Morning Time: 1 hour 45 minutes Candidate Number Foundation Tier Paper
Write your name here Surname Other names Pearson Edexcel GCSE Centre Number Mathematics A Paper 2 (Calculator) Friday 13 June 2014 Morning Time: 1 hour 45 minutes Candidate Number Foundation Tier Paper
Int Math 1 Statistic and Probability. Name:
 Name: Int Math 1 1. Juan wants to rent a house. He gathers data on many similar houses. The distance from the center of the city, x, and the monthly rent for each house, y, are shown in the scatter plot.
Number of people in family Frequency
 1) 40 students are asked about the number of people in their families. The table shows the results. Number of people in family 2 3 4 5 6 7 Frequency 1 1 17 12 6 3 (a) Find (i) the mode, (ii) the median,
Mathematics Achievement
 Section Mathematics Achievement 7 Questions Time: 0 minutes Each question is followed by four suggested answers. Read each question and then decide which one of the four suggested answers is best. Find
Topic 3: Introduction to Statistics. Algebra 1. Collecting Data. Table of Contents. Categorical or Quantitative? What is the Study of Statistics?!
 Topic 3: Introduction to Statistics Collecting Data We collect data through observation, surveys and experiments. We can collect two different types of data: Categorical Quantitative Algebra 1 Table of
Exploring and describing data
 10 Exploring and describing data Syllabus topic S1.2 Exploring and describing data arising from a single continuous variable This topic will develop your skills in calculating summary statistics for single
Mathematics. Thomas Whitham Sixth Form S J Cooper
 Mathematics Handling Data Revision Notes For Year 8 Thomas Whitham Sixth Form S J Cooper. Probability of a single event. Probability of two events 3. Statistics Qualitative data 4. Statistics Time series
D1-2 Data Presentation 1
 D1-2 Data Presentation 1 tables, picture graphs, bar graphs, dot plots, scatter graphs, line graphs and pie charts Pre-requisites: D1-1 (Introduction to Data) Estimated Time: 3 hours Summary Learn Solve
Review for Second Semester Final Exam DO NOT USE A CALCULATOR FOR THESE PROBLEMS
 Advanced Algebra nd SEMESTER FINAL Review for Second Semester Final Exam DO NOT USE A CALCULATOR FOR THESE PROBLEMS Name Period Date 1. For each quadratic function shown below: Find the equation of its
Slide 1. Slide 2. Slide 3. Pick a Brick. Daphne. 400 pts 200 pts 300 pts 500 pts 100 pts. 300 pts. 300 pts 400 pts 100 pts 400 pts.
 Slide 1 Slide 2 Daphne Phillip Kathy Slide 3 Pick a Brick 100 pts 200 pts 500 pts 300 pts 400 pts 200 pts 300 pts 500 pts 100 pts 300 pts 400 pts 100 pts 400 pts 100 pts 200 pts 500 pts 100 pts 400 pts
A C E. Answers Investigation 4. Applications
 Answers Applications 1. 1 student 2. You can use the histogram with 5-minute intervals to determine the number of students that spend at least 15 minutes traveling to school. To find the number of students,
1 Descriptive Statistics
 1 Descriptive Statistics 1. Below is a list of test scores for a small class: 100, 98, 97, 94, 100, 90, 4 (a) What is the average test score x? (b) What is the median test score m? 2. Bill Gates, the founder
Chapter 6 The Normal Distribution
 Chapter 6 The Normal PSY 395 Oswald Outline s and area The normal distribution The standard normal distribution Setting probable limits on a score/observation Measures related to 2 s and Area The idea
KS3 Revision work. Level 5
 KS3 Revision work Level 5 1. Frog spawn The graph shows the date each year that frogs eggs were first seen. 28th Feb 21st Feb Date eggs first seen 14th Feb 7th Feb 31st Jan 24th Jan 87 88 89 90 91 92 93
Chapter 2: Tools for Exploring Univariate Data
 Stats 11 (Fall 2004) Lecture Note Introduction to Statistical Methods for Business and Economics Instructor: Hongquan Xu Chapter 2: Tools for Exploring Univariate Data Section 2.1: Introduction What is
$ and det A = 14, find the possible values of p. 1. If A =! # Use your graph to answer parts (i) (iii) below, Working:
 (iii) below, Working:") & 2 p 3 1. If A =! # $ and det A = 14, find the possible values of p. % 4 p p" Use your graph to answer parts (i) (iii) below, (i) Find an estimate for the median score. (ii) Candidates who scored less
& 2 p 3 1. If A =! # $ and det A = 14, find the possible values of p. % 4 p p" Use your graph to answer parts (i) (iii) below, (i) Find an estimate for the median score. (ii) Candidates who scored less