HR Diagram Lab. Area 1 Area 4. Area 5. Area 2. Area 6 Area 3
|
|
|
- Bryan Stokes
- 5 years ago
- Views:
Transcription
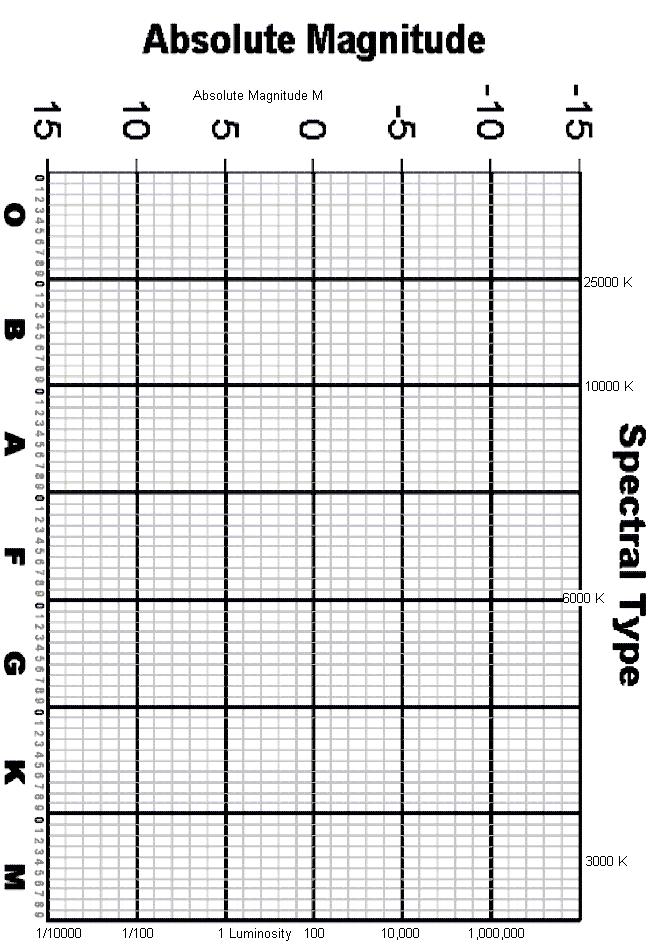
1 Name / 65 pts HR Diagram Lab Introduction Some of the greatest advances concerning the nature of stars have come about by comparing their properties using graphs. In the early 1900 s, while studying the spectral classification work of the Harvard Observatory, Danish astronomer Ejnar Hertzsprung noticed some systematic differences among the spectra of reddish and orange stars that were related to their proper motions. A star s proper motion is how far it seems to move through the sky each year, relative to extremely distant background stars which don t appear to move. Be careful not to confuse proper motion (a star s actual movement through space) with parallax (due to the earth s orbit around the sun.) What Hertzsprung noticed is that distant stars with small proper motions had one type of spectrum, while nearby stars with large proper motions had a different type of spectrum, even though both sets of stars had the same overall color and surface temperature. Hertzsprung reasoned that the distant stars must be much brighter than the nearby stars. How could this be, if both sets of stars had the same surface temperature? The only explanation was that the distant stars must be much larger than the nearby stars. Hertzsprung had established a relationship between distance, brightness, and the radius or size of a star. Shortly after this breakthrough, Hertzsprung and American astronomer Henry N. Russell developed a graph comparing the absolute magnitude and spectral class (temperature) of stars. This diagram has been named the Hertzsprung-Russell (or HR) Diagram in their honor. The modern theory of stellar evolution is based on this diagram. On the HR diagram, the vertical axis represents stellar brightness in terms of either absolute magnitudes or luminosity (with the sun = 1 Luminosity unit, L). The horizontal axis represents stellar temperature in terms of either actual temperature in Kelvins or spectral class (OBAFGKM). Notice that the temperatures are plotted backwards from normal, with the highest temperatures on the left, coolest on the right. The following diagram shows four of the most interesting regions in which stars are found. Stellar properties tend to cluster in certain regions, rather than being random. This tells us that a relationship between brightness, temperature, and the stage of a star s life exists. The roughly diagonal strip running across the diagram is called the main sequence and contains most (about 90%) of the stars. Area 1 Area 4 Area 5 Area 2 Area 6 Area 3
2 Use the HR diagram sketch on the first page of the lab to answer the following questions: (1 pt each) 1. In which numbered area of the diagram are hot bright stars found? 2. In which numbered area are cool faint stars found? 3. Which area represents the red giants (not supergiants)? 4. Which area represents blue main-sequence stars? 5. Which area represents the approximate location of the sun, a G2 main sequence star? 6. Which area ( area 3 or area 6 ) represents hotter stars? 7. Which area ( area 3 or area 6 ) represents larger diameter stars? Both areas have the same luminosities. 8. Which area ( area 1 or area 4 ) represents hotter stars? 9. Which area ( area 1 or area 4 ) represents larger diameter stars? Both areas have the same luminosities. Procedure do the following on the attached HR diagram at the end of the lab, not the sketch on the previous page. The data in Table 1 represents the absolute magnitude (M) and the spectral class of 57 of the brightest stars in our sky. Table 2 represents the same data for 55 of the nearest stars. At the end of this lab is a copy of the HR diagram where you will plot the absolute magnitudes (M) vs. the spectral classes of these stars. Follow these directions (20 pts). A. Plot spectral class vs. M for both sets of data. It s not necessary to write down the names of the stars besides their dots. Use different colors or marks for the two different sets of data. B. Run a smooth diagonal band around the strip of stars that runs from top left to bottom right of the diagram. The band should contain the largest number of stars. Label this band Main Sequence. C. Circle the stars that cluster in the upper right corner, and label this region Red Giants and Supergiants. D. Along the bottom of the diagram, in the line just above the spectral class, use colored pencils or markers to shade in the appropriate color for each spectral class, or write in the name of the color. E. Be neat and accurate, because you will need to refer to this graph to answer some of the following questions.
3 Part 1 Read this paragraph before answering the questions!! The luminosity of a star is the total amount of energy the star radiates into space each second. The luminosity depends on how much surface area the star has and also on how much energy the star emits from each square meter of its surface. The radius of a star determines its surface area and the temperature determines how much energy it radiates. Therefore, if two stars have the same surface temperatures, but different luminosities, they must have different amounts of surface area, i.e. they differ in radius (size). Questions (1 pt each unless shown otherwise) 1. Compare the red supergiants on your diagram with the same temperature main sequence stars. Which group is brighter? ( red supergiants main sequence ) 2. Why are these stars brighter? 3. Compare the white dwarfs on your diagram with the same temperature main sequence stars. Which group is dimmer? ( white dwarfs main sequence ) 4. Why are these stars dimmer? 5. Which has more main sequence stars: the 100 brightest stars or the 100 closest stars? Circle one. 6. Why aren t there any white dwarfs among the 100 brightest stars? 7. Why don t most of the nearest stars have famous names? Read this paragraph before continuing!! The parallax method of measuring distances is only accurate out to about 1000 light years. For more distant stars, it s possible to estimate their distances by using the HR diagram. If the spectrum of a star can be measured, its spectral class and position on the HR diagram can be determined. This allows astronomers to estimate the star s absolute magnitude (M) and compare it to its apparent magnitude (m). The distance to the star can then be calculated using the distance modulus formula below. [(m M + 5) / 5] distance in parsecs = 10 distance in LY = parsecs x The distances to 6 stars were left out of Tables 1 & 2. Calculate the distances (in light years) to these 6 stars using the formulas above. Please show your calculations. (12 pts)
4 9. It s often difficult to accurately estimate the absolute magnitudes of K-class and M-class stars without closely examining their stellar spectra. Explain why. (Hint: Consider what types of K and M-class stars exist!) (2 pts) 10. Estimate the magnitude difference between the brightest K0 supergiant star and the dimmest main sequence K0 star. 11. Would a K0 supergiant or a K0 main sequence star be visible at a greater distance from the earth? 12. In the table below are observations for 3 stars as seen from earth. Use your HR diagram to determine the absolute magnitude (M) for each star. (3 pts) At a distance of 10 parsecs from a star, a star s apparent magnitude (m) would equal its absolute magnitude (M). At a distance closer than 10 pc, a star s apparent magnitude would be smaller (or more negative) than its absolute magnitude. Fill in the last space for each star in the chart. (3 pts) Star Spectral Class m M farther or closer than 10 pc? #1 M0 supergiant 7 #2 A0 white dwarf 7 #3 G0 main sequence Which star in question 12 is the farthest from earth? 14. The closest to earth? Part Determine the mean average absolute magnitude (M) for the 57 Brightest Stars. 16. Determine the mean average absolute magnitude (M) for the 55 Nearest Stars. 17. How much brighter is the average bright star compared to the average nearby star? Calculate the difference in magnitudes ( M) between question 16 question 15. Now, recall that a difference of each magnitude unit = a change in brightness of Take to the M power for the answer ^ M =. 18. How much fainter than the sun (M = +4.8) is the average nearby star? Show your calculation (similar to the calculation in question 17.) 19. How much brighter than the sun is the average bright star? Show your calculation (similar to the calculation in question 17.) 20. Take the square root of the answer to question 17. The inverse square law of light tells us that this answer is how many times farther away an average bright star would have to be than an average nearby star in order to appear equally bright. 21. Cube the result (x 3 ) of question 20. This result is an estimate of the volume of space which would contain the brightest stars if the volume of space which contains the nearest stars = 1 cubic unit.
5 22. If 55 stars similar to the nearest stars are contained in every 1 cubic unit of space, divide the number of brightest stars by the answer to question 21 to find out how many bright stars are contained in each 1 cubic unit of space. (Your answer should be very small, well under bright star per cubic unit. Show your work.) 23. Divide the number of nearest stars by the answer to question 22. This gives you the number of fainter, nearby-like stars per each one bright star. Show your calculation. 24. Assume that the average surface temperature for a typical bright star is 9000 K and the average surface temperature for a typical nearby star is 3000 K. Multiply each temperature by itself 4 times (temp 4 ). The Stefan- Boltzmann Law says that the luminosity of a star (energy given off per second per square meter of surface area) is proportional to the 4 th power of the star s surface temperature. Show your calculations. Divide the result for the bright star by the result for the nearby star. This is the ratio of how much energy is given off per square meter by a bright star compared to a nearby star. Show your calculation. (3 pts) 25. If you assume that a typical bright star has a radius 100X larger than the sun s radius, and a typical nearby star has a radius 1/10 th of the sun s radius, that means that a typical bright star is 1000X larger than a typical nearby star, and has a surface area 1,000,000 times greater. The total energy output of a star is equal to its luminosity x its surface area. Multiply the final answer to question 24 by 1,000,000. This is how much total energy is produced by a typical bright star compared to a typical nearby star. 26. If each bright star emits the energy in question 25 (compared to a fainter, nearby-like star), compare the relative importance of the bright stars to the fainter, nearby stars in terms of total energy emitted, by dividing the final result of question 25 by the result of question 23.
6 Table 1: 57 of the Brightest Stars plot these two columns Common Name Constellation m M Spectral Class Distance (LY) 1 Sirius Canis Major A0 9 2 Canopus Carina F0 3 Arcturus Bootes K Rigel Kentaurus Centaurus G2 4 5 Vega Lyra A Capella Auriga G Rigel Orion B Procyon Canis Minor F Betelgeuse Orion M Achernar Eridanus B Hadar (Agena) Centaurus B Altair Aquila A Acrux Crux B Aldebaran Taurus K Spica Virgo B Antares Scorpius B Pollux Gemini K Fomalhaut Piscis Austrinus A Deneb Cygnus A2 20 Mimosa Crux B Regulus Leo B Adhara Canis Major B Castor Gemini A Gacrux Crux M Shaula Scorpius B Bellatrix Orion B Al Nath Taurus B Miaplacidus Carina A Alnilam Orion B Al Nair Grus B Alnitak Orion O Regor (Al Suhail) Vela O Alioth Ursa Major A Kaus Australis Sagittarius B Mirphak (Al Genib) Perseus F Dubhe Ursa Major K0 37 Wezen Canis Major F Alkaid Ursa Major B Sargas Scorpius F Avior Carina K Menkalinan Auriga A Atria Trianguli Australis K Delta Velorum Vela A Alhena Gemini A Peacock Pavo B Polaris Ursa Minor F Mirzam Canis Major B Alphard Hydra K Algeiba Leo K Hamal Aries K Deneb Kaitos Cetus K Nunki Sagittarius B Merkent Centaurus K Saiph Orion B Alpheratz Andromeda B Kochab Ursa Minor K Algol Perseus B8 93 Magnitude Info: Hipparchos Catalog Distance Info: Observer's Handbook 2001, by The Royal Astronomical Society of Canada
7 Table 2: 55 of the Nearest Stars plot these two columns Common Name Hipparchos # m M Spectral Class Distance (LY) 1 Proxima Centauri M alpha-centauri B K Rigel Kentaurus G Barnard s Star M M Sirius A A0 9 7 Ross M alpha-eridani K M M Cygni A K Procyon K Cygni B K K K M alpha-indi K eta-ceti G M M Kapteyn s Star M M M M M M M M K M M K M M Eridani A K M Ophiuchi A K Altair A M M Wolf M M M M eta-draconis K M M M M K M M Wolf G Ophiuchi C K M Information from the website:
8
9
Astron 104 Laboratory #9 The H-R Diagram
 Name: Date: Section: Astron 104 Laboratory #9 The H-R Diagram Section 10.1, 10.5 If we know the temperature of a star (or its Spectral Type) and the stars intrinsic brightness (or luminosity), a great
Astron 104 Laboratory #8 The H-R Diagram
 Name: Date: Section: Astron 104 Laboratory #8 The H-R Diagram Section 10.1, 10.5 Introduction The Hertzsprung-Russell diagram, or H-R diagram for short, relates two fundamental properties of stars and
The Hertzsprung - Russell Diagram Laboratory 11
 The Hertzsprung - Russell Diagram Laboratory 11 Objective: In this laboratory a random sample of stars will be used to create a HR Diagram. From the diagram it will be determined which category certain
THE STARS. Information and contacts: -
 THE STARS G. Iafrate (a), M. Ramella (a) and V. Bologna (b) (a) INAF - Astronomical Observatory of Trieste (b) Istituto Comprensivo S. Giovanni Sc. Sec. di primo grado M. Codermatz" - Trieste Information
H-R Diagram Lab. Vocabulary:
 H-R Diagram Lab Vocabulary: luminosity: brightness dependent on a star s size; temperature and distance spectral class: classification of stars by their spectrum and luminosity magnitude: measure of the
The Hertzprung-Russell (HR) Diagram
 Diagram") Name: Partner(s): 1102 or 3311: Desk # Date: The Hertzprung-Russell (HR) Diagram Purpose Reproduce Hertzsprung s and Russell s simultaneous discovery Investigate the relationships between luminosity, mass,
Name: Partner(s): 1102 or 3311: Desk # Date: The Hertzprung-Russell (HR) Diagram Purpose Reproduce Hertzsprung s and Russell s simultaneous discovery Investigate the relationships between luminosity, mass,
Y Centauri A 6. Alpha O Centauri B 7. Alpha
 H-R Star Spectrum Lab The H-R diagram, as it s known for short, plots a star s luminosity its true brightness against its surface temperature in Kelvin. Are there patterns that emerge and what does this
Grid lines are drawn at every 15 degrees of declination, and every hour (= 15 degrees at the equator) of right ascension.
 of right ascension.") These sky maps were made using the freeware UNIX program "starchart", from Alan Paeth and Craig Counterman, with some postprocessing by Stuart Levy. You re free to use them however you wish. There are
These sky maps were made using the freeware UNIX program "starchart", from Alan Paeth and Craig Counterman, with some postprocessing by Stuart Levy. You re free to use them however you wish. There are
HOMEWORK - Chapter 17 The Stars
 Astronomy 20 HOMEWORK - Chapter 7 The Stars Use a calculator whenever necessary. For full credit, always show your work and explain how you got your answer in full, complete sentences on a separate sheet
Stars I. Distance and Magnitude. How Does One Measure Distance? Distances. Stellar Parallax. Distance Equation some examples!
 Stars I Distance and Magnitude Chapter 17 Why doesn t comparison work? Distances The nearest star (Alpha Centauri) is 40 trillion kilometers away(4 ly) Distance is one of the most important quantities
Vocabulary. Section Resources
 Section 26.2 26.2 Stars 1 FOCUS Objectives 26.2.1 Demonstrate how distance to a star is measured. 26.2.2 Classify stars according to chemical and physical properties. 26.2.3 Interpret the H-R diagram.
Stars. For Jupiter: M/Msun = 0.001
 Stars Stars are classified by spectral classes O,B,A,F,G,K,M Oh be a fine girl (or guy), kiss me! Key here is the effective temperature of the star (surface temperature) Difference in spectrum is due to
The light from the stars we see at night travel great distances to reach Earth. Other than the sun, Proxima Centauriis the next closest
 The light from the stars we see at night travel great distances to reach Earth. Other than the sun, Proxima Centauriis the next closest star. The light that we see from it takes over 4 yearsto reach our
Astronomy 210 Spring 2017: Quiz 5 Question Packet 1. can: 2. An electron moving between energy levels
 Permitted energy levels Astronomy 210 Spring 2017: Quiz 5 Question Packet 1 1. An electron in energy level 1 2 can: (A) only emit a photon. (B) only absorb a photon. (C) either emit, or absorb a photon.
Spectral Classification of Stars
 Department of Physics and Geology Spectral Classification of Stars Astronomy 1402 Part 1: Background Spectral Classification of Stars 1.1 Spectral Types: O, B, A, F, G, K, M On a dark, clear night far
Properties of Stars & H-R Diagram
 Properties of Stars & H-R Diagram What is a star? A cloud of gas, mainly hydrogen and helium The core is so hot/dense that nuclear fusion can occur. The fusion converts light nuclei (elements) into heavier
Hertzsprung-Russel Diagrams and Distance to Stars
 Chapter 10 Hertzsprung-Russel Diagrams and Distance to Stars 10.1 Purpose In this lab, we will explore how astronomer classify stars. This classificatin one way that can be used to determine the distance
Guiding Questions. Measuring Stars
 Measuring Stars Guiding Questions 1. How far away are the stars? 2. What is meant by a first-magnitude or second magnitude star? 3. Why are some stars red and others blue? 4. What are the stars made of?
Mass-Luminosity and Stellar Lifetimes WS
 Name Mass-Luminosity and Stellar Lifetimes WS The graph shows the Mass-Luminosity Relationship for main sequence stars. Use it to answer questions 1-3. 1) A star with a mass of 0.5 solar masses would be
How can we use an H-R diagram to know where a star is in its life cycle?
 How can we use an H-R diagram to know where a star is in its life cycle? Just like humans, stars go through a life cycle. Over the course of their lives, stars change in ways that make each stage different
Get ready for quiz # 5! Get out a ½ sheet and Calculator
 Get ready for quiz # 5! Get out a ½ sheet and Calculator The above image shows the solar eclipse earlier this month as covered and uncovered by several different solar observatories. The innermost image
Making and Using the Hertzsprung - Russell Diagram
 Making and Using the Hertzsprung - Russell Diagram Name The Hertzsprung-Russell Diagram is one of the main tools we use to organize data describing how stars evolve, ages of star clusters, masses of stars
5. A particular star has an angle of parallax of 0.2 arcsecond. What is the distance to this star? A) 50 pc B) 2 pc C) 5 pc D) 0.
 50 pc B) 2 pc C) 5 pc D) 0.") Name: Date: 1. How far away is the nearest star beyond the Sun, in parsecs? A) between 1 and 2 pc B) about 12 pc C) about 4 pc D) between 1/2 and 1 pc 2. Parallax of a nearby star is used to estimate its
Name: Date: 1. How far away is the nearest star beyond the Sun, in parsecs? A) between 1 and 2 pc B) about 12 pc C) about 4 pc D) between 1/2 and 1 pc 2. Parallax of a nearby star is used to estimate its
ClassAction: Stellar Properties Module Instructor s Manual
 ClassAction: Stellar Properties Module Instructor s Manual Table of Contents Section 1: Warm-up Questions...3 Temperature and Color.....4 Section 2: General Questions.....5 Apparent Magnitude and Brightness....6
Lecture Outlines. Chapter 17. Astronomy Today 8th Edition Chaisson/McMillan Pearson Education, Inc.
 Lecture Outlines Chapter 17 Astronomy Today 8th Edition Chaisson/McMillan Chapter 17 Measuring the Stars Units of Chapter 17 17.1 The Solar Neighborhood 17.2 Luminosity and Apparent Brightness 17.3 Stellar
Surveying the Milky Way
 Surveying the Milky Way How Astronomers Prepared a Detailed Map of the Nearby Regions of Space By the 1920 s Primary References: Astronomy:The Evolving Universe, Michael Zeilik, Second Edition, Harper
Atlantis Challenger Columbia. Discovery Endeavour Enterprise
 T1 T2 T3 T4 T5 SCORE: 150 / 150 + Bonus 2 KEY: Alternative, acceptable answers are given in brackets Bonus: Name NASA s 6 space shuttles 1 bonus point per 3 correct answers. (2 pts total) Atlantis Challenger
Measuring stellar distances.
 Measuring stellar distances This method can be used to measure distances up to 100pc Some new technology allows measuring distances up to 200pc using this method p= 1/d Stellar Parallax.htm This method
STAR PROPERTIES. How Many Stars in Leo? How Many Stars in Orion? How Many Stars in Ursa Major? How Many Stars in Gemini? 4/30/15.
 4/30/15 Contela7ons STAR PROPERTIES How Many Stars in Orion? 25 8 100 >1,000,000 50 21 100 >1,000,000 Scorpius Canis Minor Canis Major Leo How Many Stars in Leo? 25 16 100 >1,000,000 How Many Stars in
A1101, Lab 5: The Hertzsprung- Russell Diagram Laboratory Worksheet
 Student Name: Lab TA Name: A1101, Lab 5: The Hertzsprung- Russell Diagram Laboratory Worksheet One of the most basic physical properties of a star is its luminosity, the rate at which it radiates energy
Bows Microsoft Intern Game 2013 Author: Christine Moeller (cmoeller)
") Bows Microsoft Intern Game 2013 Author: Christine Moeller (cmoeller) Construction: Christine Moeller, Jon Caruana, Greg Filpus, Andy Rich, Alex MacGregor, Travis Snoozy On-site Staff: Emily Egeland, Ross
Bows Microsoft Intern Game 2013 Author: Christine Moeller (cmoeller) Construction: Christine Moeller, Jon Caruana, Greg Filpus, Andy Rich, Alex MacGregor, Travis Snoozy On-site Staff: Emily Egeland, Ross
Ohio University - Lancaster Campus slide 1 of 47 Spring 2009 PSC 100. A star s color, temperature, size, brightness and distance are all related!
 Ohio University - Lancaster Campus slide 1 of 47 A star s color, temperature, size, brightness and distance are all related! Ohio University - Lancaster Campus slide 2 of 47 The Beginnings Late 1800 s,
Calculating Main Sequence Lifetimes
 Calculating Main Sequence ifetimes At the beginning of the twentieth century two astronomers, the Danish E. Hertzsprung and the American H. N. Russell, established a correlation between two important stellar
Chapter 10 Stars. 10 Stars 1
 Chapter 10 Stars 10 Stars 1 Introduction Left to right: Double Cluster in Perseus, Albireo (top), alpha and beta Centauri (bottom), Betelguese, Polaris Without stars, the Universe would be dark. Stars
My God, it s full of stars! AST 248
 My God, it s full of stars! AST 248 N * The number of stars in the Galaxy N = N * f s f p n h f l f i f c L/T The Galaxy M31, the Andromeda Galaxy 2 million light years from Earth The Shape of the Galaxy
Basic Properties of the Stars
 Basic Properties of the Stars The Sun-centered model of the solar system laid out by Copernicus in De Revolutionibus (1543) made a very specific prediction: that the nearby stars should exhibit parallax
λ = 650 nm = c = m s 1 f =? c = fλ f = c λ = ( m s 1 ) ( m) = = Hz T = 1 f 4.
 ( m) = = Hz T = 1 f 4.") Chapter 13 Stars Section 13.1 Astronomical measurements Worked example: Try yourself 13.1.1 CALCULATING THE FREQUENCY AND PERIOD OF LIGHT The speed of light in a vacuum is approximately 3.0 10 8 m s 1.
Chapter 13 Stars Section 13.1 Astronomical measurements Worked example: Try yourself 13.1.1 CALCULATING THE FREQUENCY AND PERIOD OF LIGHT The speed of light in a vacuum is approximately 3.0 10 8 m s 1.
Using the Star Wheel Laboratory 2
 Objective: Using the Star Wheel Laboratory 2 This laboratory introduces the Star Wheel; which is a common tool used in backyard observing. This tool helps approximate the location of constellations and
AMATEUR OBSERVERS' SOCIETY INTRODUCTION TO ASTRONOMY OBSERVING PROGRAM
 AMATEUR OBSERVERS' SOCIETY INTRODUCTION TO ASTRONOMY OBSERVING PROGRAM Introduction When you go out at night to observe the sky, whether with the help of a telescope, a pair of binoculars, or simply using
COLOR MAGNITUDE DIAGRAMS
 COLOR MAGNITUDE DIAGRAMS What will you learn in this Lab? This lab will introduce you to Color-Magnitude, or Hertzsprung-Russell, Diagrams: one of the most useful diagnostic tools developed in 20 th century
Student Exploration: H-R Diagram
 Name: Date: Student Exploration: H-R Diagram Vocabulary: giant, H-R diagram, luminosity, main sequence, star, supergiant, white dwarf Prior Knowledge Questions (Do these BEFORE using the Gizmo.) 1. The
Pr P ope p rti t es s of o f St S a t rs
 Properties of Stars Distances Parallax ( Triangulation ): - observe object from two separate points - use orbit of the Earth (1 AU) - measure angular shift of object - angle depends on distance to object
Chapter 15: Surveying the Stars
 Chapter 15 Lecture Chapter 15: Surveying the Stars Surveying the Stars 15.1 Properties of Stars Our goals for learning: How do we measure stellar luminosities? How do we measure stellar temperatures? How
Properties of Stars. N. Sharp (REU/NOAO/AURA/NSF)
") Properties of Stars N. Sharp (REU/NOAO/AURA/NSF) What properties of the stars can we determine just from this image? Measuring Stars Measuring Stars Information you can get from 1 image: Position on the
Properties of Stars N. Sharp (REU/NOAO/AURA/NSF) What properties of the stars can we determine just from this image? Measuring Stars Measuring Stars Information you can get from 1 image: Position on the
LAB: Star Classification
 Name: LAB: Star Classification INTRODUCTION: Like most scientists, astronomers like to categorize the Universe around them, and stars are no exception. Here s how astronomers classify stars into different
a. Star A c. The two stars are the same distance b. Star B d. Not enough information
 Name: Astro 102 S17 Test 1 Multiple Choice Identify the choice that best completes the statement or answers the question. 1. Your test is Version A. Please fill in the circle for A for this question on
Homework 2 AST 301, Sections and 46850, Spring NAME Student EID Score: on last page. Due Tuesday, March 1, 2016
 Homework 2 AST 301, Sections 46845 and 46850, Spring 2016 NAME Student EID Score: on last page Due Tuesday, March 1, 2016 Questions A C should help you to understand the properties of light. Show your
Exploratorium Teacher Institute page 1 Linda S. Shore
 Exploratorium Teacher Institute page 1 Growing Up A Star This activity helps students understand and interpret the Hertzsprung Russell (HR) diagram a graphical representation of how stars evolve that is
The Cosmic Perspective. Surveying the Properties of Stars. Surveying the Stars. How do we measure stellar luminosities?
 Surveying the Stars Chapter 15 Lecture The Cosmic Perspective 15.1 Properties of Stars Our goals for learning: How do we measure stellar luminosities? How do we measure stellar temperatures? How do we
Stars, Galaxies & the Universe Announcements. Stars, Galaxies & the Universe Observing Highlights. Stars, Galaxies & the Universe Lecture Outline
 Stars, Galaxies & the Universe Announcements HW#3 due Tuesday (Tomorrow) at 3 pm Lab Observing Trip Tues (9/28) & Thurs (9/30) First Exam next Wed. (9/22) in class - will post review sheet, practice exam
Science Papercraft Natural Science Series Rotating Star Chart (section 1) 1. Align front pieces 1 and 2 2. Fold over the tabs and glue in place
 1. Align front pieces 1 and 2 2. Fold over the tabs and glue in place") Science Papercraft Natural Science Series Rotating Star Chart (section 1) front piece 1 Canon Science Papercraft Mini-book Natural Science Series Rotating Star Chart You can use this handy rotating star
Science Papercraft Natural Science Series Rotating Star Chart (section 1) front piece 1 Canon Science Papercraft Mini-book Natural Science Series Rotating Star Chart You can use this handy rotating star
StarTalk. Sanjay Yengul May "To know ourselves, we must know the stars."
 StarTalk Sanjay Yengul May 2016 "To know ourselves, we must know the stars." Twinkle Twinkle How many stars are there? How big are these stars? Picture of night sky What are they made of? Why do they shine?
Modern Astronomy Review #1
 Modern Astronomy Review #1 1. The red-shift of light from distant galaxies provides evidence that the universe is (1) shrinking, only (3) shrinking and expanding in a cyclic pattern (2) expanding, only
Lecture 10: The Hertzsprung-Russell Diagram Reading: Sections
 Lecture 10: The Hertzsprung-Russell Diagram Reading: Sections 19.7-19.8 Key Ideas The Hertzsprung-Russell (H-R) Diagram Plot of Luminosity vs. Temperature for stars Features: Main Sequence Giant & Supergiant
OTHER MOTIONS. Just so far away they appear to move very slowly
 OTHER MOTIONS The position of a nearby star changing over a year gives us parallax Stars can also move on their own Real motion, not just our point of view They are just balls of gas and are moving around
Astronomy 102 Lab: Distance to the Pleiades
 Name: Astronomy 102 Lab: Distance to the Pleiades Please bring your textbook to class. Use a pencil when plotting the points on the graphs. Pre-Lab Assignment: From the planetarium, you know the Pleiades
Star Search Game: Constructing a Hertzsprung-Russell Diagram Inspired by: Ian Christie (VSSEC); Activity created by: Nandita Bajaj
; Activity created by: Nandita Bajaj") Star Search Game: Constructing a Hertzsprung-Russell Diagram Inspired by: Ian Christie (VSSEC); Activity created by: Nandita Bajaj Introduction: Star Search is an online game developed by the Victorian
Star Search Game: Constructing a Hertzsprung-Russell Diagram Inspired by: Ian Christie (VSSEC); Activity created by: Nandita Bajaj Introduction: Star Search is an online game developed by the Victorian
18. Which graph best represents the relationship between the number of sunspots and the amount of magnetic activity in the Sun?
 1. Which star has a surface temperature most similar to the surface temperature of Alpha Centauri? A) Polaris B) Betelgeuse C) Procyon B D) Sirius 2. Giant stars have greater luminosity than our sun mainly
ASTR Look over Chapter 15. Good things to Know. Triangulation
 ASTR 1020 Look over Chapter 15 Good things to Know Triangulation Parallax Parsecs Absolute Visual Magnitude Distance Modulus Luminosity Balmer Lines Spectral Classes Hertzsprung-Russell (HR) diagram Main
GALAXIES AND STARS. 2. Which star has a higher luminosity and a lower temperature than the Sun? A Rigel B Barnard s Star C Alpha Centauri D Aldebaran
 GALAXIES AND STARS 1. Compared with our Sun, the star Betelgeuse is A smaller, hotter, and less luminous B smaller, cooler, and more luminous C larger, hotter, and less luminous D larger, cooler, and more
Hertzprung-Russel and colormagnitude. ASTR320 Wednesday January 31, 2018
 Hertzprung-Russel and colormagnitude diagrams ASTR320 Wednesday January 31, 2018 H-R diagram vs. Color- Magnitude Diagram (CMD) H-R diagram: Plot of Luminosity vs. Temperature CMD: Plot of magnitude vs.
Chapter 11 Surveying the Stars
 Chapter 11 Surveying the Stars Luminosity Luminosity: Rate of energy emitted by star every second. Apparent brightness (flux): Amount of energy passing through every second per unit area. Luninosity =
Daily Science 04/04/2017
 Daily Science 04/04/2017 Which statement best describes the difference between type A stars and type B stars as shown in the diagram? a. Type A stars burn for a shorter amount of time than type B stars.
A Brief Tour of the Universe Phil Lucht Rimrock Digital Technology, Salt Lake City, Utah last update: Feb 16, 2015
 A Brief Tour of the Universe Phil Lucht Rimrock Digital Technology, Salt Lake City, Utah 84103 last update: Feb 16, 2015 This informal document is just a collection of images from the website given below
Reading and Announcements. Read Chapters 9.5, 9.6, and 11.4 Quiz #4, Thursday, March 7 Homework #5 due Tuesday, March 19
 Reading and Announcements Read Chapters 9.5, 9.6, and 11.4 Quiz #4, Thursday, March 7 Homework #5 due Tuesday, March 19 Stars The stars are distant and unobtrusive, but bright and enduring as our fairest
Surveying the Stars. learning goals Properties of Stars Patterns Among Stars Star Clusters
 Surveying the Stars learning goals. Properties of Stars How do we measure stellar luminosities? How do we measure stellar temperatures? How do we measure stellar masses?.2 Patterns Among Stars What is
Distances to Stars. Important as determines actual brightness but hard to measure as stars are so far away
 SECTION II: Nature of Stars Astronomers measure properties of Stars Distance Mass Apparent Brightness Surface Temperature Radius Find that some are related Large Mass Large Absolute Brightness We will
Each star is born with a specific mass. This mass is the main factor in determining the star s brightness, temperature, expected lifetime, type of
 Each star is born with a specific mass. This mass is the main factor in determining the star s brightness, temperature, expected lifetime, type of death, and spectra. Stars are classified according to
Determining the Properties of the Stars
 Determining the Properties of the Stars This set of notes by Nick Strobel covers: The properties of stars--their distances, luminosities, compositions, velocities, masses, radii, and how we determine those
Chapter 15 Surveying the Stars Properties of Stars
 Chapter 15 Surveying the Stars 15.1 Properties of Stars Our goals for learning: How do we measure stellar luminosities? How do we measure stellar temperatures? How do we measure stellar masses? Luminosity:
OPEN CLUSTER PRELAB The first place to look for answers is in the lab script!
 NAME: 1. Define using complete sentences: Globular Cluster: OPEN CLUSTER PRELAB The first place to look for answers is in the lab script! Open Cluster: Main Sequence: Turnoff point: Answer the following
Chapter 15 Surveying the Stars
 Chapter 15 Surveying the Stars 15.1 Properties of Stars Our goals for learning How do we measure stellar luminosities? How do we measure stellar temperatures? How do we measure stellar masses? How do we
Sky Quest This event has 12 stations. Print in color, use as many sets as you need for the number of teams you have.
 Sky Quest 2012 This event has 12 stations. Print in color, use as many sets as you need for the number of teams you have. Student response sheet and answer key are at the end. Station 1- Planet Questions
Measuring the Stars. The measurement of distances The family of distance-measurement techniques used by astronomers to chart the universe is called
 Measuring the Stars How to measure: Distance Stellar motion Luminosity Temperature Size Evolutionary stage (H-R diagram) Cosmic distances Mass The measurement of distances The family of distance-measurement
Family of stars. Fred Sarazin Physics Department, Colorado School of Mines. PHGN324: Family of stars
 Family of stars Reminder: the stellar magnitude scale In the 1900 s, the magnitude scale was defined as follows: a difference of 5 in magnitude corresponds to a change of a factor 100 in brightness. Dm
Properties of Stars. For such huge objects, stars have comparatively simple properties when seen from a long way off
 Properties of Stars For such huge objects, stars have comparatively simple properties when seen from a long way off apparent magnitude distance and direction in space luminosity - absolute magnitude temperature
Stars III The Hertzsprung-Russell Diagram
 Stars III The Hertzsprung-Russell Diagram Attendance Quiz Are you here today? (a) yes Here! (b) no (c) here is such a 90 s concept Today s Topics (first half) Spectral sequence and spectral types Spectral
Chapter 15 Lecture. The Cosmic Perspective Seventh Edition. Surveying the Stars Pearson Education, Inc.
 Chapter 15 Lecture The Cosmic Perspective Seventh Edition Surveying the Stars 15.1 Properties of Stars Our goals for learning: How do we measure stellar luminosities? How do we measure stellar temperatures?
Measuring Radial & Tangential Velocity. Radial velocity measurement. Tangential velocity measurement. Measure the star s Doppler shift
 17. The Nature of the Stars Parallax reveals stellar distance Stellar distance reveals luminosity Luminosity reveals total energy production The stellar magnitude scale Surface temperature determines stellar
Star Magnitudes & Distances with Stellarium (Stellarium Exercise #2)
") Name Date Star Magnitudes & Distances with Stellarium (Stellarium Exercise #2) Millions of stars are scattered across the sky. Astronomers want to study these stars as carefully as possible. This means
Name Date Star Magnitudes & Distances with Stellarium (Stellarium Exercise #2) Millions of stars are scattered across the sky. Astronomers want to study these stars as carefully as possible. This means
Measuring Radial & Tangential Velocity. Radial velocity measurement. Tangential velocity measurement. Measure the star s Doppler shift
 17. The Nature of the Stars Parallax reveals stellar distance Stellar distance reveals luminosity Luminosity reveals total energy production The stellar magnitude scale Surface temperature determines stellar
Wednesday 21 June 2017 Morning
 Oxford Cambridge and RSA Wednesday 21 June 2017 Morning A2 GCE PHYSICS B (ADVANCING PHYSICS) G495/01 Field and Particle Pictures ADVANCE NOTICE Duration: 2 hours *6744539949* INSTRUCTIONS TO CANDIDATES
What do the Roman numerals mean and how do stars die
 What do the Roman numerals mean and how do stars die What is luminosity? Luminosity is the energy emitted from a star, or basically how bright it is compared to our Sun The higher the luminosity, the higher
Characteristics of Stars
 Characteristics of Stars This section explains how astronomers measure distances to stars. It also describes how stars are classified. Use Target Reading Skills As you read about stars, stop and write
Deducing Temperatures and Luminosities of Stars (and other objects ) Electromagnetic Fields. Sinusoidal Fields
 Electromagnetic Fields. Sinusoidal Fields") Deducing Temperatures and Luminosities of Stars (and other objects ) Review: Electromagnetic Radiation Gamma Rays X Rays Ultraviolet (UV) Visible Light Infrared (IR) Increasing energy Microwaves Radio
Deducing Temperatures and Luminosities of Stars (and other objects ) Review: Electromagnetic Radiation Gamma Rays X Rays Ultraviolet (UV) Visible Light Infrared (IR) Increasing energy Microwaves Radio
Seasons & Constellations
 Name Bell Date ACTIVITY: Seasons & Constellations Seasons & Constellations * During autumn, we see the constellation Orion in the dark early morning sky. In winter, we see Orion in the night sky. In summer,
ASTR-1020: Astronomy II Course Lecture Notes Section III
 ASTR-1020: Astronomy II Course Lecture Notes Section III Dr. Donald G. Luttermoser East Tennessee State University Edition 4.0 Abstract These class notes are designed for use of the instructor and students
The Distance Modulus. Absolute Magnitude. Chapter 9. Family of the Stars
 Foundations of Astronomy 13e Seeds Phys1403 Introductory Astronomy Instructor: Dr. Goderya Chapter 9 Family of the Stars Cengage Learning 016 Topics for Today s Class 1. Recap: Intrinsic Brightness a)
The Hertzsprung-Russell Diagram and Stellar Evolution
 The Hertzsprung-Russell Diagram and Stellar Evolution Names: The H-R Diagram and Stellar Properties Activity 1. In which corner of the diagram (upper right, upper left, lower right, or lower left) would
Lecture 14: Studying the stars. Astronomy 111 Monday October 16, 2017
 Lecture 14: Studying the stars Astronomy 111 Monday October 16, 2017 Reminders Homework #7 due Monday I will give a lecture on DES and LIGO tomorrow at 4pm in the Mitchell Institute Studying the stars
JSR Year: 2008 PX1511 & PX1512. Planetarium Notes
 Planetarium Notes Purpose I hope you ll find these notes and the visit to the Planetarium a help in identifying particular stars and features in the night sky. If you absorb some of the facts you ll be
Chapter 15 Surveying the Stars Pearson Education, Inc.
 Chapter 15 Surveying the Stars 15.1 Properties of Stars Our goals for learning: How do we measure stellar luminosities? How do we measure stellar temperatures? How do we measure stellar masses? 1. How
Chapter 8: The Family of Stars
 Chapter 8: The Family of Stars Motivation We already know how to determine a star s surface temperature chemical composition surface density In this chapter, we will learn how we can determine its distance
Parallax: Measuring the distance to Stars
 Measuring the Stars Parallax: Measuring the distance to Stars Use Earth s orbit as baseline Parallactic angle = 1/2 angular shift Distance from the Sun required for a star to have a parallactic angle of
Chapter 10 Measuring the Stars
 Chapter 10 Measuring the Stars Some of the topics included in this chapter Stellar parallax Distance to the stars Stellar motion Luminosity and apparent brightness of stars The magnitude scale Stellar
A Walk through the Southern Sky
 A Walk through the Southern Sky A Guide to Stars and Constellations and their Legends 2nd edition What star is that? Where is the Southern Cross? Who was Orion? A Walk through the Southern Sky is a beautiful
Write It! Students should be encouraged to do the Research and Explore station before attempting this one.
 Kesler Science Station Lab H-R Diagram Teacher Directions Explore It! I will spend much of my time at this station making sure that the students are doing the Celebrity H-R diagram correctly and not wasting
Galaxies and Stars. 3. Base your answer to the following question on The reaction below represents an energy-producing process.
 Galaxies and Stars 1. To an observer on Earth, the Sun appears brighter than the star Rigel because the Sun is A) hotter than Rigel B) more luminous than Rigel C) closer than Rigel D) larger than Rigel
1. Basic Properties of Stars
 1. Basic Properties of Stars This is the Sun during a total eclipse. The Sun, our closest star, is very much representative of the objects that we will study during this module, namely stars. Much of the
The star Proxima Centauri is about 100 million times farther away
 Section 25.1 25.1 Properties of Stars 1 FOCUS Section Objectives 25.1 Describe what astronomers can learn by studying star properties. 25.2 Explain how distance affects parallax. 25.3 List the factors