The Chicken or the Egg?
|
|
|
- Steven Caldwell
- 5 years ago
- Views:
Transcription


1 WHICH CAME FIRST? The Chicken or the Egg?
2 DO LONG-TERM VARIATIONS OF THE SUN DRIVE CLIMATE CHANGE? Some scientists claim that variations in the Sun s energy output, over periods of tens to hundreds of years, play a crucial role in causing changes in the Earth s climate. They base their claim on the undeniable fact that the Sun provides almost all of the energy that drives the climate system. They argue that if this is the case then surely small variations in the Sun s energy output should cause significant changes in the Earth s climate. Other scientists have disputed this claim, pointing out that the observed variation in the amount of electromagnetic (e.g. light) radiation received at the top of the Earth s atmosphere only amounts to ~ 0.1 %. They firmly believe that variations in the solar radiation of this size are far too small to produce any significant change in the Earth s climate. Those proposing that the Sun is the main driver of climate change shoot back and claim that these other scientists are being naive in believing that the Earth s climate can only be affected by variations in the Sun s output of electromagnetic radiation. They point out that the Sun has many properties that vary considerably on time scales of decades to centuries, such as variations in strength of the interplanetary solar magnetic field,..
3 Continued. changes in the amount of cosmic rays entering the Earth s atmosphere, variations in the amount of solar UV flux being absorbed in the Earth s stratosphere, and changes in the level of solar wind particles striking the Earth s polar regions. They claim that anyone of these phenomena could cause changes in the Earth s climate on decadal to centennial time scales. The scientists who deny that the Sun is a major player in climate change point out that there are no valid scientific models linking variations in these other properties of the Sun to climate change, and so on and on the argument goes. But what if, there is a third factor that no one has yet considered that not only drives the variations in solar activity that we see on the Sun but also drives the changes that we see in climate here on the Earth? In order to find this third factor we must first ask ourselves the question, Which came first, the chicken or the egg?

4 What I want you to do is consider three very important players. The first player is the Earth s climate system.

5 The second player is the Earth s Rotation.

6 The third player is the general level of solar activity on the Sun,..
7 which some believe is caused by the motion of the Sun about the centre-of-mass of the Solar System. Shown here is the position of the centre of the Sun (circles with dots) with respect to the centre-of-mass of the Solar System between 1878 and 1923.
8 Our initial task is to see if there is any link between two of our major players, the Earth s climate system and changes in the Earth s rotation rate, on time scales ranging from decades to centuries. In order to establish this link, we need to look at two major climate systems: # The North Atlantic Oscillation (NAO) # The Pacific Decadal Oscillation (PDO) The first climate system that we will look at is the NAO. This system is based on the pressure differential between Icelandic Lows and Subtropical Highs that are located in the North Atlantic Ocean. The next slide shows that the NAO can be in either a positive of negative phase.
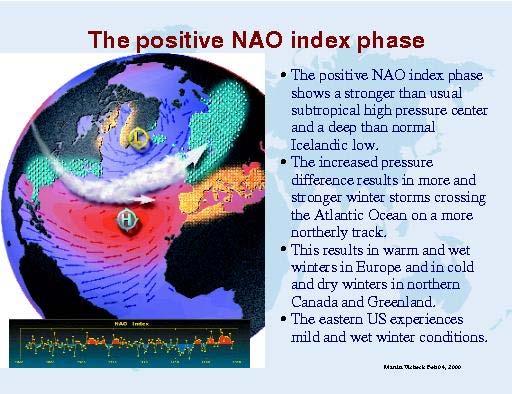
9
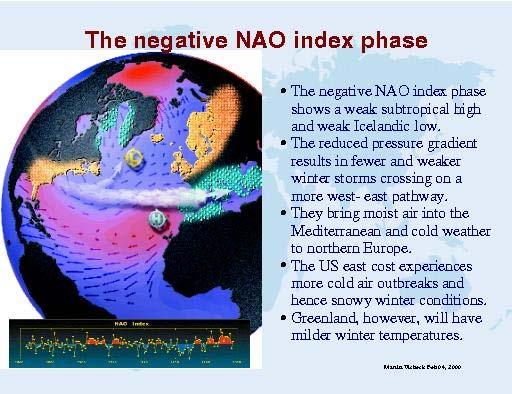
10
 index of the NAO based on the difference of normalized sea level pressure (SLP) between Lisbon, Portugal and Stykkisholmur / Reykjavik,")
11 The graph above shows the Winter (December through March) index of the NAO based on the difference of normalized sea level pressure (SLP) between Lisbon, Portugal and Stykkisholmur / Reykjavik, Iceland since The SLP anomalies at each station were normalized by division of each seasonal mean pressure by the long-term mean ( ) standard deviation. Normalization is used to avoid the series being dominated by the greater variability of the northern station. Positive values of the index indicate stronger-than-average westerlies over the middle latitudes. Red regions indicate times of positive NAO, while blue indicate times of negative NAO.
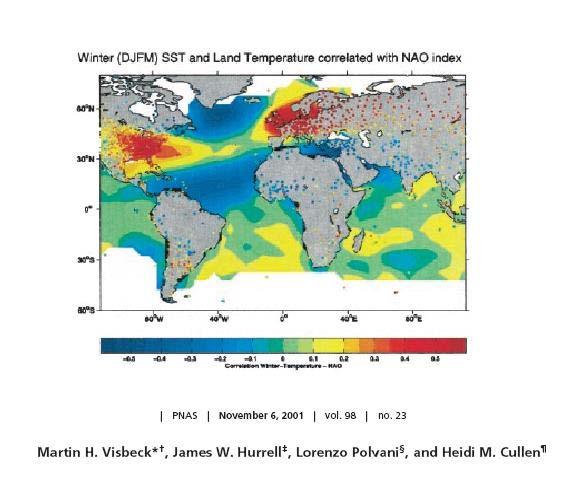
12 The following slide shows how sea and land temperatures correlate with the NAO index. Areas where there is a high correlation are shown in red, while the areas with a low correlation are shown in blue. It is immediately apparent from this slide that the NAO affects much of Western Europe as well as the eastern half of the populated areas of North America. This mean that the NAO plays a role in affecting the temperatures of close to a billion people, making it one of the worlds largest and most important climate systems. Not only does it have a major role in setting temperatures in Western Europe but it also significantly affects the levels of rainfall experienced in both Northern and Southern Europe.
13
14 The nominal time for the Earth to make one rotation is known as the length of day or LOD and it has a value of seconds. Measurements of the variation in the Earth's length-of-day (LOD) since 700 BC show that the changes in this parameter have two main components: The first is a steady increase in LOD by 2.3 milliseconds/century (ms/100y) caused by the combined gravitational force of the Sun and Moon acting upon the tidal bulge in the Earth's oceans (Stephenson 2003). The second is a steady decrease in the LOD by 0.6 ms/100y caused by the post-glacial isostatic compensation of the Earth's crust (Stephenson 2003). The isostatic compensation is produced by the steady rebounding of the Earth's polar crust following the removal of the great northern ice-sheets. The combined effects of these two components means that, on centennial to millennial timescales, the Earth s overall average LOD has been increasing by ~ 1.7 ms/100y.
15 The graph above shows the difference between the actual LOD and the nominal LOD value of seconds, measured in milliseconds, from 1656 to 2005 (Sidorenkov 2005). The raw data has been smoothed using a 15 year running mean. In addition, the vertical scale has been inverted so that up on the graph corresponds to an increase in the Earth s rotation rate. One thing that is immediately apparent is that LOD can vary by ~ few milliseconds over decadal timescales.
16 The question now becomes: Is there any connection between the observed changes NAO index and variations seen in the Earth s LOD? The winter NAO index is published by Dr. James Hurrell, NCAR/Climate and Global Dynamics Division (2007) at: The LOD data was kindly provided by Dr. N. Sidorenkov of the Hydrometcentre of the Russian Federation in Moscow.
.")
17 The top graph shows the time rate of change of the Earth s length of day (LOD) between 1865 and (Note: The LOD data has been transformed into arbitrary units so that it can be compared to the DJFM NAO index). Positive means that LOD of day is increasing compared to its standard value of seconds and that Earth is slowing down. The bottom graph shows the North Atlantic Oscillation Index between 1864 and The data points that are plotted in both graphs have been obtained by taking a five year running mean of the raw data.
18 The graph on the previous slide clearly shows that the NAO index correlates with the time rate of change of the Earth s LOD. The figure highlights the point that whenever the rate of change of the LOD is negative (i.e. the Earth's rotation rate is increasing) the NAO is positive and whenever rate of change of the LOD is positive (i.e. the Earth's rotation rate is decreasing) the NAO is negative. Hence, the winter NAO index is a good example of a climate system that is directly associated with changes in the Earth's rotation rate. Unfortunately, there is no way of determining whether it is the fluctuations in the Earth's rotation rate that determine the phases of the NAO or the other way around. The only conclusion that can be drawn from this data is that long term changes in the North Atlantic climate system has an effect upon, or is affected by, changes in the Earth's rotation rate. Thus, we can say that the NAO correlates with the rate of change of the Earth s rotation, however, we do not know which one affects the other. In other words, we are left with the quandary, which comes first, the chicken or the Egg?
19 The second climate system that we need to look at is the PDO

20 PACIFIC DECADAL OSCILLATION PDO POSITIVE PDO NEGATIVE The "Pacific Decadal Oscillation" (PDO) is a long-lived El Niño/La Niña-like pattern that is observed in the sea-surface temperatures (SST) of northern and central Pacific oceans. Positive (/negative) phases of the PDO are typified by warmer (/cooler) than normal temperatures in the north-eastern and tropical Pacific Ocean and cooler (/warmer) than normal temperatures in the region to the south-west of the Aleutian Islands. It is important to note that while the El Niño/La Niña oscillation varies on a time scale of 4 5 years, the PDO variations are governed by a time scale that is believed to be a combination of a 20 year and year pattern.
21 How has the PDO varied over the last 100 years? And what is its phase in 2008? See the next slide

22 The PDO has just flipped into a negative phase!
23 What could this mean for the World s mean temperature? PDO NEGATIVE?
")
24 AND HOW DOES THE PHASE OF THE PDO AFFECT THE INTENSITY OF EL NINOS? The Phase of the PDO from 1660 to 2000 AD Verdon and Franks (2006)
25 Hence, the PDO is a climate system that: Has the potential of possibility influencing the rate of warming and cooling of the world over the coming decades Appears to modulate the relative intensity of El Nino/La-Nina events a climate system that play a pivotal role in producing periods of droughts and floods here in Australia. So is the PDO correlated with changes in the Earth s rotation rate?
26 A first and a third order polynomial is fitted to the LOD curve to find the long term deviations in the Earth s rotation rate.
27 And the answer is an emphatic YES if you compare the long term deviations in the Earth s rotation rate with long term variations in the PDO (D Arrigo et al. 2001) See the next slide!
28 The upper graph shows the PDO reconstruction of D Arrigo et al. (2001) between 1707 and The reconstruction has been smoothed with a 15-year running mean filter to eliminate short-term fluctuations. Superimposed on this PDO reconstruction is the instrumental mean annual PDO index (Mantua 2007) which extends the PDO series up to the year The lower graph shows the absolute deviation of the Earth s LOD from 1656 to The data in this figure has also been smoothed with a 15-year running mean filter.
29 A comparison between the upper and lower graph in the previous slide shows that there is a remarkable agreement between the years of the peak (absolute) deviations of the LOD from the long-term trend and the years where the phase of the PDO reconstruction is most positive. While the correlation is not perfect, it is convincing enough to conclude the PDO index is another good example of a climate system that is directly associated with changes in the Earth's rotation rate. Our result confirms the work of Minobe (2001), who found a statistically significant correlation between the PPO (Pacific Pentadecdal Oscillation), a climate index that is a close variant of the PDO, and the Earth s LOD.
30 What is most important, however, is that the peaks in the absolute deviation of the Earth s rotation precede those of the PDO by an average of 6 8 years!! (look carefully at the two lower time scales in the previous graph) This means that it must be long-term variations in the Earth s rotation rate that are effecting the phase of the PDO, possibly through its influence upon the up welling of cold water in the North Pacific ocean. SO IT APPEARS THAT WE HAVE DETERMINED WHICH CAME FIRST WHEN IT COMES TO THE PDO AND CHANGES IN THE EARTH S ROTATION RATE But what cause the long-term changes in the Earth s rotation rate?
31 This is where we bring in our third player: The motion of the Sun about the centre-of-mass of the Solar System and its affect upon the level of solar activity.
32 Many people assume that the CM of the Solar System resides at the centre of the Sun. In fact, the Sun moves about the CM in a series of complex spirals, with the distance between the two varying from 0.01 and 2.19 solar radii (José 1965). This motion is the direct result of the gravitational forces of the Jovian planets tugging on the Sun. If Jupiter was the only outer giant (Jovian) planet in the Solar System, the Sun would move about the CM of the Solar System in a slightly elliptical orbit (e = 0.048) with a semi-major axis of 1.08 solar radii, and a period of years i.e. the Sun would revolve smoothly about a point located just above its surface. However, the Solar System has three additional Jovian planets. Their presence means that the Sun s motion about the CM is subject to periodic asymmetries in its motion that can be very abrupt. In order to highlight the abrupt asymmetries in the Sun s motion, we need to remove the relatively smooth, almost circular motion of the Sun about the CM that results from gravitational tugging by Jupiter.
33 The Sun in a reference frame that is rotating with the planet Jupiter. The perspective is the one you would see if you were near the Sun s pole. A unit circle is drawn on the left side of this figure to represent the Sun, using an x and y scales marked in solar radii. The position of the CM of the Solar System is also shown for the years 1780 to 1820 A.D. The path starts in the year 1780, with each successive year being marked off on the curve, as you move in a clockwise direction. This shows that the maximum asymmetry in the Sun s motion occurred roughly around
34 The previous slide shows the Sun in a reference frame that is rotating with the planet Jupiter. The perspective is the one you would see if you were near the Sun s pole. A unit circle is drawn on the left side of the figure to represent the Sun, using an x and y scales marked in solar radii. In this reference frame, the smooth motion of the Sun that results from Jupiter s gravitational influence is removed. This means that the centre-of-mass of the Sun/Jupiter system is a stationary point, located just above the Sun s right-hand surface on the x-axis at the co-ordinate (1.08, 0.00). We call this point the Sub-Jupiter point. Also shown in this figure, is the position of the centre-of-mass of the Solar System for the years 1780 to 1820 A.D. The path starts in the year 1780, with each successive year being marked off on the curve, as you move in a clockwise direction. The path of the CM of the Solar System about the Sun that is shown in this figure mirrors the typical motion of the Sun about the CM of the Solar System. This motion is caused by the combined gravitational influences of Saturn, Neptune, and to a lesser extent Uranus, tugging on the Sun. The motion of the CM shown in this figure repeats itself roughly once every 40 years. The timing and level of asymmetry of Sun s motion is set, respectively, by when and how close the path approaches the point (0.95, 0.0), just to the left of the Sub-Jupiter point. Hence, we can quantify the magnitude and timing of the Sun s asymmetric motion by measuring the distance of the CM from the point (0.95, 0.0).
35 This figure shows a plot of the distance of the centre-of-mass of the Solar System (in solar radii) from the point (0.95, 0.00) between 1650 and 2000 A.D. The distance scale is inverted so that the top of the peaks correspond to the times when the Sun s motion about the CM is most asymmetric.
36 So how do the asymmetries in the Sun s motion about the centre-of-mass of the Solar system compare to long-term deviations in the Earth s rotation rate? Hold onto your seat!
37
38 The reader can see for themselves that, from 1700 to 2000 A.D., on every occasion where the Sun has experienced a maximum in the asymmetry of its motion about the centre-of-mass of the Solar System, the Earth has also experienced a significant deviation in its rotation rate (i.e. LOD) from that expected from the long-term trends. This implies that changes in the Earth s rotation rate are being driven by a phenomenon that is external to the Earth that is somehow synchronized with the Sun s motion about the centre-of-mass of the Solar System. And, given that the peaks in the deviation of the longterm rotation rate of the Earth precede positive peaks in the PDO by ~ 6 8 years, it also saying that at least one major climate system here on Earth (i.e. the PDO) is also being driven externally. (Note: This means that the PDO, which is currently negative, should flip back to being positive in about , 6 to 8 years after maximum asymmetry in the solar motion in 2008)
39 So we have established that: A phenomenon external to the Earth that is synchronized with Sun s motion about the centre-of-mass of the Solar System Produces long-term deviations in the Earth s rotation rate That synchronizes the changes in phase of the PDO (and possibly the NAO) Which modulates the intensity of El Nino/La Nina phenomenon and possibly plays a major role in regulating the World s mean temperature
40 And what is this external phenomenon that that is driving the deviation in the Earth s rotation rate on decadal to centennial time scales? And why is it synchronized with the Sun s motion about the centre-of-mass of the Solar system? To get answers to this and more you will have to read my paper that will be published in Russian in early However, if you can t wait, the next four slides could provide important clues about the answers to these important questions.
41 One very important conclusion that follows from all of this is that if you believe the results of our paper: This paper claims that the level of solar activity on the Sun is governed by a spin orbit coupling mechanism between the rotation rate of the Sun and the orbital motion of the Jovian planets. If this is the case, then it is possible that the reason why the Earth s climate appears to affected by the level of solar activity may just be an illusion! WHAT DO YOU MEAN AN ILLUSION?
42 What my work implies is that there is NOT a strong direct link between variation in the level solar activity and the earth s mean temperature on decadal to centennial time scales. However, they both appear to go up and down together for the simple reason that they are both linked to same underlying cause: Orbital motion - Jovian planets Spin-orbit Coupling Solar rotation The level of solar activity Orbital motion - Jovian planets External phenomenon Earth s Rotation PDO Earth s mean temp. Such a model might explain why small changes in the energy output on the Sun appear to produce mysteriously amplified effects upon the World s mean temperature!
43
44
The North Atlantic Oscillation: Climatic Significance and Environmental Impact
 1 The North Atlantic Oscillation: Climatic Significance and Environmental Impact James W. Hurrell National Center for Atmospheric Research Climate and Global Dynamics Division, Climate Analysis Section
Are Changes in the Earth s Rotation Rate Externally Driven and Do They Affect Climate?
 Are Changes in the Earth s Rotation Rate Externally Driven and Do They Affect Climate? Ian R. G. Wilson Queensland Department of Education, Training and the Arts, Toowoomba, QLD, Australia, Email: irgeo8@bigpond.com
Climate Changes due to Natural Processes
 Climate Changes due to Natural Processes 2.6.2a Summarize natural processes that can and have affected global climate (particularly El Niño/La Niña, volcanic eruptions, sunspots, shifts in Earth's orbit,
THE PACIFIC DECADAL OSCILLATION (PDO)
") THE PACIFIC DECADAL OSCILLATION (PDO) The Pacific Decadal Oscillation (PDO) refers to cyclical variations in sea surface temperatures in the Pacific Ocean. A detailed summary of the PDO is given in D Aleo
THE PACIFIC DECADAL OSCILLATION (PDO) The Pacific Decadal Oscillation (PDO) refers to cyclical variations in sea surface temperatures in the Pacific Ocean. A detailed summary of the PDO is given in D Aleo
Here s what a weak El Nino usually brings to the nation with temperatures:
 Time again for my annual Winter Weather Outlook. Here's just a small part of the items I considered this year and how I think they will play out with our winter of 2018-2019. El Nino / La Nina: When looking
Global Weather Trade Winds etc.notebook February 17, 2017
 Global Weather 1 north pole northern hemisphere equator southern hemisphere south pole 2 We have seasons because of the Earth's tilt The seasons are opposite in the northern and southern hemispheres winter
Winter. Here s what a weak La Nina usually brings to the nation with tempseraures:
 2017-2018 Winter Time again for my annual Winter Weather Outlook. Here's just a small part of the items I considered this year and how I think they will play out with our winter of 2017-2018. El Nino /
Pacific Decadal Oscillation ( PDO ):
:") Time again for my annual Winter Weather Outlook. Here's just a small part of the items I considered this year and how I think they will play out with our winter of 2015-2016. El Nino / La Nina: When looking
Time again for my annual Winter Weather Outlook. Here's just a small part of the items I considered this year and how I think they will play out with our winter of 2015-2016. El Nino / La Nina: When looking
CLIMATE. SECTION 14.1 Defining Climate
 Date Period Name CLIMATE SECTION.1 Defining Climate In your textbook, read about climate and different types of climate data. Put a check ( ) next to the types of data that describe climate. 1. annual
Chapter outline. Reference 12/13/2016
 Chapter 2. observation CC EST 5103 Climate Change Science Rezaul Karim Environmental Science & Technology Jessore University of science & Technology Chapter outline Temperature in the instrumental record
El Niño / Southern Oscillation
 El Niño / Southern Oscillation Student Packet 2 Use contents of this packet as you feel appropriate. You are free to copy and use any of the material in this lesson plan. Packet Contents Introduction on
Climate. What is climate? STUDY GUIDE FOR CONTENT MASTERY. Name Class Date
 Climate SECTION 14.1 What is climate? In your textbook, read about climate and different types of climate data. Put a check ( ) next to the types of data that describe climate. 1. annual wind speed 4.
NOTES AND CORRESPONDENCE. El Niño Southern Oscillation and North Atlantic Oscillation Control of Climate in Puerto Rico
 2713 NOTES AND CORRESPONDENCE El Niño Southern Oscillation and North Atlantic Oscillation Control of Climate in Puerto Rico BJÖRN A. MALMGREN Department of Earth Sciences, University of Göteborg, Goteborg,
Major climate change triggers
 Major climate change triggers Variations in solar output Milankovitch cycles Elevation & distribution of continents Ocean interactions Atmospheric composition change (CO 2 and other volcanic gasses) Biological
The Effect of the North Atlantic Oscillation On Atlantic Hurricanes Michael Barak-NYAS-Mentors: Dr. Yochanan Kushnir, Jennifer Miller
 The Effect of the North Atlantic Oscillation On Atlantic Hurricanes Michael Barak-NYAS-Mentors: Dr. Yochanan Kushnir, Jennifer Miller Abstract Tropical cyclone behavior in the Gulf of Mexico (GM) and East
1 What Is Climate? TAKE A LOOK 2. Explain Why do areas near the equator tend to have high temperatures?
 CHAPTER 17 1 What Is Climate? SECTION Climate BEFORE YOU READ After you read this section, you should be able to answer these questions: What is climate? What factors affect climate? How do climates differ
Chapter 1 Section 2. Land, Water, and Climate
 Chapter 1 Section 2 Land, Water, and Climate Vocabulary 1. Landforms- natural features of the Earth s land surface 2. Elevation- height above sea level 3. Relief- changes in height 4. Core- most inner
Website Lecture 3 The Physical Environment Part 1
 Website http://websites.rcc.edu/halama Lecture 3 The Physical Environment Part 1 1 Lectures 3 & 4 1. Biogeochemical Cycling 2. Solar Radiation 3. The Atmosphere 4. The Global Ocean 5. Weather and Climate
Name: Date: Hour: Comparing the Effects of El Nino & La Nina on the Midwest (E4.2c)
") Purpose: Comparing the Effects of El Nino & La Nina on the Midwest (E4.2c) To compare the effects of El Nino and La Nina on the Midwest United States. Background Knowledge: The El Nino-Southern Oscillation
Purpose: Comparing the Effects of El Nino & La Nina on the Midwest (E4.2c) To compare the effects of El Nino and La Nina on the Midwest United States. Background Knowledge: The El Nino-Southern Oscillation
Topic 6: Insolation and the Seasons
 Topic 6: Insolation and the Seasons Solar Radiation and Insolation Insolation: In Sol ation The Sun is the primary source of energy for the earth. The rate at which energy is radiated is called Intensity
Extra-terrestrial Influences on Nature s Risks
 Extra-terrestrial Influences on Nature s Risks Brent Walker Session Number: WBR9 Gravitational Influences Phase Locks & Harmonic Resonances After billions of years of evolution the solar system is still
Please be ready for today by:
 Please be ready for today by: 1. HW out for a stamp 2. Paper and pencil/pen for notes 3. Be ready to discuss what you know about El Nino after you view the video clip What is El Nino? El Nino Basics El
Name Date Class. growth rings of trees, fossilized pollen, and ocean. in the northern hemisphere.
 Lesson Outline LESSON 2 A. Long-Term Cycles 1. A(n) climate cycle takes much longer than a lifetime to complete. a. To learn about long-term climate cycles, scientists study natural records, such as growth
Weather Atmospheric condition in one place during a limited period of time Climate Weather patterns that an area typically experiences over a long
 Weather Atmospheric condition in one place during a limited period of time Climate Weather patterns that an area typically experiences over a long period of time Many factors influence weather & climate
3. The diagram below shows the Moon at four positions in its orbit around Earth as viewed from above the North Pole.
 1. Which object orbits Earth in both the Earth-centered (geocentric) and Sun-centered (heliocentric) models of our solar system? (1) Polaris (3) the Sun (2) Venus (4) the Moon 2. A cycle of Moon phases
Climate and Environment
 Climate and Environment Oxygen Isotope Fractionation and Measuring Ancient Temperatures Oxygen Isotope Ratio Cycles Oxygen isotope ratio cycles are cyclical variations in the ratio of the mass of oxygen
1 What Is Climate? TAKE A LOOK 2. Explain Why do areas near the equator tend to have high temperatures?
 CHAPTER 17 1 What Is Climate? SECTION Climate BEFORE YOU READ After you read this section, you should be able to answer these questions: What is climate? What factors affect climate? How do climates differ
Global Temperature Is Continuing to Rise: A Primer on Climate Baseline Instability. G. Bothun and S. Ostrander Dept of Physics, University of Oregon
 Global Temperature Is Continuing to Rise: A Primer on Climate Baseline Instability G. Bothun and S. Ostrander Dept of Physics, University of Oregon The issue of whether or not humans are inducing significant
Fluid Circulation Review. Vocabulary. - Dark colored surfaces absorb more energy.
 Fluid Circulation Review Vocabulary Absorption - taking in energy as in radiation. For example, the ground will absorb the sun s radiation faster than the ocean water. Air pressure Albedo - Dark colored
World Geography Chapter 3
 World Geography Chapter 3 Section 1 A. Introduction a. Weather b. Climate c. Both weather and climate are influenced by i. direct sunlight. ii. iii. iv. the features of the earth s surface. B. The Greenhouse
11/24/09 OCN/ATM/ESS The Pacific Decadal Oscillation. What is the PDO? Causes of PDO Skepticism Other variability associated with PDO
 11/24/09 OCN/ATM/ESS 587.. The Pacific Decadal Oscillation What is the PDO? Causes of PDO Skepticism Other variability associated with PDO The Pacific Decadal Oscillation (PDO). (+) ( ) EOF 1 of SST (+)
1. Oceans. Example 2. oxygen.
 1. Oceans a) Basic facts: There are five oceans on earth, making up about 72% of the planet s surface and holding 97% of the hydrosphere. Oceans supply the planet with most of its oxygen, play a vital
Weather Atmospheric condition in one place during a limited period of time Climate Weather patterns that an area typically experiences over a long
 Weather Atmospheric condition in one place during a limited period of time Climate Weather patterns that an area typically experiences over a long period of time Many factors influence weather & climate
Environmental Science Chapter 13 Atmosphere and Climate Change Review
 Environmental Science Chapter 13 Atmosphere and Climate Change Review Multiple Choice Identify the choice that best completes the statement or answers the question. 1. Climate in a region is a. the long-term,
Lesson IV. TOPEX/Poseidon Measuring Currents from Space
 Lesson IV. TOPEX/Poseidon Measuring Currents from Space The goal of this unit is to explain in detail the various measurements taken by the TOPEX/Poseidon satellite. Keywords: ocean topography, geoid,
The Planetary Circulation System
 12 The Planetary Circulation System Learning Goals After studying this chapter, students should be able to: 1. describe and account for the global patterns of pressure, wind patterns and ocean currents
North Pacific Climate Overview N. Bond (UW/JISAO), J. Overland (NOAA/PMEL) Contact: Last updated: September 2008
, J. Overland (NOAA/PMEL) Contact: Last updated: September 2008") North Pacific Climate Overview N. Bond (UW/JISAO), J. Overland (NOAA/PMEL) Contact: Nicholas.Bond@noaa.gov Last updated: September 2008 Summary. The North Pacific atmosphere-ocean system from fall 2007
North Pacific Climate Overview N. Bond (UW/JISAO), J. Overland (NOAA/PMEL) Contact: Nicholas.Bond@noaa.gov Last updated: September 2008 Summary. The North Pacific atmosphere-ocean system from fall 2007
Name Period 4 th Six Weeks Notes 2013 Weather
 Name Period 4 th Six Weeks Notes 2013 Weather Radiation Convection Currents Winds Jet Streams Energy from the Sun reaches Earth as electromagnetic waves This energy fuels all life on Earth including the
Issue Overview: El Nino and La Nina
 Issue Overview: El Nino and La Nina By Bloomberg, adapted by Newsela staff on 09.28.16 Word Count 748 TOP: A Category 5 typhoon in the Pacific Ocean. BOTTOM: Graphics courtesy of the U.S. National Oceanic
Climate and the Atmosphere
 Climate and Biomes Climate Objectives: Understand how weather is affected by: 1. Variations in the amount of incoming solar radiation 2. The earth s annual path around the sun 3. The earth s daily rotation
Earth Science Lesson Plan Quarter 2, Week 6, Day 1
 Earth Science Lesson Plan Quarter 2, Week 6, Day 1 1 Outcomes for Today Standard Focus: Earth Sciences 5.f students know the interaction of wind patterns, ocean currents, and mountain ranges results in
Global Atmospheric Circulation
 Global Atmospheric Circulation Polar Climatology & Climate Variability Lecture 11 Nov. 22, 2010 Global Atmospheric Circulation Global Atmospheric Circulation Global Atmospheric Circulation The Polar Vortex
Weather & Ocean Currents
 Weather & Ocean Currents Earth is heated unevenly Causes: Earth is round Earth is tilted on an axis Earth s orbit is eliptical Effects: Convection = vertical circular currents caused by temperature differences
THE ATMOSPHERE IN MOTION
 Funding provided by NOAA Sectoral Applications Research Project THE ATMOSPHERE IN MOTION Basic Climatology Oklahoma Climatological Survey Factor 1: Our Energy Source Hi, I m the Sun! I provide 99.9999+
Rotation and Revolution
 On Earth, each day begins at sunrise and ends at sunset. You see the Sun come up or rise in the morning and go down or set at night. When we use these phrases, what do you think they imply about the way
The Failed Science of Global warming: Time to Re-consider Climate Change
 The Failed Science of Global warming: Time to Re-consider Climate Change Madhav Khandekar Expert Reviewer IPCC 2007 Climate Change IPCC vs NIPCC IPCC: Intergovernmental Panel on Climate Change; A UN Body
Meteorology B Wright State Invite Team Name Team # Student Members: &
 1 Meteorology B Team Name Team # Student Members: & Raw Score: / 126 Rank: Part I. Multiple Choice. Answer the following questions by selecting the best answer. 2 points each. 1. All of the following are
Global Climate Patterns and Their Impacts on North American Weather
 Global Climate Patterns and Their Impacts on North American Weather By Julie Malmberg and Jessica Lowrey, Western Water Assessment Introduction This article provides a broad overview of various climate
This clementine orange is an oblate spheroid. Earth is more rounded than this clementine, but it is still an oblate spheroid.
 On Earth, each day begins at sunrise and ends at sunset. You see the Sun come up or rise in the morning and go down or set at night. When we use these phrases, what do you think they imply about the way
Global Wind Patterns
 Name: Earth Science: Date: Period: Global Wind Patterns 1. Which factor causes global wind patterns? a. changes in the distance between Earth and the Moon b. unequal heating of Earth s surface by the Sun
Trends in the Character of Hurricanes and their Impact on Heavy Rainfall across the Carolinas
 Trends in the Character of Hurricanes and their Impact on Heavy Rainfall across the Carolinas Chip Konrad Carolina Integrated Science and Assessments (CISA) The Southeast Regional Climate Center Department
Wind: Global Systems Chapter 10
 Wind: Global Systems Chapter 10 General Circulation of the Atmosphere General circulation of the atmosphere describes average wind patterns and is useful for understanding climate Over the earth, incoming
What a Hurricane Needs to Develop
 Weather Weather is the current atmospheric conditions, such as air temperature, wind speed, wind direction, cloud cover, precipitation, relative humidity, air pressure, etc. 8.10B: global patterns of atmospheric
Lecture 8: Natural Climate Variability
 Lecture 8: Natural Climate Variability Extratropics: PNA, NAO, AM (aka. AO), SAM Tropics: MJO Coupled A-O Variability: ENSO Decadal Variability: PDO, AMO Unforced vs. Forced Variability We often distinguish
Ocean cycles and climate ENSO, PDO, AMO, AO
 Ocean cycles and climate ENSO, PDO, AMO, AO 3 2.5 2 enso-index 1.5 1 0.5 0-0.5-1 enso 3.4 -index - 1996 to 1999-1.5 1996 1997 1998 1999 Bob Tisdale Bob Tisdale Bob Tisdale ENSO mechanisms animation http://esminfo.prenhall.com/science/geoanimations/animations/26_ninonina.html
1990 Intergovernmental Panel on Climate Change Impacts Assessment
 1990 Intergovernmental Panel on Climate Change Impacts Assessment Although the variability of weather and associated shifts in the frequency and magnitude of climate events were not available from the
TROPICAL-EXTRATROPICAL INTERACTIONS
 Notes of the tutorial lectures for the Natural Sciences part by Alice Grimm Fourth lecture TROPICAL-EXTRATROPICAL INTERACTIONS Anomalous tropical SST Anomalous convection Anomalous latent heat source Anomalous
At it s most extreme very low pressure off Indonesia, every high off SA, ~8 o C difference over the Pacific and ½ m water level differential) ENSO is
 ENSO is") This summer : El Niño (ENSO) and the NAO (Ocean/Atmosphere coupling teleconnections) A teleconnection (as used in the atmospheric sciences) refers to climate anomalies that are related across very large
This summer : El Niño (ENSO) and the NAO (Ocean/Atmosphere coupling teleconnections) A teleconnection (as used in the atmospheric sciences) refers to climate anomalies that are related across very large
Figure 1. Carbon dioxide time series in the North Pacific Ocean (
 Evidence #1: Since 1950, Earth s atmosphere and oceans have changed. The amount of carbon released to the atmosphere has risen. Dissolved carbon in the ocean has also risen. More carbon has increased ocean
Impacts of Climate on the Corn Belt
 Impacts of Climate on the Corn Belt Great Lakes Crop Summit 2015 2015 Evelyn Browning Garriss Conclusions Climate change is not linear. It ebbs and flows. Recent polar volcano eruptions created a cool
What is Climate? Understanding and predicting climatic changes are the basic goals of climatology.
 What is Climate? Understanding and predicting climatic changes are the basic goals of climatology. Climatology is the study of Earth s climate and the factors that affect past, present, and future climatic
AMOC Impacts on Climate
 AMOC Impacts on Climate Rong Zhang GFDL/NOAA, Princeton, NJ, USA Paleo-AMOC Workshop, Boulder, CO, USA May 24, 2016 Atlantic Meridional Overturning Circulation (AMOC) Kuklbrodt et al. 2007 McManus et al.,
Space Atmospheric Gases. the two most common gases; found throughout all the layers a form of oxygen found in the stratosphere
 Earth s atmospheric layers Earth s atmosphere is the layer of gases that surrounds the planet and makes conditions on Earth suitable for living things. Layers Earth s atmosphere is divided into several
4.3 Climate (6.3.3) Explore this Phenomena. The same sun shines on the entire Earth. Explain why these two areas have such different climates.
 Explore this Phenomena. The same sun shines on the entire Earth. Explain why these two areas have such different climates.") Explore this Phenomena The same sun shines on the entire Earth. 4.3 Climate (6.3.3) Explain why these two areas have such different climates. 89 6.3.3 Climate Develop and use a model to show how unequal
Explore this Phenomena The same sun shines on the entire Earth. 4.3 Climate (6.3.3) Explain why these two areas have such different climates. 89 6.3.3 Climate Develop and use a model to show how unequal
according to and water. High atmospheric pressure - Cold dry air is other air so it remains close to the earth, giving weather.
 EARTH'S ATMOSPHERE Composition of the atmosphere - Earth's atmosphere consists of nitrogen ( %), oxygen ( %), small amounts of carbon dioxide, methane, argon, krypton, ozone, neon and other gases such
Forum on Climate Change Noosa, July 2015 Exposing the myths of climate change
 Forum on Climate Change Noosa, July 2015 Exposing the myths of climate change Des Moore My thesis today is that there is minimal risk that temperatures will become dangerously high if there is continued
Match (one-to-one) the following (1 5) from the list (A E) below.
 the following (1 5) from the list (A E) below.") GEO 302C EXAM 1 Spring 2009 Name UID You may not refer to any other materials during the exam. For each question (except otherwise explicitly stated), select the best answer for that question. Read all
GEO 302C EXAM 1 Spring 2009 Name UID You may not refer to any other materials during the exam. For each question (except otherwise explicitly stated), select the best answer for that question. Read all
Changing Climate and Increased Volatility What it Means for the Energy Sector in the Future April 3, 2014 Jeff Johnson, Chief Science Officer
 Changing Climate and Increased Volatility What it Means for the Energy Sector in the Future April 3, 2014 Jeff Johnson, Chief Science Officer There is no doubt that the climate has changed, and it will
astronomy A planet was viewed from Earth for several hours. The diagrams below represent the appearance of the planet at four different times.
 astronomy 2008 1. A planet was viewed from Earth for several hours. The diagrams below represent the appearance of the planet at four different times. 5. If the distance between the Earth and the Sun were
An ENSO-Neutral Winter
 An ENSO-Neutral Winter This issue of the Blue Water Outlook newsletter is devoted towards my thoughts on the long range outlook for winter. You will see that I take a comprehensive approach to this outlook
MAR110 LECTURE #22 Climate Change
 MAR 110: Lecture 22 Outline Climate Change 1 MAR110 LECTURE #22 Climate Change Climate Change Diagnostics Drought and flooding represent just a couple of hazards related to climate variability (O) The
Deke Arndt, Chief, Climate Monitoring Branch, NOAA s National Climatic Data Center
 Thomas R. Karl, L.H.D., Director, NOAA s National Climatic Data Center, and Chair of the Subcommittee on Global Change Research Peter Thorne, PhD, Senior Scientist, Cooperative Institute for Climate and
1. The diagram below shows Earth, four different positions of the Moon, and the direction of incoming sunlight.
 G8 Semester I MCAS Pre-Test Please answer on Scantron Card; not on this test form Standard: 9 - Describe lunar and solar eclipses, the observed moon phases, and tides. Relate them to the relative positions
Climate versus Weather
 Climate versus Weather What is climate? Climate is the average weather usually taken over a 30-year time period for a particular region and time period. Climate is not the same as weather, but rather,
Ocean in Motion 7: El Nino and Hurricanes!
 Ocean in Motion 7: El Nino and Hurricanes! A. Overview 1. Ocean in Motion -- El Nino and hurricanes We will look at the ocean-atmosphere interactions that cause El Nino and hurricanes. Using vocabulary
EARTH S MAGNETIC FIELD. Module 6
 EARTH S MAGNETIC FIELD Module 6 MAGNETIC FIELD A Magnetic field is generated by current or the flow of electrical charge Resistance a material s opposition to the flow of electric current. II = VV RR
Factors That Affect Climate
 Factors That Affect Climate Factors That Affect Climate Latitude As latitude (horizontal lines) increases, the intensity of solar energy decreases. The tropical zone is between the tropic of Cancer and
MIDTERM PRACTICE EXAM
 MIDTERM PRACTICE EXAM PART I Multiple Choice Answer all questions in this part [60 pts] Directions (1-30): For each statement of question, select the word or expression that best completes the statement
6. What has been the most effective erosive agent in the climate system? a. Water b. Ice c. Wind
 Multiple Choice. 1. Heinrich Events a. Show increased abundance of warm-water species of planktic foraminifera b. Show greater intensity since the last deglaciation c. Show increased accumulation of ice-rafted
Earth Magnetic Field
 1 Earth Magnetic Field redefined source reexamined influence T.S. Niazi ISBN: 1-4392-5791-4 ISBN-13: 9781439257913 2 Agenda Observations Earth Magnetic Field Influence on Earth Spin Speed Influence on
What is in outer space?
 What is in outer space? Celestial Objects are any natural objects that move through space. Star:_a huge sphere of gas in space _Nuclear fusion within stars give off enormous amounts of energy such as light
CHAPTER 2 Strand 1: Structure and Motion within the Solar System
 CHAPTER 2 Strand 1: Structure and Motion within the Solar System Chapter Outline 2.1 EARTH, MOON, AND SUN SYSTEM (6.1.1) 2.2 GRAVITY AND INERTIA (6.1.2) 2.3 SCALE OF SOLAR SYSTEM (6.1.3) 2.4 REFERENCES
Topic # 12 HOW CLIMATE WORKS
 Topic # 12 HOW CLIMATE WORKS A Primer on How the Energy Balance Drives Atmospheric & Oceanic Circulation, Natural Climatic Processes Starts on p 67 in Class Notes Evidently, not scary enough. How do we
Marine Ecoregions. Marine Ecoregions. Slide 1. Robert G. Bailey. USDA Forest Service Rocky Mountain Research Station
 Slide 1 Marine Ecoregions Robert G. Bailey Marine Ecoregions Robert G. Bailey USDA Forest Service Rocky Mountain Research Station rgbailey@fs.fed.us Draft of 7/20/2006 8:44 PM Abstract: Oceans occupy some
ATMOSPHERIC MODELLING. GEOG/ENST 3331 Lecture 9 Ahrens: Chapter 13; A&B: Chapters 12 and 13
 ATMOSPHERIC MODELLING GEOG/ENST 3331 Lecture 9 Ahrens: Chapter 13; A&B: Chapters 12 and 13 Agenda for February 3 Assignment 3: Due on Friday Lecture Outline Numerical modelling Long-range forecasts Oscillations
Predictability and prediction of the North Atlantic Oscillation
 Predictability and prediction of the North Atlantic Oscillation Hai Lin Meteorological Research Division, Environment Canada Acknowledgements: Gilbert Brunet, Jacques Derome ECMWF Seminar 2010 September
2013 ATLANTIC HURRICANE SEASON OUTLOOK. June RMS Cat Response
 2013 ATLANTIC HURRICANE SEASON OUTLOOK June 2013 - RMS Cat Response Season Outlook At the start of the 2013 Atlantic hurricane season, which officially runs from June 1 to November 30, seasonal forecasts
THE INFLUENCE OF CLIMATE TELECONNECTIONS ON WINTER TEMPERATURES IN WESTERN NEW YORK INTRODUCTION
 Middle States Geographer, 2014, 47: 60-67 THE INFLUENCE OF CLIMATE TELECONNECTIONS ON WINTER TEMPERATURES IN WESTERN NEW YORK Frederick J. Bloom and Stephen J. Vermette Department of Geography and Planning
First-Order Draft Chapter 3 IPCC WG1 Fourth Assessment Report
 0 Figure... Estimates of linear trends in significant wave height (cm decade - ) for the regions along the major ship routes for the global ocean for the period 0 00. Trends are shown only for the locations
Energy and Seasons A B1. 9. Which graph best represents the general relationship between latitude and average surface temperature?
 Energy and Seasons A B1 1. Which type of surface absorbs the greatest amount of electromagnetic energy from the Sun? (1) smooth, shiny, and light colored (2) smooth, shiny, and dark colored (3) rough,
MAR110 LECTURE #28 Climate Change I
 25 November 2007 MAR 110 Lec28 Climate Change I 1 MAR110 LECTURE #28 Climate Change I Figure 28.1 Climate Change Diagnostics Drought and flooding represent just a couple of hazards related to climate variability
TOPIC #12 NATURAL CLIMATIC FORCING
 TOPIC #12 NATURAL CLIMATIC FORCING (Start on p 67 in Class Notes) p 67 ENERGY BALANCE (review) Global climate variability and change are caused by changes in the ENERGY BALANCE that are FORCED review FORCING
The Atmospheric Circulation
 The Atmospheric Circulation Vertical structure of the Atmosphere http://www.uwsp.edu/geo/faculty/ritter/geog101/textbook/atmosphere/atmospheric_structure.html The global heat engine [courtesy Kevin Trenberth,
JP1.7 A NEAR-ANNUAL COUPLED OCEAN-ATMOSPHERE MODE IN THE EQUATORIAL PACIFIC OCEAN
 JP1.7 A NEAR-ANNUAL COUPLED OCEAN-ATMOSPHERE MODE IN THE EQUATORIAL PACIFIC OCEAN Soon-Il An 1, Fei-Fei Jin 1, Jong-Seong Kug 2, In-Sik Kang 2 1 School of Ocean and Earth Science and Technology, University
Meteorology Practice Test
 Meteorology Practice Test 1. Transition zones between two air masses of different densities are called what? 2. A front occurs when a cold air mass replaces a warmer one. 3. A front occurs when a warm
Chapter Introduction. Earth. Change. Chapter Wrap-Up
 Chapter Introduction Lesson 1 Lesson 2 Lesson 3 Climates of Earth Chapter Wrap-Up Climate Cycles Recent Climate Change What is climate and how does it impact life on Earth? What do you think? Before you
Current and future climate of the Cook Islands. Pacific-Australia Climate Change Science and Adaptation Planning Program
 Pacific-Australia Climate Change Science and Adaptation Planning Program Penrhyn Pukapuka Nassau Suwarrow Rakahanga Manihiki N o r t h e r n C o o k I s l a nds S o u t h e Palmerston r n C o o k I s l
Exploring The Planets: Earth
 Exploring The Planets: Earth By Encyclopaedia Britannica, adapted by Newsela staff on 08.24.17 Word Count 632 Level MAX An image of Earth, created by the Suomi NFP Satellite. This photo is created from
Winds and Global Circulation
 Winds and Global Circulation Atmospheric Pressure Winds Global Wind and Pressure Patterns Oceans and Ocean Currents El Nino How is Energy Transported to its escape zones? Both atmospheric and ocean transport
Chapter 15 Millennial Oscillations in Climate
 Chapter 15 Millennial Oscillations in Climate This chapter includes millennial oscillations during glaciations, millennial oscillations during the last 8000 years, causes of millennial-scale oscillations,