|
|
|
- Bertram Fitzgerald
- 6 years ago
- Views:
Transcription
1
2
3
4
5
6
7
8
9
10
11
12
13
14
15
16
17
18
19
20
21
22
23
24
25 Experiments #3: Dead time and nuclear counting statistics Objective: 1. Measurement of dead time 2. To investigate the statistics related to measurements with a Geiger counter: Poisson and Gaussian distribution Apparatus: Set-up for ST-350 Counter GM Tube and stand Shelf stand, serial cable, and a source holder Radioactive Source (e.g., Cs-137, Sr-90, or Co-60) Fig. 1 Experimental set up for studying dead time and counting statistics Dead Time In nearly all detector systems, there will be a minimum amount of time that separates two events in order that they may be recorded as two separate pulses. In some cases the limiting time may be set by processes in the detector itself, while in other cases the limit may arise due to the delays associated with the electronics. This minimum time separation is usually called the dead time of the counting system. Because of the random nature of radioactive decay, there is always some probability that a true event will be lost because it occurs too quickly following a preceding event. Two models of dead time are in common use, categorized on the basis of paralyzable and nonparalyzable response of the detector. The fundamental assumptions of the two models are illustrated in Fig. 3. At the centre of the figure, a time scale is shown on which six randomly spaced events in the detector are indicated. At the bottom of the figure is the corresponding dead time behaviour of a detector to be nonparalyzable. A fixed time τ is assumed to follow each true event that occurs during the live period of the detector. True events that occur during the dead period are lost and assumed to have no effect whatsoever on the behaviour of the
26 detector. In the example shown the nonparalyzable detector would record four counts from the six true events. In contrast, the behaviour of a paralyzable detector is shown along the top line of Fig. 3. The same dead time τ is assumed to follow each true interaction that occurs during the live period of the detector. True events that occur during the dead period are not recorded but they extend the dead time by another period τ following the lost event. In the example shown, only three counts are recorded for the six true events. The two models predict the same first-order losses and differ only when true event rates are high. They are in some sense two extremes of idealized system behaviour, and real counting system will often display a behaviour that is intermediate between these extremes. The detailed behaviour of a specific counting system may depend on the physical processes taking place in the detector itself or on delays introduced by the pulse processing and recording electronics. If the system dead time is τ, and the measured count rate is m, then the true count rate n predicted by the two models can be expressed as Nonparalyzable Model: (1) Paralyzable Model: (2) The derivations of the above results are given in Ref. 1. You may show that for low counting rates ( << 1/τ ) both models give the same expression for n. In the present experiment we will utilize the nonparalyzable model in the calculation of true counts and the dead time τ. A commonly used method for deadd time measurements is known as two source method. The method is based on observing the counting rate from two sources individually and in combination. Because the counting losses are nonlinear, the observed rate due to the combined sources will be less than the sum of the rates due to the two sourcess counted individually, and the dead time can be calculated from the discrepancy.
27 Procedure (i) To find the dead time we have to use two γ sources say S 1 ( 137 Cs) and S 2 ( 60 Co). While performing the experiment as per the steps given below, care must be exercised not to move the source already in place and consideration must be given to the possibility that the presence of a second source will scatter radiation into the detector which would not ordinarily be counted from the first source alone. In order to keep the scattering unchanged, a dummy second source without activity is normally put in place when the sources are counted individually. (ii) Keep source S 1 in one of the pits in the source holder made for this purpose. Keep a dummy source in the second pit. Record the counts for a preset time (say 300 s). (iii) Without removing source S 1 remove the dummy source from the second pit and keep the source S 2 in its place. Record the number of counts for the combined sources S 1 and S 2 for the same preset time as in (ii). (iv) Remove source S 1 and measure the counts due to source S 2 alone, for the same preset time as in (ii). (v) Remove source S 2 as well and record the background counts for the same period. Calculate the count rates in all the cases. Let, and be the true counts (sample plus background), with sources S 1, S 2 and (S 1 +S 2 ), respectively. Let, and represent the corresponding observed rates. Also let and be the true and measured background rates with both the sources removed. Assuming the nonparalyzable model, the dead time τ is given by (see Ref. 1 for details) Table: Data for resolving time
28 Counting statistics: Radioactive decay is a random process. Consequently, any measurement based on observing the radiation emitted in a nuclear decay is subject to some degree of statistical fluctuations. These inherent fluctuations are unavoidable in all nuclear measurements. The term counting statistics includes the framework of statistical analysis required to process the results of nuclear counting experiments and to make predictions about the expected precision of quantities derived from these measurements. Although each measurement (number of decays in a given interval) for a radioactive sample is independent of all previous measurements (due to randomness of the process), for a large number of individual measurements the deviation of the individual count rates from the average count rate behaves in a predictable manner. Small deviations from the average are much more likely than large deviations. These statistical fluctuations in the nuclear decay can be understood from the statistical models utilizing Poisson distribution or Gaussian (Normal) distribution. If we observe a given radioactive nucleus for a time t and define the success as the nucleus decays during the process then the probability of success p is given by (1 e λt ). The Poisson distribution applies when the success probability p is small and the number successes (i.e. number of counts measured) is also small (say <30). In practical terms, this condition implies that we have chosen an observation time that is small compared with the half-life of the source. When the average number of successes becomes relatively large (say > 30) we can utilize the Gaussian model of distribution. Since in most of the cases the count rates are reasonably large (few tens of counts per second) the Gaussian model has become widely applicable to many problems in counting statistics. On the other hand the Poisson distribution is applicable in the case of background counts. The details of experimental, Poisson and Gaussian distributions are given below. Experimental distribution function We assume that we have a collection of N independent measurements of the same physical quantity. In this particular case the quantity is the number of counts recorded by the detector in a specific time interval. We denote the result of these N measurements as y 1, y 2, y 3...y i....y N. The experimental mean is given by (7) The data set is conveniently represented by a frequency distribution function F(y). The value of F(y) is the relative frequency with which the number appears in the collection of data. By definition h h (8) A plot of F(y) versus y gives the frequency distribution of the data (The number of occurrences can also be calculated by choosing a suitable interval for the values of y). The standard deviation of the distribution is given by (9)
29 Notes regarding σ exp and Remember that Eq. (9) is applicable to the quantities directly measured in the experiment and not to the derived quantities. To illustrate, in the present experiment if you measure the number of counts for a preset time interval (say 30 s) and call it y i. Then Eq. (9) is applicable to these counts only and not to the counting rates calculated using these values. To determine the deviations for the derived quantities proper error propagation methods should be used. To be precise, is the true mean value determined from a set having infinitely large number of measurements and cannot be determined experimentally as such. However for a reasonably large set of measurements the value of can be set equal to (Eq. (7). The Poisson distribution As mentioned above it is applicable when p <<1 and the number of successes are very few. (10) In this case the standard deviation is given by (11) The Normal or Gaussian distribution When p << 1 and the successes are large one can model the experimental data using the Normal distribution which is also called Gaussian distribution (as per R.D. Evans it is erroneous to call this as Gaussian because its derivation by Gauss (1809) was antedated by those of Laplace (1774) and DeMoivre (1735)). This is given by (12) The standard deviation in this case is the same as that for the Poisson distribution (13) We will denote both σ P and σ G as σ th. Applications of statistical models in nuclear physics There are two major applications of counting statistics in nuclear measurements. The first application involves the use of statistical analysis to determine whether a set of multiple measurements of the same physical quantity shows an amount of internal fluctuation that is consistent with statistical predictions. In this case the motivation is to determine whether a particular counting system is functioning normally. The second application is more important in which we examine these methods to make a prediction about the uncertainty one should associate with a single measurement. The following procedure and analysis will give you a feel as to how an experimental distribution in a nuclear counting experiment looks like and how does it compare with theoretical distributions.
30 Procedure (i) Set the operating voltage of the Geiger counter at its proper value. (ii) Don t put any source in the lead castle. Also remove all the sources in the vicinity of the castle. (iii) Take 100 independent readings of the background counts for a preset time of 10 s. (To set Preset time 10 sec. follow step (ii) of initial procedure). (iv) Save the data by pressing STORE key. While taking 100 independent reading set ITERATION (Step (iii) of initial procedure) to 1. (v) Place one of the γ sources (137Cs or 60Co) far enough away from the window of the Geiger tube so that approximately 2000 counts are recorded in a time period of 30 s. Take 100independent readings of the counts for a preset time of 30s. (vi) Save the data by pressing STORE key. While taking 100 independent reading set ITERATION (Step (v) of initial procedure) to 1. (vii) Transfer the data on PC and plot the required function. Analysis of Background counts (data set (iii) above) (viii) Determine frequency of occurrence ν(y) which is the number of measurements in which y = 0, 1,2, 3, 4.counts have been observed and plot the experimental distribution ν(y) versus y. (ix) Calculate the average number of counts and the Poisson distribution (x) Calculate σ exp and σ th and compare. The comparison gives clue to the reliability of the measuring equipment. If σ exp is larger than σ th, it means that additional fluctuations have been introduced by the apparatus, such as spurious counts due to voltage surges, sparks in the tube or change of the background during the course of the experiment which can occur when you handle the sources (move from one place to another ) while the measurements are going on. (xi) Determine the actual number of intervals for which the absolute value of the deviation from the average is larger than the standard deviation and the probable error σ. Compare with theory. Analysis of the counts taken with the source data set (v) above (xii) Carry out the analysis following steps (viii) to (xi) above. However, in this case use Gaussian distribution. Also, in order to represent the distribution in the best possible manner, frequency of occurrence may be calculated by choosing equally spaced, non-overlapping, contiguous intervals for the counts. The width of the interval can be anywhere from 2 to 10 counts or more depending on the data set. (xiii) In addition, you may use different methods of testing the "Gaussian" nature of an experimental data which are illustrated in the book: Measurement systems, Applications and Design (4th edition) by E. O. Doebelin, pages
31 Table: Data for counting statistics References: 1. Glenn F. Knoll, "Radiation Detectors and Measurement", Chapters 3 and R.D. Evans, "The Atomic Nucleus", page R. M. Singru, "Introduction to Experimental Nuclear Physics". 4. Instruction Manual of G.M. Counting System TYPE: ST 360.
32
33
34
35
36
37
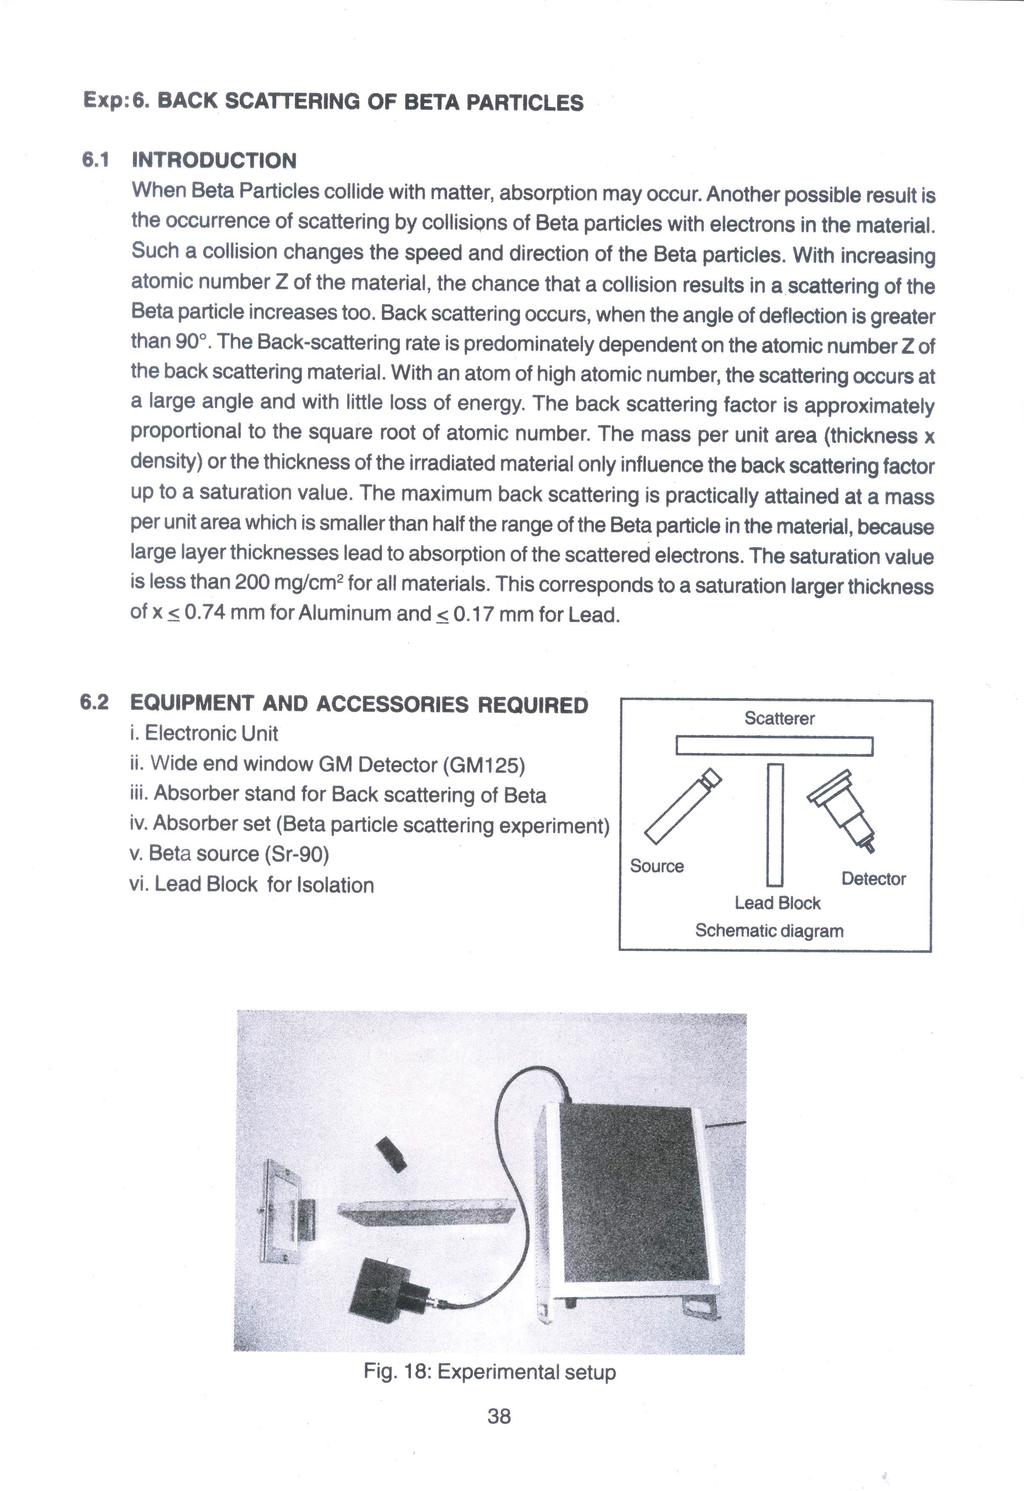
38
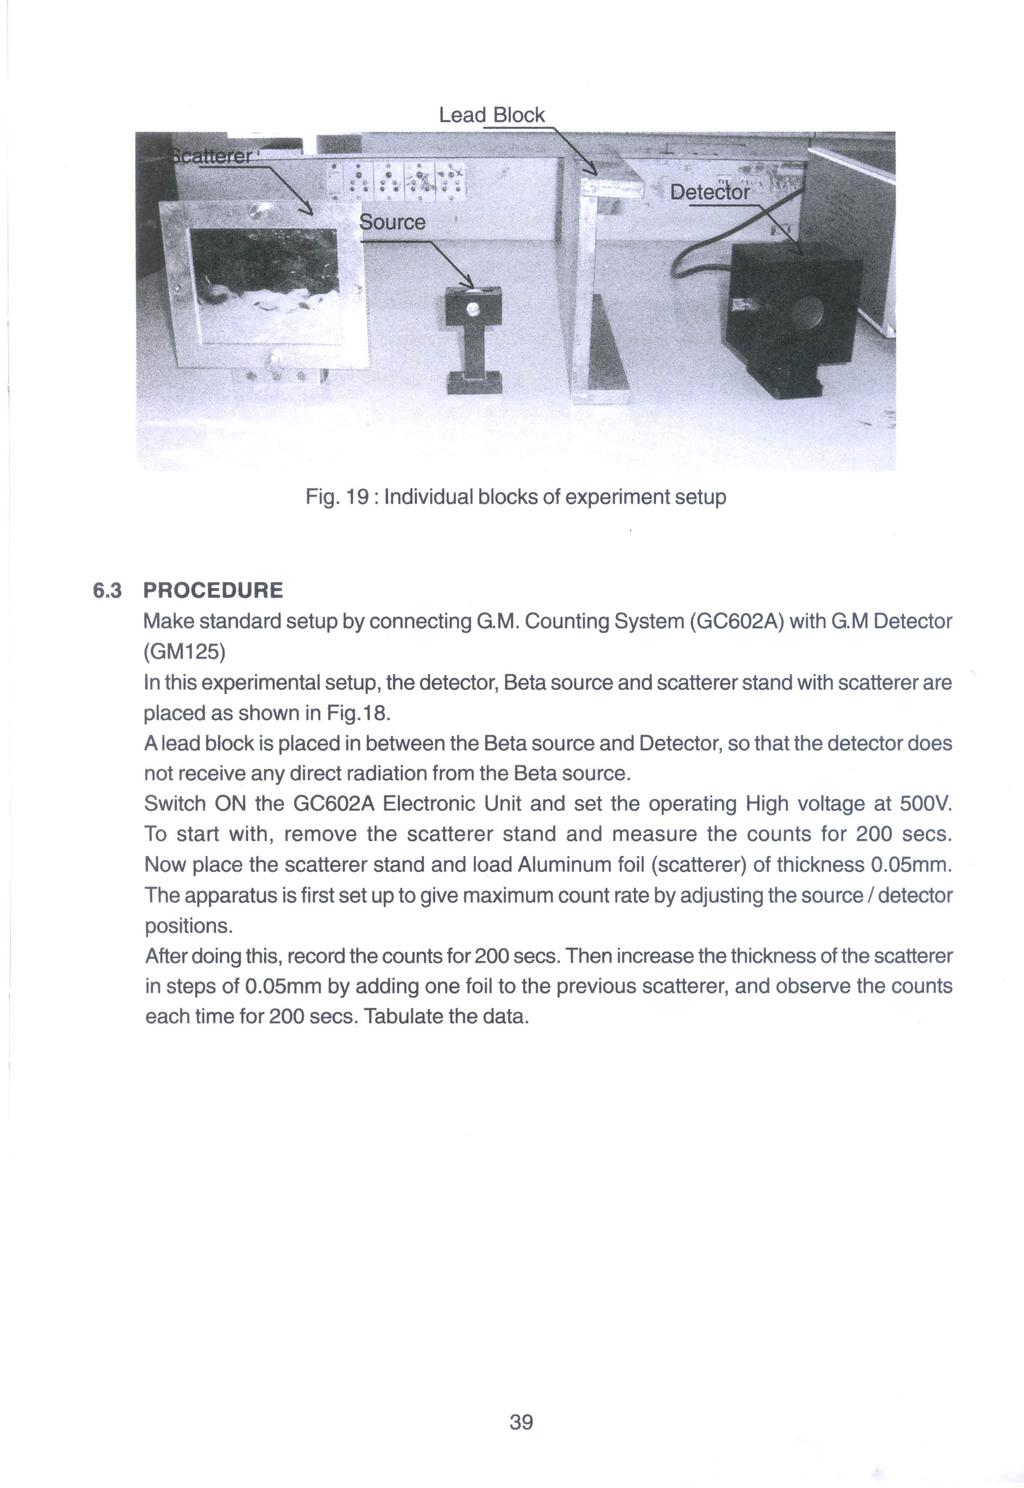
39
40
41
42
43
44
45
46
47
48
49
50
51
52 Atomic and Nuclear Physics Nuclear physics Rutherford scattering LD Physics Leaflets P Rutherford scattering: measuring the scattering rate as a function of the scattering angle and the atomic number Objects of the experiment g To record the direct counting rate N d of α particles scattered by a gold foil as function of the angle θ. g To determine the corrected counting rates N with respect to the scattering distribution in space. g To validate the Rutherford s scattering formula Fig. 1: Scattering of α-particles on a monolayer of atoms. Principles If α-particles are allowed to strike a thin gold foil, they are deflected from their path ( scattering ), each by an angle θ. The majority of α-particles is scattered by angles less than 1 (Fig.1). A few particles, however, show substantially large scattering angles θ, in the extreme case up to 180 ( back scattering ). These initially qualitative observations can only be explained by assuming that the gold atoms have a very small nucleus, containing practically the whole atomic mass, and being positively charged. On the basis of this idea Rutherford calculated the angular distribution of the scattering rate N(θ). The scattering rate is the number of particles which are scattered during the time unit in a determined interval dθ around an average angle θ. The result of this calculation is Rutherford s scattering formula : 2 4 Z e N( θ) = N0 cf df 2 4 θ (8 π ε0 Eα) sin ( ) 2 N 0 : particle rate in the foil c F : atomic concentration in the foil d F : thickness of the foil Z: nuclear charge number of the scattering material E α :energy of the α-particles e: elementary charge (e = *10-19 As) ε 0 : dielectric constant (ε 0 = *10-12 As/Vm) (I) Fö / Bi 1106 Recording the scattering rate as function of the angle In this case we need not care about the proportionality factors in equation (I) which are kept constant in our experiment. The relevant shape of this angular distribution curve is described by the function: 1 f( θ ) = (II) 4 θ sin ( ) 2 LD Didactic GmbH. Leyboldstrasse 1. D Huerth / Germany. Phone: (02233) Fax: (02233) info@ld-didactic.de by LD Didactic GmbH Printed in the Federal Republic of Germany Technical alterations reserved
 decrease rapidly with increasing scattering angle θ. Hence, in Fig. 2 the graphical representation of f(θ) is plotted in a logarithmic scale over θ.")
53 P LD Physics leaflets f(θ) scattering angle θ / Fig. 2: Theoretical slope of the scattering rate according equation (II). The values of f(θ) decrease rapidly with increasing scattering angle θ. Hence, in Fig. 2 the graphical representation of f(θ) is plotted in a logarithmic scale over θ. A singularity spot becomes visible at θ = 0. Therefore we will compare measuring results with the theoretical slope only outside of this region, i.e. for values θ > 5. As for higher scattering angles θ the counting rates become very small the gate times t(θ ) for determining the counting rate N(θ) have to be increased with increasing angle θ to obtain an acceptable accuracy. For keeping the total measuring time sustainable the angular range can be restricted to θ 30. Fig. 4: The scattering chamber (1) Preparation (4) Slit (2) Holder (5) swivel arm (3) Gold foil (6) detector Because of the very low range of α-particles in the air this experiment must be carried out in a closed chamber under vacuum (Fig. 3). Fig. 4 shows the arrangement of the components on the lid of the scattering chamber. Fig. 5 shows the geometry of the experiment. The α-particles emitted from the Am-241 preparation fall through a slit aperture of 5 mm width onto the gold foil and leave this gold foil with various scattering angles. The scattered α-particles are identified with a semiconductor detector. By swinging the detector in steps of 5, for example, the scattering rate can be determined for all scattering angles from 5 to 60. With the setup we are going to use, the detector is not swung but rather the preparation, slit and gold foil, which are attached on a common swivel arm. The detector is firmly attached to the side wall of the chamber. The 5 mm wide slit is a good choice for getting acceptable count statistics in reasonable time, but at small angles below 20 the angular precision might be increased by using a 1 mm slit and scaling the results appropriately. On the other hand, this scaling can introduce further errors, so it has not been used in the measurement described later. Determining the nuclear charge number of aluminium If we compare the scattering rates between two different foil materials (e.g. Au and Al) at the same angle θ, we can derive from the scattering formula (I): 2 N Au cau dau Z = Au 2 (III) NAl c Al dal ZAl Fig. 3: Experimental setup schematically for the Rutherford Scattering Experiment. Hence the nuclear charge number of aluminium Z Al can be determined by scattering experiments as following: Z 2 NAl( θ) c Au dau ZAu Al = (IV) NAu( θ) cal dal LD Didactic GmbH. Leyboldstrasse 1. D Huerth / Germany. Phone: (02233) Fax: (02233) info@ld-didactic.de by LD Didactic GmbH Printed in the Federal Republic of Germany Technical alterations reserved
54 LD Physics leaflets P Insert the Am-241 preparation into the 4-mm socket of the main swivel arm down to the stop. Place the 5-mm slit aperture and the plastic sheet containing the gold foil on top of one another (with the gold foil between them) and insert them both into the holder so that the slit points towards the preparation. Move the small swivel arm (not used here) close to the chamber s side wall so that the measurements are not disturbed. Make sure that the detector is fixed on the BNC socket at the inner wall of the chamber with the sides of the silicon chip parallel to the lid, and that the detector s plastic aperture slit is perpendicular to the lid (with the mark at the top). Fit vacuum tubing to the hose nozzle. Close the chamber by placing its lid onto the housing. Ensure the correct positioning by positioning pin in borehole. Then evacuate the chamber. Firmly press lid on, if necessary. While the vacuum builds up, the lid is pressed onto the rubber seal and the deep black stripe where they touch gets two ro three mm wide. During the measurement, the vacuum pump can either run continuously or the valve of the Rutherford chamber can be closed and the pump switched off. The rubber tubing must be vented through the inlet valve to avoid oil creeping back into the vacuum. Fig. 5: The scattering geometry: (1) preparation (2) collimator slit (3) gold foil (4).detector Apparatus 1 Scattering chamber after Rutherford Aluminium foil in frame Vacuum pump S 1.5, 230 V, 50 Hz T-Piece DN 16 KF Centering ring (adapter) DN 10/16 KF Centering ring DN 16 KF Clamping ring DN 10/16 KF Air inlet valve with DN 10 KF Small flange DN 16 with hose nozzle Vacuum rubber tubing Discriminator preamplifier Counter S Plug-in power supply unit 12 V AC Am-241 preparation, 333 kbq HF cable, 25 cm Measuring cable BNC / 4-mm Safety notes g Never touch the gold or aluminium foil! g Venting of the chamber after the experiment has to be done very carefully (see operating instructions , section 3.4), otherwise you may destroy the sensitive gold or aluminium foil. Setup Preparing the scattering chamber: Vent the scattering chamber (when using at first time) and take off the lid (Fig. 4). Preparing the electrical counting components: Connect the scattering chamber, discriminator preamplifier and counter S as shown in Fig. 3. Set discriminator to zero (turn potentiometer fully counterclockwise). Take care of connecting the detector with the discriminator preamplifier using the short 25 cm cable. Adjusting the discriminator level: The counter S normally starts correct for pulse counting with activated N A,E. and gate time set to manual, press start to start counting and ->0<- to reset the counter when necessary. Set up the experiment with the 5 mm slit, the gold foil, preparation and detector, and move the holder to a high angle, 30 for example. Only very few α-particles will reach the detector in this position. Evacuate the chamber, The potentiometer sets the discriminator level, a setting of zero (fully counterclockwise) will not discriminate anything, but let every noise signal pass through. The counter will overload instantly and display Increasing the discriminator setting will reduce these noise counts. To find the right position, increase the discriminator level by approximately a quarter turn and reset the counter. By varying the discriminator level in both directions search for the setting where the noise count rate just drops to zero. Note that position. Now swivel the preparation to 0 position, a lot of alpha radiation will hit the detector. The counter will start to count something between 10 to 100 counts per second. Increase the discriminator level again until the count rate just starts to drop. Note this position too. The correct position for the discriminator level is midway between both positions, the one where the noise is masked out and the other where the alpha count rate starts to drop. Test the setting by swiveling the preparation in and out the straight line and observe the counting rates. LD Didactic GmbH. Leyboldstrasse 1. D Huerth / Germany. Phone: (02233) Fax: (02233) info@ld-didactic.de by LD Didactic GmbH Printed in the Federal Republic of Germany Technical alterations reserved
55 P LD Physics leaflets Carrying out the experiment a) Recording scattering rate as function of the angle - Prepare the counter S for pulse counting by pressing the push button MODE to activate N A,E. - Select gate time t(θ) = 100 s by pressing the toggle button GATE three times Note: t(θ) = 100 s is useful for small angles, i.e. angle up to +/ 15. By pressing GATE + MODE, longer gate times are can be adjusted, i.e. up to 9999 s (MODE upwards, GATE downwards). Important: During measurements protect the sensitive detector from light (e.g. especially from fluorescent light of ceiling lamps)! If necessary, cover the scattering chamber during measurements with a black cloth. - Count at least 50 particles (n(θ) >50) at the angles: θ = +/-5, +/-10, +/-15, +/-20, +/-25 and +/-30 Note: It is recommended to measure symmetrically to θ = 0 to detect unwanted misalignments in the setup. - Use gate times t(θ) as given in the Table 1. Repeat counting several times for all angles (with exception of +/-5 ). b) Determining the nuclear charge number of aluminium Carefully vent the chamber, take of the lid and remove the 5 mm slit with the gold foil. Put the 1 mm slit together with the gold foil back into the holder, put the lid on the chamber and evacuate. Set the swivel arm first to a position of +15, count for sufficient time (100 s), then go to 15 and count again. Carefully vent the chamber, take of the lid and remove the slit with the gold foil. Put the 1 mm slit together with the aluminum foil back into the holder, put the lid on the chamber and evacuate. Count again at the same postion of +15 and 15, but for a much longer time (1000 s), as the aluminum foil scatters less particles. LD Didactic GmbH. Leyboldstrasse 1. D Huerth / Germany. Phone: (02233) Fax: (02233) info@ld-didactic.de by LD Didactic GmbH Printed in the Federal Republic of Germany Technical alterations reserved
56 LD Physics leaflets P Measuring example Table. 1: Measured values (with gold foil and slit d = 5 mm): Angle Gate time Pulse counts (single values) Pulse counts (mean value) Counting rate (directly) Counting rate (space corrected) θ in t(θ) in s n(θ) n m (θ) N d (θ) in 1/s N(θ) in 1/s ,4 0,0893 0, ,4 0,216 0, ,4 0,617 1,33 265,4 2,65 4, ,6 17,7 19, (46,4) (56,1) ,2 40,8 44,5 1002,0 10,0 16,3 280,0 1,40 3,01 261,6 0,436 1,16 153,8 0,171 0,537 LD Didactic GmbH. Leyboldstrasse 1. D Huerth / Germany. Phone: (02233) Fax: (02233) info@ld-didactic.de by LD Didactic GmbH Printed in the Federal Republic of Germany Technical alterations reserved
57 P LD Physics leaflets Evaluation and results a) Recording the scattering rate as function of the angle After recording the pulse counts n(θ) the mean values n m (θ) can be determined. Using the mean values n m (θ) the scattering rates N d (θ) are calculated by: nm( θ) Nd( θ ) = (V) t( θ) These measuring results N d (θ) are typical for a plane scattering geometry which is given by the transparent construction of the chamber used in this experiment. The theoretical function (according to Rutherford s formula), however, is related to a three-dimensional geometry. The relation between these different aspects can considered by the following concept (Fig. 6): Each plane angle θ corresponds in space to a cone with an aperture of 2 θ (produced by rotation of the plane structure around the incident beam axis). In the same way the plane angular differential dθ corresponds in three dimensions to a spatial angular differential dω given by: dω = 2 π sin (θ) dθ (VI) This geometrical corrections allows to derive a relation between the plane scattering rate N d(θ) and the spatial scattering rate N(θ): N 0 ϑ ϑ+ dϑ dω Fig. 6: The α-particles are scattered into the angular region ϑ + dϑ. f(θ) N(θ) = 2 π sin (θ) N d(θ) (VII) 1 Finally, the corresponding spatial values N(θ) are calculated (Table. 1) and the space corrected values plotted in a diagram (Fig. 7). The measuring value pairs {θ / N(θ )} can be compared with the shape of the theoretical curve of equation (II): A f( θ ) = (VIII) 4 θ B sin ( ) 2 The proportionality factor A represents a vertical shift (at logarithmic scale). The coefficient B is representing a small displacement along the horizontal angular scale. Note: A small inaccuracy of the collimator-slit adjustment or non centric distribution of the radiation, coming from the preparation in the holder, may cause a shift of the curve along the horizontal axis (angle shift < 3 ). Due to such effects it is useful to record scattering rates as well in the positive as in the negative angular range, to get information of both branches with respect to an accurate determination of the symmetry-axis displacement. 0, scattering angle θ / Fig. 7: Results (circles) with a shifted fitting curve (grey) according to equation (VIII) for A = and B = b) Determining the nuclear charge number of aluminium Typical results for the counting rates at gold and aluminium are (15, 1 mm slit): N Au (15 ) = 0,301 1/s N Al (15 ) = 0,029 1/s With d Au = 2 µm, d Al = 8 µm, c Au c Al and Z Au = 79 we obtain with equation (IV): Z Al = 12,3 (exact value: Z Al = 13). LD Didactic GmbH. Leyboldstrasse 1. D Huerth / Germany. Phone: (02233) Fax: (02233) info@ld-didactic.de by LD Didactic GmbH Printed in the Federal Republic of Germany Technical alterations reserved
58 Gamma Ray Spectroscopy Introduction Gamma ray spectroscopy is one of the most developed and important techniques used in experimental nuclear physics because gamma ray detection and its energy measurement form an essential part of experimental nuclear physics research. The purpose of this experiment is to acquaint one with this field using a gamma ray spectrometer comprising of thallium activated sodium iodide (NaI(Tl)) scintillator, photo multiplier tube, associated electronics and multi channel analyzer. The scintillation spectrometers with their high detection efficiency and moderately good energy resolution have made tremendous contribution to our present knowledge of nuclear properties. Objectives: To investigate the properties of NaI detector To determine the energy of unknown gamma radiation To determine the nuclide that gives rise to gamma radiation. To determine the efficiency of NaI detector To determine the activity of 40 K. To determine the activity of 137 Cs. Apparatus: NaI detector with accessories Amplifier with ADC. Sources which radiated gamma rays. Computer with windas software for data acquision. Theory and concepts: The detection of gamma rays occurs through its interaction with the detecting medium, (NaI (Tl) in the present case). There are three important processes by which gamma ray photons interact with matter enabling us to detect them and measure their energies. These processes are the following.
59 (i) Photoelectric Absorption Photoelectric absorption is an interaction in which the incident gamma ray photon disappears. In its place, a photoelectron is released from one of the electron shells of the absorber atom with a kinetic energy given by the incident photon energy h minus the binding energy of the electron in its original shell (E B ). The interaction is with the atom as a whole and cannot take place with free electrons. For typical gamma ray energies, the photoelectron is most likely to emerge from the K shell of the atoms for which typical binding energies range from a few kev for low-z materials to tens of kev for materials with higher atomic number. After the ejection of an electron by this process, the vacancy in that shell of the atom is filled up by another electron from outer shells. This is followed by emission of X-rays or Auger electrons consuming the binding energy E B. The configuration of the atomic shells recovers within a very short time after the photoelectric emission. The atomic X-rays produced as a follow-up of the photoelectric effect are almost completely absorbed by the matter surrounding the point of emission, giving rise to further photoelectrons. Thus the total energy of the incident gamma ray is completely converted into the kinetic energy of the electrons and thus one gets an output which is proportional to the energy of ejected electrons. (Here the energy of the ejected electrons (E-28) KeV, E = h is the energy of the incident gamma ray and 28 KeV is the binding energy of K shell of an electron in the iodine atom). Therefore in general, one expects two peaks in photoelectric absorption corresponding to E and (E-28) KeV but they are not often resolved due to limit on resolution. (ii) Compton Effect a. Compton Scattering In this process an incident photon interacts with a free electron, gets scattered and leaves the detector. Compton scattering also includes scattering of the photon by electrons bound to an atom because in comparison to the energy of the photon, the electron binding energy is quite small. Thus an incident photon of energy h can be considered to collide with a free electron of rest mass m 0. The photon is scattered through an angle with an energy h / (<h ) while the electron recoils with a kinetic energy K e at an angle.
60 The energy of the photon after scattering (h / ) is given by (application of law of conservation of linear momentum and energy involving a relativistic expression) h / = 1 h (1 cos ), (1) where = h /m 0 c 2. K e = h - h / = h [ 1-1/{1+ (1-cos )}] (2) where E= h. Thus when Compton scattering occurs and the photon escapes the detector after scattering, the energy deposited in the detector material is equal to K e. The maximum K e occurs for = 180 o for which is called the Compton edge. K e = K e max = 2 E 1 2 (4) b. Back Scattering Back scattering peak derives its origin from the detection of gamma rays scattered by the material of which the source is made. These gamma rays are scattered at 180 o, then enter the crystal and absorbed by photoelectron emission and thus have energy, E/(1+2 ) as explained before. In this particular detector E=0.5 MeV and 2 MeV and we expect back scattering peaks at 0.17 and 0.22 MeV, respectively. (iii) Pair Production When a photon having energy greater than 1.02 MeV strikes a material of high atomic number, it is found that it is completely absorbed and a pair of electron and positron is produced. This process is known as pair production and the cutoff energy of the photon is 1.02 MeV. The conservation of energy yields h = 2m 0 c 2 +E + + E_ +E nuclear (5)
61 where 2m 0 c 2 is the rest mass energy of the pair while E+, E- and E(nuclear) are the kinetic energies of the positron, electron and nucleus, respectively. The presence of the nucleus is essential for the conservation of linear momentum. The kinetic energy of the pair is then (E-1.02) MeV (where E=h ) which is shared equally between the electron and the positron which are stopped in the crystal. The positron annihilates with the nearest electron available and produces two oppositely directed gamma rays of total energy 1.02 MeV. Both or one of these annihilation gamma rays (each having energy of m 0 c 2 = 511 KeV) can either be stopped in the crystal through processes photoelectric absorption and Compton or they can escape from the crystal. In case both the photons are completely stopped in the crystal one will get a full energy peak at E, as in the case of photoelectric absorption. If one or both gamma rays escape we get a corresponding peak at energies E - m 0 c 2 or E - 2m 0 c 2. As an example of one extreme in gamma ray detector behavior, we first examine the expected response of detectors whose size is small compared with the mean free path of the secondary gamma radiations produced in interactions of the original gamma rays. These secondary radiations are Compton scattered gammas, together with annihilation photons formed at the end of the tracks of positrons created in pair productions. Because the mean free path of the secondary gamma rays is typically of the order of several centimeters, the condition of smallness is met if the detector dimensions do not exceed a centimeter or two. At the same time, we assume that all charged particle energies (photoelectron, Compton electron, and positron) are completely absorbed within the detector volume. The predicted electron energy deposition spectra under these conditions are illustrated in Fig.1. If the incident gamma ray energy is below the value at which pair production is possible, the spectrum results only from the combined effect of Compton scattering and photoelectric absorption. The continuum of energies corresponding to Compton scattered electrons is called the Compton continuum, whereas the narrow peak corresponding to photoelectrons is designated as photopeak. For a small detector only single interactions take place, and the ratio of the area under the photopeak to the area under the Compton continuum is the same as the ratio of the photoelectric cross section to the Compton cross section in the detector material.
62 Compton cont. h < 2m o c 2 Photopeak or Full-energy peak h >> 2m o c 2 Compton continuum Photopeak or Full-energy peak Compton edge h E h - 2m o c 2 h E Figure 1: The processes of photoelectric absorption and single Compton scattering give rise to the low energy spectrum at the left. At the higher energies the pair production process adds a double escape peak shown in the spectrum at the right. If the incident gamma ray energy is sufficiently high (several MeV), the results of pair production are also evident in the electron energy spectrum. For a small detector, only the electron and positron kinetic energies are deposited, and the annihilation radiation escapes. The net effect is to add a double escape peak to the spectrum located at an energy 2m o c 2 (~1.02 mev) below the photopeak. The term double refers to the fact that the annihilation photons escapes.
63 Description of the components: Scintillation Gamma Ray Spectrometer: A spectrometer is an instrument to study the energy or wavelength spectra of radiation. Scintillation gamma ray spectrometer is one of the most popular and successful spectrometers. This is based on the fact that there are certain substances which emit light flashes (or scintillation) when charged particle, X-rays and -rays pass through them. In a scintillation detector these light flashes are allowed to fall on the photocathode of a photo multiplier tube and a pulse is extracted out to signal the passage of nuclear radiation in the scintillator. The height of this output pulse can be made proportional to the energy dissipated by the ionizing radiation in the scintillator. Thus a scintillation detector can be used not only for counting but also for energy analysis. This spectrometer employs a scintillation detector which is a thallium activated sodium iodide crystal as a scintillator. This crystal is enclosed in an aluminum can (Fig.2). Further, the scintillator is covered by a layer of reflecting material like MgO or AlO powder. There is a glass window at one end so that the light produced by scintillator can pass onto the photocathode. The sensitive part of the detector is a scintillator, which consists of a cylindrical NaI crystal with a diameter of 5 cm. The incoming gamma quanta deposit all their energy, or part of it, to the electrons in the crystal due to collisions (Compton effect) or photo-electric effect. The resulting fast electrons collide with the atoms of the crystal, which are excited and subsequently deexcited by emitting photons with a wave length in the region of visible light. The photons reach the photo cathode of a photo multiplier tube (PM tube), which is optically coupled to the crystal. Here the photons will cause the emission of electrons through the photo-electric effect. The number of electrons emitted from the photo cathode is proportional to the energy of the gamma radiation. The electrons are accelerated in the PM tube towards a structure of metal plates (dynodes). At the first dynode the electrons emit more electrons (see figure 2). The shower of electrons is amplified at each dynode (in total 10). The potential difference between each consecutive dynode is about 75 V. The resulting shower of electrons gives rise to an electric pulse, whose amplitude is directly proportional to the amount of light collected on the photo cathode, and thus directly proportional to the energy of the gamma radiation. By measuring the amplitude, the energy of the corresponding gamma quantum can be determined.
64 Figure 2: The schematic of the scintillator and photomultiplier tube. Under proper conditions the voltage pulse formed is linearly related to the energy spent by the incident photon in the crystal. The pulses extracted from the photo-multiplier are fed to the single channel analyzer (SCA) or multi channel analyzer (MCA). The pulses coming out from SCA are standard positive pulses and are fed to the decade scalar which counts the number of pulses allowed by SCA during the time interval set by the timer. The multi channel analyzer acquires the data simultaneously for all particles. The function of the MCA is described later. The spectrometer is coupled to the nuclear electronic system as shown in Fig.3. Pre-Amplifier The first element in a signal processing chain is a preamplifier which provides an interface between the detector and the pulse processing and the analysis electronics that follows. The preamplifier is generally located as close as possible to the detector to maximize the signal to noise ratio. It also serves as an impedance matcher presenting high impedance to the detector to minimize loading, while providing a low impedance output to drive succeeding components. It conventionally provides no pulse shaping and its output is a linear tail pulse with fast rise time and slow decay time.
. ii.")
65 Figure 3: The schematic sketch of the Gamma-ray spectrometer. Pulse Height Analyzer (PHA) The amplified pulses are next sorted out according to their pulse height. The pulse height is directly proportional to the energy deposited by the incident gamma particles in the detector. The pulse height analysis can be done by i. Single Channel Analyzer (SCA). ii. Multi Channel Analyzer (MCA). A PHA is normally operated either in an integral or a differential mode. In integral mode a PHA is just a discriminator. In differential mode the analyzer is said to work as an SCA. Recording data with SCA involves many operations and it takes long time to collect the entire spectrum. The details are given in Refs.1 and 4. Multi Channel Analyzer A modern multichannel analyzer operation is based on the principle of counting an analog signal (the pulse amplitude) to an equivalent digital number. In this case both the amplifier and ADC are integrated in a one unit (Fig.3). Once this conversion has been accomplished the extensive technology available for the storage and display of digital information can be brought to bear on the problem of recording pulse height spectra. So the analog to digital converter (ADC) is a key element of MCA, which converts each pulse amplitude (or energy) into an equivalent digital
66 number. A build-in periodic oscillation sends out clock pulses and the number (N) of such pulses occurring in this time interval are recorded in a scalar (address register). In this way the output of the ADC is stored in a computer type memory, which has many addressable locations as the maximum number of channels into which the recorded spectra can be subdivided. The number of memory locations is usually made a power of two, memories like 256, 512, 1024, 2048, etc. channels being common choices. The maximum content of any one memory location is typically 10 5 or 10 6 counts. So the basic function of the MCA involves the ADC memory and display. In this way the entire histogram plot of count versus pulse height can be recorded almost simultaneously and displayed on the computer screen as a spectrum. How is a spectrum created? The electric pulses from the PM tube are amplified in the amplifier and then registered by the computer and sorted into a histogram according to their amplitude. Since the amplitude is proportional to the gamma energy, the histogram reproduces the energy distribution of the detected gamma quanta. The analogue information (the amplitude) must be converted to suitable digital information (binary number) for the computer. The electronic circuit which carries out the conversion is called an A/D converter (Analog-to-Digital converter). The process is illustrated in the simplified drawing of figure 4. The incoming pulses are read by the A/D converter, which makes a classification, i.e. sorts the pulses into different boxes ( channels ) according to their pulse height. The GDM 10 detector system uses an A/D converter with 1024 channels. The channels are numbered according to increasing pulse height, and the channel number is thus proportional to the gamma energy. For example, pulse A is put into channel number 1, pulse B into channel number 2, pulse C and D into number 3, and so on. One thus obtains a histogram of the pulse height distribution for all detected gamma quanta. Since the pulse height is proportional to the gamma energy, the histogram reproduces the distribution of the corresponding gamma energies. The histogram is usually referred to as an energy spectrum. In order to find out which channel number corresponds to which energy, it is necessary to make an energy calibration, which is obtained by using radioactive sources which emit gamma quanta with known energies.
67 Figure 4: The flow chat which shows, how the spectrum created. Procedure: Make the connections as per schematic diagram given in Fig. 3. The system is connected to PC using a RS-232 interface. Turn all the electric units ON and allow a warm up period of about 15 min. Adjust the high voltage for PMT between 400 to 600 volts (Don t exceed 600V). Now choose a source which gives maximum gamma ray energy. Adjust the discriminator of the preamplifier such that the Compton distribution should not have very high counts in the initial channels. It is advisable to collect the spectra from channel no 50, by suitable discriminator level selection. Keep all the settings undisturbed throughout the experiment. Start spectrum acquisition following the menu on the PC screen. One can observe the accumulation of data (spectrum) on the screen. Experiments: Create a subdirectory of your name and save all the data in your directory. Note down the distance and position (as accurately as possible) of the source from the detector in all the cases. This is important for subsequent analysis, especially for finding the activity of the source.
68 i. Measurement of a gamma-ray spectrum a) Collect a spectrum of a 137 Cs source. Place the source about 5 cm above the opening of the detector, to make sure that the count rate is not too high. Note the distance between the source and the detector. Measure for 5 minutes and make a sketch of the spectrum. Store the spectrum. Note that a spectrum from a source with only one gamma-ray energy consists of a peak (the photo peak or the full-energy peak) and a distribution on the low-energy side (to the left) of the photo peak. If there are several photo peaks in a spectrum, the studied radiation must contain several different energies. The low-energy distribution to the left of the photo peak originates from gamma quanta, which have collided with electrons in the detector crystal or in the lead shielding. The collision takes place in such a way that only part of the original energy of the gamma quantum is absorbed in the detector. This kind of collision is called Compton scattering and the low-energy distribution is the so-called Compton distribution. The Compton distribution always forms a background to the left of the photo peak with which it is associated. Note that there is always a discriminator setting, which rejects the most low-energetic gamma quanta and the electronic noise. The discriminator setting can be adjusted with the knob on the amplifier box, but should not be changed during a measurement. Note in your sketch of the 137 Cs spectrum where the photo peak, discriminator level and Compton distribution are situated. b) Record a spectrum of KCl or of the mineral salt. The mineral salt contains KCl, and thus 40 K, which is a naturally occurring radioactive isotope. Measure for 15 minutes and then make a sketch of the spectrum. Compare with the background spectrum. Save the spectrum. c) Record a background spectrum, i.e. collect a spectrum without a source. The measuring time is 20 minutes. Don't forget to remove all sources close to the detector. Save the background spectrum. Compare with the 40 K spectrum in b. d) All recorded spectra in a - c are copied to your own folder.
69 ii. Calibration of the spectrometer To perform any of the analysing procedures described below, one must first start the analyzing programme on the respective computer. This is done by first typing CD DAS in order to change to the correct directory. Then type DAS, which loads the analyzing programme DAS, which is exactly the same programme as used for the data collection. For the analysis, use only the commands listed on the distributed stencil. Alternatively one can use the function keys for the most common commands. An explanation of the commands and the function keys can be obtained on the screen by the command Help or in WinDAS User s Guide chapter 4. Before a spectrum can be analyzed the spectrum must be read into primary memory. This is done with the command File Open. The relation between the channel scale and the energy of the radiation: Determine the channel position of the photo peak in the spectrum of 137 Cs by using the centroid routine, which is prepared by first placing the cross of the lower marker on the left edge of the photo peak and the cross of the upper marker on the right edge of the same peak. This is most easily done by using the right and the left button of the mouse. See figure 5. Now use the command Calculate >Centroid, which gives the channel position of the centre of mass of the photo peak. Zero the spectrum on the screen (File Clear) and read the 60 Co spectrum. Repeat the same procedure for the photo peak in the 60 Co spectrum. Note that the number of pulses and the number of pulses per second in the photo peak are also given. Draw a diagram of the energies of the two photo peaks as a function of the corresponding channel position, i.e. the energy along the vertical axis and the channel number along the horizontal axis. The energies of the gamma quanta of 60 Co (two photo peaks) and 137 Cs are 1.33 MeV, 1.17 MeV and 0.66 MeV, respectively. Since the energy is very close to a linear function of the channel number you have now obtained an energy calibration. This means that each channel position corresponds to a definite energy. Draw a straight line through the calibration points. Use the calibration to determine the size of the energy region (energy window) of your spectrum, by reading from the diagram the energies which correspond to the beginning and the end of the spectrum. A suitable energy window is in most cases about MeV. Note down your energy windows:
 Collect a gamma-ray spectrum from an unknown source given to you by your teacher.")
70 Figure 5: The standard spectrum of 137 Cs for calibration Table: Source Energy(MeV) Photopeak FWHM Max. intensity iii. Determination of the gamma-ray energies of an unknown gamma source a) Collect a gamma-ray spectrum from an unknown source given to you by your teacher. Copy the spectrum to your folder and read it into your computer. Your earlier calibration may be used to calibrate the unknown spectrum. b) Compare the gamma energies obtained with the decay schemes. iv. Determination of detector resolution and its variation with energy The term resolution denotes the degree of broadening and is defined as the full width at half maximum divided by the pulse height at the peak multiplied by 100 as given below. FWHM % Resolution = x 100 (6) Pulse height at the peak value Determine the percentage resolution for all photo-peaks and plot resolution vs. E -1/2 and study the relation.
Atomic and Nuclear Physics
 Atomic and Nuclear Physics Nuclear physics Rutherford scattering LD Physics Leaflets P6.5.2.1 Rutherford scattering: measuring the scattering rate as a function of the scattering angle and the atomic number
hν' Φ e - Gamma spectroscopy - Prelab questions 1. What characteristics distinguish x-rays from gamma rays? Is either more intrinsically dangerous?
 Gamma spectroscopy - Prelab questions 1. What characteristics distinguish x-rays from gamma rays? Is either more intrinsically dangerous? 2. Briefly discuss dead time in a detector. What factors are important
SCINTILLATION DETECTORS & GAMMA SPECTROSCOPY: AN INTRODUCTION
 SCINTILLATION DETECTORS & GAMMA SPECTROSCOPY: AN INTRODUCTION OBJECTIVE The primary objective of this experiment is to use an NaI(Tl) detector, photomultiplier tube and multichannel analyzer software system
 P6.5.5.4 Atomic and nuclear physics Nuclear physics γ spectroscopy Identifying and determining the activity of radioactive samples Description from CASSY Lab 2 For loading examples and settings, please
Scintillation Detector
 Scintillation Detector Introduction The detection of ionizing radiation by the scintillation light produced in certain materials is one of the oldest techniques on record. In Geiger and Marsden s famous
Copyright 2008, University of Chicago, Department of Physics. Experiment VI. Gamma Ray Spectroscopy
 Experiment VI Gamma Ray Spectroscopy 1. GAMMA RAY INTERACTIONS WITH MATTER In order for gammas to be detected, they must lose energy in the detector. Since gammas are electromagnetic radiation, we must
Experiment 6 1. The Compton Effect Physics 2150 Experiment No. 6 University of Colorado
 Experiment 6 1 Introduction The Compton Effect Physics 2150 Experiment No. 6 University of Colorado In some situations, electromagnetic waves can act like particles, carrying energy and momentum, which
Atomic and nuclear physics
 Atomic and nuclear physics X-ray physics Physics of the atomic shell LEYBOLD Physics Leaflets Moseley s law and determination of the Rydberg constant P6.3.3.6 Objects of the experiment Measuring the K-absorption
Atomic and nuclear physics
 Atomic and nuclear physics X-ray physics Attenuation of x-rays LEYBOLD Physics Leaflets P6.3.2.2 Investigating the wavelength dependency of the coefficient of attenuation Objects of the experiment To measure
Gamma Ray Spectroscopy
 Gamma Ray Spectroscopy Uzair Latif, Imran Younus Department of Physics Lahore University of Management Sciences November 4, 2014 1 Objectives 1. To acquaint the students with some of the basic techniques
THE COMPTON EFFECT Last Revised: January 5, 2007
 B2-1 THE COMPTON EFFECT Last Revised: January 5, 2007 QUESTION TO BE INVESTIGATED: How does the energy of a scattered photon change after an interaction with an electron? INTRODUCTION: When a photon is
Analysis of γ spectrum
 IFM The Department of Physics, Chemistry and Biology LAB 26 Analysis of γ spectrum NAME PERSONAL NUMBER DATE APPROVED I. OBJECTIVES - To understand features of gamma spectrum and recall basic knowledge
Jazan University College of Science Physics Department. Lab Manual. Nuclear Physics (2) 462 Phys. 8 th Level. Academic Year: 1439/1440
 462 Phys. 8 th Level. Academic Year: 1439/1440") Jazan University College of Science Physics Department جاهعة جازان كلية العل وم قسن الفيزياء Lab Manual Nuclear Physics (2) 462 Phys 8 th Level Academic Year: 1439/1440 1 Contents No. Name of the Experiment
Jazan University College of Science Physics Department جاهعة جازان كلية العل وم قسن الفيزياء Lab Manual Nuclear Physics (2) 462 Phys 8 th Level Academic Year: 1439/1440 1 Contents No. Name of the Experiment
Alpha-Energies of different sources with Multi Channel Analyzer
 Physical Structure of Matter Radioactivity Alpha-Energies of different sources with Multi Channel Analyzer What you can learn about Decay series Radioactive equilibrium Isotopic properties Decay energy
EEE4106Z Radiation Interactions & Detection
 EEE4106Z Radiation Interactions & Detection 2. Radiation Detection Dr. Steve Peterson 5.14 RW James Department of Physics University of Cape Town steve.peterson@uct.ac.za May 06, 2015 EEE4106Z :: Radiation
Gamma Spectroscopy. References: Objectives:
 Gamma Spectroscopy References: G.F. Knoll, Radiation Detection and Measurement (John Wiley & Sons, New York, 2000) W. R. Leo, Techniques for Nuclear and Particle Physics Experiments: A How-to Approach,
Alpha-energies of different sources with Multi Channel Analyzer (Item No.: P )
") Alpha-energies of different sources with Multi Channel Analyzer (Item No.: P2522015) Curricular Relevance Area of Expertise: ILIAS Education Level: Physik Topic: Hochschule Subtopic: Moderne Physik Experiment:
Alpha-energies of different sources with Multi Channel Analyzer (Item No.: P2522015) Curricular Relevance Area of Expertise: ILIAS Education Level: Physik Topic: Hochschule Subtopic: Moderne Physik Experiment:
MEASURING THE LIFETIME OF THE MUON
 B6-1 MEASURING THE LIFETIME OF THE MUON Last Revised September 19, 2006 QUESTION TO BE INVESTIGATED What is the lifetime τ of a muon? INTRODUCTION AND THEORY Muons are a member of a group of particles
Radionuclide Imaging MII Detection of Nuclear Emission
 Radionuclide Imaging MII 3073 Detection of Nuclear Emission Nuclear radiation detectors Detectors that are commonly used in nuclear medicine: 1. Gas-filled detectors 2. Scintillation detectors 3. Semiconductor
GAMMA RAY SPECTROSCOPY
 GAMMA RAY SPECTROSCOPY Gamma Ray Spectroscopy 1 In this experiment you will use a sodium iodide (NaI) detector along with a multichannel analyzer (MCA) to measure gamma ray energies from energy level transitions
COMPTON SCATTERING OF GAMMA RAYS
 COMPTON SCATTERING OF GAMMA RAYS v2.7 Last revised: R. A. Schumacher, January 2017 I. INTRODUCTION Compton scattering is the name given to the scattering of high-energy gamma rays from electrons. The gamma
Energy loss of alpha particles - Prelab questions
 Energy loss of alpha particles - Prelab questions 1. Write down the decay path from 226 Ra to 206 Pb. Show the intermediate nuclides and the nuclear reactions which cause each transformation (α/β ± decay).
Nuclear Lifetimes. = (Eq. 1) (Eq. 2)
 (Eq. 2)") Nuclear Lifetimes Theory The measurement of the lifetimes of excited nuclear states constitutes an important experimental technique in nuclear physics. The lifetime of a nuclear state is related to its
Nuclear Lifetimes Theory The measurement of the lifetimes of excited nuclear states constitutes an important experimental technique in nuclear physics. The lifetime of a nuclear state is related to its
ORTEC AN34 Experiment 10 Compton Scattering
 EQUIPMENT NEEDED FROM ORTEC 113 Preamplifier (2 ea.) TRUMP-PCI-2K MCA System including suitable PC operating Windows 98/2000/XP (other ORTEC MCAs may be used) 266 Photomultiplier Tube Base (2 ea.) 4001A/4002D
PHY 192 Compton Effect Spring
 PHY 192 Compton Effect Spring 2010 1 The Compton Effect Introduction In this experiment we will study two aspects of the interaction of photons with electrons. The first of these is the Compton effect
Detection and measurement of gamma-radiation by gammaspectroscopy
 Detection and measurement of gamma-radiation by gammaspectroscopy Gamma-radiation is electromagnetic radiation having speed equal to the light in vacuum. As reaching a matter it interact with the different
Radiation Detection and Measurement
 Radiation Detection and Measurement June 2008 Tom Lewellen Tkldog@u.washington.edu Types of radiation relevant to Nuclear Medicine Particle Symbol Mass (MeV/c 2 ) Charge Electron e-,! - 0.511-1 Positron
Nuclear Physics Laboratory. Gamma spectroscopy with scintillation detectors. M. Makek Faculty of Science Department of Physics
 Nuclear Physics Laboratory Gamma spectroscopy with scintillation detectors M. Makek Faculty of Science Department of Physics Zagreb, 2015 1 1 Introduction The goal of this excercise is to familiarize with
EQUIPMENT Beta spectrometer, vacuum pump, Cs-137 source, Geiger-Muller (G-M) tube, scalar
 tube, scalar") Modern Physics Laboratory Beta Spectroscopy Experiment In this experiment, electrons emitted as a result of the radioactive beta decay of Cs-137 are measured as a function of their momentum by deflecting
Modern Physics Laboratory Beta Spectroscopy Experiment In this experiment, electrons emitted as a result of the radioactive beta decay of Cs-137 are measured as a function of their momentum by deflecting
Nuclear Physics Lab I: Geiger-Müller Counter and Nuclear Counting Statistics
 Nuclear Physics Lab I: Geiger-Müller Counter and Nuclear Counting Statistics PART I Geiger Tube: Optimal Operating Voltage and Resolving Time Objective: To become acquainted with the operation and characteristics
Optics. Measuring the line spectra of inert gases and metal vapors using a prism spectrometer. LD Physics Leaflets P
 Optics Spectrometer Prism spectrometer LD Physics Leaflets P5.7.1.1 Measuring the line spectra of inert gases and metal vapors using a prism spectrometer Objects of the experiment Adjusting the prism spectrometer.
Advanced lab course for Bachelor s students
 Advanced lab course for Bachelor s students Versuch T2 Gamma spectroscopy and Compton scattering February 2018 Prerequisites Interactions of photons and matter Working principle and usage of scintillation
Andrew D. Kent. 1 Introduction. p 1
 Compton Effect Andrew D. Kent Introduction One of the most important experiments in the early days of quantum mechanics (93) studied the interaction between light and matter; it determined the change in
Relativistic Electrons
 Relativistic Electrons Physics 300 1 Introduction In this experiment you will make independent measurements of the momentum and kinetic energy of electrons emitted from a β source. You will use these data
The Compton Effect. Martha Buckley MIT Department of Physics, Cambridge, MA (Dated: November 26, 2002)
") The Compton Effect Martha Buckley MIT Department of Physics, Cambridge, MA 02139 marthab@mit.edu (Dated: November 26, 2002) We measured the angular dependence of the energies of 661.6 kev photons scattered
The Compton Effect Martha Buckley MIT Department of Physics, Cambridge, MA 02139 marthab@mit.edu (Dated: November 26, 2002) We measured the angular dependence of the energies of 661.6 kev photons scattered
Rutherford experiment with MCA
 Rutherford experiment with MCA LEP Related topics Scattering, angle of scattering, impact parameter, central force, Coulomb field, Coulomb forces, Rutherford atomic model, identity of atomic number and
Figure 1. Decay Scheme for 60Co
 Department of Physics The University of Hong Kong PHYS3851 Atomic and Nuclear Physics PHYS3851- Laboratory Manual A. AIMS 1. To learn the coincidence technique to study the gamma decay of 60 Co by using
Absolute activity measurement
 Absolute activity measurement Gábor Veres, Sándor Lökös Eötvös University, Department of Atomic Physics January 12, 2016 Financed from the financial support ELTE won from the Higher Education Restructuring
Modern Physics Laboratory Beta Spectroscopy Experiment
 Modern Physics Laboratory Beta Spectroscopy Experiment Josh Diamond and John Cummings Fall 2009 Abstract In this experiment, electrons emitted as a result of the radioactive beta decay of 137 55 Cs are
"Neutron Flux Distribution"
 TECHNICAL UNIVERSITY DRESDEN Institute of Power Engineering Training Reactor Reactor Training Course Experiment "Neutron Flux Distribution" Instruction for Experiment Neutron Flux Distribution Content:
Physics 23 Fall 1989 Lab 5 - The Interaction of Gamma Rays with Matter
 Physics 23 Fall 1989 Lab 5 - The Interaction of Gamma Rays with Matter Theory The nuclei of radioactive atoms spontaneously decay in three ways known as alpha, beta, and gamma decay. Alpha decay occurs
Atomic and nuclear physics
 Atomic and nuclear physics X-ray physics Attenuation of x-rays LD Physics Leaflets P6.3.2.1 Investigating the attenuation of x-rays as a function of the absorber material and absorber thickness Objects
Rutherford Scattering
 Rutherford Scattering Today's understanding of the atom, as a structure whose positive charge and majority of mass are concentrated in a minute nucleus, is due to the α particle scattering experiments
The Mössbauer Effect
 Experimental Physics V85.0112/G85.2075 The Mössbauer Effect Spring, 2005 Tycho Sleator, David Windt, and Burton Budick Goals The main goal of this experiment is to exploit the Mössbauer effect to measure
CASSY Lab. Manual ( )
") CASSY Lab Manual (524 202) Moseley's law (K-line x-ray fluorescence) CASSY Lab 271 can also be carried out with Pocket-CASSY Load example Safety notes The X-ray apparatus fulfils all regulations on the
CASSY Lab Manual (524 202) Moseley's law (K-line x-ray fluorescence) CASSY Lab 271 can also be carried out with Pocket-CASSY Load example Safety notes The X-ray apparatus fulfils all regulations on the
SCINTILLATION DETECTORS AND PM TUBES
 SCINTILLATION DETECTORS AND PM TUBES General Characteristics Introduction Luminescence Light emission without heat generation Scintillation Luminescence by radiation Scintillation detector Radiation detector
Statistics of Radioactive Decay
 Statistics of Radioactive Decay Introduction The purpose of this experiment is to analyze a set of data that contains natural variability from sample to sample, but for which the probability distribution
Atomic and nuclear physics
 Atomic and nuclear physics Atomic shell Normal Zeeman effect LEYBOLD Physics Leaflets Observing the normal Zeeman effect in transverse and longitudinal Objects of the experiment Observing the line triplet
Science of Nuclear Energy and Radiation a Comprehensive Course for Science Teachers June 22-25, 1998 McMaster University
 Science of Nuclear Energy and Radiation a Comprehensive Course for Science Teachers June 22-25, 1998 McMaster University Notes to accompany Lab demonstrations by Barry Diacon, Technician, Department of
MASS ATTENUATION COEFFICIENT OF LEAD
 OBJECTIVE MASS ATTENUATION COEFFICIENT OF LEAD The objective of this experiment is to measure the mass attenuation coefficient of lead by manipulating Beer-Lambert s law of attenuation. INTRODUCTION Background
Chapter 4 Scintillation Detectors
 Med Phys 4RA3, 4RB3/6R03 Radioisotopes and Radiation Methodology 4-1 4.1. Basic principle of the scintillator Chapter 4 Scintillation Detectors Scintillator Light sensor Ionizing radiation Light (visible,
Absorption and Backscattering of β-rays
 Experiment #54 Absorption and Backscattering of β-rays References 1. B. Brown, Experimental Nucleonics 2. I. Kaplan, Nuclear Physics 3. E. Segre, Experimental Nuclear Physics 4. R.D. Evans, The Atomic
dn(t) dt where λ is the constant decay probability per unit time. The solution is N(t) = N 0 exp( λt)
 dt where λ is the constant decay probability per unit time. The solution is N(t) = N 0 exp( λt)") (Aug. 2011 revision) Physics 307 Laboratory Experiment #3 Probability Distributions and the Decay of Excited Quantum States Motivation: The purpose of this experiment is to introduce the student to counting
(Aug. 2011 revision) Physics 307 Laboratory Experiment #3 Probability Distributions and the Decay of Excited Quantum States Motivation: The purpose of this experiment is to introduce the student to counting
Overview: In this experiment we will study the decay of a radioactive nucleus, Cesium. Figure 1: The Decay Modes of Cesium 137
 Radioactivity (Part I and Part II) Objectives: To measure the absorption of beta and gamma rays To understand the concept of half life and to measure the half life of Ba 137* Apparatus: Radioactive source,
Foundations of Modern Physics by Tipler, Theory: The dierential equation which describes the population N(t) is. dn(t) dt.
 is. dn(t) dt.") (Sept. 2007 revision) Physics 307 Laboratory Experiment #3 Probability Distributions and the Decay of Excited Quantum States Motivation: The purpose of this experiment is to introduce the student to counting
(Sept. 2007 revision) Physics 307 Laboratory Experiment #3 Probability Distributions and the Decay of Excited Quantum States Motivation: The purpose of this experiment is to introduce the student to counting
Warsaw University of Technology, Faculty of Physics. Laboratory of Nuclear Physics & Technology. Compton effect
 Warsaw University of Technology, Faculty of Physics Laboratory of Nuclear Physics & Technology Compton effect Author: MSc. Eng. Dariusz Aksamit, Dariusz.Aksamit@pw.edu.pl, Faculty of Physics on the basis
X-RAY SPECTRA. Theory:
 12 Oct 18 X-ray.1 X-RAY SPECTRA In this experiment, a number of measurements involving x-rays will be made. The spectrum of x-rays emitted from a molybdenum target will be measured, and the experimental
Absorption and Backscattering ofβrays
 Experiment #54 Absorption and Backscattering ofβrays References 1. B. Brown, Experimental Nucleonics 2. I. Kaplan, Nuclear Physics 3. E. Segre, Experimental Nuclear Physics 4. R.D. Evans, The Atomic Nucleus
MEDICAL EQUIPMENT: NUCLEAR MEDICINE. Prof. Yasser Mostafa Kadah
 MEDICAL EQUIPMENT: NUCLEAR MEDICINE Prof. Yasser Mostafa Kadah www.k-space.org Recommended Textbook Introduction to Medical Imaging: Physics, Engineering and Clinical Applications, by Nadine Barrie Smith
THE GEIGER-MULLER TUBE AND THE STATISTICS OF RADIOACTIVITY
 GMstats. THE GEIGER-MULLER TUBE AN THE STATISTICS OF RAIOACTIVITY This experiment examines the Geiger-Muller counter, a device commonly used for detecting and counting ionizing radiation. Various properties
Nuclear Physics and Astrophysics
 Nuclear Physics and Astrophysics PHY-30 Dr. E. Rizvi Lecture 4 - Detectors Binding Energy Nuclear mass MN less than sum of nucleon masses Shows nucleus is a bound (lower energy) state for this configuration
Radioactivity and Ionizing Radiation
 Radioactivity and Ionizing Radiation QuarkNet summer workshop June 24-28, 2013 1 Recent History Most natural phenomena can be explained by a small number of simple rules. You can determine what these rules
CHARGED PARTICLE INTERACTIONS
 CHARGED PARTICLE INTERACTIONS Background Charged Particles Heavy charged particles Charged particles with Mass > m e α, proton, deuteron, heavy ion (e.g., C +, Fe + ), fission fragment, muon, etc. α is
Interaction of Ionizing Radiation with Matter
 Type of radiation charged particles photonen neutronen Uncharged particles Charged particles electrons (β - ) He 2+ (α), H + (p) D + (d) Recoil nuclides Fission fragments Interaction of ionizing radiation
GLOSSARY OF BASIC RADIATION PROTECTION TERMINOLOGY
 GLOSSARY OF BASIC RADIATION PROTECTION TERMINOLOGY ABSORBED DOSE: The amount of energy absorbed, as a result of radiation passing through a material, per unit mass of material. Measured in rads (1 rad
PARTICLES REVELATION THROUGH SCINTILLATION COUNTER
 14-25 JUNE 2004 SUMMER STAGE PARTICLES REVELATION THROUGH SCINTILLATION COUNTER by Flavio Cavalli and Marcello De Vitis Liceo Scientifico Statale Farnesina Tutor: Marco Mirazita 1) COSMIC RAYS - The Muons
III. Energy Deposition in the Detector and Spectrum Formation
 1 III. Energy Deposition in the Detector and Spectrum Formation a) charged particles Bethe-Bloch formula de 4πq 4 z2 e 2m v = NZ ( ) dx m v ln ln 1 0 2 β β I 0 2 2 2 z, v: atomic number and velocity of
Absorption of X-rays
 Absorption of X-rays TEP Related topics Bremsstrahlung, characteristic X-radiation, Bragg scattering, law of absorption, mass absorption coefficient, absorption edges, half-value thickness, photoelectric
RANGE OF ALPHAS. Advanced Laboratory, Physics 407 University of Wisconsin Madison, Wisconsin 53706
 (revised 10/20/10) RANGE OF ALPHAS Advanced Laboratory, Physics 407 University of Wisconsin Madison, Wisconsin 53706 Abstract A silicon solid state detector is used to measure the energy of alphas which
Gamma Ray Spectroscopy, Using NaI(Tl) Detectors. Department of Physics The University of Hong Kong
 Detectors. Department of Physics The University of Hong Kong") Count rate Modified by Data Ng Department of Physics The University of Hong Kong Physics Laboratory PHYS3851 Atomic and Nuclear Physics Experiment No. 3851-1 Gamma Ray Spectroscopy, Using NaI(Tl) Detector
Count rate Modified by Data Ng Department of Physics The University of Hong Kong Physics Laboratory PHYS3851 Atomic and Nuclear Physics Experiment No. 3851-1 Gamma Ray Spectroscopy, Using NaI(Tl) Detector
Quality Assurance. Purity control. Polycrystalline Ingots
 Quality Assurance Purity control Polycrystalline Ingots 1 Gamma Spectrometry Nuclide Identification Detection of Impurity Traces 1.1 Nuclides Notation: Atomic Mass Atomic Number Element Neutron Atomic
Photoelectric Effect Experiment
 Experiment 1 Purpose The photoelectric effect is a key experiment in modern physics. In this experiment light is used to excite electrons that (given sufficient energy) can escape from a material producing
Radioactivity APPARATUS INTRODUCTION PROCEDURE
 Radioactivity APPARATUS. Geiger Counter / Scaler. Cesium-7 sealed radioactive source. 0 pieces of paper. 8 aluminum plates. 0 lead plates 6. Graph paper - log-log and semi-log 7. Survey Meter ( unit for
This experiment is included in the XRP 4.0 X-ray solid state, XRS 4.0 X-ray structural analysis, and XRC 4.0 X-ray characteristics upgrade sets.
 The intensity of characteristic X-rays as a TEP Related topics Characteristic X-radiation, energy levels, Bragg s law, and intensity of characteristic X-rays Principle The X-ray spectrum of an X-ray tube
Lab NUC. Determination of Half-Life with a Geiger-Müller Counter
 Lab NUC Determination of Half-Life with a Geiger-Müller Counter Object: Apparatus: To understand the concept of half-life; to become familiar with the use of a Geiger-Müller counter; to determine the half-lives
DETECTORS. I. Charged Particle Detectors
 DETECTORS I. Charged Particle Detectors A. Scintillators B. Gas Detectors 1. Ionization Chambers 2. Proportional Counters 3. Avalanche detectors 4. Geiger-Muller counters 5. Spark detectors C. Solid State
BETA-RAY SPECTROMETER
 14 Sep 07 β-ray.1 BETA-RAY SPECTROMETER In this experiment, a 180, constant-radius magnetic spectrometer consisting of an electromagnet with a Geiger-Muller detector, will be used to detect and analyze
Radiation Detection. Laboratory & Computational Physics 2. Last compiled March 2, Constructed from legacy notes with amendments by Innes Bigaran
 Radiation Detection Laboratory & Computational Physics 2 Last compiled March 2, 2018 Constructed from legacy notes with amendments by Innes Bigaran 1 Contents 1 Introduction 3 1.1 Prelab questions...............................
Multi Channel Analyzer (MCA) Analyzing a Gamma spectrum
 Analyzing a Gamma spectrum") Multi Channel Analyzer (MCA) Analyzing a Gamma spectrum Objective: Using the MCA to acquire spectrums for different gamma sources and to identify an unknown source from its spectrum, furthermore to investigate
Multi Channel Analyzer (MCA) Analyzing a Gamma spectrum Objective: Using the MCA to acquire spectrums for different gamma sources and to identify an unknown source from its spectrum, furthermore to investigate
Basic physics Questions
 Chapter1 Basic physics Questions S. Ilyas 1. Which of the following statements regarding protons are correct? a. They have a negative charge b. They are equal to the number of electrons in a non-ionized
PHYS 3650L - Modern Physics Laboratory
 PHYS 3650L - Modern Physics Laboratory Laboratory Advanced Sheet Photon Attenuation 1. Objectives. The objectives of this laboratory exercise are: a. To measure the mass attenuation coefficient at a gamma
Quantitative Assessment of Scattering Contributions in MeV-Industrial X-ray Computed Tomography
 11th European Conference on Non-Destructive Testing (ECNDT 2014), October 6-10, 2014, Prague, Czech Republic More Info at Open Access Database www.ndt.net/?id=16530 Quantitative Assessment of Scattering
AN34 Experiments in Nuclear Science Laboratory Manual Fourth Edition
 AN34 Experiments in Nuclear Science Laboratory Manual Fourth Edition Experiment IV-3 Gamma-Ray Spectroscopy Using NaI(Tl) Introduction The purpose of this experiment is to acquaint the student with some
Atomic Spectra HISTORY AND THEORY
 Atomic Spectra HISTORY AND THEORY When atoms of a gas are excited (by high voltage, for instance) they will give off light. Each element (in fact, each isotope) gives off a characteristic atomic spectrum,
Radioactivity. Lecture 6 Detectors and Instrumentation
 Radioactivity Lecture 6 Detectors and Instrumentation The human organs Neither humans nor animals have an organ for detecting radiation from radioactive decay! We can not hear it, smell it, feel it or
E. K. A. ADVANCED PHYSICS LABORATORY STATISTICS OF COUNTING WITH A GEIGER COUNTER ARTIFICIAL RADIOACTIVITY
 E. K. A. ADVANCED PHYSICS LABORATORY STATISTICS OF COUNTING WITH A GEIGER COUNTER ARTIFICIAL RADIOACTIVITY 1. INTRODUCTION The Geiger Müller (GM tube) detector for ionizing particles operates on the principle
Radiation Detection for the Beta- Delayed Alpha and Gamma Decay of 20 Na. Ellen Simmons
 Radiation Detection for the Beta- Delayed Alpha and Gamma Decay of 20 Na Ellen Simmons 1 Contents Introduction Review of the Types of Radiation Charged Particle Radiation Detection Review of Semiconductor
RANGE OF ALPHA PARTICLES
 23 Sep 08 Alpha.1 RANGE OF ALPHA PARTICLES The range of a charged particle in an absorber provides a measure of its energy. In this experiment, the range in air, and energy, of the alpha particles emitted
Gamma-ray spectroscopy with the scintillator/photomultiplierand with the high purity Ge detector: Compton scattering, photoeffect, and pair production
 Experiment N2: Gamma-ray spectroscopy with the scintillator/photomultiplierand with the high purity Ge detector: Compton scattering, photoeffect, and pair production References: 1. Experiments in Nuclear
Experiment Radioactive Decay of 220 Rn and 232 Th Physics 2150 Experiment No. 10 University of Colorado
 Experiment 10 1 Introduction Radioactive Decay of 220 Rn and 232 Th Physics 2150 Experiment No. 10 University of Colorado Some radioactive isotopes formed billions of years ago have half- lives so long
XRF books: Analytical Chemistry, Kellner/Mermet/Otto/etc. 3 rd year XRF Spectroscopy Dr. Alan Ryder (R222, Physical Chemistry) 2 lectures:
 2 lectures:") 1 3 rd year XRF Spectroscopy Dr. Alan Ryder (R222, Physical Chemistry) 2 lectures: XRF spectroscopy 1 exam question. Notes on: www.nuigalway.ie/nanoscale/3rdspectroscopy.html XRF books: Analytical Chemistry,
1 3 rd year XRF Spectroscopy Dr. Alan Ryder (R222, Physical Chemistry) 2 lectures: XRF spectroscopy 1 exam question. Notes on: www.nuigalway.ie/nanoscale/3rdspectroscopy.html XRF books: Analytical Chemistry,
X-ray absorption. 4. Prove that / = f(z 3.12 ) applies.
 applies.") Related topics Bremsstrahlung, characteristic radiation, Bragg scattering, law of absorption, mass absorption coefficient, absorption edge, half-value thickness, photoelectric effect, Compton scattering,
Related topics Bremsstrahlung, characteristic radiation, Bragg scattering, law of absorption, mass absorption coefficient, absorption edge, half-value thickness, photoelectric effect, Compton scattering,
QuantumMCA QuantumNaI QuantumGe QuantumGold
 QuantumMCA QuantumNaI QuantumGe QuantumGold Berkeley Nucleonics Corporation (San Rafael, CA) and Princeton Gamma Tech (Princeton, NJ) have partnered to offer gamma spectroscopy with either germanium or
CHAPTER 3 The Experimental Basis of Quantum Theory
 CHAPTER 3 The Experimental Basis of Quantum Theory 3.1 3.2 3.3 3.4 3.5 3.6 3.7 3.8 3.9 Discovery of the X Ray and the Electron Determination of Electron Charge Line Spectra Quantization As far as I can
U n 3 n Ba Kr (D) Br (C) Kr (B) Rb (E) 94 37
 Br (C) Kr (B) Rb (E) 94 37") 1984 36. The critical angle for a transparent material in air is 30. The index of refraction of the material is most nearly (A) 0.33 (B) 0.50 (C) 1.0 (D) 1.5 (E) 2.0 37. An object is placed as shown in
1984 36. The critical angle for a transparent material in air is 30. The index of refraction of the material is most nearly (A) 0.33 (B) 0.50 (C) 1.0 (D) 1.5 (E) 2.0 37. An object is placed as shown in
X-ray spectroscopy: Experimental studies of Moseley s law (K-line x-ray fluorescence) and x-ray material s composition determination
 and x-ray material s composition determination") Uppsala University Department of Physics and Astronomy Laboratory exercise X-ray spectroscopy: Experimental studies of Moseley s law (K-line x-ray fluorescence) and x-ray material s composition determination
Uppsala University Department of Physics and Astronomy Laboratory exercise X-ray spectroscopy: Experimental studies of Moseley s law (K-line x-ray fluorescence) and x-ray material s composition determination
Name :. Roll No. :... Invigilator s Signature :.. CS/B. Tech (New)/SEM-1/PH-101/ PHYSICS-I
/SEM-1/PH-101/ PHYSICS-I") Name :. Roll No. :..... Invigilator s Signature :.. CS/B. Tech (New)/SEM-1/PH-101/2011-12 2011 PHYSICS-I Time Allotted : 3 Hours Full Marks : 70 The figures in the margin indicate full marks. Candidates
Name :. Roll No. :..... Invigilator s Signature :.. CS/B. Tech (New)/SEM-1/PH-101/2011-12 2011 PHYSICS-I Time Allotted : 3 Hours Full Marks : 70 The figures in the margin indicate full marks. Candidates
Applied Nuclear Physics (Fall 2006) Lecture 21 (11/29/06) Detection of Nuclear Radiation: Pulse Height Spectra
 Lecture 21 (11/29/06) Detection of Nuclear Radiation: Pulse Height Spectra") 22.101 Applied Nuclear Physics (Fall 2006) Lecture 21 (11/29/06) Detection of Nuclear Radiation: Pulse Height Spectra References: W. E. Meyerhof, Elements of Nuclear Physics (McGraw-Hill, New York, 1967),
22.101 Applied Nuclear Physics (Fall 2006) Lecture 21 (11/29/06) Detection of Nuclear Radiation: Pulse Height Spectra References: W. E. Meyerhof, Elements of Nuclear Physics (McGraw-Hill, New York, 1967),
print first name print last name print student id grade
 print first name print last name print student id grade Experiment 2 X-ray fluorescence X-ray fluorescence (XRF) and X-ray diffraction (XRD) may be used to determine the constituent elements and the crystalline
SECTION A Quantum Physics and Atom Models
 AP Physics Multiple Choice Practice Modern Physics SECTION A Quantum Physics and Atom Models 1. Light of a single frequency falls on a photoelectric material but no electrons are emitted. Electrons may