Astronomy 102 Lab: Distance to the Pleiades
|
|
|
- Franklin Adams
- 6 years ago
- Views:
Transcription
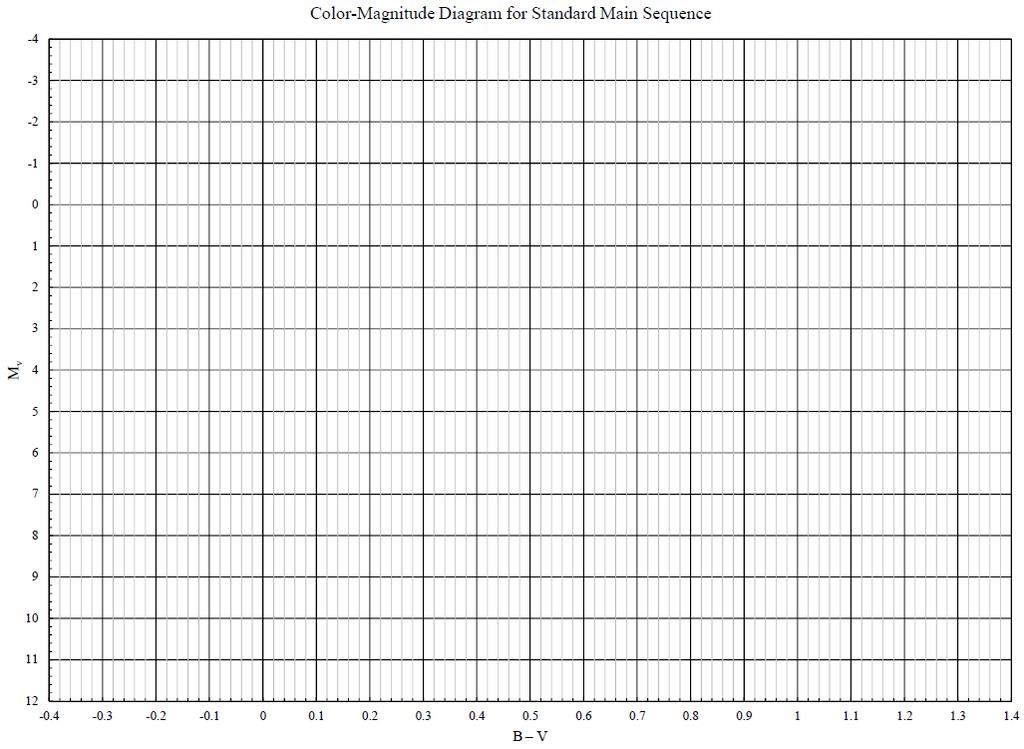
1 Name: Astronomy 102 Lab: Distance to the Pleiades Please bring your textbook to class. Use a pencil when plotting the points on the graphs. Pre-Lab Assignment: From the planetarium, you know the Pleiades is a little group in the constellation Taurus of about seven stars, hence it is often called the "Seven Sisters." However, the full Pleiades cluster contains hundreds of stars and is what is known as an open cluster. In this lab, you will make an H-R diagram for part of the Pleiades cluster and use it to find the distance to the cluster. Answer these questions before coming to lab. A) What is an "H-R diagram?" What is its purpose? B) In a sentence, describe a star that would sit in the upper right hand corner of the H-R diagram. What would it look like? Do the same for a star in the lower left hand section of the diagram. In the lab, you will be calculating the distance, d, in parsecs to the Pleiades using the apparent and absolute visual magnitudes of the stars, m VV and M VV respectively. You can use the following equation only if you know how to use logarithms. log 10 d = [(m VV M VV ) + 5] 5 If not, please use the table you used in the last lab. Remember that the distance modulus equals the difference between the two magnitudes, m VV M VV. C) Let's say that m VV is +2 and M VV is -3. What is the distance to the star in parsecs? D) Let's say that the distance to another star is 350 parsecs. If the apparent magnitude is 10, what is the absolute magnitude? Introduction: An open star cluster consists of a few hundred stars of common age and origin, loosely held together by mutual gravitation and moving together through space. They are usually located in the main disk of the galaxy, in or near the spiral arms. The distance to one such cluster, the Pleiades, can be found by first plotting a color-magnitude diagram for the cluster, and then fitting the data from this graph to a standard H-R diagram, where the absolute magnitudes are plotted.
2 Basic Data: Table #1 lists two properties for many of the stars in the Pleiades cluster. The "Eggen Number" refers to a system for identifying the stars, mpg is the blue or "photographic magnitude," and mv is the "visual magnitude." The color index is the blue magnitude minus the visual magnitude, or (m pppp m VV ), which works in the same way as spectral type in determining the surface temperature (and the color) of a star. This information is like that obtained by Hertzsprung and Russell for stars near the Sun. There are no units on magnitude. If you recall from the spectra section of class, a star's color tells you the temperature of the star. However, the color we see is a mixture of many colors. This method of using blue magnitudes and red magnitudes is a way of determining what color the star will appear to the naked eye. Remember that magnitudes are arranged such that a low number denotes a bright object. If the blue magnitude is small and the red magnitude is large, that means that the object is bright in blue and dim in red; it will appear bluish to the naked eye. Similarly, a star with a high blue magnitude and low red magnitude will appear reddish to the naked eye. Thus, in the colormagnitude and main sequence plots, the bottom axis is arranged in the same way you are used to seeing for the H-R diagram; hot stars will be on the left and cool stars will be on the right. Table #2 lists the color index (B V or blue magnitude minus visual magnitude) and absolute magnitude (M VV ) for a representative set of stars on the main sequence. We will compare this whole set to the Pleiades stars, but each row does not correspond to the Eggen numbers listed in the Pleiades set. Table 1: Colors and Magnitudes for the Pleiades Eggen Number m pppp m VV m VV Eggen Number m pppp m VV mm VV Table 2: Standard Main Sequence # B V M VV # B V M VV Reduction: Plot (in pencil) a color-magnitude diagram for the Pleiades using the data in table #1. Label each of the points with the Eggen number. Note that magnitudes increase going down on the graph. Be careful to watch the signs of the color index values and consider that is less than 0.1. You may prefer to round the color index values to the nearest 0.01 before plotting them, e.g rounds to If you plotted correctly, your points should appear to make a smooth curve. 1. (four answers) Based on the stars' positions in your color-magnitude diagram, which star (use its Eggen number) is the hottest? Which star is the coolest? Which is the brightest? Which is the dimmest? 2. If the Pleiades are all main sequence stars, which one is the most massive? How can you tell? (Hint: Check the figure in Section 18.2 of the text. Measuring-Stellar-Masses#OSC_Astro_18_02_Mass)
3 3A. Estimate the color index and the visual magnitude for a red giant that would be in the Pleiades. 3B. Estimate the color index and the visual magnitude for a white dwarf that would be in the Pleiades. Plot (in pencil) an H-R diagram for the standard stars given in table #2. Label each of the points with the number in the first column. These points should form a smoother curve than the Pleiades data. Draw a line through these points. 4. The Sun, a main sequence star, has an absolute magnitude of Estimate its color index using the values in Table Based on the color index, compare the temperature of the Sun to those of the Pleiades. 6. Estimate the visual magnitude for a Sun-like star if it were in the Pleiades. Place the color-magnitude diagram of the Pleiades over the standard main sequence on the light table and align the color index scales at the bottom. Keeping these scales aligned, slide the top graph up or down until the color-magnitude data points best overlay the standard main sequence curve. Each value of m VV on one graph has a corresponding value of M VV on the other graph. The difference between those values, m VV M VV, will be the same throughout the H-R diagram. The easiest way to determine m VV M VV is to find M VV = 0 on the axis. Then determine what value of m VV is above that point. Since m VV 0 = m VV, the value of m VV M VV will give you the distance modulus. 7. m VV M VV = Use the m M vs. distance chart you used in the Properties of Stars lab to determine the distance in both parsecs and light-years. Remember that one parsec corresponds to 3.26 light-years Distance to the Pleiades (in parsecs): 9. Distance to the Pleiades (in light-years): Calculating percent errors: Percent errors are calculated using the following equation: accepted value measured value % error = 100 accepted value It's probably easiest to break it up into three steps. Follow these steps to calculate a percent error. 1. Take the accepted value and subtract the measured value. 2. Take the answer from step 1 and divide it by the accepted value. 3. Multiply the answer from step 2 by 100.
4 For example, let's say that a quantity has an accepted value or 320 and a measured value of 280. The percent error would be: = = = 12.5% The accepted value for the distance to the Pleiades is 135 parsecs. Calculate a percent error for your distance determination. 10. Percent error for Pleiades distance: 11. What could be done to decrease the error in the method? The brightest star in the Pleiades cluster is called Alcyone whose apparent magnitude is 2.86 and spectral class is B7. Use the tables you used in the last lab to answer the following questions. Don't use information you can find online to get these answers because the data provided will yield different results Estimate the temperature of Alcyone. 13. Given the distance you calculated for the Pleiades, what is Alcyone's absolute magnitude? (Hint: check what you did in the pre-lab.) 14. What is the luminosity of Alcyone, in terms of the Sun? Optional: There is an expression that relates luminosity and temperature to the size of the star. L = 4ππR 2 σσt 4 In the equation, L is luminosity, R is the star's radius in centimeters, T is the star's temperature in Kelvin, π is 3.14, and σ is a constant that's equal to The number you wrote above for the luminosity of Alcyone is in terms of the luminosity of the Sun. Multiply that value by to get the luminosity of Alcyone in the proper units. What is Alcyone's radius in centimeters? Show your work on scratch paper, which can be provided upon request. I recommend algebraically solving for R before doing any calculations. The Sun's radius is 70,000,000,000 cm or cm. How does this compare to the radius of Alcyone? Calculate the ratio of the sizes of the stars by dividing Alcyone's radius by the Sun's radius.
5
6
7
OPEN CLUSTER PRELAB The first place to look for answers is in the lab script!
 NAME: 1. Define using complete sentences: Globular Cluster: OPEN CLUSTER PRELAB The first place to look for answers is in the lab script! Open Cluster: Main Sequence: Turnoff point: Answer the following
Daily Science 04/04/2017
 Daily Science 04/04/2017 Which statement best describes the difference between type A stars and type B stars as shown in the diagram? a. Type A stars burn for a shorter amount of time than type B stars.
( ) = 5log pc NAME: OPEN CLUSTER PRELAB
 = 5log pc NAME: OPEN CLUSTER PRELAB") NAME: OPEN CLUSTER PRELAB 1. Read over the material in the lab script that discusses the background of colormagnitude (CM) diagrams (these can also be called H-R diagrams). Explain the CM diagram: What
NAME: OPEN CLUSTER PRELAB 1. Read over the material in the lab script that discusses the background of colormagnitude (CM) diagrams (these can also be called H-R diagrams). Explain the CM diagram: What
OPEN CLUSTERS LAB. I. Introduction: II. HR Diagram NAME:
 NAME: OPEN CLUSTERS LAB What will you learn in this Lab? An open cluster is a group of stars that were born at the same time and can be studied to determine both the distance and age of the member stars
Guiding Questions. Measuring Stars
 Measuring Stars Guiding Questions 1. How far away are the stars? 2. What is meant by a first-magnitude or second magnitude star? 3. Why are some stars red and others blue? 4. What are the stars made of?
The Hertzsprung-Russell Diagram
 The Hertzsprung-Russell Diagram Name: Date: 1 Introduction As you may have learned in class, the Hertzsprung-Russell Diagram, or the HR diagram, is one of the most important tools used by astronomers:
Characterizing Stars
 Characterizing Stars 1 Guiding Questions 1. How far away are the stars? 2. What evidence do astronomers have that the Sun is a typical star? 3. What is meant by a first-magnitude or second magnitude star?
Characterizing Stars. Guiding Questions. Parallax. Careful measurements of the parallaxes of stars reveal their distances
 Guiding Questions Characterizing Stars 1. How far away are the stars? 2. What evidence do astronomers have that the Sun is a typical star? 3. What is meant by a first-magnitude or second magnitude star?
Stars: Stars and their Properties
 Stars: Stars and their Properties Astronomy 110 Class 10 WHEN I heard the learn d astronomer; When the proofs, the figures, were ranged in columns before me; When I was shown the charts and the diagrams,
Hertzprung-Russel and colormagnitude. ASTR320 Wednesday January 31, 2018
 Hertzprung-Russel and colormagnitude diagrams ASTR320 Wednesday January 31, 2018 H-R diagram vs. Color- Magnitude Diagram (CMD) H-R diagram: Plot of Luminosity vs. Temperature CMD: Plot of magnitude vs.
The Hertzsprung-Russell Diagram and Stellar Evolution
 The Hertzsprung-Russell Diagram and Stellar Evolution Names: The H-R Diagram and Stellar Properties Activity 1. In which corner of the diagram (upper right, upper left, lower right, or lower left) would
Types of Stars and the HR diagram
 Types of Stars and the HR diagram Full window version (looks a little nicer). Click button to get back to small framed version with content indexes. This material (and images) is copyrighted! See
Hertzsprung-Russel Diagrams and Distance to Stars
 Chapter 10 Hertzsprung-Russel Diagrams and Distance to Stars 10.1 Purpose In this lab, we will explore how astronomer classify stars. This classificatin one way that can be used to determine the distance
Universe. Tenth Edition. The Nature of the Stars. Parallax. CHAPTER 17 The Nature of Stars
 Universe Tenth Edition The Nature of the Stars Roger A. Freedman, Robert M. Geller, William J. Kaufmann III CHAPTER 17 The Nature of Stars W. H. Freeman and Company Parallax Careful measurements of the
Question: How do we use a Hertzsprung-Russell Diagram to explain star characteristics?
 The Hertzsprung-Russell Diagram Assignment Introduction: The development of the H-R Diagram began with Danish astronomer Ejnar Hertzsprung who began plotting the stars around 1911. American astronomer
COLOR MAGNITUDE DIAGRAMS
 COLOR MAGNITUDE DIAGRAMS What will you learn in this Lab? This lab will introduce you to Color-Magnitude, or Hertzsprung-Russell, Diagrams: one of the most useful diagnostic tools developed in 20 th century
Lecture Outlines. Chapter 17. Astronomy Today 8th Edition Chaisson/McMillan Pearson Education, Inc.
 Lecture Outlines Chapter 17 Astronomy Today 8th Edition Chaisson/McMillan Chapter 17 Measuring the Stars Units of Chapter 17 17.1 The Solar Neighborhood 17.2 Luminosity and Apparent Brightness 17.3 Stellar
ASTR Look over Chapter 15. Good things to Know. Triangulation
 ASTR 1020 Look over Chapter 15 Good things to Know Triangulation Parallax Parsecs Absolute Visual Magnitude Distance Modulus Luminosity Balmer Lines Spectral Classes Hertzsprung-Russell (HR) diagram Main
a. Star A c. The two stars are the same distance b. Star B d. Not enough information
 Name: Astro 102 S17 Test 1 Multiple Choice Identify the choice that best completes the statement or answers the question. 1. Your test is Version A. Please fill in the circle for A for this question on
Interpreting the HR diagram of stellar clusters
 Interpreting the HR diagram of stellar clusters Stars are created deep within giant molecular clouds. When we look at such regions, we often see not just one, but a whole bunch of stars forming together.
Lab 8: Stellar Classification and the H-R Diagram
 Name: Section: Date: Lab 8: Stellar Classification and the H-R Diagram 1 Introduction Stellar Classification As early as the beginning of the 19th century, scientists have studied absorption spectra in
Measuring Radial & Tangential Velocity. Radial velocity measurement. Tangential velocity measurement. Measure the star s Doppler shift
 17. The Nature of the Stars Parallax reveals stellar distance Stellar distance reveals luminosity Luminosity reveals total energy production The stellar magnitude scale Surface temperature determines stellar
Review Chapter 10. 2) A parsec is slightly more than 200,000 AU. 2)
 A parsec is slightly more than 200,000 AU. 2)") Review Chapter 10 TRUE/FALSE. Write 'T' if the statement is true and 'F' if the statement is false. 1) A parsec is about 3.3 light-years. 1) 2) A parsec is slightly more than 200,000 AU. 2) 3) The nearest
Review Chapter 10 TRUE/FALSE. Write 'T' if the statement is true and 'F' if the statement is false. 1) A parsec is about 3.3 light-years. 1) 2) A parsec is slightly more than 200,000 AU. 2) 3) The nearest
The Hertzprung-Russell Diagram. The Hertzprung-Russell Diagram. Question
 Key Concepts: Lecture 21: Measuring the properties of stars (cont.) The Hertzsprung-Russell (HR) Diagram (L versus T) The Hertzprung-Russell Diagram The Stefan-Boltzmann Law: flux emitted by a black body
Astronomy 113. Dr. Joseph E. Pesce, Ph.D. Dr. Joseph E. Pesce, Ph.D.
 Astronomy 113 Dr. Joseph E. Pesce, Ph.D. The Nature of Stars 8-2 Parallax For nearby stars - measure distances with parallax July 1 AU d p A A A January ³ d = 1/p (arcsec) [pc] ³ 1pc when p=1arcsec; 1pc=206,265AU=3
Chapter 15 Surveying the Stars Pearson Education, Inc.
 Chapter 15 Surveying the Stars 15.1 Properties of Stars Our goals for learning: How do we measure stellar luminosities? How do we measure stellar temperatures? How do we measure stellar masses? 1. How
Chapter 15 Surveying the Stars Properties of Stars
 Chapter 15 Surveying the Stars 15.1 Properties of Stars Our goals for learning: How do we measure stellar luminosities? How do we measure stellar temperatures? How do we measure stellar masses? Luminosity:
Chapter 15 Surveying the Stars
 Chapter 15 Surveying the Stars 15.1 Properties of Stars Our goals for learning How do we measure stellar luminosities? How do we measure stellar temperatures? How do we measure stellar masses? How do we
Imagine the Universe: Life Cycle of Stars
 Objective: To explore the similarities of stars through a Hertzsprung-Russell diagram. Grade Level: 9-12 Subject(s): Space Science Prep Time: < 10 minutes Duration: 30 minutes Materials Category: None
Properties of Stars & H-R Diagram
 Properties of Stars & H-R Diagram What is a star? A cloud of gas, mainly hydrogen and helium The core is so hot/dense that nuclear fusion can occur. The fusion converts light nuclei (elements) into heavier
Chapter 15: Surveying the Stars
 Chapter 15 Lecture Chapter 15: Surveying the Stars Surveying the Stars 15.1 Properties of Stars Our goals for learning: How do we measure stellar luminosities? How do we measure stellar temperatures? How
INSIDE LAB 8: Plotting Stars on the Hertzsprung- Russell Diagram
 INSIDE LAB 8: Plotting Stars on the Hertzsprung- Russell Diagram OBJECTIVE: To become familiar with the Hertzsprung-Russell diagram and the method of spectroscopic parallax. DISCUSSION: The Hertzsprung-Russell
The Cosmic Perspective. Surveying the Properties of Stars. Surveying the Stars. How do we measure stellar luminosities?
 Surveying the Stars Chapter 15 Lecture The Cosmic Perspective 15.1 Properties of Stars Our goals for learning: How do we measure stellar luminosities? How do we measure stellar temperatures? How do we
Exercise 8: Intensity and distance (and color) The method of standard candles and the inverse-square law of brightness
 The method of standard candles and the inverse-square law of brightness") Astronomy 100 Names: Exercise 8: Intensity and distance (and color) The method of standard candles and the inverse-square law of brightness From everyday experience you know that light sources become brighter
Astronomy 100 Names: Exercise 8: Intensity and distance (and color) The method of standard candles and the inverse-square law of brightness From everyday experience you know that light sources become brighter
ASTR-1020: Astronomy II Course Lecture Notes Section III
 ASTR-1020: Astronomy II Course Lecture Notes Section III Dr. Donald G. Luttermoser East Tennessee State University Edition 4.0 Abstract These class notes are designed for use of the instructor and students
Determining the Properties of the Stars
 Determining the Properties of the Stars This set of notes by Nick Strobel covers: The properties of stars--their distances, luminosities, compositions, velocities, masses, radii, and how we determine those
Lecture 26 The Hertzsprung- Russell Diagram January 13b, 2014
 1 Lecture 26 The Hertzsprung- Russell Diagram January 13b, 2014 2 Hertzsprung-Russell Diagram Hertzsprung and Russell found a correlation between luminosity and spectral type (temperature) 10000 Hot, bright
LAB: Star Classification
 Name: LAB: Star Classification INTRODUCTION: Like most scientists, astronomers like to categorize the Universe around them, and stars are no exception. Here s how astronomers classify stars into different
Measuring Radial & Tangential Velocity. Radial velocity measurement. Tangential velocity measurement. Measure the star s Doppler shift
 17. The Nature of the Stars Parallax reveals stellar distance Stellar distance reveals luminosity Luminosity reveals total energy production The stellar magnitude scale Surface temperature determines stellar
Beyond Our Solar System Chapter 24
 Beyond Our Solar System Chapter 24 PROPERTIES OF STARS Distance Measuring a star's distance can be very difficult Stellar parallax Used for measuring distance to a star Apparent shift in a star's position
The Hertzsprung-Russell Diagram
 The Hertzsprung-Russell Diagram VIREO Virtual Educational Observatory Aims To use the observational + analysis tools of modern astronomy To use the setup that professional astronomers use at large telescopes
Stars and Galaxies. The Sun and Other Stars
 CHAPTER 22 Stars and Galaxies LESSON 2 The Sun and Other Stars What do you think? Read the two statements below and decide whether you agree or disagree with them. Place an A in the Before column if you
A1101, Lab 8: Distances and Ages of Star Clusters Lab Worksheet
 Student Name: Lab Partner Name: Lab TA Name: Background A1101, Lab 8: Distances and Ages of Star Clusters Lab Worksheet Here are a few important things to remember about stellar evolution and star clusters
EVOLUTION OF STARS HERTZSPRUNG-RUSSELL DIAGRAM
 VISUAL PHYSICS ONLINE EVOLUTION OF STARS HERTZSPRUNG-RUSSELL DIAGRAM The total power radiated by a star is called its intrinsic luminosity L (luminosity). The apparent brightness (apparent luminosity)
ASTRO 1050 LAB #8: The Seven Sisters, and Lives of the Stars
 ASTRO 1050 LAB #8: The Seven Sisters, and Lives of the Stars ABSTRACT There is a conspicuous nest of stars, or star cluster, in the winter and spring sky called the Pleiades, or Seven Sisters. By plotting
The Family of Stars. Chapter 13. Triangulation. Trigonometric Parallax. Calculating Distance Using Parallax. Calculating Distance Using Parallax
 The Family of Stars Chapter 13 Measuring the Properties of Stars 1 Those tiny glints of light in the night sky are in reality huge, dazzling balls of gas, many of which are vastly larger and brighter than
PENN STATE ASTRONOMY LABORATORY #10
 PENN STATE ASTRONOMY LABORATORY #10 THE LIVES OF THE STARS I. Objective In the labs you have done so far, you have examined the physical properties and classifications of stars. All of these properties
Pr P ope p rti t es s of o f St S a t rs
 Properties of Stars Distances Parallax ( Triangulation ): - observe object from two separate points - use orbit of the Earth (1 AU) - measure angular shift of object - angle depends on distance to object
TWINKLE, TWINKLE LITTLE STAR HOW ASTRONOMERS KNOW WHAT YOU ARE. View the white lights in the room with the diffraction glasses. What do you see?
 Name Partner(s) Section Date TWINKLE, TWINKLE LITTLE STAR HOW ASTRONOMERS KNOW WHAT YOU ARE Since journeys to the stars are not possible at this time, astronomers use every source of information available
Astronomy-part 3 notes Properties of Stars
 Astronomy-part 3 notes Properties of Stars What are Stars? Hot balls of that shine because nuclear fusion (hydrogen to helium) is happening at their cores. They create their own. Have different which allow
A1101, Lab 5: The Hertzsprung- Russell Diagram Laboratory Worksheet
 Student Name: Lab TA Name: A1101, Lab 5: The Hertzsprung- Russell Diagram Laboratory Worksheet One of the most basic physical properties of a star is its luminosity, the rate at which it radiates energy
HOMEWORK - Chapter 17 The Stars
 Astronomy 20 HOMEWORK - Chapter 7 The Stars Use a calculator whenever necessary. For full credit, always show your work and explain how you got your answer in full, complete sentences on a separate sheet
Star Clusters. stars are usually near other stars - CLUSTER
 Stellar Evolution 90% of its lifetime: star converts Hydrogen to Helium p-p cycle Main Sequence Helium builds up in the core, but not yet burning gravity compresses which increases temperature helium starts
Chapter 15 Lecture. The Cosmic Perspective Seventh Edition. Surveying the Stars Pearson Education, Inc.
 Chapter 15 Lecture The Cosmic Perspective Seventh Edition Surveying the Stars 15.1 Properties of Stars Our goals for learning: How do we measure stellar luminosities? How do we measure stellar temperatures?
Hertzsprung-Russell Diagram
 Hertzsprung-Russell Diagram Objectives: To learn what a Hertzsprung-Russell Diagram is, what its major regions represent, and how to construct such a diagram. To study the evolution of star clusters. Equipment:
Review Questions for the new topics that will be on the Final Exam
 Review Questions for the new topics that will be on the Final Exam Be sure to review the lecture-tutorials and the material we covered on the first three exams. How does speed differ from velocity? Give
5. A particular star has an angle of parallax of 0.2 arcsecond. What is the distance to this star? A) 50 pc B) 2 pc C) 5 pc D) 0.
 50 pc B) 2 pc C) 5 pc D) 0.") Name: Date: 1. How far away is the nearest star beyond the Sun, in parsecs? A) between 1 and 2 pc B) about 12 pc C) about 4 pc D) between 1/2 and 1 pc 2. Parallax of a nearby star is used to estimate its
Name: Date: 1. How far away is the nearest star beyond the Sun, in parsecs? A) between 1 and 2 pc B) about 12 pc C) about 4 pc D) between 1/2 and 1 pc 2. Parallax of a nearby star is used to estimate its
PH104 Lab 5 Stellar Classification Pre-Lab
 Name: Lab Time: 1 PH104 Lab 5 Stellar Classification Pre-Lab 5.1 Goals This is a series of labs designed to help is in understanding the nature and lives of stars. There are 3 total labs in this sequence.
Earth in Space. Stars, Galaxies, and the Universe
 Earth in Space Stars, Galaxies, and the Universe Key Concepts What are stars? How does the Sun compare to other stars? Where is Earth located in the universe? How is the universe structured? What do you
The Hertzsprung Russell Diagram. The Main Sequence
 The Hertzsprung Russell Diagram H R diagram plots stellar luminosity against surface temperature Luminosity ranges 10-4 10 4 L. Temperature ranges by a factor of 10 increases to the left spectral sequence
PHYS133 Lab 7 The HR Diagram
 PHYS133 Lab 7 Goals: Measure brightness of various stars in the Pleiades star cluster in two different wavelength bands. Create an HR diagram based on the data taken. Use the distance modulus to determine
HR Diagram Lab. Area 1 Area 4. Area 5. Area 2. Area 6 Area 3
 Name / 65 pts HR Diagram Lab Introduction Some of the greatest advances concerning the nature of stars have come about by comparing their properties using graphs. In the early 1900 s, while studying the
ASTRONOMY QUIZ NUMBER 11
 ASTRONOMY QUIZ NUMBER. Suppose you measure the parallax of a star and find 0. arsecond. The distance to this star is A) 0 light-years B) 0 parsecs C) 0. light-year D) 0. parsec 2. A star is moving toward
Exercise 4: Intensity and distance (and color) The method of standard candles and the inverse-square law of brightness
 The method of standard candles and the inverse-square law of brightness") Astronomy 100 Names: Exercise 4: Intensity and distance (and color) The method of standard candles and the inverse-square law of brightness From everyday experience you know that light sources become brighter
Astronomy 100 Names: Exercise 4: Intensity and distance (and color) The method of standard candles and the inverse-square law of brightness From everyday experience you know that light sources become brighter
My God, it s full of stars! AST 248
 My God, it s full of stars! AST 248 N * The number of stars in the Galaxy N = N * f s f p n h f l f i f c L/T The Galaxy M31, the Andromeda Galaxy 2 million light years from Earth The Shape of the Galaxy
Assignments for Monday Oct. 22. Read Ch Do Online Exercise 10 ("H-R Diagram" tutorial)
") Assignments for Monday Oct. 22 Read Ch. 13 + Do Online Exercise 10 ("H-R Diagram" tutorial) Luminosity passing through each sphere is the same. Area of sphere: 4π(radius) 2 Divide luminosity by area to
Assignments for Monday Oct. 22 Read Ch. 13 + Do Online Exercise 10 ("H-R Diagram" tutorial) Luminosity passing through each sphere is the same. Area of sphere: 4π(radius) 2 Divide luminosity by area to
Astro 301/ Fall 2006 (50405) Introduction to Astronomy
 Introduction to Astronomy") Astro 301/ Fall 2006 (50405) Introduction to Astronomy http://www.as.utexas.edu/~sj/a301-fa06 Instructor: Professor Shardha Jogee TAs: Biqing For, Candace Gray, Irina Marinova Lecture 14 Th Oct 19 Kirchhoff
Astro 301/ Fall 2006 (50405) Introduction to Astronomy http://www.as.utexas.edu/~sj/a301-fa06 Instructor: Professor Shardha Jogee TAs: Biqing For, Candace Gray, Irina Marinova Lecture 14 Th Oct 19 Kirchhoff
Ch. 25 In-Class Notes: Beyond Our Solar System
 Ch. 25 In-Class Notes: Beyond Our Solar System ES2a. The solar system is located in an outer edge of the disc-shaped Milky Way galaxy, which spans 100,000 light years. ES2b. Galaxies are made of billions
Lecture 16 The Measuring the Stars 3/26/2018
 Lecture 16 The Measuring the Stars 3/26/2018 Test 2 Results D C B A Questions that I thought were unfair: 13, 18, 25, 76, 77, 80 Curved from 85 to 79 Measuring stars How far away are they? How bright are
LAB: Photometry of the Pleiades Cluster
 LAB: Photometry of the Pleiades Cluster ASTR 203 - Instructors Olszewski & Rigby Due IN CLASS on Oct. 30 You may work with 1 partner. If you do, only turn in 1 assignment with both your names on it! You
The Hertzsprung-Russell Diagram Help Sheet
 The Hertzsprung-Russell Diagram Help Sheet Setting up the Telescope What is the wavelength range of an optical telescope? Approx. 400-700 nm Locating the Star Cluster Observing the sky from the Northern
Astron 104 Laboratory #8 The H-R Diagram
 Name: Date: Section: Astron 104 Laboratory #8 The H-R Diagram Section 10.1, 10.5 Introduction The Hertzsprung-Russell diagram, or H-R diagram for short, relates two fundamental properties of stars and
The Distances and Ages of Star Clusters
 Name: Partner(s): Lab #7 The Distances and Ages of Star Clusters 0.1 Due July 14th Very few stars are born isolated. Instead, most stars form in small groups, known as clusters. The stars in a cluster
Astronomy 110 Homework #07 Assigned: 03/06/2007 Due: 03/13/2007. Name: (Answer Key)
") Astronomy 110 Homework #07 Assigned: 03/06/2007 Due: 03/13/2007 Name: (Answer Key) Directions: Listed below are twenty (20) multiple-choice questions based on the material covered by the lectures thus
Astronomy 110 Homework #07 Assigned: 03/06/2007 Due: 03/13/2007 Name: (Answer Key) Directions: Listed below are twenty (20) multiple-choice questions based on the material covered by the lectures thus
Basic Properties of the Stars
 Basic Properties of the Stars The Sun-centered model of the solar system laid out by Copernicus in De Revolutionibus (1543) made a very specific prediction: that the nearby stars should exhibit parallax
ASTR 1120 General Astronomy: Stars & Galaxies
 ASTR 1120 General Astronomy: Stars & Galaxies HOMEWORK #3 due NEXT TUE, 09/29, by 5pm Fiske planetarium: The Birth of Stars by Prof. John Bally - TH 09/24-FRI 09/25, 7:30pm Astronomer s s Toolbox: What
Get ready for quiz # 5! Get out a ½ sheet and Calculator
 Get ready for quiz # 5! Get out a ½ sheet and Calculator The above image shows the solar eclipse earlier this month as covered and uncovered by several different solar observatories. The innermost image
Stars & Galaxies. Chapter 27, Section 1. Composition & Temperature. Chapter 27 Modern Earth Science Characteristics of Stars
 Stars & Galaxies Chapter 27 Modern Earth Science Chapter 27, Section 1 27.1 Characteristics of Stars Composition & Temperature Scientists use the following tools to study stars Telescope Observation Spectral
The Distance Modulus. Absolute Magnitude. Chapter 9. Family of the Stars
 Foundations of Astronomy 13e Seeds Phys1403 Introductory Astronomy Instructor: Dr. Goderya Chapter 9 Family of the Stars Cengage Learning 016 Topics for Today s Class 1. Recap: Intrinsic Brightness a)
Chapter 15 Reading Quiz Clickers. The Cosmic Perspective Seventh Edition. Surveying the Stars Pearson Education, Inc.
 Reading Quiz Clickers The Cosmic Perspective Seventh Edition Surveying the Stars 15.1 Properties of Stars How do we measure stellar luminosities? How do we measure stellar temperatures? How do we measure
CHAPTER 29: STARS BELL RINGER:
 CHAPTER 29: STARS BELL RINGER: Where does the energy of the Sun come from? Compare the size of the Sun to the size of Earth. 1 CHAPTER 29.1: THE SUN What are the properties of the Sun? What are the layers
Astronomy 201: Cosmology, Fall Professor Edward Olszewski and Charles Kilpatrick
 Astronomy 201: Cosmology, Fall 2013 Professor Edward Olszewski and Charles Kilpatrick Lab 3, Cluster Hertzsprung-Russell Diagrams and the Age of Stars Due October 22, Worth 32 points You may work in groups
Stars: basic observations
 Stars: basic observations Basic properties of stars we would like to know in order to compare theory against observations: Stellar mass M Stellar radius R Surface temperature - effective temperature T
OPTION E, ASTROPHYSICS TEST REVIEW
 IB PHYSICS Name: DEVIL PHYSICS Period: Date: BADDEST CLASS ON CAMPUS OPTION E, ASTROPHYSICS TEST REVIEW S1. This question is about the nature of certain stars on the Hertzsprung-Russell diagram and determining
8/30/2010. Classifying Stars. Classifying Stars. Classifying Stars
 Classifying Stars In the early 1900s, Ejnar Hertzsprung and Henry Russell made some important observations. They noticed that, in general, stars with higher temperatures also have brighter absolute magnitudes.
Based on the reduction of the intensity of the light from a star with distance. It drops off with the inverse square of the distance.
 6/28 Based on the reduction of the intensity of the light from a star with distance. It drops off with the inverse square of the distance. Intensity is power per unit area of electromagnetic radiation.
Stars & Galaxies. Chapter 27 Modern Earth Science
 Stars & Galaxies Chapter 27 Modern Earth Science Chapter 27, Section 1 27.1 Characteristics of Stars How do astronomers determine the composition and surface temperature of a star? Composition & Temperature
HR Diagram Student Guide
 Name: HR Diagram Student Guide Pretest Score: Background Information Work through the background sections on Spectral Classification, Luminosity, and the Hertzsprung-Russell Diagram. Then complete the
Vocabulary. Section Resources
 Section 26.2 26.2 Stars 1 FOCUS Objectives 26.2.1 Demonstrate how distance to a star is measured. 26.2.2 Classify stars according to chemical and physical properties. 26.2.3 Interpret the H-R diagram.
Measuring the Properties of Stars (ch. 17) [Material in smaller font on this page will not be present on the exam]
![Measuring the Properties of Stars (ch. 17) [Material in smaller font on this page will not be present on the exam]](/thumbs/85/91935248.jpg "Measuring the Properties of Stars (ch. 17) [Material in smaller font on this page will not be present on the exam]") Measuring the Properties of Stars (ch. 17) [Material in smaller font on this page will not be present on the exam] Although we can be certain that other stars are as complex as the Sun, we will try to
Measuring the Properties of Stars (ch. 17) [Material in smaller font on this page will not be present on the exam] Although we can be certain that other stars are as complex as the Sun, we will try to
Chapter 21: Stars Notes
 Branches of Earth Science Chapter 21: Stars Notes Astronomy: The study of planets, stars, and other objects in space. Lithosphere: the land masses of earth o Litho means rock Hydrosphere: waters of the
OPTION E, ASTROPHYSICS TEST REVIEW
 IB PHYSICS Name: DEVIL PHYSICS Period: Date: # Marks: XX Raw Score: IB Curve: BADDEST CLASS ON CAMPUS OPTION E, ASTROPHYSICS TEST REVIEW S1. This question is about the nature of certain stars on the Hertzsprung-Russell
The magnitude system. ASTR320 Wednesday January 30, 2019
 The magnitude system ASTR320 Wednesday January 30, 2019 What we measure: apparent brightness How bright a star appears to be in the sky depends on: How bright it actually is Luminosity and its distance
Measuring the Stars. The measurement of distances The family of distance-measurement techniques used by astronomers to chart the universe is called
 Measuring the Stars How to measure: Distance Stellar motion Luminosity Temperature Size Evolutionary stage (H-R diagram) Cosmic distances Mass The measurement of distances The family of distance-measurement
Chapter 9: Measuring the Stars
 Chapter 9: Measuring the Stars About 10 11 (100,000,000,000) stars in a galaxy; also about 10 11 galaxies in the universe Stars have various major characteristics, the majority of which fall into several
For instance, for a particular star cluster, these data were derived:
 Astronomy 100 Name(s): Exercise 5: The H-R diagram and spectroscopy A very basic correlation using the color index By the 1920 s, various astronomers had evidence that the temperature of a star was also
Announcements. Lecture 11 Properties of Stars. App Bright = L / 4!d 2
 Announcements Quiz#3 today at the end of 60min lecture. Homework#3 will be handed out on Thursday. Due October 14 (next Thursday) Review of Mid-term exam will be handed out next Tuesday. Mid-term exam
Photoelectric Photometry of the Pleiades Student Manual
 Name: Lab Partner: Photoelectric Photometry of the Pleiades Student Manual A Manual to Accompany Software for the Introductory Astronomy Lab Exercise Edited by Lucy Kulbago, John Carroll University 11/24/2008
Astronomy 104: Stellar Astronomy
 Astronomy 104: Stellar Astronomy Lecture 14: Thermal Spectra to the Stars Spring Semester 2013 Dr. Matt Craig 1 1 Next Time Read Chapter 10 Focus on How we know the distance, brightness, luminosity, temperature,
Exploratorium Teacher Institute page 1 Linda S. Shore
 Exploratorium Teacher Institute page 1 Growing Up A Star This activity helps students understand and interpret the Hertzsprung Russell (HR) diagram a graphical representation of how stars evolve that is