Astronomy. Astrophysics. Listening to galaxies tuning at z : The first strikes of the Hubble fork
|
|
|
- Carol Harrington
- 6 years ago
- Views:
Transcription
1 A&A 562, A113 (2014) DOI: / / c ESO 2014 Astronomy & Astrophysics Listening to galaxies tuning at z : The first strikes of the Hubble fork M. Talia 1, A. Cimatti 1, M. Mignoli 2,L.Pozzetti 2,A.Renzini 3,J.Kurk 4, and C. Halliday 5 1 Dipartimento di Fisica e Astronomia, Università di Bologna, via Ranzani 1, Bologna, Italy margherita.talia2@unibo.it 2 INAF - Osservatorio Astronomico di Bologna, via Ranzani 1, Bologna, Italy 3 INAF - Osservatorio Astronomico di Padova, vicolo dell Osservatorio 5, Padova, Italy 4 Max Planck Institut für extraterrestrische Physik, Postfach 1312, Garching bei München, Germany 5 23 rue d Yerres, Montgeron, France Received 2 July 2013 / Accepted 11 December 2013 ABSTRACT Aims. We investigate the morphological properties of 494 galaxies selected from the Galaxy Mass Assembly ultra-deep Spectroscopic Survey (GMASS) at z > 1, primarily in their optical rest frame, using Hubble Space Telescope (HST) infrared images, from the Cosmic Assembly Near-IR Deep Extragalactic Legacy Survey (CANDELS). Methods. The morphological analysis of Wield Field Camera (WFC3) H 160 band images was performed using two different methods: a visual classification identifying traditional Hubble types, and a quantitative analysis using parameters that describe structural properties, such as the concentration of light and the rotational asymmetry. The two classifications are compared. We then analysed how apparent morphologies correlate with the physical properties of galaxies. Results. The fractions of both elliptical and disk galaxies decrease between redshifts z 1toz 3, while at z > 3 the galaxy population is dominated by irregular galaxies. The quantitative morphological analysis shows that, at 1 < z < 3, morphological parameters are not as effective in distinguishing the different morphological Hubble types as they are at low redshift. No significant morphological k-correction was found to be required for the Hubble type classification, with some exceptions. In general, different morphological types occupy the two peaks of the (U B) rest colour bimodality of galaxies: most irregulars occupy the blue peak, while ellipticals are mainly found in the red peak, though with some level of contamination. Disks are more evenly distributed than either irregulars and ellipticals. We find that the position of a galaxy in a UVJ diagram is related to its morphological type: the quiescent region of the plot is mainly occupied by ellipticals and, to a lesser extent, by disks. We find that only 33% of all morphological ellipticals in our sample are red and passively evolving galaxies, a percentage that is consistent with previous results obtained at z < 1. Blue galaxies morphologically classified as ellipticals show a remarkable structural similarity to red ones. We search for correlations between our morphological and spectroscopic galaxy classifications. Almost all irregulars have a starforming galaxy spectrum. In addition, the majority of disks show some sign of star-formation activity in their spectra, though in some cases their red continuum is indicative of old stellar populations. Finally, an elliptical morphology may be associated with either passively evolving or strongly star-forming galaxies. Conclusions. We propose that the Hubble sequence of galaxy morphologies takes shape at redshift 2.5 < z < 3. The fractions of both ellipticals and disks decrease with increasing lookback time at z > 1, such that at redshifts z = and above, the Hubble types cannot be identified, and most galaxies are classified as irregular. Key words. galaxies: high-redshift galaxies: structure galaxies: formation galaxies: evolution 1. Introduction In the local Universe, galaxies can be classified according to their appearance along the so-called Hubble sequence. At z > 1, in contrast, the majority of the galaxy population consists of objects with irregular morphologies that are very dissimilar from their low-redshift descendants (Abraham et al. 1996; Cassata et al. 2005; Conselice et al. 2008). How and when did these objects turn into the ellipticals and spirals that we see today? The shape of a galaxy can be modified by many processes: star-formation activity, the effects of an active nucleus, interactions with neighbouring galaxies, galaxy merging, or infall of cold gas from the inter-galactic medium Appendix A is available in electronic form at (Conselice et al. 2003). Both morphological classification at all redshifts, to study how galaxies change shape through cosmic time, and the determination of how galaxy morphologies are related to their other physical and spectral properties are fundamental to the understanding of galaxy formation and evolutionary processes. The assignment of a galaxy to a particular morphological class is strongly affected by human subjectivity, especially for faint high-redshift galaxies. The Hubble types are still used in morphological classification at high redshift, even though galaxy shapes often do not fit perfectly into these traditional classes. In the past few years, some authors have developed simpler visual classification schemes based on the apparent nucleation of galaxy light profiles and the number and identification of distinct clumps (Law et al. 2007, 2012b,a). To make the classification process more objective and automatic, non-parametric approaches have also been introduced. Article published by EDP Sciences A113, page 1 of 27
2 A&A 562, A113 (2014) The most widely used systems are CAS and G-M 20 1 (Abraham et al. 1994; Schade et al. 1995; Abraham et al. 1996; Bershady et al. 2000; Conselice et al. 2003; Lotz et al. 2004). In highredshift galaxies, the clumpiness is the least well-defined parameter, owing to the small size and faintness of the galaxies and to the limited resolution of the images (Lotz et al. 2004; Law et al. 2012b). A principal component analysis of the aforementioned parameters combinedwith a parametric description of the galaxy light is used, for example, in the Zurich estimator of structural types (ZEST) classification scheme (Scarlata et al. 2007). A simpler approach to quantitative morphological galaxy classification is to examine the position of a galaxy in the planes defined by the four cited parameters. At low redshifts, galaxies belonging to different morphological classes occupy well-defined regions in the C-A and G-M 20 planes (Abraham et al. 1996; Bershady et al. 2000; Conselice et al. 2003; Lotz et al. 2008), within which even merger candidates are effectively distinguished. At high redshifts, the typical parameter values for the various morphological types widely differ. Previous studies at high-redshift have shown that, in the C-A plane, ellipticals have the highest concentrations and the lowest asymmetries (Conselice et al. 2008; Cassata et al. 2005). In addition, ellipticals are confined to a particular region in the G-M 20 plane, with M , and G values spanning a 0.2 range between 0.5 and 0.8, depending on the study. Galaxies with both disky and irregular morphologies are more scattered across both planes, but are more tightly confined in the G-M 20 one. In general, spheroids have higher G and lower M 20 values, while most irregulars have lower G and high M 20 (Lotz et al. 2008; Law et al. 2012b; Wang et al. 2012). There are, however, some discrepancies between different studies (see, for example, Conselice et al. 2008). The primary aim of morphological studies is to determine the robustness of non-parametric statistics in differentiatingbetweenmorphologiesatall redshifts, and develop a reliable classification tool for cases when the traditional method by eye becomes too uncertain. The redshift evolution of galaxy morphologies, regardless of the way in which they are defined, has to be studied in the same rest-frame band for all redshifts. Since at different wavelengths different gas phases and stellar populations are probed, the appearance of a galaxy may also change, depending on the wavelength at which the galaxy is seen. Hence, it is important to determine whether there is any need for a morphological k-correction as a function of redshift (Conselice et al. 2011). At high redshift, we need to search for relations between the morphological classification and other properties, such as spectral type, mass, colours, and star-formation history to understand the interplay between physical processes and merger events in the shaping of a galaxy. At low redshift, quiescent galaxies usually have spheroidal structures, while star-forming galaxies are mostly either irregulars or disks. In general, this is also true at high redshift (Cassata et al. 2011; Wuyts et al. 2011; Bell et al. 2012; Szomoru et al. 2011, 2012), but not always. Conselice et al. (2011) find that a significant fraction of galaxies visually classified as early-types have star-forming spectral types, which suggests that very few purely passive massive galaxies existat1< z < 3, at least within the Hubble Ultra Deep Field. For a sample of IRAC-selected Extremely Red Objects (IEROs), however, Wang et al. (2012) find that quiescent and dusty starforming galaxies, classified according to their IR colours, can be clearly separated in the G-M 20 plane, thus implying that there is a relation between the morphology and star-forming status of 1 CAS: concentration asymmetry clumpiness; G-M 20 :Ginicoefficient second-order moment of the light distribution. IEROs. In particular, this may indicate that the quenching process for star formation occurs with (or is the cause of) an increase in the galaxy concentration. The aim of this paper is to investigate the morphological properties of galaxies at intermediate to high redshift, and how they correlate with physical properties such as the star-formation activity. We decided to use recent images acquired using the H 160 band filter of the Wide Field Camera 3 (WFC3), mounted on the Hubble Space Telescope, because the observed-frame nearinfrared wavelengths are needed to resolve the location of most stellar mass in galaxies, at high redshifts (Conselice et al. 2011). This paper is structured as follows. First, the results of our morphological classification are presented, which are based on both Hubble types and non-parametric statistics. The need for morphological k-correction is also investigated by comparing restframe ultraviolet (UV) and optical images. We then study the connections between the morphologies and physical properties of z > 1 galaxies, examining the colour-stellar mass diagram and the distributions of galaxies with different morphologies in the well-established bimodal colour distribution of galaxies. Finally, we focus on a spectroscopic sub-sample of galaxies to search for possible correlations between our morphological and spectroscopic classifications. 2. The sample We analyse rest-frame optical morphologies of a sample of z 1 galaxies. We started from the photometric catalogue of the Galaxy Mass Assembly ultra-deep Spectroscopic Survey GMASS(Kurk et al. 2013), and searched for counterparts to galaxies at z 1intheH 160 band mosaics (v0.5) of the Cosmic Assembly Near-IR Deep Extragalactic Legacy Survey CANDELS (Grogin et al. 2011; Koekemoer et al. 2011) in the GOODS-South. We found 494 matches, which we refer to as the GMASS-WFC3 sample. We note that 259 of the selected galaxies have a spectroscopic redshift, which was collected primarily from the GMASS spectroscopic survey, but also from the European Southern Observatory (ESO) public database 2.The redshift distribution is shown in Fig The GMASS survey The GMASS survey (Cimatti et al. 2008; Kurk et al. 2013) is an ESO Very Large Telescope (VLT) large programme project based on data acquired using the FOcal Reducer and low dispersion Spectrograph (FORS2). The project s main objective is to use ultra-deep optical spectroscopy to measure the physical properties of galaxies at redshifts 1.5 < z < 3. The GMASS photometric catalogue is a purely magnitude-limited selection of sources detected in the GOODS-South public image taken at 4.5 μm with the Infrared Array Camera (IRAC) mounted on the Spitzer Space Telescope, the limiting magnitude being m 4.5 < 23.0 (AB system). The photometric catalogue contains 1277 objects, for 131 of which it was possible to determine secure spectroscopic redshifts. The GMASS spectra have a spectral resolution of R = λ/δλ 600, which was chosen as the 2 The compilation of GOODS/CDF-S spectroscopy master catalogue v2.0 was used for this work. Spectroscopic redshifts were taken in particular from the following surveys: the ESO-GOODS/FORS2 v3.0 (Vanzella et al. 2008) and ESO-GOODS/VIMOS v2.0 (Popesso et al. 2009; Balestra et al. 2010), the VVDS v1.0 (Le Fèvre et al. 2005), the K20 (Mignoli et al. 2005), and the spectroscopic follow-up programme of X-ray sources in the Chandra Deep Field South (Szokoly et al. 2004). A113, page 2 of 27
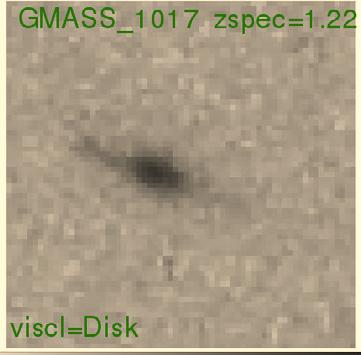
, compact (z = 3.19), disk-like (z = 1.22), irregular (z = 1.22), irregular (z = 1.99), faint object (z = 2.30). Table 1.")
 distribution of the total GMASS sample at z 1; the black histogram represents best-redshift distribution of the 494 galaxies")

 evolutionary populationsynthesis models.")
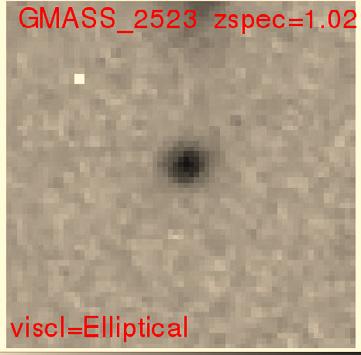
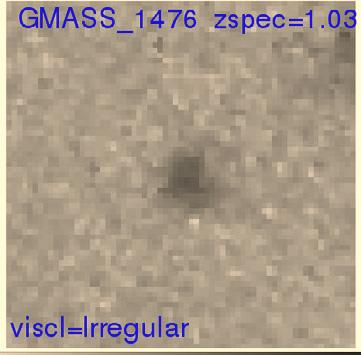
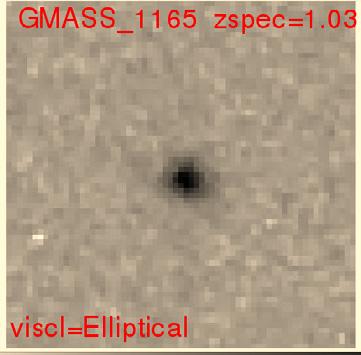
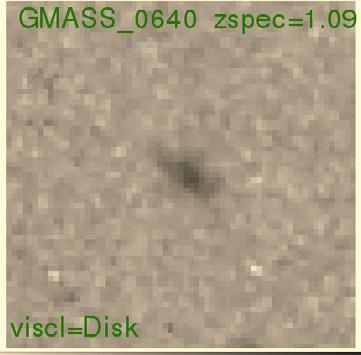
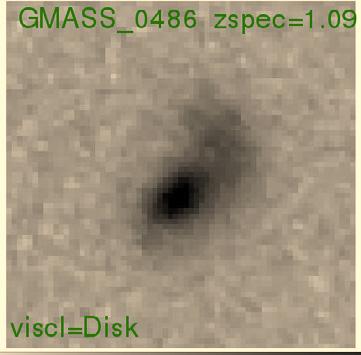
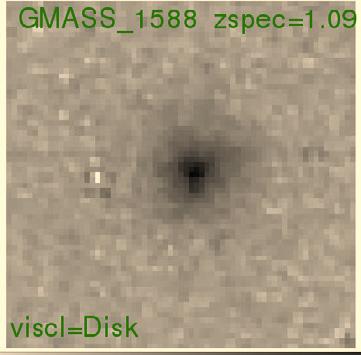
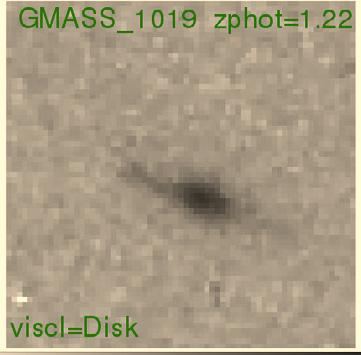
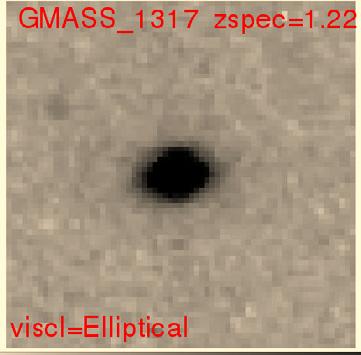
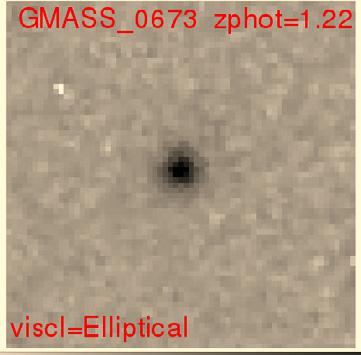
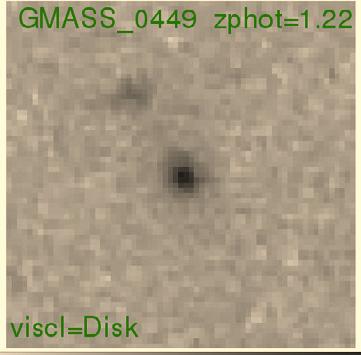
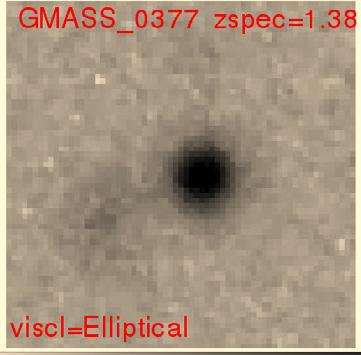
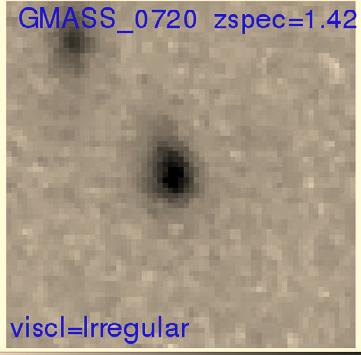
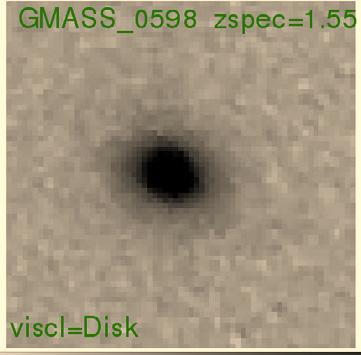
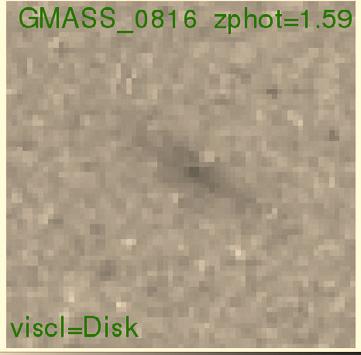
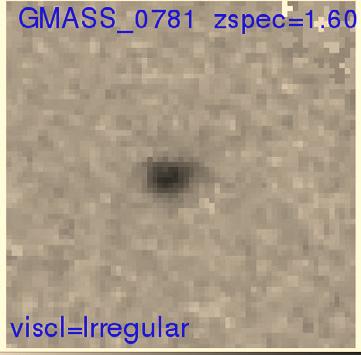
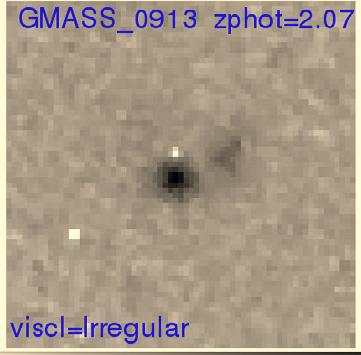
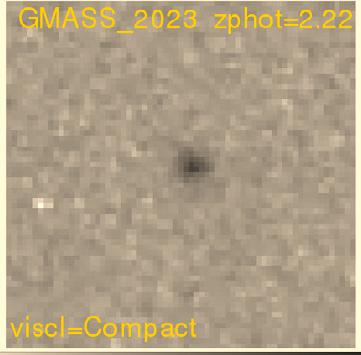
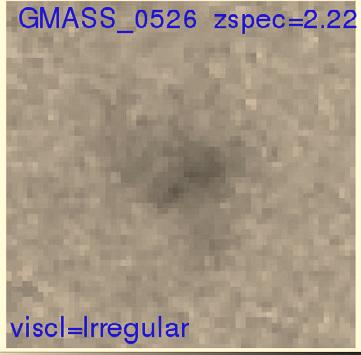
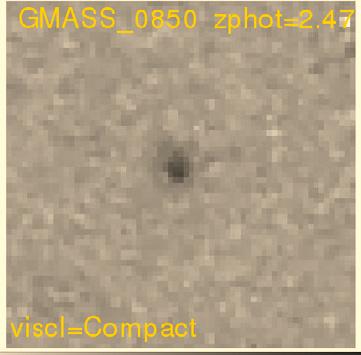
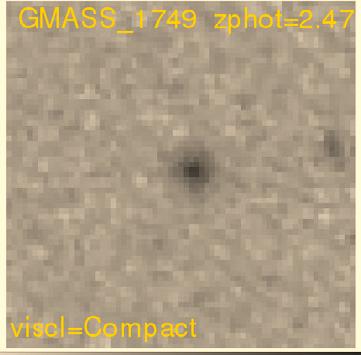
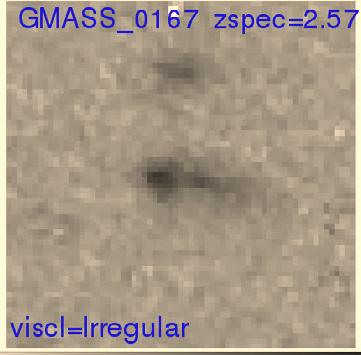
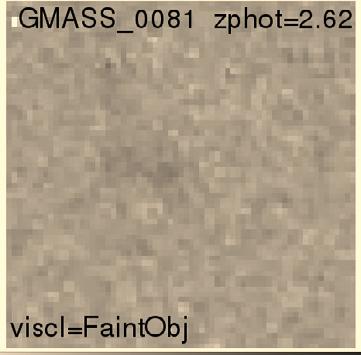
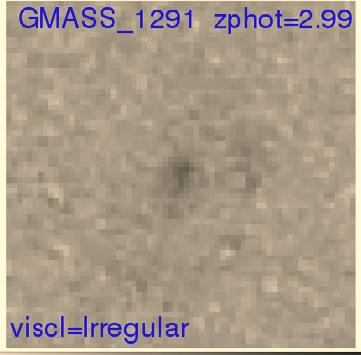
3 M. Talia et al.: Listening to galaxies tuning at z : The first strikes of the Hubble fork Fig. 2. Sample snapshots (4 4 ) of galaxies to illustrate the visual classification scheme. From top left: elliptical (z = 1.09), compact (z = 3.19), disk-like (z = 1.22), irregular (z = 1.22), irregular (z = 1.99), faint object (z = 2.30). Table 1. Number of galaxies of each morphological type. Fig. 1. Redshift distribution. The red histogram represents best-redshift (spectroscopic or photometric) distribution of the total GMASS sample at z 1; the black histogram represents best-redshift distribution of the 494 galaxies from the GMASS-WFC3 sample; the green histogram represents the distribution for the 259 galaxies with a spectroscopic redshift. best compromise between extensive wavelength coverage and the ability to resolve and identify spectroscopic features for redshift determination. Physical properties, such as stellar mass and star-formation rate, were estimated by fitting broad-band photometry, from the U band to the IRAC 5.8 μm band, with the synthetic spectra of the Maraston (2005) evolutionary populationsynthesis models. Star-formation histories were parametrized by exponentials (e t τ ) with e-folding time-scales τ between 100 Myr and 30 Gyr, plus the case of constant SFR. A Kroupa initial mass function (Kroupa 2001), fixed solar metallicity, and a Calzetti law for dust extinction (Calzetti et al. 2000) were assumed The CANDELS survey The CANDELS survey (Grogin et al. 2011; Koekemoer et al. 2011) is a 902-orbit Multi-Cycle Treasury Program on the HST. The project aims to investigate galaxy evolution up to redshift z 8 using deep imaging data collected with the infrared (IR) and UVIS channels of the WFC3, as well as the Advanced Camera for Surveys (ACS), targeting five existing survey fields on the sky. Science drizzled images, along with weight images, are being publicly released as the observations are carried out. In this work, images acquired within the Deep Program with the WFC3/IR F160W filter were used, which have an exposure depth of 1100 s and a points spread function (PSF) full width at half maximum (FWHM) of Visual morphological analysis The morphological analysis of H 160 images was done using two different methods: a visual classification based on traditional Hubble types, and a quantitative analysis using parameters that quantify morphological properties, such as the concentration of light and the galaxy asymmetry. Ellipticals Compact Disk-like Irregulars Faint The galaxy shapes were classified into five main types based on the appearance of the galaxies in the H 160 band images: Ellipticals for single centrally concentrated sources with no evidence of outer structures. Compact for single centrally concentrated sources that are very smooth, symmetric, and display no evidence of any substructure. It differs from the elliptical classification in that a compact galaxy contains no features such as an extended light distribution or a light envelope. Disk-like for undisturbed sources with disk-like shapes. Irregulars where the galaxy shapes are none of the above. These systems are possibly in some phase of a merger (Conselice et al. 2003). Some of them show evidence of two or more distinct nucleated sources of comparable magnitude. Faint objects where the objects are too faint to allow any reliable classification. Galaxies were, at first, classified by three authors (MT, AC, and MM) independently. All classifiers were allowed to adjust the stretch and contrast of the images. The three classifications were then comparedand any disagreements were discussed before assigning the single galaxy classifications used throughout this paper. We emphasize that our visual classification is based only on the appearance of the galaxy as seen through the observed H 160 filter: no additional information such as colour, spectrum, mass, or star-formation rate (SFR) was used to assign a morphological type to a galaxy. In Fig. 2, sample snapshots of galaxies are provided to illustrate the visual classification scheme, while Table 1 summarizes the number of galaxies in each class. A morphological atlas of all 494 galaxies of our sample is presented in the Appendix. The relative fraction of the different visual morphological types, as a function of redshift, is shown in Fig. 3. The confidence regions account for both the random uncertainty and the differences between the three original classifications, before they were reconciled into the definitive one. We find that the fractions of ellipticals and disks decrease with increasing lookback time and that the most galaxies at redshift z 2 and above are either irregular or too faint to be classified. A113, page 3 of 27
4 A&A 562, A113 (2014) Tot num Tot num > 3.2 Fig. 3. Left plot: the relative fractions of the different galaxy morphological types as a function of redshift. The total number of galaxies in each redshift step (Δz = 0.2) between z = 1andz = 3.2 is indicated. The last step includes all galaxies at z > 3.2. The confidence regions reflect both the random uncertainty and the differences between classifications made by three different authors. See the text for more details about the classification procedure. Right plot: same as left, but for a mass complete sample (log(m lim ) = 10.5). In this plot the redshift step is Δz = 0.5. The fraction of compact galaxies is almost constant ( 0.1) between redshift 1 and 3, but has a peak around z 2.5, as also observed by Conselice et al. (2008). Morphological type fractions were computed also for a sample selected to be complete in terms of stellar mass. We applied a minimum-mass threshold of log(m lim ) = 10.5, which is the mass completeness limit in the redshift range considered in this paper (Kurk et al. 2013). The plot, presented in Fig. 3, shows that the general trends found in the complete sample are preserved. Using the observed H 160 band, we observe a rest-frame wavelengths extending from λ rest 8000 at z 1toλ rest 4000 at z 3. We checked whether this variation in galaxy rest-frame wavelength could bias our results, and whether a morphological k-correction was required by instead performing morphological classifications at approximately identical rest-frame wavelengths for all galaxies. We used ACS z-band images for galaxies at z 1.7, WFC3 J-band (from CANDELS) at 1.7 < z 2.5and H-band at z > The fractions of morphological types, at all redshifts, are almost identical to those presented in Fig. 3. The only differences are a slightly higher fraction of irregulars and a slightly lower fraction of disks at z < 1.5, but the general trends remain unchanged. A thorough discussion about morphological k-correction is presented later in the paper. Comparing our trends with the literature, we are able to explore the full range of redshifts, down to z 0. Below the minimum redsfhit of our sample, i.e. z < 1, disks and spheroids are the dominant population, with only about 20% of galaxies being irregulars. At redshift z the fractions of irregulars and compact are higher, while the fractions of both disks and ellipticals are lower than at redshift z < 1(Conselice et al. 2005; Conselice et al. 2008). Our results allow us to identify the origin of the Hubble sequence at redshift 2.5 < z < 3. At these redshifts, 20% of 3 All images at shorter wavelengths were degraded to match the pixel size and PSF of H-band images. See Sect. 5. galaxies have elliptical or disk morphologies, whereas at redshifts z > 3 almost all galaxies are classified as irregulars. In Fig. 4 we plot SFRs and stellar masses as a function of redshift of all the galaxies in our sample. Galaxies hosting little or no star-formation are mainly ellipticals, though a small fraction are disks. On the other hand, galaxies with higher SFRs display a wider range of morphologies. In particular, almost all irregular galaxies have SFR 10 M yr 1. We can conclude that non-sfgs at z > 1 are generally ellipticals, while an irregular morphology is associated with active star-formation. It is interesting to notice that most faint objects are star-forming galaxies, with SFR 10 M yr 1, which are probably heavily obscured by dust or of low surface brightness. There is also a trend between morphological types and stellar masses: at each redshift, faint objects and both irregular and compact galaxies have, on average, lower stellar masses than ellipticals. 4. Quantitative morphological analysis Another approach to the morphological classification of galaxies is the calculation of non-parametric statistics. We concentrated on the four most widely used parameters: concentration C, rotational asymmetry A, Ginicoefficient G, and second-order moment of the light distribution M 20, which were computed using the code MORPHEUS (Abraham et al. 2007) Parameter definitions The concentration index C is the ratio of the intensity of light contained within a central region to that within one larger radius. A higher value of C indicates that a larger amount of light in a galaxy is contained within its central region. The asymmetry index A was first defined by Schade et al. (1995) as a measure of the asymmetry of a galaxy to a 180 rotation. Lower values of A imply that a galaxy is largely symmetric, while higher values of A indicate an asymmetric light distribution. A113, page 4 of 27
5 Table 2. Morphological parameters. M. Talia et al.: Listening to galaxies tuning at z : The first strikes of the Hubble fork Min Max Ellipticals (75) Compact (24) Disk-like (151) Irregulars (138) Concentration ± ± ± ± 0.04 Asymmetry ± ± ± ± 0.10 Gini ± ± ± ± 0.04 M ± ± ± ± 0.26 Notes. For the total sample, we provide the minimum, maximum, and mean values (with rms) of the morphological parameters, for each morphological type. In parentheses, the number of galaxies for which the image S/N > 50, for each morphological type, is also indicated. The Gini coefficient G (Abraham et al. 2003; Lotz et al. 2004) is a statistical tool that measures the cumulative flux distribution of a population of pixels and is insensitive to the actual spatial distribution of the individual pixels. Higher G values indicate that the majority of the total flux is concentrated in a small number of pixels, while lower values represent a more uniform distribution of flux. Finally, M 20 (Lotz et al. 2004) is defined as the second-order moment of the brightest pixels that constitute 20% of the total flux in the segmentation map, normalized by the second-order moment of all the pixels in the segmentation map. Increasingly negative values of M 20 correspond to more regular objects, whereas less negative values are found for more irregular objects often with multiple clumps. The precise definitions of the parameters can vary from author to author. Here we use the concentration defined by Abraham et al. (1994), and the definitions of Gini, M 20,and asymmetry given in Law et al. (2012b), although we use instead the correction term defined by Lauger et al. (2005)toremovethe background asymmetry. We refer the readers to the cited papers for more details. To define the segmentation map (i.e. decide which pixels belong to the galaxy), the quasi-petrosian method of Abraham et al. (2007) was adopted 4. We chose a threshold of η = 0.3 following the prescriptions of Law et al. (2012b), who found this to be the optimal way of maximizing the advantages of the method. In this part of the analysis only images with S/N > 50 were used 5, since images of too low a signal-to-noise ratio (S/N) did not allow a correct galaxy mapping to be made over all pixels (Law et al. 2012b). Some tests showed that parameters computed on images with S/N < 50 assume unrealistic values, for example negative Asymmetries, due to a background overcorrection. This S/N cut, which roughly corresponds to a cut in H-band magnitude of H AB < 24, removes 106 objects, including the galaxies visually classified as faint objects. Our quantitative morphological analysis was conducted on the remaining sample of 388 galaxies Exploration of the parameter space For each morphological type, mean values of all four parameters C, A, G, and M 20 are given in Table 2. 4 The pixels in a preliminary segmentation map are sorted in decreasingorderoffluxintoanarray f i, which is then used to construct a cumulative flux array. The so-called quasi-petrosian isophote is then set by determining the pixel index at which the pixel flux is equal to some fraction (called the quasi-petrosian threshold η) of the cumulative mean surface brightness. 5 S/N = F/ A rms, where F is the total flux of the galaxy, A is the total number of pixels, and rms is the average rms of the background over all sky pixels. Fig. 4. SFR (upper panel) and stellar mass (bottom panel) as a function of redshift for the 494 galaxies in the GMASS-WFC3 sample. Points are shape- and colour coded according to the morphological visual class (as in Fig. 3). At low redshift, different morphological types can be clearly distinguished using the four aforementioned parameters (Abraham et al. 1996; Conselice et al. 2003; Lotz et al. 2004). A113, page 5 of 27
6 A&A 562, A113 (2014) Fig. 5. Concentration vs. asymmetry. The dashed line separates the regions typically populated by ellipticals and irregulars. Points are shape and colour coded with respect to the morphological visual class (see Fig. 3). In contrast, at high redshift the parameters cannot be effectively used to separate the different visual morphologies. The C vs. A plane (Fig. 5) shows that ellipticals and compacts tend to have the highest concentrations, while the majority of irregular galaxies have C There is, however, a large overlap between the regions occupied by different types, hence it is impossible to distinguish an elliptical or irregular from a disk based solely on its value of C. Asymmetry cannot be used alone to distinguish the morphological types, although we note that a tail in the A distribution towards higher values is populated only by irregular galaxies. Comparing our results with other high-redshift studies, in the rest-frame optical regime, we found general qualitative agreement (Conselice et al. 2011; Law et al. 2012b), although in the Conselice et al. (2011) sample ellipticals show, on average, lower asymmetries than irregular galaxies. Our results were also compared with studies at lower redshift (Bershady et al. 2000; Conselice et al. 2003, 2011; Scarlata et al. 2007). The greatest difference was found in terms of asymmetry. At low-z, thea parameter is as effective as the concentration in distinguishing morphologies, at odds with what is seen at high-z. In addition, all the morphological types at high-z have a higher average level of asymmetry than their local siblings. This is particularly true for elliptical galaxies, whose mean asymmetry at z 2 measured in this work is A 0.2, about one dex higher than measured at lower redshifts. The M 20 vs. G plane (Fig. 6) showsthat,atz 1, ellipticals and compacts have G 3.7, while most of the irregulars are characterized by smaller values G 3.7. However, as found in the C vs. A plane, the region of the plane occupied by disks overlaps with both of the other two types. There is no clear separation of different morphologies in terms of M 20,themajority of galaxies having M 20 values in a short range between 1.8 and 1.4. Beyond these boundaries, however, we note that the tail of the M 20 distribution towards higher values is populated only by irregular galaxies, while ellipticals and disks are Fig. 6. M 20 vs. Gini coefficient. The dashed line separates the regions typically populated by ellipticals and irregulars. Points are shape and colour coded according to the morphological visual class (see Fig. 3). found in the opposite tail. The M 20 distribution in our sample is in close agreement with other high redshift studies (Law et al. 2012b; Wang et al. 2012). We found more discrepancies, however, when looking at the Gini parameter. The sample of SFGs studied by Law et al. (2012b) have a similar range of Gini values to the galaxies analysed here, although galaxies cannot be distinguished based on G. On the other hand, Wang et al. (2012) report much higher values for their IERO sample (0.3 < G < 0.8), but they observe a clear separation between spheroids and irregular galaxies. The discrepancies between the Gini values reported in various works likely depend on the different selection criteria adopted. This suggests that G is strongly related to the physical properties of galaxies, such as their stellar mass or star-formation status. The overall appearance of the G vs. M 20 plane does not change much with decreasing redshift. From a quantitative point of view, however, some differences emerge. In particular, low-z ellipticals have far more negative M 20 values (M 20 < 2; Lotz et al. 2004), though some discrepancies exist across the literature (see, for example, Conselice et al. 2008). From these aforementioned results, we can conclude that, at 1 < z < 3, quantitative morphological parameters cannot be used alone to effectively characterize the galaxy morphologies. Even if G and C have proven to be good in separating ellipticals from irregulars, it is impossible to distinguish these two morphological types from disks based solely on the position of a galaxy in the two above-mentioned planes. Additional galaxy-structure measurements are required. Nevertheless, it is important to study whether and how morphological parameters are related to the physical properties of galaxies, since at z 3 it becomes difficult to apply the Hubble classification, and structural parameters are the only way to characterize galaxy morphologies. We therefore searched for possible correlations between morphological parameters and the specific SFR (ssfr) of galaxies, which are independent of the morphological Hubble class. Only a mild trend was found, where galaxies with log(ssfr) 1 [Gyr 1 ] span the entire range of all parameters, while galaxies with log(ssfr) 1[Gyr 1 ] only have the highest values of A113, page 6 of 27
 Compact (22) Disk-like (117) Irregulars (208) Faint objects (88) Ellipticals (75) 53 6 5 8 3 Compact (36) 3 16 1 7 9 H 160 Disk-like (157) 0 0 104 49 4 Irregulars (199) 3 0 7")


7 M. Talia et al.: Listening to galaxies tuning at z : The first strikes of the Hubble fork Table 3. Visual morphological classification in WFC3-IR H 160 vs. ACS deg z 850 images. z 850 Ellipticals (59) Compact (22) Disk-like (117) Irregulars (208) Faint objects (88) Ellipticals (75) Compact (36) H 160 Disk-like (157) Irregulars (199) Faint objects (27) Notes. In parentheses the total number of galaxies belonging to each morphological type, in each band, is reported. Groups of galaxies with the same morphological classification at both wavelengths are marked in bold-face. Gini and concentration parameters, and the lowest values of M 20 (G 0.35, C 0.25, and M ). 5. Morphological k -correction Before analysing in greater detail the correlations between the morphological and physical properties of galaxies, we consider how the morphological features depend on the rest-frame band in which the galaxies are observed. To check whether a morphological k-correction should be applied to our sample, the images of galaxies acquired in WFC3- H 160 band were compared with those in ACS imaging in the z 850 band (Giavalisco et al. 2004), which probes the rest frame from B-band (λ 4300 Å at z 1) up to the UV regime (λ 2000 Å at z 3) for galaxies in our chosen redshift range. Owing to the differencesin resolutionand PSF, ACS imageswere first degraded to match the pixel size and PSF of those obtained with the WFC3. In the resulting images (ACS deg ), a complete morphological analysis was performed, similar to that outlined in the previous sections Visual appearance The comparison between morphological classifications in the ACS-z 850 and WFC3-H 160 is reported in Table 3. We find that the majority of galaxies have the same visual morphology at both wavelengths. Among the galaxies with different morphological classifications, 49 galaxies classified as disks in H 160 images were re-classified as irregulars in the z 850 band. We compare the two images for two example galaxies in Fig. 7. The difference in morphology between the two wavelength bands may reflect some differences in the distributions of the various stellar populations that inhabit the galaxy. We found that 51 objects with irregular morphologies in the H 160 band, are almost undetectable in the z 850 imaging (see Fig. 7). In this case, we cannot strictly speak of morphological k-correction, since the faintness of these galaxies at shorter wavelengths makes it impossible to classify them. We note that these objects have ongoing star-formation and intermediate-tohigh stellar masses relative to the total sample, i.e. log( SFR ) = 1.59 ± 0.67 [M yr 1 ]andlog M = ± 0.51 [M/M ]. We assume that they could be dusty star-forming galaxies in which the UV light from young stars is almost entirely absorbed Quantitative changes In our visual Hubble classification, we find that, for galaxies at z > 1, no significant morphological k-correction is required. This finding is however challenged by our quantitative analysis. In Fig. 7. Two examples of galaxies for which a morphological k-correction is required between the optical and UV band. For each galaxy, two images are shown: WFC3-H 160 (right) andacs deg -z 850 (left). In each snapshot, galaxy ID, redshift and classification are reported. Fig. 8, we compare the morphological parameters computed in the WFC3-H 160 and ACS deg -z 850 images. For all morphological types, we detect no difference between the concentrations and the Gini coefficients measured for the two different filters. The largest differences are found for the asymmetry and M 20 parameters, where disks in particular have higher values of A and M 20 for the shorter-wavelength filter. This confirms our previous results for high-redshift disk galaxies, where young stars have a more irregular spatial distribution than the older stellar populations generating the light at optical wavelengths. Irregulars are more asymmetric at shorter wavelengths, as expected because they are actively star-forming galaxies (Conselice et al. 2011), but for M 20 there are no significant differences, on average, between the two wavelength ranges. Compact and elliptical galaxies have, on average, less negative M 20 values (hence more irregular morphologies) at longer rest-frame wavelengths. 6. Colour bimodality It has been well-established by several studies that the galaxy rest-frame (U B) colour has a bimodal distribution (Strateva et al. 2001; Hogg et al. 2002; Cassata et al. 2007, 2008; Bell et al. 2004, 2012; Weiner et al. 2005; Whitaker et al. 2011). A113, page 7 of 27
8 A&A 562, A113 (2014) Table 4. Median and semi-interquartile range (in parenthesis) of C, A, G, M 20, stellar mass, and SFR for blue ((U B) rest ((U B) rest > 1) galaxies, in each morphological class. < 1) and red Total GMASS-WFC3 sample Elliptical Compact Disk Irregular Red (60%) Blue (40%) Red (25%) Blue (75%) Red (22%) Blue (78%) Red (15%) Blue (85%) Mass log(m/m ) (0.20) 9.71 (0.34) (0.11) 9.82 (0.25) (0.37) 9.66 (0.27) (0.43) 9.78 (0.31) SFR log(m yr 1 ) 0.84 (0.58) 1.29 (0.37) 1.07 (0.30) 1.17 (0.33) 0.50 (1.05) 1.25 (0.36) 0.90 (0.98) 1.46 (0.34) Galaxies with image S/N > 50 Elliptical Compact Disk Irregular Red (60%) Blue (40%) Red (25%) Blue (75%) Red (22%) Blue (78%) Red (10%) Blue (90%) concentration 0.29 (0.03) 0.28 (0.02) 0.29 (0.04) 0.28 (0.02) 0.27 (0.02) 0.25 (0.03) 0.23 (0.02) 0.22 (0.02) asymmetry 0.22 (0.06) 0.12 (0.05) 0.17 (0.07) 0.18 (0.05) 0.13 (0.04) 0.11 (0.03) 0.10 (0.05) 0.15 (0.06) Gini 0.41 (0.01) 0.40 (0.01) 0.40 (0.02) 0.39 (0.01) 0.38 (0.02) 0.37 (0.02) 0.34 (0.03) 0.34 (0.02) M (0.06) 1.63 (0.06) 1.64 (0.11) 1.59 (0.09) 1.75 (0.12) 1.66 (0.12) 1.56 (0.17) 1.55 (0.15) Notes. The percentage of galaxies belonging to each colour group, for each morphological type, is also provided. Fig. 8. Comparison between morphological parameters computed in the WFC3-H 160 and ACS deg -z 850 images. From top left, clockwise, concentration, asymmetry, M 20, and the Gini coefficient. Points are shape and colour coded with respect to the morphological classification in the H 160 band (see Fig. 3). Here, we determine the distribution of the different morphological types in the colour bimodality, to study the correlation between the morphologies and physical properties of highredshift galaxies. Figure 9 compares the (U B) rest colour 6 distribution for the GMASS-WFC3 sample with the distribution for each morphological type. The WFC3 sub-sample has a similar colour bimodality to that found for the GMASS total sample by Cassata et al. (2008). We divided the colour distribution into four redshift bins. We found that the bimodality can be clearly seen up to redshifts as high as 2.0 < z < 2.5, whereas at higher redshift 6 The absolute magnitude in a given filter X was computed using the observed apparent magnitude in the filter Y, which had been chosen to be the closest to λ(y) λ(x) (1 + z). Fig. 9. Rest-frame (U B) colour distributions of each morphological visual class (coloured histograms) vs. that of the full GMASS-WFC3 sample (black histogram). the colour distribution is far smoother because a larger fraction of galaxies populates the region between the red and the blue peaks. The bin in-between the red and blue peaks containing the least galaxies, (U B) rest 1, was chosen as the separation value between the red sequence and the blue cloud: this is consistent with threshold values reported in the literature (Cassata et al. 2008; Kriek et al. 2009). The colour of a galaxy clearly correlates with its morphological type: we find that (i) most irregulars (85%) occupy the blue peak ( (U B) bluepeak = 0.59); (ii) the red peak is mainly populated with ellipticals (60%, with (U B) redpeak = 1.26); (iii) disks have a smoother colour distribution than the other types and are the main type occupying the region between the blue and red peaks. In Table 4, we indicate the median of the distribution of some physical and morphological properties, for both red and blue galaxies, and each morphological type. The A113, page 8 of 27

9 M. Talia et al.: Listening to galaxies tuning at z : The first strikes of the Hubble fork Fig. 10. Rest-frame colour vs. stellar mass for each morphological type in the low-redshift bin 1.0 < z < 1.5. Instead of symbols, we plot randomly selected representative H 160 cutouts from our sample. median values of stellar mass and SFR correspond to the entire sample, whereas the median values of the morphological parameters are only for images with S/N > 50. We point out that the percentages of blue and red objects in the total sample are insensitive to the S/Ncut. There is a strong correlation between the (U B) rest colour of a galaxy and its stellar mass. This result is confirmed by the diagrams shown in Figs where red galaxies are more massive than blue ones, regardless of their morphological type. In terms of star-formation activity, there is little difference between red and blue objects for all morphological classes apart from ellipticals. Almost all galaxies classified as compact, disks, and irregulars have ongoing star-formation, regardless of their colour. Blue galaxies classified as ellipticals are also starforming, but red ellipticals, in addition to a small fraction of red disks, display no signs of star-formation. This confirms a previously presented result in this work that quiescent galaxies generally have an elliptical morphology (Sect. 3; see also Sect. 6.1). While the red colours of elliptical depend mainly on the old age of their stellar populations, red galaxies belonging to the other morphological classes are in most cases star-forming objects obscured by dust that reddens their colours (Scarlata et al. 2007; Franzetti et al. 2007). The physical properties of red-sequence galaxies in the GMASS total sample have already been extensively studied in Cassata et al. (2008). No correlation is found between colour and the quantitative morphological parameters, the parameter distributions of red and blue galaxies being quite consistent for morphological Hubble class. In contrast, the value of M 20 is lower for red disk galaxies than blue ones. The most remarkable variation is that of the asymmetry of elliptical galaxies, with blue ellipticals appearing less asymmetric than red ones The UVJ diagram The galaxies in our sample were also plotted in a rest-frame U V vs. V J colour diagram, which is shown in Fig. 13. Williams et al. (2009), and previously Wuyts et al. (2007) found A113, page 9 of 27

10 A&A 562, A113 (2014) Fig. 11. Rest-frame colour vs. stellar mass for each morphological type in the intermediate-redshift bin 1.5 < z < 2.0. Instead of symbols, we plot randomly selected representative H 160 cutouts from our sample. that star-forming and quiescent galaxies occupy two distinct regions in the plane. The UVJ diagram allows us to distinguish red star-forming dust-obscured galaxies from red, quiescent ones, which would be impossible using the U B colour alone. In particular, Williams et al. (2009) defines the region where quiescent galaxies fall, in different redshift bins. The quiescent region identified at 1 < z < 2 is indicated in Fig. 13. We plot only galaxies up to z 2.5, from our sample, since this is the limit up to which the bimodality in the UVJ diagram is still visible (Williams et al. 2009). Figure 13 shows that the quiescent region of the diagram is mainly populated by ellipticals and, to a lesser extent, by disks, reinforcing the results reported in the previous section. In addition, these galaxies have the highest values of concentration and Gini (see end of Sect. 4.2). The quiescent state of these galaxies is also consistent with their ssfr, log(ssfr) < 1 [Gyr 1 ]. In Fig. 13, we also label passive galaxies, i.e. with log(ssfr) < 2 [Gyr 1 ], following the definitions given by Ilbert et al. (2010)andPozzetti et al. (2010). We note that, while quiescent galaxies have either elliptical or disk morphologies, passive galaxies are mainly elliptical An in-depth look at ellipticals Although most ellipticals have a red rest-frame (U B) colour and occupy the quiescent region of the UVJ diagram, a significant fraction (40%) are found in the blue peak of the (U B) distribution. In general, the physical properties of these two groups of galaxies are very different: red ellipticals have high stellar masses and low to null star-formation activity, while blue ones occupy the low-mass end of the stellar mass distribution and have SFRs extending from tens to hundreds M yr 1 (see Table 4). Apartfromsharing the same Hubbleclassification, red A113, page 10 of 27

11 M. Talia et al.: Listening to galaxies tuning at z : The first strikes of the Hubble fork Fig. 12. Rest-frame colour vs. stellar mass for each morphological type in the high-redshift bin 2.0 < z < 4.0. Instead of symbols, we plot randomly selected representative H 160 cutouts from our sample. and blue ellipticals have, however, remarkably similar structure, having similar distributions of all morphological parameters except asymmetry. Figure 14 shows the distribution of asymmetry for both red and blue ellipticals. Although the blue peak is clearly evident at low asymmetries, there is no sharp separation between blue and red ellipticals, because red galaxies span a wide range of asymmetry values. Red and blue ellipticals also differ in terms of their Sérsic index 7 (n). We took Sérsic index values from the catalogue of structural parameters released by the CANDELS team (van der Wel et al. 2012). We refer the reader to the cited paper for the details about the parameter s computation. We found blue ellipticals to have n = 3.1 ± 1.3 while red ellipticals show n = 4.5 ± 1.9. On one hand, this result strengthens the 7 TheSérsicprofile:Σ(r) =Σ e exp( κ[(r/r e ) 1/n 1]), where r e is the effective half light radius and n is called the Sérsic index. n > 2is commonly used as a criterion to select spheroids, while disk-dominated galaxies are characterized by n < 2(Buitrago et al. 2008). classification of blue ellipticals; on the other hand, it highlights another possible structural difference between blue and red ellipticals. However, the difference between the two groups is not significant, therefore not even the Sérsic index can be used to separate a priori red from blue ellipticals. We conclude that it is impossible to distinguish between red and blue ellipticals on the basis of morphological properties alone. The true importance of searching for structural differences between red and blue ellipticals is the need to establish some suitable morphological criteria for selecting galaxies that are no longer forming stars. Although the properties of passively evolving, early-type galaxies are quite established, (Renzini 2006), different criteria have been used across the literature to select pure samples, i.e. those containing the smallest numbers of star-forming contaminants. The best way of performing such a selection is, of course, to use a combination of morphological, photometric and spectroscopic data (Moresco et al. 2010). This type of selection, however, is highly demanding in terms A113, page 11 of 27
12 A&A 562, A113 (2014) Fig. 13. Rest-frame U V vs. V J colours for galaxies at 1 < z < 2.5 in our sample. In the big plot, points are shape and colour coded with respect to the morphological visual class (see Fig. 3). In the small insert, points are colour coded with respect to their ssfr. In both plots, the quiescent region, defined by Williams et al. (2009) for the chosen redshift range, is also marked. Fig. 15. ssfr vs. (U B) rest colour for morphological ellipticals in the sample. Empty black points represent galaxies with no spectrum. Filled points indicate galaxies with a spectrum, and are colour-coded with respect to the spectral classification: red for early-types, blue for starforming, and green for AGNs. The vertical line marks the ssfr cut to select passive galaxies. The horizontal line marks the separation between red and blue galaxies. The grey area identifies the locus in the plane where red and passive galaxies fall. sample. Only 33% of all ellipticals are passive galaxies. It is interesting to note that this percentage is consistent with the result of Moresco et al. (2013) for their sample of z < 1 galaxies. The ssfr selection of passive galaxies in our sample is also consistent with the spectroscopic classification. In Fig. 15, galaxies from the spectroscopic sub-sample are indicated by different colours depending on their spectral class: galaxies with an early-type spectrum occupy the red and passive locus of the plane. In the remaining sub-sample, the majority of galaxies have a star-forming spectrum, while four have spectra typical of active galactic nuclei (AGNs). We refer the reader to Cimatti et al. (2008) for a thorough analysis of the spectral properties of early-type galaxies performed on spectra from the GMASS spectroscopic survey. Unfortunately, almost all galaxies analysed in that paper fall outside the CANDELS field and could not be included in this work. Fig. 14. Asymmetry distribution for blue ((U B) rest < 1) and red ((U B) rest > 1) ellipticals. of information used. Moresco et al. (2013) demonstrates that a selection based on ssfr is the closer to a combined criterion, in terms of percentage of contaminants. In the previous section we have seen that almost all passive galaxies at z > 1 are ellipticals. We now determine the fraction of passive galaxies among all galaxies with morphological elliptical classifications in our sample. Figure 15 shows the distribution of ssfr vs. (U B) rest colour for all ellipticals in our 7. Morphological vs. spectroscopic classification Spectra were collected for a sub-sample of 259 galaxies (the GMASS-wfc3 spec sample) to investigate the correspondence between morphological and spectroscopic classifications of high-redshift galaxies. We know that the requirement of spectroscopy feasibility may introduce a bias in our analysis, since the spectra were collected from different surveys with different selection criteria and depths. To establish how representative the spectroscopic sub-sample is with respect to the parent sample, we compared the distributions of SFR and stellar mass. Figure 16 shows that the GMASS-wfc3 spec sample is slightly biased towards higher SFRs. We also considered whether there was any bias toward any particular morphological Hubble type. We verified whether the relative percentages of different morphological types in the parent sample were conserved in the spectroscopic A113, page 12 of 27
13 M. Talia et al.: Listening to galaxies tuning at z : The first strikes of the Hubble fork Table 5. Morphological type vs. spectral class for the 259 galaxies in the GMASS-wfc3 spec sample. Spectral class b Early Interm SF AGN Uncl Ell Comp Morph a Disk type Irr Faint Notes. (a) Legend: Ell = Elliptical; Comp = Compact; Disk = Disklike; Irr = Irregular; Faint = Faint Objects. (b) Legend: Early = Earlytype; Interm = Intermediate; SF = Star-forming; AGN = AGN; Uncl = Unclassified. (ii) star-forming (strong [OII]λ3727 emission, strong interstellar absorption lines); (iii) intermediate (red continuum plus [OII]λ3727 emission); and (iv) AGN (type1havingbroademission lines, type 2 narrow CIVλ1549 Å emission line). The spectroscopic classification was compared to the morphological one and the results are shown in Table 5. There is a close correspondence between the morphological and spectroscopic galaxy classifications. Almost all galaxies with an early-type spectrum have an elliptical appearance. These elliptical galaxies are also passively evolving following a definition based on their ssfr, as reported in the previous section of this work. Our so-called intermediate spectra appear instead to be linked to a disk-like morphology. Galaxies with star-forming spectra do not tend to have any particular morphology: this class contains irregulars as well as disks, compact, and ellipticals. Conversely, we find that irregular galaxies always have a star-forming spectrum. Disks usually display some sign of star-formation activity in their spectra, though in some cases their red continuum represents older stellar populations. In addition, at z > 1 an elliptical morphology is associated with either a passively evolving or strongly star-forming spectrum. Finally, we note that, in our sample, spectroscopically confirmed AGNs are preferentially hosted by elliptical galaxies. Fig. 16. Distribution of SFR (top panel) and stellar mass (bottom panel) for the GMASS-WFC3 sample (black histogram) and the GMASSwfc3 spec sample (magenta histogram). Median values for each sample are also marked by vertical dashed lines. sub-sample. None of the galaxies classified as faint objects are present in the GMASS-wfc3 spec sample, as we would expect. We found that 70% of the ellipticals and disks are in the spectroscopic sample, in contrast to only 50% of the irregulars and 20% of compact. Most irregulars with no spectroscopic information are galaxies with image S/N < 50. Therefore, we conclude that, in terms of morphological classification, the spectroscopic sub-sample is biased slightly more towards elliptical and disk morphologies than irregulars, compared to the parent sample of galaxies. Galaxies in the GMASS-wfc3 spec sample were divided into four classes depending on their spectroscopic features (Mignoli et al. 2005; Talia et al. 2012): (i) early-type (red continuum, metal absorption lines, no nebular emission lines); 8. Summary and conclusions We have analysed the rest-frame optical morphology of galaxies at z 1 observed as part of GMASS, using IR images from HST/WFC3 to help us relate galaxy morphologies to their physical properties. The main result of this paper is that the fraction of ellipticals declines going back with cosmic time from z = 1, as does the fraction of disks. Up to z , we found that Hubble morphological types are still recognizable, while at higher redshifts the galaxy population is dominated by irregular galaxies. This result implies that the build-up of the Hubble sequence occurred at redshifts 2.5 < z < 3. Other important results of our analysis can be summarized as follows. Galaxies in our selected sample were first classified among the traditional Hubble types, finding that: Galaxies with little or no sign of star formation generally have elliptical morphologies, while an irregular morphology is linked to intense, ongoing star-formation. Galaxies too faint to allow a morphological classification by eye are mainly SFGs that are likely to be heavily obscured by dust or characterized by low surface brightness. There is a trend between morphological types and stellar masses, such that at A113, page 13 of 27
14 A&A 562, A113 (2014) each redshift, faint objects, irregulars and compact galaxies have, on average, lower stellar masses than ellipticals. A quantitative morphological analysis was also performed using the four most commonly used morphological parameters: concentration, asymmetry, Gini, and M 20. Comparing the results of our quantitative analysis to our Hubble classification, we found that at 1 < z < 3 morphological parameters cannot be used to clearly separate different morphological types. Even if C and G were able to differentiate ellipticals from irregulars, with ellipticals having the highest values of both parameters and irregulars having the lowest ones, it would be impossible to distinguish between different morphologies, because there are severe overlaps in the distributions of all parameters, for different Hubbletypes. No significant difference between the various morphological types was found in terms of asymmetry or M 20. The comparison of our results with studies at lower redshift showed that high-z galaxies have a higher general level of asymmetry than their local siblings. This is true in particular for ellipticals, whose mean asymmetry at z 2 is aboutone dex higher than measured at lower redshifts. High-z ellipticals also have less negative M 20 values than at low-z. Finally, we found that galaxies with log(ssfr) 1[Gyr 1 ] span the entire range of all quantitative morphological parameters, while galaxies with log(ssfr) 1 [Gyr 1 ]have the highest values of G and C,andthelowestM 20 (G 0.35, C 0.25, and M ). We assessed whether any morphological k-correction was required by comparing the morphological classifications made for each galaxy in WFC3-H 160 and ACS-z 850 images. These images sample, respectively, rest-frame optical wavelength and the restframe B-band (z 1) to UV (z 3). We found that: No significant k-correction was required when the Hubble type classification was considered. A notable exception were a group of galaxies classified as disks in optical images, which were found to be irregular at UV rest-frame wavelengths. A fraction of irregular galaxies, in WFC3-H 160 band, are very faint in the ACS-z 850 images, though in this case we cannot strictly speak of morphological k-correction, since the faintness of these galaxies in their UV rest frame makes their classification impossible. From a quantitative point of view, few differences were found. In particular, disks have higher A and M 20 in ACS-z 850 images, and irregulars are much more asymmetric at shorter wavelengths, as expected because they are actively starforming galaxies. Finally, compact and elliptical galaxies have, on average, less negative values of M 20 in their WFC3- H 160 than ACS-z 850 images. To investigate the correlations between the morphologies and physical properties of high-z galaxies, we analysed how different Hubble types are distributed in the well-known colour bimodality of galaxies. The colour distribution was checked in different redshift bins: the bimodality may still be seen clearly up to 2.0 < z < 2.5, while at higher redshifts the distribution is smoother and a larger fraction of galaxies populates the region in-between the blue and red peaks. The following results refer to the complete redshift range covered by our sample as a whole. The morphological type of a galaxy correlates with its colour: the majority of irregulars occupy the blue peak of the colour distribution, while ellipticals mainly populate the red peak, with some exceptions. Disks have a smoother colour distribution and are the morphological type that occupy most of the region in-between the blue and red peaks. The comparison between the physical properties of blue and red galaxies showed that there is a positive correlation of colour with stellar mass, regardless of the morphological type. In terms of star-formation activity, almost all galaxies classified as compact, disks, and irregulars have ongoing star-formation, independently of their colour. Blue galaxies classified as ellipticals are also star-forming, while only red ellipticals, and a small fraction of red disks, show no sign of star formation. There is strong similarity between the parameter distributions of red and blue galaxies within each morphological Hubble class. There is, however, a difference in the asymmetry within the elliptical class, with blue ellipticals appearing less asymmetric than red ones. Examining the position of different morphological Hubble types in a rest-frame U V vs. V J colours diagram, we found that: Galaxies inhabiting the quiescent region of the plot are almost all ellipticals and, to a leser extent, disks. There is a correspondence between the position of a galaxy in the plot and its ssfr: almost all galaxies in the quiescent region of the diagram have log(ssfr) < 1Gyr 1. Galaxies classified as passive according to their ssfr: log(ssfr) < 2[Gyr 1 ], have an elliptical morphology. Galaxies with an elliptical morphology were examined in greater detail. We found that: In our sample, elliptical galaxies can be separated into two groups: 40% have blue colours, relatively low stellar masses, and SFRs extending from tens to hundreds of M yr 1, while 60% are red, massive galaxies with low to null star-formation activity. However, from a structural point of view, there is a remarkable similarity between red and blue ellipticals: apart from sharing the same Hubble classification, they also have similar distributions of all morphological parameters. Differences were found only in terms of asymmetry and Sérsic index, with blue ellipticals being characterized by lower values of both parameters. However, given the relative distributions of both parameters, it is impossible to distinguish between the two groups on the basis of morphological properties alone. To establish the percentage of pure passively evolving galaxies in our sample of morphological ellipticals, we adopted a cut in ssfr: log(ssfr) < 2 [Gyr 1 ]. We found that only 33% of all morphological ellipticals are passive galaxies: this percentage is consistent with the result of Moresco et al. (2013) for their sample of z < 1 galaxies. Finally, spectra collected for a sub-sample of galaxies were used to investigate the correspondence between the morphological and spectroscopic classifications of high-redshift galaxies. We found that almost all irregular galaxies have a star-forming spectrum, and that disks usually have some sign of star-formation activity in their spectra, even though some have red continuum indicative of old stellar populations. Finally, galaxies with an early-type spectrum have an elliptical shape, but an elliptical morphology may be associated with either passively evolving or highly star-forming galaxies. A113, page 14 of 27
15 M. Talia et al.: Listening to galaxies tuning at z : The first strikes of the Hubble fork Acknowledgements. This work is based on observations taken by the CANDELS Multi-Cycle Treasury Program with the NASA/ESA HST, which is operated by the Association of Universities for Research in AStronomy, Inc., under NASA contract NAS A.C. and M.M. acknowledge the grants ASI n.i/023/12/0 Attività relative alla fase B2/C per la missione Euclid and MIUR PRIN The dark Universe and the cosmic evolution of baryons: from current surveys to Euclid. Part of the work has been supported also by an INAF grant PRIN The authors would like to thank the anonymous referee for his/her valuable comments, and P. Nair and R. Abraham for sharing the code MORPHEUS. MT wishes to thank Fabio Bellagamba for useful discussions and suggestions. References Abraham, R. G., Valdes, F., Yee, H. K. C., & van den Bergh, S. 1994, ApJ, 432, 75 Abraham, R., Tanvir, N., & Santiago, B. 1996, MNRAS, 279, L47 Abraham, R. G., van den Bergh, S., & Nair, P. 2003, ApJ, 588, 218 Abraham, R. G., Nair, P., McCarthy, P. J., et al. 2007, ApJ, 669, 184 Balestra, I., Mainieri, V., Popesso, P., et al. 2010, A&A, 512, A12 Bell, E. F., McIntosh, D. H., Barden, M., et al. 2004, ApJ, 600, L11 Bell, E. F., van der Wel, A., Papovich, C., et al. 2012, ApJ, 753, 167 Bershady, M. A., Jangren, A., & Conselice, C. J. 2000, AJ, 119, 2645 Buitrago, F., Trujillo, I., Conselice, C. J., et al. 2008, ApJ, 687, L61 Calzetti, D., Armus, L., Bohlin, R. C., et al. 2000, ApJ, 533, 682 Cassata, P., Cimatti, A., Franceschini, A., et al. 2005, MNRAS, 357, 903 Cassata, P., Guzzo, L., Franceschini, A., et al. 2007, ApJS, 172, 270 Cassata, P., Cimatti, A., Kurk, J., et al. 2008, A&A, 483, L39 Cassata, P., Giavalisco, M., Guo, Y., et al. 2011, ApJ, 743, 96 Cimatti, A., Cassata, P., Pozzetti, L., et al. 2008, A&A, 482, 21 Conselice, C. J., Bershady, M. A., Dickinson, M., & Papovich, C. 2003, AJ, 126, 1183 Conselice, C. J., Blackburne, J. A., & Papovich, C. 2005, ApJ, 620, 564 Conselice, C. J., Rajgor, S., & Myers, R. 2008, MNRAS, 386, 909 Conselice, C. J., Bluck, a. F. L., Ravindranath, S., et al. 2011, MNRAS, 417, 2770 Franzetti, P., Scodeggio, M., Garilli, B., et al. 2007, A&A, 465, 711 Giavalisco, M., Ferguson, H. C., Koekemoer, A. M., et al. 2004, ApJ, 600, L93 Grogin, N. A., Kocevski, D. D., Faber, S. M., et al. 2011, ApJS, 197, 35 Hogg, D. W., Blanton, M., Strateva, I., et al. 2002, AJ, 124, 646 Ilbert, O., Salvato, M., Le Floc h, E., et al. 2010, ApJ, 709, 644 Koekemoer, A. M., Faber, S. M., Ferguson, H. C., et al. 2011, ApJS, 197, 36 Kriek, M., van Dokkum, P. G., Franx, M., Illingworth, G. D., & Magee, D. K. 2009, ApJ, 705, L71 Kroupa, P. 2001, MNRAS, 322, 231 Kurk, J., Cimatti, A., Daddi, E., et al. 2013, A&A, 549, A63 Lauger, S., Burgarella, D., & Buat, V. 2005, A&A, 434, 77 Law, D. R., Steidel, C. C., Erb, D. K., et al. 2007, ApJ, 656, 1 Law, D. R., Steidel, C. C., Shapley, A. E., et al. 2012a, ApJ, 759, 29 Law, D. R., Steidel, C. C., Shapley, A. E., et al. 2012b, ApJ, 745, 85 Le Fèvre, O., Vettolani, G., Garilli, B., et al. 2005, A&A, 439, 845 Lotz, J. M., Primack, J., & Madau, P. 2004, AJ, 128, 163 Lotz, J. M., Jonsson, P., Cox, T. J., & Primack, J. R. 2008, MNRAS, 391, 1137 Maraston, C. 2005, MNRAS, 362, 799 Mignoli, M., Cimatti, A., Zamorani, G., et al. 2005, A&A, 437, 883 Moresco, M., Pozzetti, L., Cimatti, A., et al. 2010, A&A, 524, A67 Moresco, M., Pozzetti, L., Cimatti, A., et al. 2013, A&A, 558, A61 Popesso, P., Dickinson, M., Nonino, M., et al. 2009, A&A, 494, 443 Pozzetti, L., Bolzonella, M., Zucca, E., et al. 2010, A&A, 523, A13 Renzini, A. 2006, ARA&A, 44, 141 Scarlata, C., Carollo, C. M., Lilly, S. J., et al. 2007, ApJS, 172, 494 Schade, D., Lilly, S. J., Crampton, D., et al. 1995, ApJ, 451, L1 Strateva, I., Ivezić, Ž., Knapp, G. R., et al. 2001, AJ, 122, 1861 Szokoly, G. P., Bergeron, J., Hasinger, G., et al. 2004, ApJS, 155, 271 Szomoru, D., Franx, M., Bouwens, R. J., et al. 2011, ApJ, 735, L22 Szomoru, D., Franx, M., & van Dokkum, P. G. 2012, ApJ, 749, 121 Talia, M., Mignoli, M., Cimatti, A., et al. 2012, A&A, 539, A61 van der Wel, A., Bell, E. F., Häussler, B., et al. 2012, ApJS, 203, 24 Vanzella, E., Cristiani, S., Dickinson, M., et al. 2008, A&A, 478, 83 Wang, T., Huang, J.-S., Faber, S. M., et al. 2012, ApJ, 752, 134 Weiner, B. J., Phillips, A. C., Faber, S. M., et al. 2005, ApJ, 620, 595 Whitaker, K. E., Labbé, I., van Dokkum, P. G., et al. 2011, ApJ, 735, 86 Williams, R. J., Quadri, R. F., Franx, M., van Dokkum, P., & Labbé, I. 2009, ApJ, 691, 1879 Wuyts, S., Labbé, I., Franx, M., et al. 2007, ApJ, 655, 51 Wuyts, S., Förster Schreiber, N. M., Lutz, D., et al. 2011, ApJ, 738, 106 Pages 16 to 27 are available in the electronic edition of the journal at A113, page 15 of 27
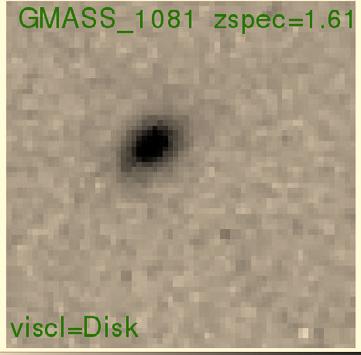
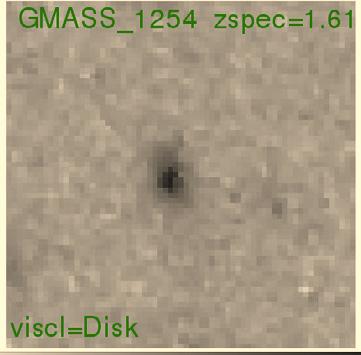
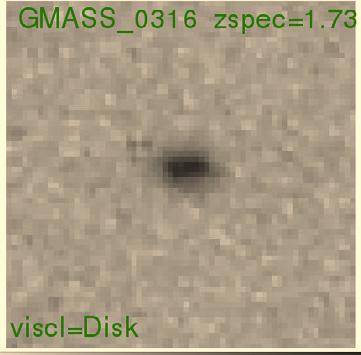
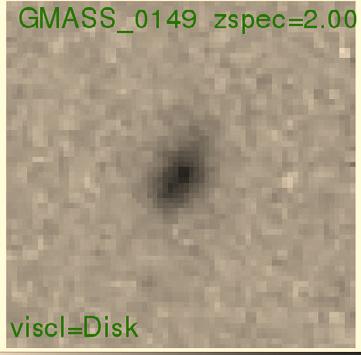
16 Appendix A: The morphological atlas Figure A.1 shows WFC3-IR H 160 cutouts of all the galaxies of our sample, arranged in order of increasing redshift. The chosen display for the 4 4 cutouts is a square root scale with fixed minimum and maximum pixel count limits, to ensure a uniform background. This means that some galaxy images may appear to be saturated. We point out, however, that the visual classification was done by looking at the images display in a linear scale too. On each snapshot, the GMASS identification number, galaxy redshift and visual classification are also indicated, using different colours according to the morphological type. A&A 562, A113 (2014) A113, page 16 of 27


17 M. Talia et al.: Listening to galaxies tuning at z : The first strikes of the Hubble fork Fig. A.1. WFC3-IR H160 cutouts of all the galaxies of our sample. A113, page 17 of 27


18 A&A 562, A113 (2014) Fig. A.1. continued. A113, page 18 of 27


19 M. Talia et al.: Listening to galaxies tuning at z : The first strikes of the Hubble fork Fig. A.1. continued. A113, page 19 of 27


20 A&A 562, A113 (2014) Fig. A.1. continued. A113, page 20 of 27


21 M. Talia et al.: Listening to galaxies tuning at z : The first strikes of the Hubble fork Fig. A.1. continued. A113, page 21 of 27


22 A&A 562, A113 (2014) Fig. A.1. continued. A113, page 22 of 27


23 M. Talia et al.: Listening to galaxies tuning at z : The first strikes of the Hubble fork Fig. A.1. continued. A113, page 23 of 27


24 A&A 562, A113 (2014) Fig. A.1. continued. A113, page 24 of 27


25 M. Talia et al.: Listening to galaxies tuning at z : The first strikes of the Hubble fork Fig. A.1. continued. A113, page 25 of 27


26 A&A 562, A113 (2014) Fig. A.1. continued. A113, page 26 of 27


27 M. Talia et al.: Listening to galaxies tuning at z : The first strikes of the Hubble fork Fig. A.1. continued. A113, page 27 of 27
Deep Keck Spectroscopy of High-Redshift Quiescent Galaxies
 Sirio Belli Max-Planck Institute for Extraterrestrial Physics Deep Keck Spectroscopy of High-Redshift Quiescent Galaxies with Andrew Newman and Richard Ellis Introduction Schawinski et al. 2014 red sequence
arxiv: v1 [astro-ph] 15 Nov 2007
![arxiv: v1 [astro-ph] 15 Nov 2007](/thumbs/89/99965365.jpg "arxiv: v1 [astro-ph] 15 Nov 2007") Mon. Not. R. Astron. Soc. 000, 1 22 (2002) Printed 2 February 2008 (MN LATEX style file v2.2) The Structures of Distant Galaxies I: Galaxy Structures and the Merger Rate to z 3 in the Hubble Ultra-Deep
Mon. Not. R. Astron. Soc. 000, 1 22 (2002) Printed 2 February 2008 (MN LATEX style file v2.2) The Structures of Distant Galaxies I: Galaxy Structures and the Merger Rate to z 3 in the Hubble Ultra-Deep
Margherita Talia 2015 A&A, 582, 80 ELG2017. University of Bologna. m g 1
 Th Co e ok SF bo R at o 1< k z< University of Bologna A. Cimatti L. Pozzetti G. Rodighiero C. Gruppioni F. Pozzi E. Daddi C. Maraston M. Mignoli J. Kurk 2015 A&A, 582, 80 3 Ca m br id g e, 18.9.2 01 7
High Redshift Universe
 High Redshift Universe Finding high z galaxies Lyman break galaxies (LBGs) Photometric redshifts Deep fields Starburst galaxies Extremely red objects (EROs) Sub-mm galaxies Lyman α systems Finding high
Yicheng Guo (UCO/Lick, UCSC)
") Formation and Evolution of Clumpy Galaxies at z=0.5--3 Yicheng Guo (UCO/Lick, UCSC) Collaborators: Henry Ferguson, Eric Bell, David Koo, Chris Conselice, Mauro Giavalisco, Nir Mandelker, Swara Ravindranatch,
Formation and Evolution of Clumpy Galaxies at z=0.5--3 Yicheng Guo (UCO/Lick, UCSC) Collaborators: Henry Ferguson, Eric Bell, David Koo, Chris Conselice, Mauro Giavalisco, Nir Mandelker, Swara Ravindranatch,
The role of galaxy merging in the life of massive galaxies
 The role of galaxy merging in the life of massive galaxies Allison Man (ESO Garching) + Sune Toft, Andrew Zirm ApJ under review, arxiv: 1410.3479 IAU Focus Meeting 14, 12th August 2015, Honolulu Image
An analogy. "Galaxies" can be compared to "cities" What would you like to know about cities? What would you need to be able to answer these questions?
 An analogy "Galaxies" can be compared to "cities" What would you like to know about cities? how does your own city look like? how big is it? what is its population? history? how did it develop? how does
Lecture 15: Galaxy morphology and environment
 GALAXIES 626 Lecture 15: Galaxy morphology and environment Why classify galaxies? The Hubble system gives us our basic description of galaxies. The sequence of galaxy types may reflect an underlying physical
Exploring the Depths of the Universe
 Exploring the Depths of the Universe Jennifer Lotz Hubble Science Briefing Jan. 16, 2014 Hubble is now observing galaxies 97% of the way back to the Big Bang, during the first 500 million years 2 Challenge:
Galaxies. Need a (physically) meaningful way of describing the relevant properties of a galaxy.
 meaningful way of describing the relevant properties of a galaxy.") Galaxies Aim to understand the characteristics of galaxies, how they have evolved in time, and how they depend on environment (location in space), size, mass, etc. Need a (physically) meaningful way of
Galaxies Aim to understand the characteristics of galaxies, how they have evolved in time, and how they depend on environment (location in space), size, mass, etc. Need a (physically) meaningful way of
SUPPLEMENTARY INFORMATION
 doi:10.1038/nature12001 Sample Selection The dusty-spectrum sources targeted for the ALMA observations described here were found in the SPT survey. The full survey comprises 2540 deg 2 of mapped sky, but
Assembly of Galaxies Across Cosmic Time: Formaton of te Hubble Sequence at High Redshift
 Assembly of Galaxies Across Cosmic Time: Formaton of te Hubble Sequence at High Redshift Yicheng Guo University of Massachusetts Collaborator: Mauro Giavalisco (UMASS), Paolo Cassata (Marseille), Henry
Dust properties of galaxies at redshift z 5-6
 Dust properties of galaxies at redshift z 5-6 Ivana Barisic 1, Supervisor: Dr. Peter L. Capak 2, and Co-supervisor: Dr. Andreas Faisst 2 1 Physics Department, University of Zagreb, Zagreb, Croatia 2 Infrared
GOODS/VIMOS Spectroscopy: Data Release Version 2.0.1
 ESO Phase 3 Data Release Description Data Collection GOODS_VIMOS_SPEC Release Number 1 Data Provider C. Cesarsky Date 10.03.2010 Migrated to Phase 3 infrastructure 08.12.2014 GOODS/VIMOS Spectroscopy:
Exploring the stellar population of nearby and high redshift galaxies with ELTs. Marco Gullieuszik INAF - Padova Observatory
 Exploring the stellar population of nearby and high redshift galaxies with ELTs INAF - Padova Observatory The team R. Falomo L. Greggio M. Uslenghi INAF Osservatorio Astronomico di Padova INAF Osservatorio
The structures of distant galaxies IV. A new empirical measurement of the time-scale for galaxy mergers implications for the merger history
 Mon. Not. R. Astron. Soc. 399, L16 L20 (2009) doi:10.1111/j.1745-3933.2009.00708.x The structures of distant galaxies IV. A new empirical measurement of the time-scale for galaxy mergers implications for
The The largest assembly ESO high-redshift. Lidia Tasca & VUDS collaboration
 The The largest assembly ESO high-redshift of massive Large galaxies Programme at 2
A comparison of LBGs, DRGs, and BzK galaxies: their contribution to the stellar mass density in the GOODS-MUSIC sample ABSTRACT
 A&A 465, 393 404 (2007) DOI: 10.1051/0004-6361:20065989 c ESO 2007 Astronomy & Astrophysics A comparison of LBGs, DRGs, and BzK galaxies: their contribution to the stellar mass density in the GOODS-MUSIC
Galaxies. The majority of known galaxies fall into one of three major classes: spirals (78 %), ellipticals (18 %) and irregulars (4 %).
, ellipticals (18 %) and irregulars (4 %).") Galaxies Collection of stars, gas and dust bound together by their common gravitational pull. Galaxies range from 10,000 to 200,000 light-years in size. 1781 Charles Messier 1923 Edwin Hubble The distribution
Galaxies Collection of stars, gas and dust bound together by their common gravitational pull. Galaxies range from 10,000 to 200,000 light-years in size. 1781 Charles Messier 1923 Edwin Hubble The distribution
SUPPLEMENTARY INFORMATION
 doi:10.1038/nature11096 Spectroscopic redshifts of CDF-N X-ray sources We have taken a recent compilation 13 as our main source of spectroscopic redshifts. These redshifts are given to two decimal places,
Analyzing Spiral Galaxies Observed in Near-Infrared
 Analyzing Spiral Galaxies Observed in Near-Infrared Preben Grosbøl European Southern Observatory Karl-Schwarzschild-Str. 2, D-85748 Garching, Germany Abstract A sample of 54 spiral galaxies was observed
Henry Ferguson 1 August 2013
 Hubble Science Briefing CANDELS - Observing Galaxy Assembly with the Hubble Space Telescope Henry Ferguson 1 August 2013 1 Cosmology in a nutshell The universe had a beginning In the beginning it was small
Modern Image Processing Techniques in Astronomical Sky Surveys
 Modern Image Processing Techniques in Astronomical Sky Surveys Items of the PhD thesis József Varga Astronomy MSc Eötvös Loránd University, Faculty of Science PhD School of Physics, Programme of Particle
Lyα-Emitting Galaxies at z=3.1: L* Progenitors Experiencing Rapid Star Formation
 Lyα-Emitting Galaxies at z=3.1: L* Progenitors Experiencing Rapid Star Formation Gawiser et al., 2007 Presented on October 22, 2009 PHYS 689: Galaxy Formation Lyman-α Emitters (LAEs) Lyα line is easily
Introduction to SDSS -instruments, survey strategy, etc
 Introduction to SDSS -instruments, survey strategy, etc (materials from http://www.sdss.org/) Shan Huang 17 February 2010 Survey type Status Imaging and Spectroscopy Basic Facts SDSS-II completed, SDSS-III
Marco Gullieuszik INAF - Osservatorio Astronomico di Padova
 Exploring the stellar population of nearby and high redshift galaxies with ELTs INAF - Osservatorio Astronomico di Padova The team R. Falomo L. Greggio M. Uslenghi INAF Osservatorio Astronomico di Padova
Kyle Lackey PHYS
 Kyle Lackey PHYS 730 9-23-15 Galaxies Large systems of gas, dust, stars, and dark matter orbiting around a common center of mass. We estimate that roughly 185 billion galaxies exist within the observable
C. Watson, E. Churchwell, R. Indebetouw, M. Meade, B. Babler, B. Whitney
 Reliability and Completeness for the GLIMPSE Survey C. Watson, E. Churchwell, R. Indebetouw, M. Meade, B. Babler, B. Whitney Abstract This document examines the GLIMPSE observing strategy and criteria
Observing the Formation of Dense Stellar Nuclei at Low and High Redshift (?) Roderik Overzier Max-Planck-Institute for Astrophysics
 Roderik Overzier Max-Planck-Institute for Astrophysics") Observing the Formation of Dense Stellar Nuclei at Low and High Redshift (?) Roderik Overzier Max-Planck-Institute for Astrophysics with: Tim Heckman (JHU) GALEX Science Team (PI: Chris Martin), Lee Armus,
Observing the Formation of Dense Stellar Nuclei at Low and High Redshift (?) Roderik Overzier Max-Planck-Institute for Astrophysics with: Tim Heckman (JHU) GALEX Science Team (PI: Chris Martin), Lee Armus,
There are three main ways to derive q 0 :
 Measuring q 0 Measuring the deceleration parameter, q 0, is much more difficult than measuring H 0. In order to measure the Hubble Constant, one needs to derive distances to objects at 100 Mpc; this corresponds
Multi-wavelength Surveys for AGN & AGN Variability. Vicki Sarajedini University of Florida
 Multi-wavelength Surveys for AGN & AGN Variability Vicki Sarajedini University of Florida What are Active Galactic Nuclei (AGN)? Galaxies with a source of non-stellar emission arising in the nucleus (excessive
Star-formation Across Cosmic Time: Initial Results from the e-merge Study of the μjy Radio Source Population. SPARCs VII The Precursors Awaken
 Star-formation Across Cosmic Time: Initial Results from the e-merge Study of the μjy Radio Source Population SPARCs VII The Precursors Awaken Tom Muxlow & Nick Wrigley JBCA Manchester for the e-merge Consortium
9. Evolution with redshift - z > 1.5. Selection in the rest-frame UV
 11-5-10see http://www.strw.leidenuniv.nl/ franx/college/galaxies10 10-c09-1 11-5-10see http://www.strw.leidenuniv.nl/ franx/college/galaxies10 10-c09-2 9. Evolution with redshift - z > 1.5 Selection in
Stellar Populations: Resolved vs. unresolved
 Outline Stellar Populations: Resolved vs. unresolved Individual stars can be analyzed Applicable for Milky Way star clusters and the most nearby galaxies Integrated spectroscopy / photometry only The most
Resolved Star Formation Surface Density and Stellar Mass Density of Galaxies in the Local Universe. Abstract
 Resolved Star Formation Surface Density and Stellar Mass Density of Galaxies in the Local Universe Abdurrouf Astronomical Institute of Tohoku University Abstract In order to understand how the stellar
Galaxies with Active Nuclei. Active Galactic Nuclei Seyfert Galaxies Radio Galaxies Quasars Supermassive Black Holes
 Galaxies with Active Nuclei Active Galactic Nuclei Seyfert Galaxies Radio Galaxies Quasars Supermassive Black Holes Active Galactic Nuclei About 20 25% of galaxies do not fit well into Hubble categories
Wide Field Camera 3: The SOC Science Program Proposal
 Wide Field Camera 3: The SOC Science Program Proposal Text An extraordinary panchromatic survey efficiency covering a critical decade of frequency space combined Theme I: Star Formation at Half the Hubble
Deep fields around bright stars ( Galaxies around Stars )
") Deep fields around bright stars ( Galaxies around Stars ) Scientific context: the morphological evolution of faint field galaxies Near-IR observations ground-based observations with AO: PUEO/CFHT deep
Deep fields around bright stars ( Galaxies around Stars ) Scientific context: the morphological evolution of faint field galaxies Near-IR observations ground-based observations with AO: PUEO/CFHT deep
Quantifying the Assembly History of Elliptical Galaxies
 Quantifying the Assembly History of Elliptical Galaxies Michael Pierce (University of Wyoming) A Science Use Case for GMT and TMT Origin of Elliptical Galaxies! Elliptical Galaxies Form Through Mergers!
Part III: Circumstellar Properties of Intermediate-Age PMS Stars
 160 Part III: Circumstellar Properties of Intermediate-Age PMS Stars 161 Chapter 7 Spitzer Observations of 5 Myr-old Brown Dwarfs in Upper Scorpius 7.1 Introduction Ground-based infrared studies have found
BUILDING GALAXIES. Question 1: When and where did the stars form?
 BUILDING GALAXIES The unprecedented accuracy of recent observations of the power spectrum of the cosmic microwave background leaves little doubt that the universe formed in a hot big bang, later cooling
Optical and Spectroscopic Follow-Up of the Deeper FIR Selected Sample
 Mem. S.A.It. Suppl. Vol. 5, 267 c SAIt 24 Memorie della Supplementi Optical and Spectroscopic Follow-Up of the Deeper FIR Selected Sample D. Bettoni, P. Mazzei, A. Della Valle, G. DeZotti A. Franceschini
Two Main Techniques. I: Star-forming Galaxies
 p.1/24 The high redshift universe has been opened up to direct observation in the last few years, but most emphasis has been placed on finding the progenitors of today s massive ellipticals. p.2/24 Two
GOODS/FORS2 Final Data Release: Version 3.0
 ESO Phase 3 Data Release Description Data Collection GOODS_FORS2 Release Number 1 Data Provider C. Cesarsky Date 30.10.2007 update 11.07.2014 GOODS/FORS2 Final Data Release: Version 3.0 As part of the
TOTAL TO CENTRAL LUMINOSITY RATIOS OF MASSIVE
 TOTAL TO CENTRAL LUMINOSITY RATIOS OF MASSIVE QUIESCENT GALAXIES IN MODS AS AN INDICATOR OF GALAXY SIZE EVOLUTION Mohammad Akhlaghi Takashi Ichikawa MODS team Astronomical Institute Tohoku University October
Lecture 11: SDSS Sources at Other Wavelengths: From X rays to radio. Astr 598: Astronomy with SDSS
 Astr 598: Astronomy with SDSS Spring Quarter 4, University of Washington, Željko Ivezić Lecture : SDSS Sources at Other Wavelengths: From X rays to radio Large Surveys at Many Wavelengths SDSS: UV-IR five-band
Galaxy Collisions & the Origin of Starburst Galaxies & Quasars. February 24, 2003 Hayden Planetarium
 Galaxy Collisions & the Origin of Starburst Galaxies & Quasars February 24, 2003 Hayden Planetarium Normal massive galaxy types elliptical & spiral galaxies Spiral Bulge of old stars Large black hole Very
SURVEYS: THE MASS ASSEMBLY AND STAR FORMATION HISTORY
 Lecture #4 SURVEYS: THE MASS ASSEMBLY AND STAR FORMATION HISTORY Observational facts Olivier Le Fèvre ON Rio de Janeiro School 2014 Putting it all together Clear survey strategies Instrumentation and observing
Multi-wavelength analysis of Hickson Compact Groups of Galaxies.
 Multi-wavelength analysis of Hickson Compact Groups of Galaxies. Thodoris Bitsakis Department of Physics, University of Crete Paper: Bitsakis T., Charmandaris V., da Cunha E., Diaz-Santos T., Le Floc h
Quantifying the (Late) Assembly History of Galaxies. Michael Pierce (University of Wyoming)
 Assembly History of Galaxies. Michael Pierce (University of Wyoming)") Quantifying the (Late) Assembly History of Galaxies Michael Pierce (University of Wyoming) What I Think We Already Know: Morphology Density Relation (Assembly Depends on Environment) (Dressler 1980) Ratio
Quantifying the (Late) Assembly History of Galaxies Michael Pierce (University of Wyoming) What I Think We Already Know: Morphology Density Relation (Assembly Depends on Environment) (Dressler 1980) Ratio
Unveiling the nature of bright z ~ 7 galaxies with HST and JWST
 Unveiling the nature of bright z ~ 7 galaxies with HST and JWST Rebecca Bowler Hintze Fellow, University of Oxford Nicholas Kurti Junior Fellow, Brasenose College with Jim Dunlop, Ross McLure, Derek McLeod,
A Monster at any other Epoch:
 A Monster at any other Epoch: Are Intermediate Redshift ULIRGs the Progenitors of QSO Host Galaxies? Barry Rothberg Large Binocular Telescope Observatory/George Mason University Co-Is: J. Fischer (NRL),
Exploring massive galaxy evolution with deep multi-wavelength surveys
 Exploring massive galaxy evolution with deep multi-wavelength surveys Ross McLure, Henry Pearce, Michele Cirasuolo, Jim Dunlop (Edinburgh) Omar Almaini (Nottingham), Chris Simpson (Liverpool) Outline 1.
Cross-Talk in the ACS WFC Detectors. I: Description of the Effect
 Cross-Talk in the ACS WFC Detectors. I: Description of the Effect Mauro Giavalisco August 10, 2004 ABSTRACT Images acquired with the Wide Field Channel (WFC) of the Advanced Camera for Surveys (ACS) are
Stellar populations of quasar host galaxies
 Knud Jahnke AIP Galaxies division Hauskolloquium 10.01.2003 Introduction/motivation Multicolour imaging On-nucleus spectroscopy What does this teach us? Outlook Overview Introduction Introduction HE 1043
Gas Masses and Gas Fractions: Applications of the Kennicutt- Schmidt Law at High Redshift
 Gas Masses and Gas Fractions: Applications of the Kennicutt- Schmidt Law at High Redshift Dawn Erb (CfA) Kennicutt-Schmidt Workshop, UCSD December 19, 2006 Overview Properties of star-forming galaxies
Measuring Black Hole Masses in Nearby Galaxies with Laser Guide Star Adaptive Optics
 Measuring Black Hole Masses in Nearby Galaxies with Laser Guide Star Adaptive Optics Claire Max Anne Medling Mark Ammons UC Santa Cruz Ric Davies Hauke Engel MPE-Garching Image of NGC 6240: Bush et al.
Science with Micado. the high resolution camera for the E-ELT Renato Falomo. INAF Observatory of Padova, Italy. 25 February IASF, Milano
 Science with Micado the high resolution camera for the E-ELT Renato Falomo INAF Observatory of Padova, Italy 25 February 2010 -- IASF, Milano Overview of MICADO (Tehnology & Science) Resolved stellar population
Evidence of multiple stellar components in high-z elliptical galaxies from spectral indices and high resolution images
 Evidence of multiple stellar components in high-z elliptical galaxies from spectral indices and high resolution images ILARIA LONOCE ADRIANA GARGIULO Paolo Saracco Marcella Longhetti Sonia Tamburri Outline
Galaxies 626. Lecture 9 Metals (2) and the history of star formation from optical/uv observations
 and the history of star formation from optical/uv observations") Galaxies 626 Lecture 9 Metals (2) and the history of star formation from optical/uv observations Measuring metals at high redshift Metals at 6 How can we measure the ultra high z star formation? One robust
Galaxies 626 Lecture 9 Metals (2) and the history of star formation from optical/uv observations Measuring metals at high redshift Metals at 6 How can we measure the ultra high z star formation? One robust
Massively Star-Forming Dusty Galaxies. Len Cowie JCMT Users Meeting
 Massively Star-Forming Dusty Galaxies Len Cowie JCMT Users Meeting The luminous dusty star-formation history: We are using SCUBA-2 to address three questions What fraction of the SF is in luminous dusty
SUPPLEMENTARY INFORMATION
 1. Identification of classical Cepheids: We identified three classical Cepheids amongst the 45 short-period variables discovered. Our sample includes classical Cepheids, type II Cepheids, eclipsing binaries
High-Redshift Galaxies: A brief summary
 High-Redshift Galaxies: A brief summary Brant Robertson (Caltech) on behalf of David Law (UCLA), Bahram Mobasher (UCR), and Brian Siana (Caltech/Incoming CGE) Observable Cosmological History t~3.7x10 5
Star Formation. Spitzer Key Contributions to Date
 Star Formation Answering Fundamental Questions During the Spitzer Warm Mission Phase Lori Allen CfA John Carpenter, Caltech Lee Hartmann, University of Michigan Michael Liu, University of Hawaii Tom Megeath,
Calibration of ACS Prism Slitless Spectroscopy Modes
 The 2005 HST Calibration Workshop Space Telescope Science Institute, 2005 A. M. Koekemoer, P. Goudfrooij, and L. L. Dressel, eds. Calibration of ACS Prism Slitless Spectroscopy Modes S. S. Larsen, M. Kümmel
arxiv: v1 [astro-ph] 18 Mar 2008
![arxiv: v1 [astro-ph] 18 Mar 2008](/thumbs/89/98392787.jpg "arxiv: v1 [astro-ph] 18 Mar 2008") The 2dF Redshift Survey II: UGC 8584 - Redshift Periodicity and Rings H. Arp Max-Planck-Institut für Astrophysik, Karl Schwarzschild-Str.1, Postfach 1317, D-85741 Garching, Germany arxiv:0803.2591v1 [astro-ph]
The 2dF Redshift Survey II: UGC 8584 - Redshift Periodicity and Rings H. Arp Max-Planck-Institut für Astrophysik, Karl Schwarzschild-Str.1, Postfach 1317, D-85741 Garching, Germany arxiv:0803.2591v1 [astro-ph]
LEGA-C. The Physics of Galaxies 7 Gyr Ago. Arjen van der Wel Max Planck Institute for Astronomy, Heidelberg
 LEGA-C The Physics of Galaxies 7 Gyr Ago Arjen van der Wel Max Planck Institute for Astronomy, Heidelberg How do galaxies assemble their stellar bodies? Collection of large samples at large lookback times
arxiv: v4 [astro-ph.ga] 26 Jan 2016
![arxiv: v4 [astro-ph.ga] 26 Jan 2016](/thumbs/82/86266467.jpg "arxiv: v4 [astro-ph.ga] 26 Jan 2016") Mon. Not. R. Astron. Soc. 000, 1 27 (2002) Printed 29 June 2018 (MN LATEX style file v2.2) Non-parametric analysis of the rest-frame UV sizes and morphological disturbance amongst L galaxies at 4 < z
Mon. Not. R. Astron. Soc. 000, 1 27 (2002) Printed 29 June 2018 (MN LATEX style file v2.2) Non-parametric analysis of the rest-frame UV sizes and morphological disturbance amongst L galaxies at 4 < z
arxiv: v1 [astro-ph.co] 29 Jan 2013
![arxiv: v1 [astro-ph.co] 29 Jan 2013](/thumbs/92/107896712.jpg "arxiv: v1 [astro-ph.co] 29 Jan 2013") Draft version July 1, 2018 Preprint typeset using L A TEX style emulateapj v. 12/16/11 WHAT ARE THE PROGENITORS OF COMPACT, MASSIVE, QUIESCENT GALAXIES AT Z = 2.3? THE POPULATION OF MASSIVE GALAXIES AT
Draft version July 1, 2018 Preprint typeset using L A TEX style emulateapj v. 12/16/11 WHAT ARE THE PROGENITORS OF COMPACT, MASSIVE, QUIESCENT GALAXIES AT Z = 2.3? THE POPULATION OF MASSIVE GALAXIES AT
Source plane reconstruction of the giant gravitational arc in Abell 2667: a condidate Wolf-Rayet galaxy at z 1
 Source plane reconstruction of the giant gravitational arc in Abell 2667: a condidate Wolf-Rayet galaxy at z 1 Speaker: Shuo Cao Department of Astronomy Beijing Normal University Collaborators: Giovanni
Supplementary Information for SNLS-03D3bb a super- Chandrasekhar mass Type Ia supernova
 1 Supplementary Information for SNLS-03D3bb a super- Chandrasekhar mass Type Ia supernova SN Location SNLS-03D3bb is located at RA: 14:16:18.920 Dec: +52:14:53.66 (J2000) in the D3 (extended Groth Strip)
Galaxy Morphology. - a description of the structure of galaxies
 Galaxy Morphology - a description of the structure of galaxies Galaxy Morphology - a description of the structure of galaxies Galaxy Morphology - a description of the structure of galaxies Clearly astronomical
SKINAKAS OBSERVATORY. Astronomy Projects for University Students PROJECT GALAXIES
 PROJECT 7 GALAXIES Objective: The topics covered in the previous lessons target celestial objects located in our neighbourhood, i.e. objects which are within our own Galaxy. However, the Universe extends
Selection of stars to calibrate Gaia
 Highlights of Spanish Astrophysics VIII, Proceedings of the XI Scientific Meeting of the Spanish Astronomical Society held on September 8 12, 2014, in Teruel, Spain. A. J. Cenarro, F. Figueras, C. Hernández-
Tour of Galaxies. Sgr A* VLT in IR + adaptive optics. orbits. ASTR 1040 Accel Astro: Stars & Galaxies VLT IR+AO
 ASTR 1040 Accel Astro: Stars & Galaxies Prof. Juri Toomre TA: Kyle Augustson Lecture 23 Tues 8 Apr 08 zeus.colorado.edu/astr1040-toomre toomre Tour of Galaxies Briefly revisit Monster in the Milky Way
A MUSE view of cd galaxy NGC 3311
 A MUSE view of cd galaxy NGC 3311 C. E. Barbosa 1, M. Arnaboldi 2, L. Coccato 2, O. Gerhard 3, C. Mendes de Oliveira 1, M. Hilker 2, T. Richtler 4 1 Universidade de São Paulo, São Paulo, Brazil 2 European
Other Galaxy Types. Active Galaxies. A diagram of an active galaxy, showing the primary components. Active Galaxies
 Other Galaxy Types Active Galaxies Active Galaxies Seyfert galaxies Radio galaxies Quasars Origin??? Different in appearance Produce huge amount of energy Similar mechanism a Galactic mass black hole at
THE GAS MASS AND STAR FORMATION RATE
 THE GAS MASS AND STAR FORMATION RATE OF STAR-FORMING GALAXIES AT z ~ 1.3 Nissim Kanekar National Centre for Radio Astrophysics, Pune Apurba Bera Shiv Sethi Ben Weiner K. Dwarakanath Image: B. Premkumar
First results from the Stockholm VIMOS Supernova Survey
 First results from the Stockholm VIMOS Supernova Survey - Detection efficiencies and photometric accuracy in supernova surveys Outline The Stockholm VIMOS Supernova Survey, SVISS. First results from the
Star Formation. Answering Fundamental Questions During the Spitzer Warm Mission Phase
 Star Formation Answering Fundamental Questions During the Spitzer Warm Mission Phase Lori Allen CfA John Carpenter, Caltech Lee Hartmann, University of Michigan Michael Liu, University of Hawaii Tom Megeath,
15m James Clerk Maxwell Telescope (JCMT) Surface accuracy : 24 micron Pointing accuracy : 2 arcsec in Azimuth and Elevation
 Surface accuracy : 24 micron Pointing accuracy : 2 arcsec in Azimuth and Elevation") 15m James Clerk Maxwell Telescope (JCMT) Surface accuracy : 24 micron Pointing accuracy : 2 arcsec in Azimuth and Elevation Continuum Instrumentation 5120 bolometers (4 sub arrays x 1280 bolometers) at
15m James Clerk Maxwell Telescope (JCMT) Surface accuracy : 24 micron Pointing accuracy : 2 arcsec in Azimuth and Elevation Continuum Instrumentation 5120 bolometers (4 sub arrays x 1280 bolometers) at
Molecular Gas and the Host Galaxies of Infrared-Excess Quasi-Stellar Objects
 Molecular Gas and the Host Galaxies of Infrared-Excess Quasi-Stellar Objects A. S. Evans (Stony Brook) J. A. Surace & D. T. Frayer (Caltech) D. B. Sanders (Hawaii) Luminous Infrared Galaxies Properties
The Effective Spectral Resolution of the WFC and HRC Grism
 The Effective Spectral Resolution of the WFC and HRC Grism A. Pasquali, N. Pirzkal, J.R. Walsh, R.N. Hook, W. Freudling, R. Albrecht, R.A.E. Fosbury March 7, 2001 ABSTRACT We present SLIM simulations of
arxiv:astro-ph/ v1 9 Jan 2007
 Astronomy & Astrophysics manuscript no. 5989pap c ESO 2018 January 1, 2018 arxiv:astro-ph/0701233v1 9 Jan 2007 A comparison among LBGs, DRGs and BzK galaxies: their contribution to the stellar mass density
Chapter 25: Galaxy Clusters and the Structure of the Universe
 Chapter 25: Galaxy Clusters and the Structure of the Universe Distribution of galaxies Evolution of galaxies Study of distant galaxies Distance derived from redshift Hubble s constant age of the Universe:
CHEMICAL ABUNDANCE ANALYSIS OF RC CANDIDATE STAR HD (46 LMi) : PRELIMINARY RESULTS
 : PRELIMINARY RESULTS") Dig Sites of Stellar Archeology: Giant Stars in the Milky Way Ege Uni. J. of Faculty of Sci., Special Issue, 2014, 145-150 CHEMICAL ABUNDANCE ANALYSIS OF RC CANDIDATE STAR HD 94264 (46 LMi) : PRELIMINARY
Dig Sites of Stellar Archeology: Giant Stars in the Milky Way Ege Uni. J. of Faculty of Sci., Special Issue, 2014, 145-150 CHEMICAL ABUNDANCE ANALYSIS OF RC CANDIDATE STAR HD 94264 (46 LMi) : PRELIMINARY
Susan Kassin (Oxford) with Ben Weiner (Steward), Christopher Willmer (Steward), + DEEP2 Survey Team (Faber, Koo, Davis, Guhathakurta)
 with Ben Weiner (Steward), Christopher Willmer (Steward), + DEEP2 Survey Team (Faber, Koo, Davis, Guhathakurta)") Disk Galaxy Kinematics Over the Last ~8 Gyrs Susan Kassin (Oxford) with Ben Weiner (Steward), Christopher Willmer (Steward), + DEEP2 Survey Team (Faber, Koo, Davis, Guhathakurta) Data are from the DEEP2
Disk Galaxy Kinematics Over the Last ~8 Gyrs Susan Kassin (Oxford) with Ben Weiner (Steward), Christopher Willmer (Steward), + DEEP2 Survey Team (Faber, Koo, Davis, Guhathakurta) Data are from the DEEP2
The PRIsm MUlti-object Survey (PRIMUS)
") The PRIsm MUlti-object Survey (PRIMUS) Alison Coil University of Arizona Steward Observatory March 2008 Overview: Galaxy evolution to z ~ 1 is still cosmic variance limited: DEEP2, VVDS, COMBO-17, COSMOS
The PRIsm MUlti-object Survey (PRIMUS) Alison Coil University of Arizona Steward Observatory March 2008 Overview: Galaxy evolution to z ~ 1 is still cosmic variance limited: DEEP2, VVDS, COMBO-17, COSMOS
Probing the evolution of massive galaxies with the K20 survey
 Probing the evolution of massive galaxies with the K20 survey Andrea Cimatti Osservatorio Astrofisico di Arcetri, Largo E. Fermi 5, I-50125, Firenze, Italy Abstract. The motivations and the status of the
Gas Kinematics of Intermediate - Redshift Galaxies. B. Epinat LAM
 Gas Kinematics of Intermediate - Redshift Galaxies B. Epinat LAM Open issues on galaxy evolution Processes of galaxy mass assembly Mergers vs. Smooth gas accretion? Construction of Hubble Sequence Impact
Clusters of galaxies
 Clusters of galaxies Most galaxies belong to some larger bound structure. Conventionally consider groups and clusters, with characteristic properties: Groups Clusters Core radius 250 h -1 kpc 250 h -1
Spectroscopic Identification of Galaxies in the HUDF using MUSE
 Spectroscopic Identification of Galaxies in the HUDF using MUSE Hylke Hoogland Kapteyn Astronomical Institute, Rijksuniversiteit Groningen June 24, 2016 Abstract The Hubble Ultra-Deep Field (HUDF) is the
ISM and Galaxy Evolution the ELT View Alvio Renzini, INAF Padova
 ISM and Galaxy Evolution the ELT View Alvio Renzini, INAF Padova Starlight, HII & AGN Dust & Molecules Where we stand and looking in perspective The current generation of ground & space telescopes are
Deep Surveys or How We Learn About the Early Universe When We Can t Measure All that Would Be Nice!
 Deep Surveys or How We Learn About the Early Universe When We Can t Measure All that Would Be Nice! Presented at the AAS Seminar on Infrared Astronomy, AAS Meeting, Jan 7, 2003, Seattle Marcia Rieke mrieke@as.
Investigating the connection between LyC and Lyα emission and other indirect indicators
 Investigating the connection between LyC and Lyα emission and other indirect indicators F. Marchi, L. Pentericci, L. Guaita, D. Schaerer, M. Castellano, B. Ribeiro and the VUDS collaboration Emission line
arxiv: v1 [astro-ph.ga] 24 Sep 2014
![arxiv: v1 [astro-ph.ga] 24 Sep 2014](/thumbs/90/103246759.jpg "arxiv: v1 [astro-ph.ga] 24 Sep 2014") Submitted to ApJ Preprint typeset using L A TEX style emulateapj v. 5/2/11 STELLAR POPULATIONS FROM SPECTROSCOPY OF A LARGE SAMPLE OF QUIESCENT GALAXIES AT Z > 1: MEASURING THE CONTRIBUTION OF PROGENITOR
Submitted to ApJ Preprint typeset using L A TEX style emulateapj v. 5/2/11 STELLAR POPULATIONS FROM SPECTROSCOPY OF A LARGE SAMPLE OF QUIESCENT GALAXIES AT Z > 1: MEASURING THE CONTRIBUTION OF PROGENITOR
Automated Search for Lyman Alpha Emitters in the DEEP3 Galaxy Redshift Survey
 Automated Search for Lyman Alpha Emitters in the DEEP3 Galaxy Redshift Survey Victoria Dean Castilleja School Automated Search for Lyman-alpha Emitters in the DEEP3 Galaxy Redshift Survey Abstract This
arxiv:astro-ph/ v1 2 Sep 2004
 DRAFT VERSION OCTOBER 22, 2018 Preprint typeset using LATEX style emulateapj v. 3/25/03 A NEW PHOTOMETRIC TECHNIQUE FOR THE JOINT SELECTION OF STAR-FORMING AND PASSIVE GALAXIES AT 1.4 < z < 2.5 1 E. DADDI
GALAXIES. I. Morphologies and classification 2. Successes of Hubble scheme 3. Problems with Hubble scheme 4. Galaxies in other wavelengths
 GALAXIES I. Morphologies and classification 2. Successes of Hubble scheme 3. Problems with Hubble scheme 4. Galaxies in other wavelengths 5. Properties of spirals and Irregulars. Hubble tuning-fork diagram.
Galaxies 626. Lecture 10 The history of star formation from far infrared and radio observations
 Galaxies 626 Lecture 10 The history of star formation from far infrared and radio observations Cosmic Star Formation History Various probes of the global SF rate: ρ* (z) M yr 1 comoving Mpc 3 UV continuum