High latitude Galactic dust emission in the BOOMERanG maps
|
|
|
- Blaise Cecil Daniels
- 6 years ago
- Views:
Transcription
1 High latitude Galactic dust emission in the BOOMERanG maps S. Masi 1, P.A.R. Ade 2,J.J Bock 3,4, A. Boscaleri 5, B.P. Crill 3, P. de Bernardis 1, M. Giacometti 1, E. Hivon 3, V.V. Hristov 3, A.E. Lange 3, P.D. Mauskopf 6, T. Montroy 7, C.B. Netterfield 8, E. Pascale 5, F. Piacentini 1, S. Prunet 8, J. Ruhl 7 arxiv:astro-ph/ v1 30 Jan Dipartimento di Fisica, Universita La Sapienza, Roma, Italy 2 QMWC London UK 3 CALTECH, Pasadena, USA 4 JPL, Pasadena, USA 5 IROE-CNR, Firenze, Italy 6 Department of Astronomy, Univ. of Wales, UK 7 Department of Astronomy, Univ. of California at Santa Barbara, USA 8 Department of Astronomy, Univ. of Toronto, Canada Received ; accepted submitted to The Astrophysical Journal, 30/jan/2000
2 2 ABSTRACT We present mm-wave observations obtained by the BOOMERanG experiment of Galactic emission at intermediate and high (b < 20 o ) Galactic latitudes. We find that this emission is well correlated with extrapolation of the IRAS-DIRBE maps, and is spectrally consistent with thermal emission from interstellar dust (ISD). The ISD brightness in the 410 GHz map has an angular power spectrum c l l β with 2 < β < 3. At 150 GHz and at multipoles l 200 the angular power spectrum of the IRAS-correlated dust signal is estimated to be l(l+1)c l /2π = (3.7±2.9)µK 2. This is negligible with respect to the CMB signal measured by the same experiment l(l + 1)c l /2π = (4700 ± 540)µK 2. For the uncorrelated dust signal we set an upper limit to the contribution to the CMB power at 150GHz and l 200 of l(l+1)c l /2π < 3µK 2 at 95% C.L.. Subject headings: interstellar matter, cosmology, cosmic microwave background 1. Introduction The patchy emission of our Galaxy is a major concern for experiments designed to measure the anisotropy of the Cosmic Microwave Background (CMB). A precision phase, where temperature fluctuations are measured with a sensitivity of the order of tens of µk per pixel, has now begun (de Bernardis et al. 2000; Hanany et al. 2000). Forthcoming full-sky coverage space missions (MAP 2000; Planck 2000), and a host of future sub-orbital experiments are expected to reach sensitivities of a few µk per pixel. To fully exploit the potential of these new surveys, our knowledge of the diffuse emission of our Galaxy at high Galactic latitudes must improve as well. At frequencies above 100 GHz this emission is dominated by thermal radiation from
3 3 large dust grains, heated by the interstellar radiation field to T d 10 30K. The ISD is distributed in filamentary cirrus -like clouds and covers the sky even at high Galactic latitudes (Low et al. 1984). The spectrum of this component in the GHz range has been mapped with coarse (7 o ) angular resolution and high sensitivity by the COBE- FIRAS experiment (Wright et al. 1991). The COBE-DIRBE maps provide higher angular resolution 0.7 o, at > 1250 GHz (Hauser et al. 1998; Arendt et al. 1998). Arcminutes resolution maps from the IRAS satellite are available only at > 3000 GHz. These have been recalibrated using the COBE-DIRBE maps at 3000 and 1250 GHz(Schlegel et al. 1999), and extrapolated to longer wavelengths using a variety of physical models (Lagache et al. 1998; Finkbeiner et al. 1999; Lagache et al. 2000; Tegmark et al. 2000). At those longer wavelengths very few experimental data are available at subdegree resolution (see e.g. Masi et al. 1995; Masi et al. 1996; Lim et al. 1996; Leitch et al. 1997; de Oliveira-Costa 1997; Cheng et al 1997). Anomalous emission, morphologically correlated with the IRAS map but much larger than a naive extrapolation of thermal dust emission, has been detected in the microwaves (Kogut et al. 1996a; Kogut et al. 1996b; Lim et al. 1996; Leitch et al. 1997; de Oliveira-Costa 1997; de Oliveira-Costa et al. 1998; Mukherjee et al. 1999; Draine and Lazarian 1998; de Oliveira-Costa et al. 2000). Here we analyze 90, 150, 240 and 410 GHz maps of 3% of the sky at Galactic latitudes 10 o < b < 60 o. We compute the frequency and angular power spectrum of the fluctuations in these maps. We find that these maps are correlated with the emission mapped by IRAS extrapolated to our wavelengths using (Finkbeiner et al. 1999) model number 8. We will refer to this as FDS8 in the following. We also set upper limits to the level of residual, non-cmb structures, that are not correlated with FDS8.
4 4 2. Observations We use the maps obtained from the 1998 long duration flight of the BOOMERanG experiment (de Bernardis et al. 2000), all pixelized with 7 pixels and smoothed to a resolution of 22.5 arcmin FWHM. The instrument was calibrated against the CMB dipole at 90, 150, 240 GHz (10% uncertainty), and against the rms CMB anisotropy at 410GHz (20% uncertainty) (Crill et al. 2000). The conversion factors from CMB temperature fluctuations to brightness in our 4 bands are 195,426,471,204(MJy/sr)/K CMB at 90, 150, 240 and 410 GHz respectively. We used a single channel at 90 and at 410 GHz, and combined 3 channels at 150 GHz and 3 channels at 240 GHz. About 1300 square degrees were observed at high galactic latitudes ( 60 o < b < 20 o ; 230 o < l < 270 o ; constellations of Caelum, Doradus, Pictor, Columba, Puppis), including a region with the lowest amount of dust emission of the full sky. In the observed region the fluctuation of the 100 µm brightness mapped by IRAS is well below 1 MJy/sr in over 500 square degrees. The BOOMERanG maps have been obtained from the raw data using an iterative algorithm (Prunet et al. 2000). This reduces the large scale artifacts due to 1/f noise, and correctly estimates the noise in the datastream, while producing a maximum likelihood map. Structures at scales larger than 10 o are effectively removed in the process. This fact must be taken into account when comparing the BOOMERanG maps to other maps of the sky. In addition to the four frequencies mapped by BOOMERanG, we use the FDS8 dust maps as explained in next section. 3. The 410 GHz dust monitor The highest frequency channel of the BOOMERanG photometer is centered at 410 GHz, with a FWHM of 26 GHz. At this frequency, the brightness of the CMB is smaller than at our lower frequencies, while thermal emission from Galactic dust is much larger.
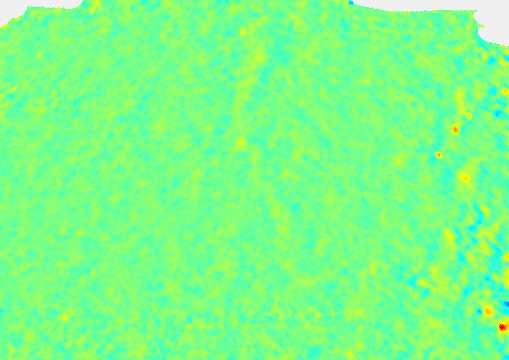
5 5 The 410 GHz map of the sky obtained by BOOMERanG is dominated by faint cirrus clouds at intermediate Galactic latitudes ( 10 o < b < 20 o ). In fig.1 we compare our 410 GHz map (top panel) to the FDS8 extrapolation of the IRAS map (middle panel) obtained as follows. FDS8 assumes two components of ISD with different temperature and spectral index of dust emissivity. The two temperatures depend on the observed direction. On the average < T d,1 > 16.2K,< T d,2 > 9.4K, and the average ratio between dust brightness at 3000 GHz and dust brightness at 410 GHz is 13. The extrapolated map has been sampled along the scans of the 410 GHz channel of BOOMERanG, and then high-pass and low-pass filtered using the 410 GHz detector transfer function, in order to create a synthesized time-stream. The time stream has been processed in the same way as the BOOMERanG data, and smoothed to 22.5 arcmin to obtain the map shown in the middle panel of fig.1. The morphological and amplitude agreement of the two maps provides evidence that the 410 GHz data represent a good monitor for interstellar dust emission in the BOOMERanG data. Bright compact structures apparent in the difference map (lower panel in fig.1) correspond to the dense, cool cores of clouds that are not well modelled in FDS8. The remaining structures are mostly due to residual noise in the BOOMERanG data. In a similar way we obtained extrapolated maps for the other BOOMERanG channels. We have computed the power spectrum of the 410 GHz map in three circular regions, each 18 o in diameter, centered at (RA, dec, b) = (107 o, -47 o, -17 o ), (92 o, -48 o, -27 o ), (74 o, -46 o, -38 o ) i.e. low, intermediate and high Galactic latitudes respectively. We used a spherical harmonics transform and corrected for the finite size of the cap, for filtering applied in the time domain, and for the contribution of instrumental noise (Hivon et al. 2001). The results are shown in figure 2. The contribution of CMB anisotropy to these spectra is computed to be negligible. The errors have been computed by adding two contributions. The first one is an estimate of instrumental noise. The second is an estimate of sampling variance (see e.g. Scott et al. 93) for a gaussian field having the same power spectrum. The
6 6 latter has to be included if we want to consider the measured spectrum as representative of ISD fluctuations in the Galaxy in general. The spectrum at the highest Galactic latitude is basically an upper limit for dust fluctuations, since the residual fluctuations are comparable to our estimate of detector noise plus CMB anisotropy. The spectra at low and intermediate latitudes are well fit by a power law c l l β as in previous studies based on IRAS and DIRBE maps (Gautier et al. 1992; Low and Cutri 1994; Guarini et al. 1995; Wright 1998; Schlegel et al. 1999). We find a power law exponent 2 < β < 3, consistent with the studies cited above, thus extending this result to wavelengths very close to those used for CMB studies. The power spectra of FDS8 at 410 GHz in the same regions are also shown in fig.2 for comparison. The agreement is very good for the region centered at b = 17 o, where detector noise is negligible. The agreement is also good in the region centered at b = 27 o, but a systematic amplitude difference is evident. We estimate upper limits for the fluctuations due to any dust component not correlated with IRAS by computing the spectrum of the difference map obtained removing the F8 map from the measured 400GHz map. The upper limits are of the same order of magnitude of the errors in the measured power spectrum of the 400 GHz map. 4. Pixel-pixel correlations We made pixel-pixel correlations between our four maps and the corresponding FDS8 maps. The signal in each of our channels is a linear combination of Galactic emission, CMB anisotropies and noise. The relative weight of the Galactic and the CMB components depends on the Galactic latitude and on the frequency of the channel. The advantage of correlating with the FDS8 maps is that the noises are uncorrelated, and at 3000 GHz the CMB is totally negligible. Any detected correlation is thus due to Galactic emission. In the BOOMERanG 410 GHz channel we expect to have little CMB anisotropy and dominant
7 7 Galactic dust emission, at least at b > 20 o. In fact, in this latitude range the pixel-pixel scatter plot of our 410 GHz channel vs FDS8 at 410 GHz has a best fit line with slope (0.644 ± 0.038), a highly significant correlation. This result has been obtained using a jack-knife technique: we divide the latitude band 20 o < b < 10 o into five 10 o 10 o regions and we compute the best fit slope for each of the regions. We then compute the average and standard error on the average as our best estimate of the general slope. In this way we properly take into account the fact that deviations from an ideal correlation are dominated by fluctuations in dust properties, rather than by detector noise. The slopes and Pearson s linear correlation coefficients are listed in table 1. As we move towards lower frequencies, the correlation at a given latitude range gets worse, but is still significant. We have converted the measured slopes into brightness ratios R i = B i / B IRAS using the spectral response of the BOOMERanG bands. The spectrum of the brightness ratios is plotted in fig.3 (triangles). We compare it to an empirical model assuming a power law B(ν) ν α. We find a best fit α = (3.2±0.3) at b > 20 o. In FDS8 model, α = 3.15 in the range GHz, while α = 3.36 in the range GHz. At higher Galactic latitudes (four 10 o wide latitude bands at b < 20 o ) we find poorer but still significant correlations at 410 GHz and 240 GHz, while the correlation is just marginal at 150 GHz, and is negligible at 90 GHz (see table 1 and squares in fig.3). Here we get a best fit α = (4.3±1.0). 5. Contamination of CMB measurements at high Galactic latitudes We can use the measured ratios R i to estimate the rms fluctuation due to IRAScorrelatedemission athighgalacticlatitudes. Wehave simply var( B i ) = Ri 2var( B IRAS). We divide the observed region in latitude ranges, 10 o wide, and list the computed mean square fluctuations in table 2. The mean square fluctuation is dominated by signals at the
8 8 lowest multipoles, due to the falling power spectrum of dust c l l 2.5. So at multipoles corresponding to the first acoustic peak of the CMB anisotropy the dust contamination is even more negligible with respect to the CMB fluctuations. We compute the power spectrum in band i with the simple scaling formula c l,i = R2 i R 2 410c l,410 where R i is the average ratio between the dust signal in band i and the IRAS/DIRBE signal. The result is plotted in fig.4 for the extrapolation of the 410 GHz spectrum centered at b = 27 o. Due to the poor correlation, only upper limits are found for the 90 GHz band (at a level similar to the power spectrum estimates for the 150 GHz channel), which are not plotted. It is evident that at l > 100 the dust signals at 90 and 150 GHz are negligible with respect to the cosmological signal. These estimates of contamination are consistent with the dust foreground model of (Tegmark et al. 2000) (compare their fig.3 with our fig.4). If we scale to 150 GHz the upper limits for the uncorrelated component, assuming the same spectral ratios, we get 95% C.L. upper limits l(l+1)c l /2π < 5µK 2 at 95% C.L. for 50 < l < Conclusions BOOMERanG has detected thermal emission from insterstellar cirrus at intermediate and high Galactic latitudes. The 410 GHz map is morphologically very similar to extrapolation of the IRAS(3000GHz) and DIRBE(1250GHz) maps. The angular power spectrum of the dust dominated 410 GHz map is a power law c l l β with 2 < β < 3. We have detected a component correlated with the IRAS/DIRBE map in all the BOOMERanG bands at 10 o > b > 20 o, and in the 150, 240 and 410 GHz bands at higher Galactic latitudes. This dust contamination is negligible with respect to the CMB anisotropy at high Galactic latitudes, accounting for less than 1% of the total angular power spectrum for multipoles l > 100 at ν < 180GHz.
9 9 The BOOMERanG program has been supported by NASA and NSF in the USA, by ASI, PNRA, Univrsity La Sapienza in Italy, by PPARC in UK and by NSERC and University of Toronto in Canada.
10 10 REFERENCES de Bernardis et al. 2000, Nature, 404, Hanany et al. 2000, submitted to Ap.J., astro-ph/ Low F.J. et al. 1984, Ap.J. 278, L19. Wright E.L. et al. 1991, Ap.J. 381, 200. Schlegel D.J. et al. 1999, Ap.J. 500, 525. Finkbeiner D.P. et al. 1999, Ap.J., 524, 867. Masi S. et al. 1995, Ap.J., 452, 253. Masi S. et al. 1996, Ap.J., L47, 463. Lim et al. 1996, Ap.J., 469, L69. Leitch E., et al. 1997, Ap.J., 486, L23. de Oliveira-Costa 1997, Ap.J., 482, L17. Cheng E., et al., 1997, Ap.J., 488, L59. Lagache G. et al., 2000, Astron. Astrophys. 344, 322. Lagache G. et al., 1998, Astron. Astrophys. 333, 709. de Oliveira-Costa 1998, Ap.J., 509, L9. Mukherjee et al. 1999, submitted to MNRAS, astro-ph/
11 11 Hauser M.G. et al., 1998, Ap.J., 508, 25. Arendt R.G. et al., 1998, Ap.J., 508, 74. Kogut A. et al., 1996a, Ap.J., 460, 1. Kogut A. et al., 1996b, Ap.J., 464, L5. Draine B.T., and Lazarian A., 1998, Ap.J., 508, 157. de Oliveira-Costa et al. 2000, astro-ph/ Crill B. et al., 2000, in preparation Prunet S. et al., 2000, in Energy densities in the Universe, XXth Rencontre de Moriond, Bartlett J., Dumarchez J. eds., Editions Frontieres, Paris - astro-ph/ Scott, D., Srednicki, M., White, M. 1993, ApJ, 421, L5 Hivon et al. in preparation Gorski K.M., Hivon E. and Wandelt B.D., Analysis Issues for Large CMB Data Sets, 1998, Proceedings of the MPA/ESO Conference, Garching 2-7 August 1998, eds. A.J. Banday, R.K. Sheth and L. Da Costa, (astro-ph / ); see also healpix/ Gautier T.N. III, et al., 1992, A.J., 103, 4. Low F.J. and Cutri R.M., 1994, Infrared Phys. Techn., 35, 291. Guarini G. et al., 1995, Ap.J. 442, 23. Wright E.L., 1998, Ap.J. 496, 1. Tegmark M. et al., 2000, Ap.J. 530, 133.
12 12 This manuscript was prepared with the AAS L A TEX macros v5.0.
13 13 Fig. 1. PLATEToppanel: BOOMERanGmapat410GHz. Themaphasbeenobtainedby coadding the data in 7 healpix pixels(gorski et al. 1998) and applying a gaussian smoothing to an equivalent resolution of 22.5 arcmin. At this frequency 1mK CMB = 0.20 MJy/sr. Due to the map-making technique, structures with angular scales larger than 10 o have been effectively removed from the map. Middle panel: FDS8 extrapolation at 410 GHz of the IRAS map, in the same sky region. This map has been high and low-pass filtered as in the BOOMERanG 410 GHz channel (see text) for a meaningful comparison. Bottom panel: residuals after subtraction of the FDS8 map from the BOOMERanG 410 GHz map. The three circles identify the regions where we carried out the power spectrum analysis. Fig. 2. Angular power spectrum of the BOOMERanG 410 GHz map, for three disks with diameter 18 o, centered at different Galactic latitudes (squares, b = 17 o ; circles, b = 27 o ; down triangles, b = 38 o ). At the highest latitude the signal is small with respect to the detector noise, and we consider the spectrum as an upper limit for dust brightness fluctuations. Best fit power-law spectra c l l β are shown as continuous lines and labelled by their best fit slope β. The dashed lines are the power spectrum of the FDS8 map at 410 GHz in the same sky regions. The large thin error bars include cosmic/sampling variance, while the smaller thick ones are from intrumental noise only. Fig. 3. Ratio between the dust brightness fluctuations in the BOOMERanG bands and the dust brightness fluctuations detected by IRAS/DIRBE. Triangles indicate measurements at intermediate Galactic latitudes ( 20 o < b < 10 o ), while circles indicate measurements at high Galactic latitudes ( b < 20 o ). The best fits assuming a power law spectrum with spectral index α are plotted as lines, and are labelled by the best fit value for α. The dashed line is the average FDS8 spectrum, normalized to the BOOMERanG measurement at 410 GHz at intermediate latitudes. Fig. 4. Angularpower spectraofdustemission inadiskcenterdatra=92 o, dec=-48 o, b=-
14 14 27 o that is correlated with the FDS8 IRAS extrapolation, at 150GHz (filled down triangles) and at 240GHz (filled up triangles). The power spectrum of the microwave sky at 150 GHz (de Bernardis et al. 2000) is shown for comparison as filled circles. For the dust spectra the error bars include the uncertainty due to the partial correlation between our data and the FDS8 extrapolated IRAS data. The 90 GHz correlation is so poor that we only find upper limits (not plotted here) similar to the 150 GHz values. It is evident that in this region of the sky the Galactic dust signal is negligible with respect to the CMB signal at these frequencies.
15 15 Table 1. Correlation between BOOMERanG data and IRAS/DIRBE data extrapolated to 410 GHz (FDS8). Band Center (GHz) slope R[µK CMB /(MJy/sr)] (Pearson s R) 20 o < b < 10 o (22843 pixel) b < 20 o (68987 pixel) 410 (3200 ± 190) (0.298) (4700 ± 1500) (0.138) 240 (254 ± 46) (0.156) (258 ± 52) (0.041) 150 (93 ± 23) (0.085) (46 ± 29) (0.003) 90 (58±49) (0.032) ( 20±110) (-0.028)
16 16 Table 2. Estimated rms fluctuations due to dust emission < T 2 dust >1/2 (µk CMB ) (angular scales between 22 arcmin and 10 o ). Band Center (GHz) 20 o < b < 10 o 30 o < b < 20 o 40 o < b < 30 o 50 o < b < 40 o 60 o < b < 50 o 410 (680 ±40) (280 ±90) (180 ±60) (110 ±35) (120 ±40) 240 (54 ±10) (15 ±3) (9.6±2.0) (6.0±1.2) (6.4±1.3) 150 (20 ±5) (2.8 ±1.7) (1.7±1.1) (1.1±0.7) (1.2±0.7) 90 (12 ±10) < 12 (2σ) < 7 (2σ) < 5 (2σ) < 5 2σ)


17 410GHz 410GHz B98 - FDS8
18 Masi et al. FIG.2 β = ( ) l(l+1)c l /2π (µk CMB β = ( ) b = -17 o b = -27 o b = -38 o 100 multipole 500
19 Masi et al. Fig.3 1 b < -20 o brightness ratios (BOOM/FDS8@410GHz) o < b < -10 o FDS8 α = ( ) α = ( ) 100 frequency (GHz) 500
20 Masi et al. Fig l(l+1)c l /2π (µk 2 ) total (150 GHz) dust 240 GHz, b = -27 o dust 150 GHz, b = -27 o multipole l
Correlation of the South Pole 94 data with 100 µm and 408 MHz maps
 A&A 368, 760 765 (2001) DOI: 10.1051/0004-6361:20010061 c ESO 2001 Astronomy & Astrophysics Correlation of the South Pole 94 data with 100 µm and 408 MHz maps J.-Ch. Hamilton 1 and K. M. Ganga 1,2 1 Physique
arxiv:astro-ph/ v1 22 Feb 1999
 Anomalous Microwave Emission arxiv:astro-ph/9902307v1 22 Feb 1999 A. Kogut Laboratory for Astronomy and Solar Physics, Code 685, Goddard Space Flight Center, Greenbelt, MD 20771 Abstract. Improved knowledge
The Spectrum of the CMB Anisotropy from the Combined COBE 1 FIRAS and DMR Observations
 The Spectrum of the CMB Anisotropy from the Combined COBE 1 FIRAS and DMR Observations D.J. Fixsen 2,3, G. Hinshaw 4, C. L. Bennett 4, & J.C. Mather 4 ABSTRACT arxiv:astro-ph/9704176v1 17 Apr 1997 We analyze
arxiv:astro-ph/ v1 12 Jan 1996
 COBE Preprint 96-01, Submitted To ApJ Letters 4-Year COBE 1 DMR Cosmic Microwave Background Observations: Maps and Basic Results arxiv:astro-ph/9601067v1 12 Jan 1996 C. L. Bennett 2,3, A. Banday 4, K.
arxiv:astro-ph/ v1 21 Nov 2006
 Evidence for Inverted Spectrum 20 GHz Emission in the Galactic Plane arxiv:astro-ph/0611655 v1 21 Nov 2006 S. P. Boughn and J. C. Pober Department of Astronomy, Haverford College, Haverford, PA 19041;
arxiv:astro-ph/ v1 2 Mar 2005
 Mon. Not. R. Astron. Soc. 000, 1 5 (2005) Printed 2 February 2008 (MN LATEX style file v2.2) Polarized Diffuse Emission at 2.3 GHz in a High Galactic Latitude Area arxiv:astro-ph/0503043v1 2 Mar 2005 E.
The international scenario Balloons, LiteBIRD, PIXIE, Millimetron
 The international scenario Balloons, LiteBIRD, PIXIE, Millimetron Francesco Piacentini Sapienza Università di Roma, Dipartimento di Fisica on behalf of the Italian CMB community Overview International
arxiv:astro-ph/ v1 20 Aug 2004
 Galactic foreground contribution to the BEAST CMB Anisotropy Maps arxiv:astro-ph/0408385v1 20 Aug 2004 Jorge Mejía 1 Marco Bersanelli 2 Carlo Burigana 3 Jeff Childers 4 Newton Figueiredo 5 Miikka Kangas
FOUR-YEAR COBE 1 DMR COSMIC MICROWAVE BACKGROUND OBSERVATIONS: MAPS AND BASIC RESULTS
 THE ASTROPHYSICAL JOURNAL, 464 : L1 L4, 1996 June 10 1996. The American Astronomical Society. All rights reserved. Printed in U.S.A. FOUR-YEAR COBE 1 DMR COSMIC MICROWAVE BACKGROUND OBSERVATIONS: MAPS
arxiv:astro-ph/ v1 10 Feb 2003
 Mon. Not. R. Astron. Soc. 000, 1 16 () Printed 5 February 2008 (MN LATEX style file v2.2) Reappraising foreground contamination in the COBE-DMR data arxiv:astro-ph/0302181v1 10 Feb 2003 A. J. Banday, 1
Where is the COBE maps non-gaussianity?
 Where is the COBE maps non-gaussianity? João Magueijo 1, Pedro G. Ferreira 2,3 1, and Krzysztof M. Górski 4,5 arxiv:astro-ph/9903051v1 2 Mar 1999 1 Theoretical Physics, Imperial College, Prince Consort
CMB cosmology: current status and experimental trends
 Mem. S.A.It. Suppl. Vol. 2, 32 c SAIt 2003 Memorie della Supplementi CMB cosmology: current status and experimental trends Paolo de Bernardis 1 and Silvia Masi 1 Dipartimento di Fisica, Universitá La Sapienza,
arxiv:astro-ph/ v3 25 Feb 2002
 A measurement by BOOMERANG of multiple peaks in the angular power spectrum of the cosmic microwave background arxiv:astro-ph/0104460v3 25 Feb 2002 C.B. Netterfield 1, P.A.R. Ade 2, J.J. Bock 3, J.R. Bond
arxiv:astro-ph/ v1 30 Oct 2001
 Astronomy & Astrophysics manuscript no. May 29, 2018 (DOI: will be inserted by hand later) Cosmic Background dipole measurements with Planck-High Frequency Instrument M. Piat 1, G. Lagache 1, J.P. Bernard
Polarized Foregrounds and the CMB Al Kogut/GSFC
 Polarized Foregrounds and the CMB Al Kogut/GSFC The Problem In A Nutshell Galactic foregrounds are 2 orders of magnitude brighter than primordial B-mode polarization from 30 to 200 GHz Polarized vs Unpolarized
arxiv: v2 [astro-ph.co] 8 Aug 2016
![arxiv: v2 [astro-ph.co] 8 Aug 2016](/thumbs/75/72612176.jpg "arxiv: v2 [astro-ph.co] 8 Aug 2016") Astronomy& Astrophysics manuscript no. paper_cross_corr_rnote_published_arxiv c ESO 216 August 9, 216 Optimal cosmic microwave background map-making in the presence of cross-correlated noise (Research
Astronomy& Astrophysics manuscript no. paper_cross_corr_rnote_published_arxiv c ESO 216 August 9, 216 Optimal cosmic microwave background map-making in the presence of cross-correlated noise (Research
From BOOMERanG to B-B-Pol
 Mem. S.A.It. Vol. 79, 799 c SAIt 2008 Memorie della From BOOMERanG to B-B-Pol Balloon-borne observations of cosmic microwave background polarization P. de Bernardis 1,2, M. Calvo 1,2, P. Fiadino 1,2, C.
Planck 2014 The Microwave Sky in Temperature and Polarisation Ferrara, 1 5 December The Planck mission
 Planck 2014 The Microwave Sky in Temperature and Polarisation Ferrara, 1 5 December 2014 The Planck mission Marco Bersanelli Dipartimento di Fisica, Università degli Studi di Milano Planck-LFI Deputy PI
astro-ph/ Sep 1996
 THE CMB DIPOLE: THE MOST RECENT MEASUREMENT AND SOME HISTORY Charles H. Lineweaver astro-ph/9609034 5 Sep 1996 Universite Louis Pasteur Observatoire Astronomique de Strasbourg 11 rue de l'universite, 67000
Cosmic Variance of the Three-Point Correlation Function of the Cosmic Microwave Background
 CfPA 93 th 18 astro-ph/9306012 June 1993 REVISED arxiv:astro-ph/9306012v2 14 Jul 1993 Cosmic Variance of the Three-Point Correlation Function of the Cosmic Microwave Background Mark Srednicki* Center for
The microwave sky as seen by Planck
 The microwave sky as seen by Planck Ingunn Kathrine Wehus Jet Propulsion Laboratory California Institute of Technology on behalf of the Planck Collaboration Bayesian component separation We adopt a parametric
arxiv:astro-ph/ v1 5 Aug 2006
 Draft version February 4, 2008 Preprint typeset using L A TEX style emulateapj v. 6/22/04 CLEANED THREE-YEAR WMAP CMB MAP: MAGNITUDE OF THE QUADRUPOLE AND ALIGNMENT OF LARGE SCALE MODES Chan-Gyung Park,
MICROWAVE EMISSION AT HIGH GALACTIC LATITUDES IN THE FOUR-YEAR DMR SKY MAPS
 THE ASTROPHYSICAL JOURNAL, 464 : L5 L9, 1996 June 10 1996. The American Astronomical Society. All rights reserved. Printed in U.S.A. MICROWAVE EMISSION AT HIGH GALACTIC LATITUDES IN THE FOUR-YEAR DMR SKY
Examining the Effect of the Map-Making Algorithm on Observed Power Asymmetry in WMAP Data
 Examining the Effect of the Map-Making Algorithm on Observed Power Asymmetry in WMAP Data P. E. Freeman 1, C. R. Genovese 1, C. J. Miller 2, R. C. Nichol 3, & L. Wasserman 1 1 Department of Statistics
OLIMPO: A few arcmin resolution survey of the sky at mm and sub-mm wavelengths
 Mem. S.A.It. Vol. 74, 96 c SAIt 2003 Memorie della OLIMPO: A few arcmin resolution survey of the sky at mm and sub-mm wavelengths S. Masi 1, P. Ade 2, P. de Bernardis 1, A. Boscaleri 3, M. De Petris 1,
SPIDER: A Balloon-Borne Polarimeter for Measuring Large Angular Scale CMB B-modes
 SPIDER: A Balloon-Borne Polarimeter for Measuring Large Angular Scale CMB B-modes, Dick Bond, Olivier Doré CITA, University of Toronto, Canada E-mail: cmactavi@cita.utoronto.ca Rick Bihary, Tom Montroy,
ASTRONOMY AND ASTROPHYSICS. A conspicuous increase of Galactic contamination over CMBR anisotropies at large angular scales
 Astron. Astrophys. 346, 369 382 1999) A conspicuous increase of Galactic contamination over CMBR anisotropies at large angular scales ASTRONOMY AND ASTROPHYSICS Martín López-Corredoira Instituto de Astrofísica
Large Scale Polarization Explorer
 Science goal and performance (Univ. Roma La Sapienza) for the LSPE collaboration Page 1 LSPE is a balloon payload aimed at: Measure large scale CMB polarization and temperature anisotropies Explore large
A Flat Universe from High-Resolution Maps of the Cosmic
 In April 27th 2000 issue of Nature A Flat Universe from High-Resolution Maps of the Cosmic Microwave Background Radiation arxiv:astro-ph/0004404v1 28 Apr 2000 P. de Bernardis 1, P.A.R.Ade 2, J.J.Bock 3,
BINGO simulations and updates on the performance of. the instrument
 BINGO simulations and updates on the performance of BINGO telescope the instrument M.-A. Bigot-Sazy BINGO collaboration Paris 21cm Intensity Mapping Workshop June 2014 21cm signal Observed sky Credit:
CMB Foreground and separation methods. Astro 448 Yuxi Zhao 12/5/2018
 CMB Foreground and separation methods Astro 448 Yuxi Zhao 12/5/2018 Outline CMB foreground overview Thermal Dust AME (spin dust, spinning nanodiamonds? ) Synchrotron Free-free CO Zodiacal light, CIB Component
arxiv:astro-ph/ v1 9 Dec 2001
 XXX-XXXXX YYY-YYYYYY November 2, 2018 arxiv:astro-ph/0112205v1 9 Dec 2001 Archeops: CMB Anisotropies Measurement from Large to Small Angular Scale Alexandre Amblard, on behalf of the Archeops Collaboration
Primordial B-modes: Foreground modelling and constraints
 Primordial B-modes: Foreground modelling and constraints Carlo Contaldi Imperial College London Model Polarisation Amplitude 40 60-180 160 140 120 100 20 80 0 60 40 20 0-20 -40-60 -80-100 -120-140 -160-20
arxiv:astro-ph/ v1 9 Aug 2006
 Angular power spectrum of CMB anisotropy from WMAP Tarun Souradeep 1, Rajib Saha 1,2 and Pankaj Jain 2 arxiv:astro-ph/0608199v1 9 Aug 2006 1 Inter-University Centre for Astronomy and Astrophysics (IUCAA),
THE PLANCK MISSION The most accurate measurement of the oldest electromagnetic radiation in the Universe
 THE PLANCK MISSION The most accurate measurement of the oldest electromagnetic radiation in the Universe Rodrigo Leonardi Planck Science Office ESTEC/ESA OVERVIEW Planck observational objective & science.
Power spectrum exercise
 Power spectrum exercise In this exercise, we will consider different power spectra and how they relate to observations. The intention is to give you some intuition so that when you look at a microwave
Low-order multipole maps of cosmic microwave background anisotropy
 Mon. Not. R. Astron. Soc. 355, 1283 1302 (2004) doi:10.1111/j.1365-2966.2004.08405.x Low-order multipole maps of cosmic microwave background anisotropy derived from WMAP P. Bielewicz, 1,2 K. M. Górski
arxiv: v1 [astro-ph.co] 8 Oct 2010
![arxiv: v1 [astro-ph.co] 8 Oct 2010](/thumbs/91/107334172.jpg "arxiv: v1 [astro-ph.co] 8 Oct 2010") Astronomy & Astrophysics manuscript no. 14288 c ESO 2017 July 13, 2017 Foreground removal from WMAP 5 yr temperature maps using an MLP neural network 1 National Space Institute (DTU Space), Technical University
Astronomy & Astrophysics manuscript no. 14288 c ESO 2017 July 13, 2017 Foreground removal from WMAP 5 yr temperature maps using an MLP neural network 1 National Space Institute (DTU Space), Technical University
Removing 1/f noise stripes in cosmic microwave background anisotropy observations
 A&A 387, 356 365 (2002) DOI: 10.1051/0004-6361:20020242 c ESO 2002 Astronomy & Astrophysics Removing 1/f noise stripes in cosmic microwave background anisotropy observations D. Maino 1, C. Burigana 2,K.M.Górski
A MEASUREMENT OF THE ANGULAR POWER SPECTRUM OF THE CMB TEMPERATURE ANISOTROPY FROM THE 2003 FLIGHT OF BOOMERANG
 The Astrophysical Journal, 647:823 832, 2006 August 20 Copyright is not claimed for this article. Printed in U.S.A. A MEASUREMENT OF THE ANGULAR POWER SPECTRUM OF THE CMB TEMPERATURE ANISOTROPY FROM THE
All-sky component separation in the presence of anisotropic noise and dust temperature variations
 Mon. Not. R. Astron. Soc. 357, 145 155 (2005) doi:10.1111/j.1365-2966.2005.08610.x All-sky component separation in the presence of anisotropic noise and dust temperature variations V. Stolyarov, 1,2 M.
Evidence for dust emission in the Warm Ionised Medium using WHAM data
 Astron. Astrophys. 354, 247 252 (2000) Evidence for dust emission in the Warm Ionised Medium using WHAM data G. Lagache 1, L.M. Haffner 2, R.J. Reynolds 2, and S.L. Tufte 3 1 Institut d Astrophysique Spatial,
Planck and Virtual Observatories: Far Infra-red / Sub-mm Specificities
 JF Sygnet (Planck HFI DPCM) Planck and Virtual Observatories: Far Infra-red / Sub-mm Specificities Planck Mission, Planck Data and its Specificities (4) Data Treatment and its Specificities (4) Planck
arxiv:astro-ph/ v1 18 Feb 1999
 A&A manuscript no. (will be inserted by hand later) Your thesaurus codes are: 1 (09.04.1; 13.09.3; 13.09.1) ASTRONOMY AND ASTROPHYSICS February 1, 2008 Dust Emissivity in the Far-Infrared Simone Bianchi,
arxiv: v3 [astro-ph.co] 16 May 2011
![arxiv: v3 [astro-ph.co] 16 May 2011](/thumbs/81/83440044.jpg "arxiv: v3 [astro-ph.co] 16 May 2011") Submitted to Astrophysical Journal arxiv:111.621v3 [astro-ph.co] 16 May 211 Cross-Power Spectrum and Its Application on Window Functions in the WMAP Data Lung-Yih Chiang Institute of Astronomy and Astrophysics,
Submitted to Astrophysical Journal arxiv:111.621v3 [astro-ph.co] 16 May 211 Cross-Power Spectrum and Its Application on Window Functions in the WMAP Data Lung-Yih Chiang Institute of Astronomy and Astrophysics,
PICO - Probe of Inflation and Cosmic Origins
 PICO - Probe of Inflation and Cosmic Origins Shaul Hanany University of Minnesota Executive Committee Bock, Borrill, Crill, Devlin, Flauger, Hanany, Jones, Knox, Kogut, Lawrence, McMahon, Pryke, Trangsrud
Forthcoming CMB experiments and expectations for dark energy. Carlo Baccigalupi
 Forthcoming CMB experiments and expectations for dark energy Carlo Baccigalupi Outline Classic dark energy effects on CMB Modern CMB relevance for dark energy: the promise of lensing Lensing (B modes)
arxiv:astro-ph/ v1 27 Feb 2000
 Limits on Hot Intracluster Gas Contributions to the Tenerife Temperature Anisotropy Map arxiv:astro-ph/0002497v1 27 Feb 2000 J.A. Rubiño-Martín Instituto de Astrofísica de Canarias Vía Láctea s/n. 38200
Energy Sources of the Far IR Emission of M33
 Energy Sources of the Far IR Emission of M33 Hinz, Reike et al., ApJ 154: S259 265 (2004). Presented by James Ledoux 24 µm 70 µm 160 µm Slide 1 M33 Properties Distance 840kpc = 2.7 Mlyr (1'' ~ 4 pc) Also
astro-ph/ Oct 94
 SIMULAIONS OF HE MICROWAVE SKY AND OF IS \OBSERVAIONS" F.R. BOUCHE and R. GISPER Institut d'astrophysique, Paris, and Institut d'astrophysique Spatiale, Orsay, France and N. AGHANIM, J.R. BOND, A. DE LUCA,
Destriping of polarized data in a CMB mission with a circular scanning strategy
 ASTRONOMY & ASTROPHYSICS MARCH II 000, PAGE 499 SUPPLEMENT SERIES Astron. Astrophys. Suppl. Ser. 4, 499 509 000) Destriping of polarized data in a CMB mission with a circular scanning strategy B. Revenu,A.Kim,R.Ansari,F.Couchot,
astro-ph/ Feb 1994
 Search For Unresolved Sources In The COBE 1 -DMR Two-Year Sky Maps A. Kogut 2, A.J. Banday 3, C.L. Bennett 4, G. Hinshaw 2, K. Loewenstein 2, P. Lubin 5, G.F. Smoot 6, and E.L. Wright 7 astro-ph/9402007
Measurements of Degree-Scale B-mode Polarization with the BICEP/Keck Experiments at South Pole
 Measurements of Degree-Scale B-mode Polarization with the BICEP/Keck Experiments at South Pole Benjamin Racine for the BICEP/Keck Collaboration March 18th, 2018 53 èmes Rencontres de Moriond La Thuile
arxiv:astro-ph/ v1 27 Aug 2001
 AMiBA 2001: High-z Clusters, Missing Baryons, and CMB Polarization ASP Conference Series, Vol. 999, 2002 L-W Chen, C-P Ma, K-W Ng and U-L Pen, eds ATCA and CMB anisotropies arxiv:astro-ph/0108409v1 27
Cosmic Microwave Background
 Cosmic Microwave Background Carlo Baccigalupi,, SISSA CMB lectures at TRR33, see the complete program at darkuniverse.uni-hd.de/view/main/winterschoollecture5 These lectures are available in pdf format
Mysteries of the large-angle microwave sky
 Mysteries of the large-angle microwave sky Dragan Huterer Physics Department University of Michigan Collaborators: Craig Copi (CWRU), Dominik Schwarz (Bielefeld), Glenn Starkman (CWRU) Chris Gordon, Wayne
Constraining the topology of the Universe using CMB maps
 Constraining the topology of the Universe using CMB maps P. Bielewicz, A.J. Banday K.M. Górski, JPL Outline topology of the Universe signatures of topology in the CMB maps search for signatures of topology
Cosmology with CMB: the perturbed universe
 Cosmology with CMB: the perturbed universe Utkal Univ. (Jan 11-12, 2008) Tarun Souradeep I.U.C.A.A, Pune, India How do we know so much now about this model Universe? Cosmic Microwave Background Pristine
Stacking Analysis of Infrared Galaxies in the Planck Map
 Stacking Analysis of Infrared Galaxies in the Planck Map Alice Giroul The University of Tokyo - The University of Glasgow June & July 2014 Abstract Infrared emission from galaxies has been detected by
Cosmological Studies with SZE-determined Peculiar Velocities. Sarah Church Stanford University
 Cosmological Studies with SZE-determined Peculiar Velocities Sarah Church Stanford University Outline! Why Measure Peculiar Velocities? Cosmological information complements other techniques! Experimental
Dust emission. D.Maino. Radio Astronomy II. Physics Dept., University of Milano. D.Maino Dust emission 1/24
 Dust emission D.Maino Physics Dept., University of Milano Radio Astronomy II D.Maino Dust emission 1/24 New insight on Dust Emission Before WMAP and Planck with only COBE-DMR, dust is well described by
Galactic Dust Properties. Déborah Paradis CNES Post-doc IRAP, Toulouse
 Galactic Dust Properties Déborah Paradis CNES Post-doc IRAP, Toulouse BG emissivity λ I ν (λ) = Q abs (λ 0 ) λ 0 β emissivity = τ/n H β : spectral index B ν ( T eq,λ)n H Conventionally admitted : β = 2
Received 2002 December 30; accepted 2003 August 6
 The Astrophysical Journal, 599:786 805, 2003 December 20 # 2003. The American Astronomical Society. All rights reserved. Printed in U.S.A. E IMPROVED MEASUREMENT OF THE ANGULAR POWER SPECTRUM OF TEMPERATURE
Escaping the Zodi Light! Harvey Moseley! NASA/GSFC! The View from 5 AU! March 26, 2010!
 Escaping the Zodi Light! Harvey Moseley! NASA/GSFC! The View from 5 AU! March 26, 2010! The Galaxy and the Zodi Light are the dominant sources of diffuse light in the night sky! Both are much brighter
Angular power spectrum of the FASTICA cosmic microwave background component from Background Emission Anisotropy Scanning Telescope data
 Mon. Not. R. Astron. Soc. 369, 441 448 (2006) doi:10.1111/j.1365-2966.2006.10320.x Angular power spectrum of the FASTICA cosmic microwave background component from Background Emission Anisotropy Scanning
Present limits to cosmic bubbles from the COBE-DMR three point correlation function.
 Mon. Not. R. Astron. Soc. 000, 000 000 (0000) Printed 29 February 2008 (MN LATEX style file v1.4) Present limits to cosmic bubbles from the COBE-DMR three point correlation function. P. S. Corasaniti,
CONFUSION NOISE AND BACKGROUND
 Konkoly Infrared & Space Astronomy Group CONFUSION NOISE AND BACKGROUND Csaba Kiss Introduction Confusion noise was very important for the recent infrared space instruments (e.g. those of IRAS, ISO and
Galactic radio loops. Philipp Mertsch with Subir Sarkar. The Radio Synchrotron Background Workshop, University of Richmond 21 July 2017
 Galactic radio loops Philipp Mertsch with Subir Sarkar The Radio Synchrotron Background Workshop, University of Richmond 21 July 2017 Foregrounds in B-modes Adam et al., arxiv:1502.01588 1409.5738 (Planck
Really, really, what universe do we live in?
 Really, really, what universe do we live in? Fluctuations in cosmic microwave background Origin Amplitude Spectrum Cosmic variance CMB observations and cosmological parameters COBE, balloons WMAP Parameters
Consistency tests for Planck and WMAP in the low multipole domain
 PREPARED FOR SUBMISSION TO JCAP arxiv:1305.4033v1 [astro-ph.co] 17 May 2013 Consistency tests for Planck and WMAP in the low multipole domain A. Frejsel, M. Hansen and H. Liu Niels Bohr Institute and Discovery
The first light in the universe
 The first light in the universe Aniello Mennella Università degli Studi di Milano Dipartimento di Fisica Photons in the early universe Early universe is a hot and dense expanding plasma 14 May 1964, 11:15
OLIMPO. 1. Introduction. Mem. S.A.It. Vol. 79, 887 c SAIt 2008
 Mem. S.A.It. Vol. 79, 887 c SAIt 2008 Memorie della OLIMPO S. Masi, 1,2, E. Battistelli 1, D. Brienza 1, L. Conversi 1,2, A. Cruciani 1, P. de Bernardis 1,2, M. De Petris 1,2, P. Fiadino 1, A. Iacoangeli
Using White Dish CMB Anisotropy Data to Probe Open and. Flat-Λ CDM Cosmogonies
 KSUPT-97/3, KUNS-1459 August 1997 Using White Dish CMB Anisotropy Data to Probe Open and Flat-Λ CDM Cosmogonies Bharat Ratra 1, Ken Ganga 2, Naoshi Sugiyama 3,G.S.Tucker 4,G.S.Griffin 5,H.T.Nguyên 6, and
The trispectrum of the Cosmic Microwave Background on sub-degree angular scales: an analysis of the BOOMERanG data
 Mon. Not. R. Astron. Soc. 000, 000 000 (2003) The trispectrum of the Cosmic Microwave Background on sub-degree angular scales: an analysis of the BOOMERanG data G.De Troia 1,7, P.A.R. Ade 2, J.J. Bock
The Two Micron All-Sky Survey: Removing the Infrared Foreground
 University of Massachusetts Amherst ScholarWorks@UMass Amherst Astronomy Department Faculty Publication Series Astronomy 2000 The Two Micron All-Sky Survey: Removing the Infrared Foreground John E. Gizis
Data analysis of massive data sets a Planck example
 Data analysis of massive data sets a Planck example Radek Stompor (APC) LOFAR workshop, Meudon, 29/03/06 Outline 1. Planck mission; 2. Planck data set; 3. Planck data analysis plan and challenges; 4. Planck
The BaR-SPOrt Experiment
 The BaR-SPOrt Experiment M. Zannoni a,h, S. Cortiglioni b, G. Bernardi b, E. Carretti b, S. Cecchini b, C. Macculi b, E. Morelli b, C. Sbarra b, G. Ventura b, L. Nicastro c, J. Monari d, M. Poloni d, S.
Scientific results from QUIJOTE. constraints on CMB radio foregrounds
 Scientific results from QUIJOTE constraints on CMB radio foregrounds Flavien Vansyngel, Instituto de Astrofísica de Canarias, on the behalf of the QUIJOTE collaboration @ 53rd rencontres de Moriond The
Spinning Dust and the 3mm Excess
 Spinning Dust and the 3mm Excess 8th October 2010 Spinning dust 1996: COBE DMR-DIRBE (Kogut et al.) observe correlated microwave and 100 µm emission. 1997: Saskatoon 30 & 40 GHz observations; OVRO 14.5
Detection of the extra-galactic background fluctuations at 170 µm
 Astron. Astrophys. 355, 17 22 (2000) ASTRONOMY AND ASTROPHYSICS Detection of the extra-galactic background fluctuations at 170 µm G. Lagache and J.L. Puget Institut d Astrophysique Spatiale, Bât. 121,
ASTRONOMY AND ASTROPHYSICS. Searching for the non-gaussian signature of the CMB secondary anisotropies. N. Aghanim and O. Forni
 Astron. Astrophys. 347, 409 418 (1999) Searching for the non-gaussian signature of the CMB secondary anisotropies ASTRONOMY AND ASTROPHYSICS N. Aghanim and O. Forni IAS-CNRS, Université Paris Sud, Bâtiment
Planck. Report on the status of the mission Carlo Baccigalupi, SISSA
 Planck Report on the status of the mission Carlo Baccigalupi, SISSA Outline CMB The Planck satellite Data processing center Expectations from Planck Planck data CMB CMB angular power spectrum Angle 200/l
Studies of diffuse UV radiation
 Bull. Astr. Soc. India (2007) 35, 295 300 Studies of diffuse UV radiation N. V. Sujatha and Jayant Murthy Indian Institute of Astrophysics, Bangalore 560 034, India Abstract. The upcoming TAUVEX mission
The cosmic background radiation II: The WMAP results. Alexander Schmah
 The cosmic background radiation II: The WMAP results Alexander Schmah 27.01.05 General Aspects - WMAP measures temperatue fluctuations of the CMB around 2.726 K - Reason for the temperature fluctuations
LFI frequency maps: data analysis, results and future challenges
 LFI frequency maps: data analysis, results and future challenges Davide Maino Università degli Studi di Milano, Dip. di Fisica New Light in Cosmology from the CMB 22 July - 2 August 2013, Trieste Davide
2 A. J. Banday and K. M. Gorski modelling. The quadrupole as observed in DMR sky maps uncorrected for Galactic emission is not representative of the C
 Mon. Not. R. Astron. Soc. 000, 000{000 (1994) Printed 2 September 1996 COBE Constraints on a Local Group X-ray Halo A. J. Banday 1 and K. M. Gorski 2;3 1 Max Plank Institut Fur Astrophysik, 85740 Garching
Polarised foregrounds (synchrotron, dust and AME) and their effect on the detection of primordial CMB B-modes
 and their effect on the detection of primordial CMB B-modes") Polarised foregrounds (synchrotron, dust and AME) and their effect on the detection of primordial CMB B-modes Ricardo T. Génova Santos Instituto de Astrofísica de Canarias Cosmology School in the Canary
Polarised foregrounds (synchrotron, dust and AME) and their effect on the detection of primordial CMB B-modes Ricardo T. Génova Santos Instituto de Astrofísica de Canarias Cosmology School in the Canary
A MILLIMETER-WAVE ANISOTROPY EXPERIMENT (MAX) TO SEARCH FOR ANISOTROPY IN THE COSMIC BACKGROUND RADIATION ON MED/UM ANGULAR SCALES
 TO SEARCH FOR ANISOTROPY IN THE COSMIC BACKGROUND RADIATION ON MED/UM ANGULAR SCALES") A MILLIMETER-WAVE ANISOTROPY EXPERIMENT (MAX) TO SEARCH FOR ANISOTROPY IN THE COSMIC BACKGROUND RADIATION ON MEDUM ANGULAR SCALES M. L. Fischer, D. C. Alsop, A. C. Clapp, D. A. Cottingham, A. E. Lange,
A MILLIMETER-WAVE ANISOTROPY EXPERIMENT (MAX) TO SEARCH FOR ANISOTROPY IN THE COSMIC BACKGROUND RADIATION ON MEDUM ANGULAR SCALES M. L. Fischer, D. C. Alsop, A. C. Clapp, D. A. Cottingham, A. E. Lange,
arxiv:astro-ph/ v2 22 Apr 2004
 Mon. Not. R. Astron. Soc. 000, 000 000 (2003) Printed 3 February 2018 (MN LATEX style file v1.4) Foreground separation using a flexible maximum-entropy algorithm: an application to COBE data arxiv:astro-ph/0302091v2
Astrophysics from Antarctica: overview of recent science
 Astrophysics from Antarctica: overview of recent science Michael Burton University of New South Wales SCAR Astronomy and Astrophysics from Antarctica 2 nd Workshop Siena, Italy 24-26 July, 2013 Outline
Anisotropy in the CMB
 Anisotropy in the CMB Antony Lewis Institute of Astronomy & Kavli Institute for Cosmology, Cambridge http://cosmologist.info/ Hanson & Lewis: 0908.0963 Evolution of the universe Opaque Transparent Hu &
Using α-stable Distributions to Model the P (D) Distribution of Point Sources in CMB Sky Maps
 Distribution of Point Sources in CMB Sky Maps") PHYSTAT003, SLAC, Stanford, California, September 8-11, 003 Using α-stable Distributions to Model the P (D) Distribution of Point Sources in CMB Sky Maps D. Herranz and E.E. Kuruoğlu Istituto di Scienza
PHYSTAT003, SLAC, Stanford, California, September 8-11, 003 Using α-stable Distributions to Model the P (D) Distribution of Point Sources in CMB Sky Maps D. Herranz and E.E. Kuruoğlu Istituto di Scienza
Maps of Dust IR Emission for Use in Estimation of Reddening and CMBR Foregrounds
 Maps of Dust IR Emission for Use in Estimation of Reddening and CMBR Foregrounds David J. Schlegel University of Durham, Department of Physics, South Road, Durham DH1 3LE, United Kingdom arxiv:astro-ph/9710327v2
The Morphology of the Anomalous Microwave Emission in the Planck 2015 data release
 Prepared for submission to JCAP arxiv:1507.05171v1 [astro-ph.co] 18 Jul 2015 The Morphology of the Anomalous Microwave Emission in the Planck 2015 data release S. von Hausegger a,1 H. Liu a,b a The Niels
DES Galaxy Clusters x Planck SZ Map. ASTR 448 Kuang Wei Nov 27
 DES Galaxy Clusters x Planck SZ Map ASTR 448 Kuang Wei Nov 27 Origin of Thermal Sunyaev-Zel'dovich (tsz) Effect Inverse Compton Scattering Figure Courtesy to J. Carlstrom Observables of tsz Effect Decrease
arxiv: v1 [astro-ph.ga] 23 Sep 2011
![arxiv: v1 [astro-ph.ga] 23 Sep 2011](/thumbs/86/93838593.jpg "arxiv: v1 [astro-ph.ga] 23 Sep 2011") Submitted to the Astrophysical Journal Preprint typeset using L A TEX style emulateapj v. 11/10/09 EVIDENCE FOR ANOMALOUS DUST-CORRELATED EMISSION AT 8 GHZ Michelle Lu 1, Joanna Dunkley 2, and Lyman Page
Submitted to the Astrophysical Journal Preprint typeset using L A TEX style emulateapj v. 11/10/09 EVIDENCE FOR ANOMALOUS DUST-CORRELATED EMISSION AT 8 GHZ Michelle Lu 1, Joanna Dunkley 2, and Lyman Page
Can one reconstruct masked CMB sky?
 Mon. Not. R. Astron. Soc. 000, 1 15 (2010) Printed 28 May 2010 (MN LaT E X style file v2.2) Can one reconstruct masked CMB sky? R. Aurich and S. Lustig Institut für Theoretische Physik, Universität Ulm,
X name "The talk" Infrared
 X name "The talk" Infrared 1 Cosmic Infrared Background measurement and Implications for star formation Guilaine Lagache Institut d Astrophysique Spatiale On behalf of the Planck collaboration Cosmic Infrared
arxiv:astro-ph/ v1 21 Jul 2003
 Draft version February 2, 2008 Preprint typeset using L A TEX style emulateapj v. 04/03/99 POLARIZATION OBSERVATIONS IN A LOW SYNCHROTRON EMISSION FIELD AT 1.4 GHZ G. Bernardi 1,2,3, E. Carretti 2, R.J.
The Extragalactic Radio Background
 The Extragalactic Radio Background Challenges and Opportunities Al Kogut Goddard Space Flight Center Extragalactic Backgrounds Early Background Estimates T ex From Spectral Index Variations T ex = 30 80