Online Science The World-Wide Telescope as a Prototype For the New Computational Science
|
|
|
- Gwenda Stanley
- 5 years ago
- Views:
Transcription
1 Online Science The World-Wide Telescope as a Prototype For the New Computational Science Jim Gray Microsoft Research
2 Outline The Evolution of X-Info The World Wide Telescope as Archetype Data Mining the Sloan Digital Sky Survey Experiments & Instruments Simulations facts Other Archives facts Literature facts Data ingest Managing a petabyte Common schema How to organize it? How to reorganize it How to coexist with others facts? questions answers The Big Problems Query and Vis tools Support/training Performance Execute queries in a minute Batch query scheduling


3 The Evolution of Science Empirical Science Scientist gathers data by direct observation Scientist analyzes data Analytical Science Scientist builds analytical model Makes predictions. Computational Science Simulate analytical model Validate model and makes predictions Science - Informatics Data captured by instruments Or data generated by simulator Processed by software Placed in a database / files Scientist analyzes database / files
4 What s X-info Needs from us (cs) (not drawn to scale) Scientists Miners Science Data & Questions Data Mining Algorithms Plumbers Database To store data Execute Queries Question & Answer Visualization Tools

 Don t assume infinite computational resources or memory")
5 Next-Generation Data Analysis Looking for Needles in haystacks the Higgs particle Haystacks: Dark matter, Dark energy Needles are easier than haystacks Global statistics have poor scaling Correlation functions are N 2, likelihood techniques N 3 As data and computers grow at same rate, we can only keep up with N logn A way out? Discard notion of optimal (data is fuzzy, answers are approximate) Don t assume infinite computational resources or memory Requires combination of statistics & computer science From Alex Szalay
6 Data Access is hitting a wall FTP and GREP are not adequate You can GREP 1 MB in a second You can GREP 1 GB in a minute You can GREP 1 TB in 2 days You can GREP 1 PB in 3 years. You can FTP 1 MB in 1 sec You can FTP 1 GB / min (= 1 $/GB) 2 days and 1K$ 3 years and 1M$ Oh!, and 1PB ~5,000 disks At some point you need indices to limit search parallel data search and analysis This is where databases can help
7 Smart Data (active databases) If there is too much data to move around, take the analysis to the data! Do all data manipulations at database Build custom procedures and functions in the database Automatic parallelism guaranteed Easy to build-in custom functionality Databases & Procedures being unified Example temporal and spatial indexing Pixel processing Easy to reorganize the data Multiple views, each optimal for certain types of analyses Building hierarchical summaries are trivial Scalable to Petabyte datasets From Alex Szalay

8 Analysis and Databases Much statistical analysis deals with Creating uniform samples data filtering Assembling relevant subsets Estimating completeness censoring bad data Counting and building histograms Generating Monte-Carlo subsets Likelihood calculations Hypothesis testing Traditionally these are performed on files Most of these tasks are much better done inside a database Move Mohamed to the mountain, not the mountain to Mohamed. From Alex Szalay
9 Organization & Algorithms Use of clever data structures (trees, cubes): Up-front creation cost, but only N logn access cost Large speedup during the analysis Tree-codes for correlations (A. Moore et al 2001) Datacubes for OLAP (all vendors) Fast, approximate heuristic algorithms No need to be more accurate than cosmic variance Fast CMB analysis by Szapudi etal (2001) N logn instead of N 3 => 1 day instead of 10 million years Take cost of computation into account Controlled level of accuracy Best result in a given time, given our computing resources From Alex Szalay
10 Making Discoveries Where are discoveries made? At the edges and boundaries Going deeper, collecting more data, using more colors. Metcalfe s law Utility of computer networks grows as the number of possible connections: O(N 2 ) Szalay s data law Federation of N archives has utility O(N 2 ) Possibilities for new discoveries grow as O(N 2 ) Current sky surveys have proven this Very early discoveries from SDSS, 2MASS, DPOSS From Alex Szalay

11 Goal: Easy Data Publication & Access Augment FTP with data query: Return intelligent data subsets Make it easy to Publish: Record structured data Find: Find data anywhere in the network Get the subset you need Explore datasets interactively Realistic goal: Make it as easy as publishing/reading web sites today.
12 Publishing Data Roles Authors Publishers Curators Consumers Traditional Scientists Journals Libraries Scientists Emerging Collaborations Project www site Bigger Archives Scientists Exponential growth: Projects last at least 3-5 years Data sent upwards only at the end of the project Data will be never centralized More responsibility on projects Becoming Publishers and Curators Data will reside with projects Analyses must be close to the data
13 Data Federations of Web Services Massive datasets live near their owners: Near the instrument s software pipeline Near the applications Near data knowledge and curation Super Computer centers become Super Data Centers Each Archive publishes a web service Schema: documents the data Methods on objects (queries) Scientists get personalized extracts Uniform access to multiple Archives A common global schema Federation
 Web SERVICE: Given a XML document")
 returns (u, v, w) Distributed objects for the web. + naming, discovery, security,.")
14 Web Services: The Key? Web SERVER: Given a url + parameters Returns a web page (often dynamic) Web SERVICE: Given a XML document (soap msg) Returns an XML document Tools make this look like an RPC. F(x,y,z) returns (u, v, w) Distributed objects for the web. + naming, discovery, security,.. Internet-scale distributed computing Your program Your program Data In your address space http soap Web page object in xml Web Server Web Service

15 Grid and Web Services Synergy I believe the Grid will be many web services IETF standards Provide Naming Authorization / Security / Privacy Distributed Objects Discovery, Definition, Invocation, Object Model Higher level services: workflow, transactions, DB,.. Synergy: commercial Internet & Grid tools
16 Outline The Evolution of X-Info The World Wide Telescope as Archetype Data Mining the Sloan Digital Sky Survey Experiments & Instruments Simulations facts Other Archives facts Literature facts Data ingest Managing a petabyte Common schema How to organize it? How to reorganize it How to coexist with others facts? questions answers The Big Problems Query and Vis tools Support/training Performance Execute queries in a minute Batch query scheduling

")

.")

17 World Wide Telescope Virtual Observatory Premise: Most data is (or could be online) So, the Internet is the world s best telescope: It has data on every part of the sky In every measured spectral band: optical, x-ray, radio.. As deep as the best instruments (2 years ago). It is up when you are up. The seeing is always great (no working at night, no clouds no moons no..). It s a smart telescope: links objects and data to literature on them.
18 Why Astronomy Data? It has no commercial value No privacy concerns Can freely share results with others Great for experimenting with algorithms It is real and well documented High-dimensional data (with confidence intervals) Spatial data Temporal data Many different instruments from many different places and many different times Federation is a goal The questions are interesting How did the universe form? There is a lot of it (petabytes) ROSAT ~kev IRAS 25µ 2MASS 2µ DSS Optical IRAS 100µ WENSS 92cm NVSS 20cm GB 6cm


19 Time and Spectral Dimensions The Multiwavelength Crab Nebulae Slide courtesy of Robert CalTech. Crab star 1053 AD X-ray, optical, infrared, and radio views of the nearby Crab Nebula, which is now in a state of chaotic expansion after a supernova explosion first sighted in 1054 A.D. by Chinese Astronomers.
 lives in Database Online query to any and")
20 SkyServer.SDSS.org A modern archive Access to Sloan Digital Sky Survey Spectroscopic and Optical surveys Raw Pixel data lives in file servers Catalog data (derived objects) lives in Database Online query to any and all Also used for education 150 hours of online Astronomy Implicitly teaches data analysis Interesting things Spatial data search Client query interface via Java Applet Query from Emacs, Python,. Cloned by other surveys (a template design) Web services are core of it.

21 SkyServer SkyServer.SDSS.org Like the TerraServer, but looking the other way: a picture of ¼ of the universe Sloan Digital Sky Survey Data: Pixels + Data Mining About 400 attributes per object Spectrograms for 1% of objects
")
22 Demo of SkyServer Shows standard web server Pixel/image data Point and click Explore one object Explore sets of objects (data mining)
.")
23 Federation: SkyQuery.Net Combine 4 archives initially Just added 10 more Send query to portal, portal joins data from archives. Problem: want to do multi-step data analysis (not just single query). Solution: Allow personal databases on portal Problem: some queries are monsters Solution: batch schedule on portal server, Deposits answer in personal database.
24 SkyQuery Structure Each SkyNode publishes Schema Web Service Database Web Service Portal is Plans Query (2 phase) Integrates answers Is itself a web service Image Cutout INT SDSS SkyQuery Portal 2MASS FIRST
 Tamas Budavari (JHU astro postdoc) With help from Szalay, Thakar, Gray Implemented in C# and.net Allows queries like: SELECT o.")
25 SkyQuery: Distributed Query tool using a set of web services Four astronomy archives from Pasadena, Chicago, Baltimore, Cambridge (England). Feasibility study, built in 6 weeks Tanu Malik (JHU CS grad student) Tamas Budavari (JHU astro postdoc) With help from Szalay, Thakar, Gray Implemented in C# and.net Allows queries like: SELECT o.objid, o.r, o.type, t.objid FROM SDSS:PhotoPrimary o, TWOMASS:PhotoPrimary t WHERE XMATCH(o,t)<3.5 AND AREA(181.3,-0.76,6.5) AND o.type=3 and (o.i - t.m_j)>2
26 SkyNode Basic Web Services Metadata information about resources Waveband Sky coverage Translation of names to universal dictionary (UCD) Simple search patterns on the resources Cone Search Image mosaic Unit conversions Simple filtering, counting, histogramming On-the-fly recalibrations
27 Portals: Higher Level Services Built on Atomic Services Perform more complex tasks Examples Automated resource discovery Cross-identifications Photometric redshifts Outlier detections Visualization facilities Goal: Build custom portals in days from existing building blocks (like today in IRAF or IDL)
 Still exploring this INT SDSS SkyQuery Portal")
28 MyDB added to SkyQuery Let users add personal DB 1GB for now. Use it as a workbook. Online and batch queries. Image Cutout Moves analysis to the data Users can cooperate (share MyDB) Still exploring this INT SDSS SkyQuery Portal 2MASS FIRST MyDB
29 Outline The Evolution of X-Info The World Wide Telescope as Archetype Data Mining the Sloan Digital Sky Survey Experiments & Instruments Simulations facts Other Archives facts Literature facts Data ingest Managing a petabyte Common schema How to organize it? How to reorganize it How to coexist with others facts? questions answers The Big Problems Query and Vis tools Support/training Performance Execute queries in a minute Batch query scheduling
30 Working Cross-Culture How to design the database: Scenario Design Astronomers proposed 20 questions Typical of things they want to do Each would require a week of programming in tcl / C++/ FTP Goal, make it easy to answer questions DB and tools design motivated by this goal Implemented utility procedures JHU Built Query GUI for Linux /Mac/.. clients
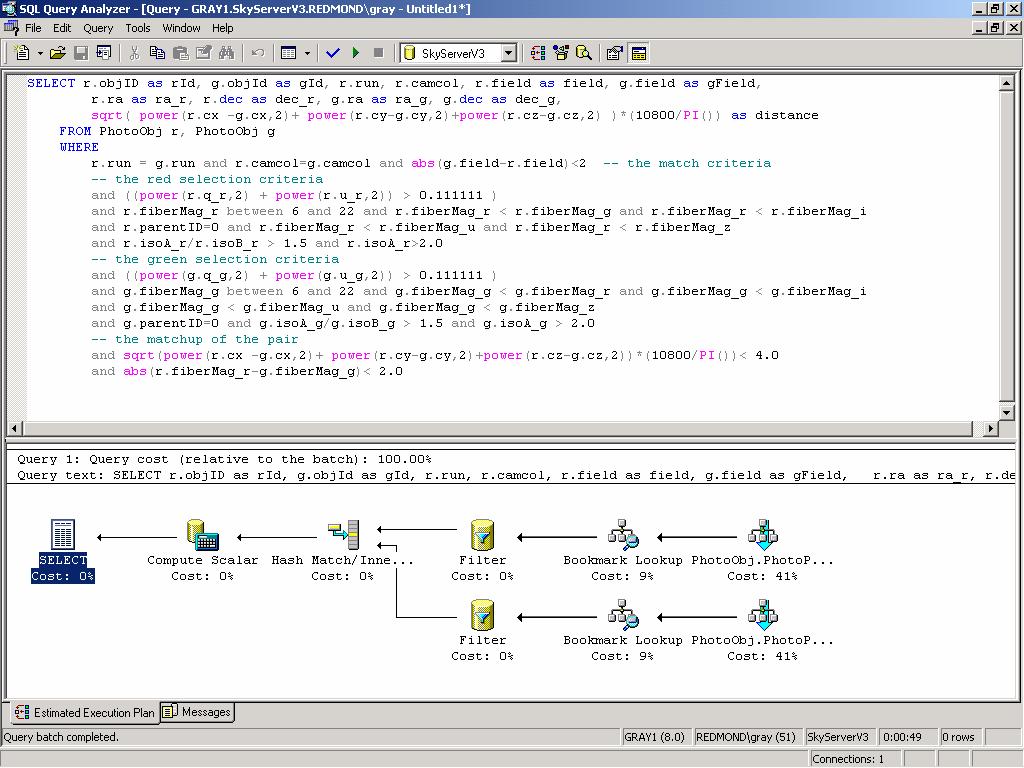
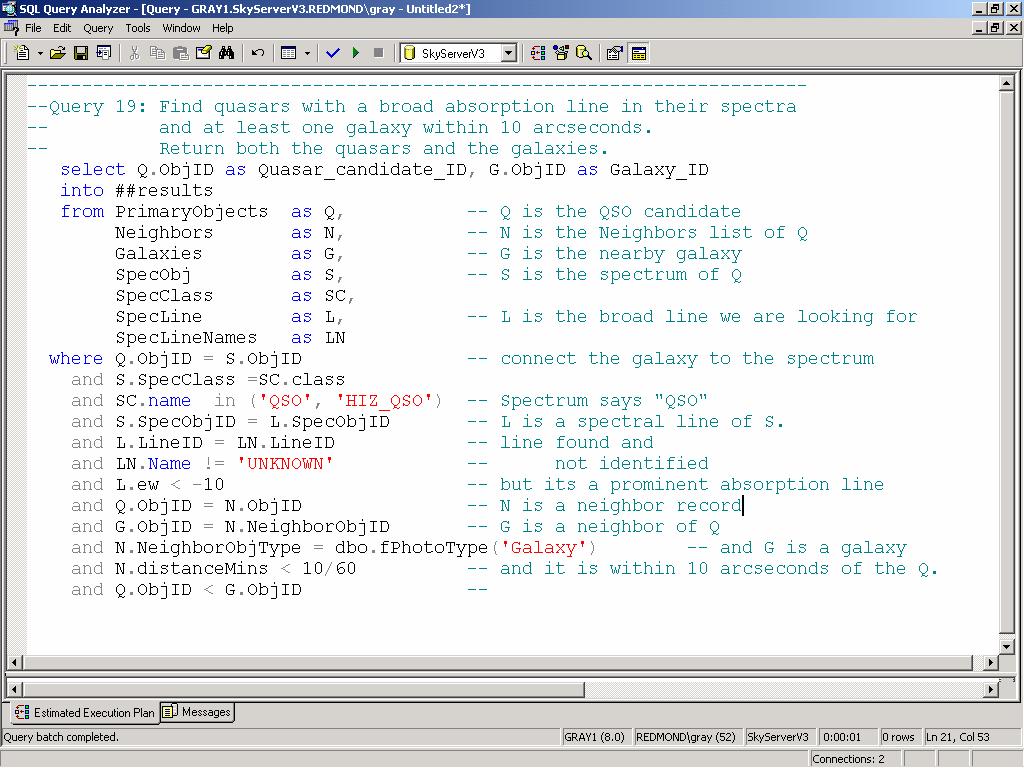
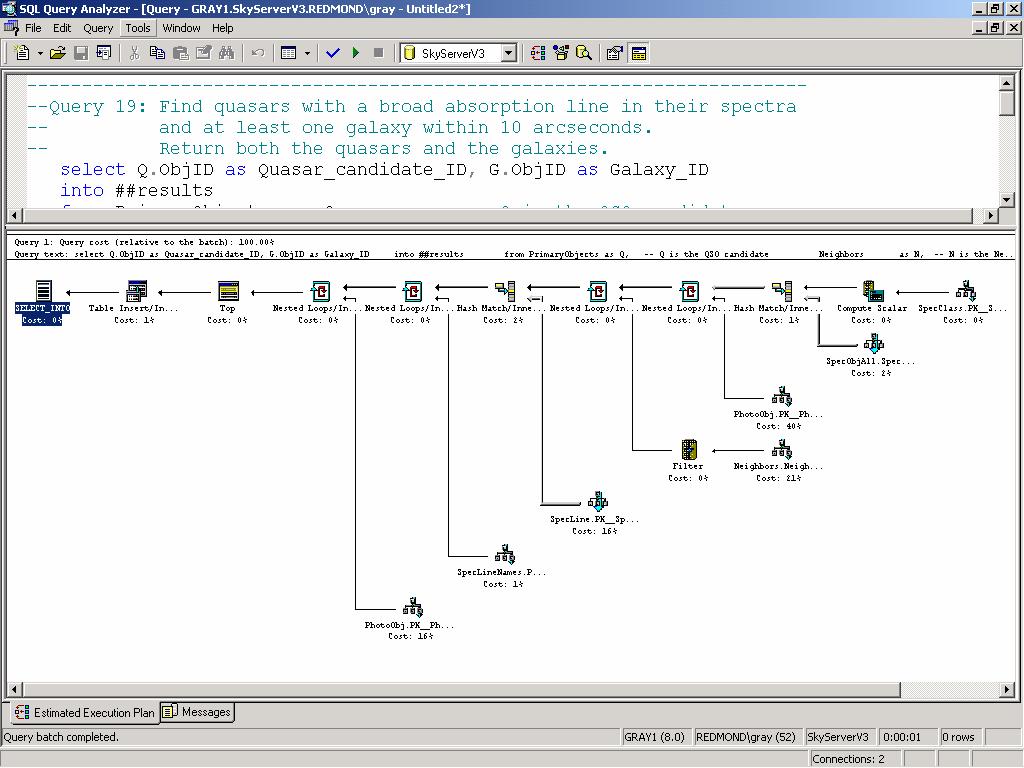
31 The 20 Queries Q1: Find all galaxies without unsaturated pixels within 1' of a given point of ra=75.327, dec= Q2: Find all galaxies with blue surface brightness between and 23 and 25 mag per square arcseconds, and - 10<super galactic latitude (sgb) <10, and declination less than zero. Q3: Find all galaxies brighter than magnitude 22, where the local extinction is >0.75. Q4: Find galaxies with an isophotal surface brightness (SB) larger than 24 in the red band, with an ellipticity>0.5, and with the major axis of the ellipse having a declination of between 30 and 60 arc seconds. Q5: Find all galaxies with a devaucouleours profile (r ¼ falloff of intensity on disk) and the photometric colors consistent with an elliptical galaxy. The devaucouleours profile Q6: Find galaxies that are blended with a star, output the deblended galaxy magnitudes. Q7: Provide a list of star-like objects that are 1% rare. Q8: Find all objects with unclassified spectra. Q9: Find quasars with a line width >2000 km/s and 2.5<redshift<2.7. Q10: Find galaxies with spectra that have an equivalent width in Ha >40Å (Ha is the main hydrogen spectral line.) Q11: Find all elliptical galaxies with spectra that have an anomalous emission line. Q12: Create a grided count of galaxies with u-g>1 and r<21.5 over 60<declination<70, and 200<right ascension<210, on a grid of 2, and create a map of masks over the same grid. Q13: Create a count of galaxies for each of the HTM triangles which satisfy a certain color cut, like 0.7u-0.5g-0.2i<1.25 && r<21.75, output it in a form adequate for visualization. Q14: Find stars with multiple measurements and have magnitude variations >0.1. Scan for stars that have a secondary object (observed at a different time) and compare their magnitudes. Q15: Provide a list of moving objects consistent with an asteroid. Q16: Find all objects similar to the colors of a quasar at 5.5<redshift<6.5. Q17: Find binary stars where at least one of them has the colors of a white dwarf. Q18: Find all objects within 30 arcseconds of one another that have very similar colors: that is where the color ratios u-g, g-r, r-i are less than 0.05m. Q19: Find quasars with a broad absorption line in their spectra and at least one galaxy within 10 arcseconds. Return both the quasars and the galaxies. Q20: For each galaxy in the BCG data set (brightest color galaxy), in 160<right ascension<170, -25<declination<35 count of galaxies within 30"of it that have a photoz within 0.05 of that galaxy. Also some good queries at:

32 Two kinds of SDSS data in an SQL DB (objects and images all in DB) 100M Photo Objects ~ 400 attributes 400K Spectra with ~30 lines/ spectrum
33 An easy one: Q7: Provide a list of star-like objects that are 1% rare. Found 14,681 buckets, first 140 buckets have 99% time 104 seconds Disk bound, reads 3 disks at 68 MBps. Select cast((u-g) as int) as ug, cast((g-r) as int) as gr, cast((r-i) as int) as ri, cast((i-z) as int) as iz, count(*) as Population from stars group by order by count(*) cast((u-g) as int), cast((g-r) as int), cast((r-i) as int), cast((i-z) as int)
34 An easy one Q15: Provide a list of moving objects consistent with an asteroid. Sounds hard but there are 5 pictures of the object at 5 different times (colors) and so can compute velocity. Image pipeline computes velocity. Computing it from the 5 color x,y would also be fast Finds 285 objects in 3 minutes, 140MBps. select objid, -- return object ID sqrt(power(rowv,2)+power(colv,2)) as velocity from photoobj -- check each object. where (power(rowv,2) + power(colv, 2)) -- square of velocity between 50 and huge values =error
+ power(r.cy-g.cy,2)+power(r.cz-g.cz,2) )*(10800/PI()) as distance FROM PhotoObj r, PhotoObj g WHERE r.run = g.run and r.camcol=g.camcol and abs(g.field-r.")
 + power(g.u_g,2)) > 0.")
35 Q15: Fast Moving Objects Find near earth asteroids: SELECT r.objid as rid, g.objid as gid, r.run, r.camcol, r.field as field, g.field as gfield, r.ra as ra_r, r.dec as dec_r, g.ra as ra_g, g.dec as dec_g, sqrt( power(r.cx -g.cx,2)+ power(r.cy-g.cy,2)+power(r.cz-g.cz,2) )*(10800/PI()) as distance FROM PhotoObj r, PhotoObj g WHERE r.run = g.run and r.camcol=g.camcol and abs(g.field-r.field)<2 -- the match criteria -- the red selection criteria and ((power(r.q_r,2) + power(r.u_r,2)) > ) and r.fibermag_r between 6 and 22 and r.fibermag_r < r.fibermag_g and r.fibermag_r < r.fibermag_i and r.parentid=0 and r.fibermag_r < r.fibermag_u and r.fibermag_r < r.fibermag_z and r.isoa_r/r.isob_r > 1.5 and r.isoa_r> the green selection criteria and ((power(g.q_g,2) + power(g.u_g,2)) > ) and g.fibermag_g between 6 and 22 and g.fibermag_g < g.fibermag_r and g.fibermag_g < g.fibermag_i and g.fibermag_g < g.fibermag_u and g.fibermag_g < g.fibermag_z and g.parentid=0 and g.isoa_g/g.isob_g > 1.5 and g.isoa_g > the matchup of the pair and sqrt(power(r.cx -g.cx,2)+ power(r.cy-g.cy,2)+power(r.cz-g.cz,2))*(10800/pi())< 4.0 and abs(r.fibermag_r-g.fibermag_g)< 2.0 Finds 3 objects in 11 minutes (or 27 seconds with an index) Ugly, but consider the alternatives (c programs an files and )
36
37 A Hard One Q14: Find stars with multiple measurements that have magnitude variations >0.1. This should work, but SQL Server does not allow table values to be piped to tablevalued functions. Returns a table of nearby objects select S.object_ID, S1.object_ID -- return stars that from Stars S, -- S is a star getnearbyobjeq(s.ra, s.dec, 0.017) as N -- N within 1 arcsec (3 pixels) of S. Stars S1 -- N == S1 (S1 gets the colors) where S.Object_ID < N.Object_ID -- S1 different from S == N and N.Type = dbo.phototype('star') -- S1 is a star (an optimization) and N.object_ID = S1.Object_ID -- N == S1 and ( abs(s.u-s1.u) > one of the colors is different. or abs(s.g-s1.g) > 0.1 or abs(s.r-s1.r) > 0.1 or abs(s.i-s1.i) > 0.1 or abs(s.z-s1.z) > 0.1 ) order by S.object_ID, S1.object_ID -- group the answer by parent star.
38 A Hard one: Second Try: Q14 Find stars with multiple measurements that have magnitude variations >0.1. Write a program with a cursor, ran for 2 days Table-valued function that returns the binary stars within a certain radius -- of another (in arc-minutes) (typically 5 arc seconds). -- Returns the ID pairs and the distance between them (in arcseconds). create function BinaryStars(@MaxDistanceArcMins float) table( S1_object_ID bigint not null, -- Star #1 S2_object_ID bigint not null, -- Star #2 distance_arcsec float) -- distance between them as begin bigint;-- Star's ID and binary ID float; -- Star's position float,@z float; -- Star's colors Open a cursor over stars and get position and colors declare star_cursor cursor for select object_id, ra, [dec], u, g, r, i, z from Stars; open star_cursor; while (1=1) -- for each star begin -- get its attribues fetch next from if (@@fetch_status = -1) break; -- end if no more stars insert -- insert its binaries S1.object_ID, -- return stars pairs sqrt(n.dotprod)/pi()* and distance in arc-seconds from -- Find objects nearby as N, -- call them N. Stars as S1 -- S1 gets N's color values < N.Object_ID -- S1 different from S and N.objType = dbo.phototype('star') -- S1 is a star and N.object_ID = S1.object_ID -- join stars to get colors of S1==N and (abs(@u-s1.u) > one of the colors is different. or abs(@g-s1.g) > 0.1 or abs(@r-s1.r) > 0.1 or abs(@i-s1.i) > 0.1 or abs(@z-s1.z) > 0.1 ) end; -- end of loop over all stars Looped over all stars, close cursor and exit. close star_cursor; -- deallocate star_cursor; return; -- return table end -- end of BinaryStars GO select * from dbo.binarystars(.05)
39 A Hard one: Third Try Q14: Find stars with multiple measurements that have magnitude variations >0.1. Use pre-computed neighbors table. Ran in 17 minutes, found 31k pairs. ================================================================================== -- Plan 2: Use the precomputed neighbors table select top 100 S.object_ID, S1.object_ID, -- return star pairs and distance str(n.distance_mins * 60,6,1) as DistArcSec from Stars S, -- S is a star Neighbors N, -- N within 3 arcsec (10 pixels) of S. Stars S1 -- S1 == N has the color attibutes where S.Object_ID = N.Object_ID -- connect S and N. and S.Object_ID < N.Neighbor_Object_ID -- S1 different from S and N.Neighbor_objType = dbo.phototype('star')-- S1 is a star (an optimization) and N.Distance_mins < the 3 arcsecond test and N.Neighbor_object_ID = S1.Object_ID -- N == S1 and ( abs(s.u-s1.u) > one of the colors is different. or abs(s.g-s1.g) > 0.1 or abs(s.r-s1.r) > 0.1 or abs(s.i-s1.i) > 0.1 or abs(s.z-s1.z) > 0.1 ) -- Found 31,355 pairs (out of 4.4 m stars) in 17 min 14 sec.
40 The Pain of Going Outside SQL (its fortunate that all the queries are single statements) Count parent objects 503 seconds for 14.7 M objects in 33.3 GB 66 MBps IO bound (30% of one cpu) 100 k records/cpu select count(*) from sec sxphotoobj where nchild > 0 Use a cursor No cpu parallelism CPU bound 6 MBps, 2.7 k rps 5,450 seconds (10x slower) int; int; = 0; declare PhotoCursor cursor for select nchild from sxphotoobj; open PhotoCursor; while (1=1) begin fetch next from PhotoCursor if (@@fetch_status = -1) break; end close PhotoCursor; deallocate PhotoCursor; print 'Sum is: '+cast(@sum as varchar(12))
41
42
43 Performance (on current SDSS data) Run times: on 15k$ HP Server (2 cpu, 1 GB, 8 disk) 1E+7 Some take 10 minutes 1E+6 1E+5 Some take 1 minute 1E+4 Median ~ 22 sec. 1E+3 1E+2 Ghz processors are fast! 1E+1 seconds (10 mips/io, 200 ins/byte) 2.5 m rec/s/cpu cpu elapsed IO count 1E+0 time vs queryid ae 1,000 IOs/cpu sec cpu vs IO ~1,000 IO/cpu sec ~ 64 MB IO/cpu sec CPU sec ,00 1 Q08 Q01 Q09 Q10A Q19 Q12 Q10 Q20 Q16 Q02 Q13 Q04 Q06 Q11 Q15B Q17 Q07 Q14 Q15A Q05 Q03 Q18
44 Call to Action If you do data visualization: we need you (and we know it). If you do databases: here is some data you can practice on. If you do distributed systems: here is a federation you can practice on. If you do data mining here is a dataset to test your algorithms. If you do astronomy educational outreach here is a tool for you.
45 SkyServer references (download personal SkyServer) Data Mining the SDSS SkyServer Database Jim Gray; Peter Kunszt; Donald Slutz; Alex Szalay; Ani Thakar; Jan Vandenberg; Chris Stoughton Jan p. An earlier paper described the Sloan Digital Sky Survey s (SDSS) data management needs [Szalay1] by defining twenty database queries and twelve data visualization tasks that a good data management system should support. We built a database and interfaces to support both the query load and also a website for ad-hoc access. This paper reports on the database design, describes the data loading pipeline, and reports on the query implementation and performance. The queries typically translated to a single SQL statement. Most queries run in less than 20 seconds, allowing scientists to interactively explore the database. This paper is an in-depth tour of those queries. Readers should first have studied the companion overview paper The SDSS SkyServer Public Access to the Sloan Digital Sky Server Data [Szalay2]. SDSS SkyServer Public Access to Sloan Digital Sky Server Data Jim Gray; Alexander Szalay; Ani Thakar; Peter Z. Zunszt; Tanu Malik; Jordan Raddick; Christopher Stoughton; Jan Vandenberg November p.: Word 1.46 Mbytes PDF 456 Kbytes The SkyServer provides Internet access to the public Sloan Digital Sky Survey (SDSS) data for both astronomers and for science education. This paper describes the SkyServer goals and architecture. It also describes our experience operating the SkyServer on the Internet. The SDSS data is public and well-documented so it makes a good test platform for research on database algorithms and performance. The World-Wide Telescope Jim Gray; Alexander Szalay August p.: Word 684 Kbytes PDF 84 Kbytes All astronomy data and literature will soon be online and accessible via the Internet. The community is building the Virtual Observatory, an organization of this worldwide data into a coherent whole that can be accessed by anyone, in any form, from anywhere. The resulting system will dramatically improve our ability to do multi-spectral and temporal studies that integrate data from multiple instruments. The virtual observatory data also provides a wonderful base for teaching astronomy, scientific discovery, and computational science. Designing and Mining Multi-Terabyte Astronomy Archives Robert J. Brunner; Jim Gray; Peter Kunszt; Donald Slutz; Alexander S. Szalay; Ani Thakar June p.: Word (448 Kybtes) PDF (391 Kbytes) The next-generation astronomy digital archives will cover most of the sky at fine resolution in many wavelengths, from X-rays, through ultraviolet, optical, and infrared. The archives will be stored at diverse geographical locations. One of the first of these projects, the Sloan Digital Sky Survey (SDSS) is creating a 5-wavelength catalog over 10,000 square degrees of the sky (see The 200 million objects in the multi-terabyte database will have mostly numerical attributes in a 100+ dimensional space. Points in this space have highly correlated distributions. Representing Polygon Areas and Testing Point-in-Polygon Containment in a Relational Database A Purely Relational Way of Computing Neighbors on a Sphere,
46 Outline The Evolution of X-Info The World Wide Telescope as Archetype Data Mining the Sloan Digital Sky Survey Experiments & Instruments Simulations facts Other Archives facts Literature facts Data ingest Managing a petabyte Common schema How to organize it? How to reorganize it How to coexist with others facts? questions answers The Big Problems Query and Vis tools Support/training Performance Execute queries in a minute Batch query scheduling
Databases Meet Astronomy a db view of astronomy data
 Databases Meet Astronomy a db view of astronomy data Jim Gray and Don Slutz Microsoft Research Collaborating with: Alex Szalay, Peter Kunszt, Ani Thakar @ JHU Roy Williams, George Djorgovski, Julian Bunn
Real Astronomy from Virtual Observatories
 THE US NATIONAL VIRTUAL OBSERVATORY Real Astronomy from Virtual Observatories Robert Hanisch Space Telescope Science Institute US National Virtual Observatory About this presentation What is a Virtual
The SDSS Data. Processing the Data
 The SDSS Data Processing the Data On a clear, dark night, light that has traveled through space for a billion years touches a mountaintop in southern New Mexico and enters the sophisticated instrumentation
Studying galaxies with the Sloan Digital Sky Survey
 Studying galaxies with the Sloan Digital Sky Survey Laboratory exercise, Physics of Galaxies, Spring 2017 (Uppsala Universitet) by Beatriz Villarroel *** The Sloan Digital Sky Survey (SDSS) is the largest
Introduction to the Sloan Survey
 Introduction to the Sloan Survey Title Rita Sinha IUCAA SDSS The SDSS uses a dedicated, 2.5-meter telescope on Apache Point, NM, equipped with two powerful special-purpose instruments. The 120-megapixel
Current Status of Chinese Virtual Observatory
 Current Status of Chinese Virtual Observatory Chenzhou Cui, Yongheng Zhao National Astronomical Observatories, Chinese Academy of Science, Beijing 100012, P. R. China Dec. 30, 2002 General Information
BAYESIAN CROSS-IDENTIFICATION IN ASTRONOMY
 BAYESIAN CROSS-IDENTIFICATION IN ASTRONOMY / The Johns Hopkins University Sketch by William Parsons (1845) 2 Recording Observations Whirlpool Galaxy M51 Discovered by Charles Messier (1773) Multicolor
RLW paper titles:
 RLW paper titles: http://www.wordle.net Astronomical Surveys and Data Archives Richard L. White Space Telescope Science Institute HiPACC Summer School, July 2012 Overview Surveys & catalogs: Fundamental
Astronomy of the Next Decade: From Photons to Petabytes. R. Chris Smith AURA Observatory in Chile CTIO/Gemini/SOAR/LSST
 Astronomy of the Next Decade: From Photons to Petabytes R. Chris Smith AURA Observatory in Chile CTIO/Gemini/SOAR/LSST Classical Astronomy still dominates new facilities Even new large facilities (VLT,
Astro-Informatics: Computation in the study of the Universe
 Astro-Informatics: Computation in the study of the Universe Bob Mann and Andy Lawrence Institute for Astronomy, School of Physics (rgm@roe.ac.uk & al@roe.ac.uk) Plan Computational Astrophysics N-body simulations
D4.2. First release of on-line science-oriented tutorials
 EuroVO-AIDA Euro-VO Astronomical Infrastructure for Data Access D4.2 First release of on-line science-oriented tutorials Final version Grant agreement no: 212104 Combination of Collaborative Projects &
COMPUTATIONAL STATISTICS IN ASTRONOMY: NOW AND SOON
 COMPUTATIONAL STATISTICS IN ASTRONOMY: NOW AND SOON / The Johns Hopkins University Recording Observations Astronomers drew it Now kids do it on the SkyServer #1 by Haley Multicolor Universe Eventful Universe
Modern Image Processing Techniques in Astronomical Sky Surveys
 Modern Image Processing Techniques in Astronomical Sky Surveys Items of the PhD thesis József Varga Astronomy MSc Eötvös Loránd University, Faculty of Science PhD School of Physics, Programme of Particle
Introduction to SDSS -instruments, survey strategy, etc
 Introduction to SDSS -instruments, survey strategy, etc (materials from http://www.sdss.org/) Shan Huang 17 February 2010 Survey type Status Imaging and Spectroscopy Basic Facts SDSS-II completed, SDSS-III
Rick Ebert & Joseph Mazzarella For the NED Team. Big Data Task Force NASA, Ames Research Center 2016 September 28-30
 NED Mission: Provide a comprehensive, reliable and easy-to-use synthesis of multi-wavelength data from NASA missions, published catalogs, and the refereed literature, to enhance and enable astrophysical
Data Management Plan Extended Baryon Oscillation Spectroscopic Survey
 Data Management Plan Extended Baryon Oscillation Spectroscopic Survey Experiment description: eboss is the cosmological component of the fourth generation of the Sloan Digital Sky Survey (SDSS-IV) located
An intelligent client application for on-line astronomical information
 An intelligent client application for on-line astronomical information Chenzhou CUI Chinese Virtual Observatory Project National Astronomical Observatory of China VO concept Virtual Observatory (VO) is
Design and implementation of the spectra reduction and analysis software for LAMOST telescope
 Design and implementation of the spectra reduction and analysis software for LAMOST telescope A-Li Luo *a, Yan-Xia Zhang a and Yong-Heng Zhao a *a National Astronomical Observatories, Chinese Academy of
arxiv:astro-ph/ v1 15 Dec 2000
 Virtual Observatories of the Future ASP Conference Series, Vol. 225, 2001 R.J. Brunner, S.G. Djorgovski, and A.S. Szalay, eds. The New Paradigm: Novel, Virtual Observatory Enabled Science arxiv:astro-ph/0012361v1
PRACTICAL ANALYTICS 7/19/2012. Tamás Budavári / The Johns Hopkins University
 PRACTICAL ANALYTICS / The Johns Hopkins University Statistics Of numbers Of vectors Of functions Of trees Statistics Description, modeling, inference, machine learning Bayesian / Frequentist / Pragmatist?
The File Geodatabase API. Craig Gillgrass Lance Shipman
 The File Geodatabase API Craig Gillgrass Lance Shipman Schedule Cell phones and pagers Please complete the session survey we take your feedback very seriously! Overview File Geodatabase API - Introduction
Characterizing the Gigahertz radio sky
 THE US NATIONAL VIRTUAL OBSERVATORY Mining multi-wavelength data in large area surveys with VO tools Yogesh Wadadekar STScI This work is partly supported by a NVO Research Initiative award. Collaborator:
Yuji Shirasaki. National Astronomical Observatory of Japan. 2010/10/13 Shanghai, China
 Yuji Shirasaki National Astronomical Observatory of Japan 1 Virtual Observatory Infrastructure for efficient research environment International standard for data publication & access Sharing data worldwide,
Machine Learning Applications in Astronomy
 Machine Learning Applications in Astronomy Umaa Rebbapragada, Ph.D. Machine Learning and Instrument Autonomy Group Big Data Task Force November 1, 2017 Research described in this presentation was carried
Skyalert: Real-time Astronomy for You and Your Robots
 Astronomical Data Analysis Software and Systems XVIII ASP Conference Series, Vol. 411, c 2009 D. Bohlender, D. Durand and P. Dowler, eds. Skyalert: Real-time Astronomy for You and Your Robots R. D. Williams,
Doing astronomy with SDSS from your armchair
 Doing astronomy with SDSS from your armchair Željko Ivezić, University of Washington & University of Zagreb Partners in Learning webinar, Zagreb, 15. XII 2010 Supported by: Microsoft Croatia and the Croatian
Surprise Detection in Multivariate Astronomical Data Kirk Borne George Mason University
 Surprise Detection in Multivariate Astronomical Data Kirk Borne George Mason University kborne@gmu.edu, http://classweb.gmu.edu/kborne/ Outline What is Surprise Detection? Example Application: The LSST
Flagging Bad Data in Imaging
 Flagging Bad Data Flagging Bad Data in Imaging Observations are never perfect, due to observing conditions e.g., bad seeing, moonlight, the solar wind, clouds, airplanes, cosmic rays, telescope malfunctions
A SPEctra Clustering Tool for the exploration of large spectroscopic surveys. Philipp Schalldach (HU Berlin & TLS Tautenburg, Germany)
") A SPEctra Clustering Tool for the exploration of large spectroscopic surveys Philipp Schalldach (HU Berlin & TLS Tautenburg, Germany) Working Group Helmut Meusinger (Tautenburg, Germany) Philipp Schalldach
A SPEctra Clustering Tool for the exploration of large spectroscopic surveys Philipp Schalldach (HU Berlin & TLS Tautenburg, Germany) Working Group Helmut Meusinger (Tautenburg, Germany) Philipp Schalldach
NASA/IPAC EXTRAGALACTIC DATABASE
 GRITS 2009 NASA/IPAC EXTRAGALACTIC DATABASE 20 years, 163 million objects, 3.3 billion rows, and beyond The Team Rick Ebert presenting What is? Mission A brief history 20 years, 3 dbms, multiple uif The
How Do I Create a Hubble Diagram to show the expanding universe?
 How Do I Create a Hubble Diagram to show the expanding universe? An extremely important topic in astronomy is the expansion of the universe. Although the expanding universe is nearly always discussed in
SDSS Data Management and Photometric Quality Assessment
 SDSS Data Management and Photometric Quality Assessment Željko Ivezić Princeton University / University of Washington (and SDSS Collaboration) Thinkshop Robotic Astronomy, Potsdam, July 12-15, 2004 1 Outline
Chapter 5: Telescopes
 Chapter 5: Telescopes You don t have to know different types of reflecting and refracting telescopes. Why build bigger and bigger telescopes? There are a few reasons. The first is: Light-gathering power:
AstroPortal: A Science Gateway for Large-scale Astronomy Data Analysis
 AstroPortal: A Science Gateway for Large-scale Astronomy Data Analysis Ioan Raicu Distributed Systems Laboratory Computer Science Department University of Chicago Joint work with: Ian Foster: Univ. of
Data-Intensive Statistical Challenges in Astrophysics
 Data-Intensive Statistical Challenges in Astrophysics Collaborators: T. Budavari, C-W Yip (JHU), M. Mahoney (Stanford), I. Csabai, L. Dobos (Hungary) Alex Szalay The Johns Hopkins University The Age of
ROSAT Roentgen Satellite. Chandra X-ray Observatory
 ROSAT Roentgen Satellite Joint facility: US, Germany, UK Operated 1990 1999 All-sky survey + pointed observations Chandra X-ray Observatory US Mission Operating 1999 present Pointed observations How do
The SDSS is Two Surveys
 The SDSS is Two Surveys The Fuzzy Blob Survey The Squiggly Line Survey The Site The telescope 2.5 m mirror Digital Cameras 1.3 MegaPixels $150 4.3 Megapixels $850 100 GigaPixels $10,000,000 CCDs CCDs:
CONFIRMATION OF A SUPERNOVA IN THE GALAXY NGC6946
 CONFIRMATION OF A SUPERNOVA IN THE GALAXY NGC6946 G. Iafrate and M. Ramella INAF - Astronomical Observatory of Trieste 1 Introduction Suddenly a star runs out its nuclear fuel. Its life as a normal star
Exploiting Virtual Observatory and Information Technology: Techniques for Astronomy
 Exploiting Virtual Observatory and Information Technology: Techniques for Astronomy Nicholas Walton AstroGrid Project Scientist Institute of Astronomy, The University of Cambridge Lecture #5 Goal: VO Applications
Data Intensive Computing meets High Performance Computing
 Data Intensive Computing meets High Performance Computing Kathy Yelick Associate Laboratory Director for Computing Sciences, Lawrence Berkeley National Laboratory Professor of Electrical Engineering and
Hubble s Law and the Cosmic Distance Scale
 Lab 7 Hubble s Law and the Cosmic Distance Scale 7.1 Overview Exercise seven is our first extragalactic exercise, highlighting the immense scale of the Universe. It addresses the challenge of determining
Astroinformatics: massive data research in Astronomy Kirk Borne Dept of Computational & Data Sciences George Mason University
 Astroinformatics: massive data research in Astronomy Kirk Borne Dept of Computational & Data Sciences George Mason University kborne@gmu.edu, http://classweb.gmu.edu/kborne/ Ever since humans first gazed
Virtual Observatory: Observational and Theoretical data
 Astrophysical Technology Group - OAT Virtual Observatory: Observational and Theoretical data Patrizia Manzato INAF-Trieste Astronomical Observatory 06 Dec 2007 Winter School, P.sso Tonale - P.Manzato 1
Photometric Redshifts with DAME
 Photometric Redshifts with DAME O. Laurino, R. D Abrusco M. Brescia, G. Longo & DAME Working Group VO-Day... in Tour Napoli, February 09-0, 200 The general astrophysical problem Due to new instruments
ALFALFA: The Arecibo Legacy Fast ALFA Survey: Martha Haynes (Cornell)
") ALFALFA: The Arecibo Legacy Fast ALFA Survey: Martha Haynes (Cornell) 1. Determination of the faint end of the HI Mass Function and the abundance of low mass gas rich halos 2. Environmental variation in
ALFALFA: The Arecibo Legacy Fast ALFA Survey: Martha Haynes (Cornell) 1. Determination of the faint end of the HI Mass Function and the abundance of low mass gas rich halos 2. Environmental variation in
ABSTRACT. Title: The Accuracy of the Photometric Redshift of Galaxy Clusters
 ABSTRACT Name: Elizabeth A. Holden Department: Physics Title: The Accuracy of the Photometric Redshift of Galaxy Clusters Major: Physics Degree: Master of Science Approved by: Date: Thesis Director NORTHERN
Deep Sky Astronomy page James E. Kotoski
 page 1 2001 James E. Kotoski Part II: What is? Have you ever wondered where our solar system came from, or... what is going to happen to it when it dies? Have you ever wondered what a galaxy was, and where
Radio observations of the Milky Way from the classroom
 Radio observations of the Milky Way from the classroom Krzysztof T. Chyży 1 1. Obserwatorium Astronomiczne Uniwersytetu Jagiellońskiego ul. Orla 171, 30-244 Kraków, Poland We present the project to introduce
The Milky Way Galaxy. Some thoughts. How big is it? What does it look like? How did it end up this way? What is it made up of?
 Some thoughts The Milky Way Galaxy How big is it? What does it look like? How did it end up this way? What is it made up of? Does it change 2 3 4 5 This is not a constant zoom The Milky Way Almost everything
Exploiting Virtual Observatory and Information Technology: Techniques for Astronomy
 Exploiting Virtual Observatory and Information Technology: Techniques for Astronomy Lecture #6 Goal: VO Workflows Science Usage Nicholas Walton AstroGrid Project Scientist Institute of Astronomy, The University
Innovation. The Push and Pull at ESRI. September Kevin Daugherty Cadastral/Land Records Industry Solutions Manager
 Innovation The Push and Pull at ESRI September 2004 Kevin Daugherty Cadastral/Land Records Industry Solutions Manager The Push and The Pull The Push is the information technology that drives research and
Surprise Detection in Science Data Streams Kirk Borne Dept of Computational & Data Sciences George Mason University
 Surprise Detection in Science Data Streams Kirk Borne Dept of Computational & Data Sciences George Mason University kborne@gmu.edu, http://classweb.gmu.edu/kborne/ Outline Astroinformatics Example Application:
Scientific Data Flood. Large Science Project. Pipeline
 The Scientific Data Flood Scientific Data Flood Large Science Project Pipeline 1 1 The Dark Energy Survey Study Dark Energy using four complementary* techniques: I. Cluster Counts II. Weak Lensing III.
LCO Global Telescope Network: Operations and policies for a time-domain facility. Todd Boroson
 LCO Global Telescope Network: Operations and policies for a time-domain facility Todd Boroson Network Concept Eighteen robotic telescopes ultimately ~27 2-meter, 1-meter, 40-cm Eight high-quality sites
Analytical data, the web, and standards for unified laboratory informatics databases
 Analytical data, the web, and standards for unified laboratory informatics databases Presented By Patrick D. Wheeler & Graham A. McGibbon ACS San Diego 16 March, 2016 Sources Process, Analyze Interfaces,
Classifying Galaxy Morphology using Machine Learning
 Julian Kates-Harbeck, Introduction: Classifying Galaxy Morphology using Machine Learning The goal of this project is to classify galaxy morphologies. Generally, galaxy morphologies fall into one of two
ArcGIS GeoAnalytics Server: An Introduction. Sarah Ambrose and Ravi Narayanan
 ArcGIS GeoAnalytics Server: An Introduction Sarah Ambrose and Ravi Narayanan Overview Introduction Demos Analysis Concepts using GeoAnalytics Server GeoAnalytics Data Sources GeoAnalytics Server Administration
BUILDING GALAXIES. Question 1: When and where did the stars form?
 BUILDING GALAXIES The unprecedented accuracy of recent observations of the power spectrum of the cosmic microwave background leaves little doubt that the universe formed in a hot big bang, later cooling
ESASky, ESA s new open-science portal for ESA space astronomy missions
 ESASky, ESA s new open-science portal for ESA space astronomy missions Bruno Merín ESAC Science Data Centre European Space Agency bruno.merin@esa.int Visit to NAOC, Beijing, 19/05/2017 ESA UNCLASSIFIED
Normal Galaxies (Ch. 24) + Galaxies and Dark Matter (Ch. 25) Symbolically: E0.E7.. S0..Sa..Sb..Sc..Sd..Irr
 + Galaxies and Dark Matter (Ch. 25) Symbolically: E0.E7.. S0..Sa..Sb..Sc..Sd..Irr") Normal Galaxies (Ch. 24) + Galaxies and Dark Matter (Ch. 25) Here we will cover topics in Ch. 24 up to 24.4, but then skip 24.4, 24.5 and proceed to 25.1, 25.2, 25.3. Then, if there is time remaining,
Normal Galaxies (Ch. 24) + Galaxies and Dark Matter (Ch. 25) Here we will cover topics in Ch. 24 up to 24.4, but then skip 24.4, 24.5 and proceed to 25.1, 25.2, 25.3. Then, if there is time remaining,
Experiences and Directions in National Portals"
 FIG Seminar on e-land Administration Innsbruck/Austria 2-4 June 2004 "ESRI's Experiences and Directions in National Portals" Kevin Daugherty Cadastral/Land Records Manager ESRI Topic Points Technology
FIVE FUNDED* RESEARCH POSITIONS
 OBSERVATION Sub-GROUP: 1. Masters (MSc, 1 year): Exploring extreme star-forming galaxies for SALT in the Sloan Digital Sky Survey 2. Masters (MSc,1 year): HI masses of extreme star-forming galaxies in
Multi-instrument, multiwavelength. energy sources with the Virtual Observatory
 Multi-instrument, multiwavelength study of high energy sources with the Virtual Observatory Caroline Bot 1,2, François Bonnarel 1,2, René Goosmann 2 and Françoise Genova 1,2 1: Centre de Données astronomiques
Quasars in the SDSS. Rich Kron NGC June 2006 START CI-Team: Variable Quasars Research Workshop Yerkes Observatory
 Quasars in the SDSS Rich Kron 28 June 2006 START CI-Team: Variable Quasars Research Workshop Yerkes Observatory NGC 1068 About 10% of all of the spectra in the SDSS database are of quasars (as opposed
Virtual Observatory (VO) An Introduction. Sudhanshu Barway South African Astronomical Observatory (SAAO), Cape Town
 An Introduction. Sudhanshu Barway South African Astronomical Observatory (SAAO), Cape Town") Virtual Observatory (VO) An Introduction Sudhanshu Barway South African Astronomical Observatory (SAAO), Cape Town March 19 th, 2009 About this presentation What is a Virtual Observatory? How does it work?
Virtual Observatory (VO) An Introduction Sudhanshu Barway South African Astronomical Observatory (SAAO), Cape Town March 19 th, 2009 About this presentation What is a Virtual Observatory? How does it work?
ArcGIS Enterprise: What s New. Philip Heede Shannon Kalisky Melanie Summers Shreyas Shinde
 ArcGIS Enterprise: What s New Philip Heede Shannon Kalisky Melanie Summers Shreyas Shinde ArcGIS Enterprise is the new name for ArcGIS for Server ArcGIS Enterprise Software Components ArcGIS Server Portal
How do telescopes "see" on Earth and in space?
 How do telescopes "see" on Earth and in space? By NASA, adapted by Newsela staff on 03.28.17 Word Count 933 Level 970L TOP IMAGE: The Hubble Space Telescope orbiting in space over Earth. SECOND IMAGE:
Using Authentic Astronomical Data in Investigations & Activities. Version 1.1, presented at CONASTA 59, UTS, Monday 5 July 2010.
 Using Authentic Astronomical Data in Investigations & Activities. Version 1.1, presented at CONASTA 59, UTS, Monday 5 July 2010. Abstract: Astronomy is undergoing a revolution in the size and availability
Imagery and the Location-enabled Platform in State and Local Government
 Imagery and the Location-enabled Platform in State and Local Government Fred Limp, Director, CAST Jim Farley, Vice President, Leica Geosystems Oracle Spatial Users Group Denver, March 10, 2005 TM TM Discussion
Big-Data as a Challenge for Astrophysics
 Big-Data as a Challenge for Astrophysics ESA / Euclid Consortium Hubble deep field, NASA/STScI HESS collaboration, F. Acero and H. Gast ESA/ATG medialab; ESO/S. Brunier Volker Beckmann Institut National
The Challenge of Geospatial Big Data Analysis
 288 POSTERS The Challenge of Geospatial Big Data Analysis Authors - Teerayut Horanont, University of Tokyo, Japan - Apichon Witayangkurn, University of Tokyo, Japan - Shibasaki Ryosuke, University of Tokyo,
Surveys at z 1. Petchara Pattarakijwanich 20 February 2013
 Surveys at z 1 Petchara Pattarakijwanich 20 February 2013 Outline Context & Motivation. Basics of Galaxy Survey. SDSS COMBO-17 DEEP2 COSMOS Scientific Results and Implications. Properties of z 1 galaxies.
MANUAL for GLORIA light curve demonstrator experiment test interface implementation
 GLORIA is funded by the European Union 7th Framework Programme (FP7/2007-2013) under grant agreement n 283783 MANUAL for GLORIA light curve demonstrator experiment test interface implementation Version:
a computer running the CLEA activity The Large Scale Structure of the Universe. a computer running a spreadsheet program
 TAP 704-5: Red shift The CLEA software enables you to simulate controlling a telescope so that it points at a selected galaxy, and then using a spectrometer to record the light received over a range of
R. Alvino, I. De Marino, M. Magrì, M. Oliviero, G. Severino and Th. Straus
 Mem. S.A.It. Vol. 75, 282 c SAIt 2004 Memorie e a Î ÅÇË ÓÒÐ Ò Ö Ú ÔÓØ ÒØ Ð ØÝ Ò ÔÖÓ Ô Ø R. Alvino, I. De Marino, M. Magrì, M. Oliviero, G. Severino and Th. Straus Istituto Nazionale di Astrofisica Osservatorio
GOODS/VIMOS Spectroscopy: Data Release Version 2.0.1
 ESO Phase 3 Data Release Description Data Collection GOODS_VIMOS_SPEC Release Number 1 Data Provider C. Cesarsky Date 10.03.2010 Migrated to Phase 3 infrastructure 08.12.2014 GOODS/VIMOS Spectroscopy:
LARGE QUASAR GROUPS. Kevin Rahill Astrophysics
 LARGE QUASAR GROUPS Kevin Rahill Astrophysics QUASARS Quasi-stellar Radio Sources Subset of Active Galactic Nuclei AGNs are compact and extremely luminous regions at the center of galaxies Identified as
GOODS/FORS2 Final Data Release: Version 3.0
 ESO Phase 3 Data Release Description Data Collection GOODS_FORS2 Release Number 1 Data Provider C. Cesarsky Date 30.10.2007 update 11.07.2014 GOODS/FORS2 Final Data Release: Version 3.0 As part of the
Leveraging Web GIS: An Introduction to the ArcGIS portal
 Leveraging Web GIS: An Introduction to the ArcGIS portal Derek Law Product Management DLaw@esri.com Agenda Web GIS pattern Product overview Installation and deployment Configuration options Security options
The CSC Interface to Sky in Google Earth
 The CSC Interface to Sky in Google Earth CSC Threads The CSC Interface to Sky in Google Earth 1 Table of Contents The CSC Interface to Sky in Google Earth - CSC Introduction How to access CSC data with
From DES to LSST. Transient Processing Goes from Hours to Seconds. Eric Morganson, NCSA LSST Time Domain Meeting Tucson, AZ May 22, 2017
 From DES to LSST Transient Processing Goes from Hours to Seconds Eric Morganson, NCSA LSST Time Domain Meeting Tucson, AZ May 22, 2017 Hi, I m Eric Dr. Eric Morganson, Research Scientist, Nation Center
Science in the Virtual Observatory
 Mem. S.A.It. Vol. 80, 352 c SAIt 2009 Memorie della Science in the Virtual Observatory M.G. Allen Observatoire de Strasbourg UMR 7550 11 Rue de l Universite, F-67000 Strasbourg, France e-mail: allen@astro.u-strasbg.fr
Using the File Geodatabase API. Lance Shipman David Sousa
 Using the File Geodatabase API Lance Shipman David Sousa Overview File Geodatabase API - Introduction - Supported Tasks - API Overview - What s not supported - Updates - Demo File Geodatabase API Provide
The Dark Energy Survey Public Data Release 1
 The Dark Energy Survey Public Data Release 1 Matias Carrasco Kind (NCSA/UIUC) and the DR1 Release Team https://des.ncsa.illinois.edu/ Near-Field Cosmology with DES DR1 and Beyond Workshop, June 27-29th,
The Stars: Glowing Spheres In The Sky (Exploring Our Solar System) By David Jefferis
 By David Jefferis") The Stars: Glowing Spheres In The Sky (Exploring Our Solar System) By David Jefferis If looking for a ebook by David Jefferis The Stars: Glowing Spheres in the Sky (Exploring Our Solar System) in pdf form,
The Stars: Glowing Spheres In The Sky (Exploring Our Solar System) By David Jefferis If looking for a ebook by David Jefferis The Stars: Glowing Spheres in the Sky (Exploring Our Solar System) in pdf form,
Administering your Enterprise Geodatabase using Python. Jill Penney
 Administering your Enterprise Geodatabase using Python Jill Penney Assumptions Basic knowledge of python Basic knowledge enterprise geodatabases and workflows You want code Please turn off or silence cell
MIT Invitational, Jan Astronomy C. 2. You may separate the pages, but do not forget to put your team number at the top of all answer pages.
 MIT Invitational, Jan 2019 Astronomy C Competitors: School name: Team number: INSTRUCTIONS 1. Please turn in all materials at the end of the event. 2. You may separate the pages, but do not forget to put
Visualizing Big Data on Maps: Emerging Tools and Techniques. Ilir Bejleri, Sanjay Ranka
 Visualizing Big Data on Maps: Emerging Tools and Techniques Ilir Bejleri, Sanjay Ranka Topics Web GIS Visualization Big Data GIS Performance Maps in Data Visualization Platforms Next: Web GIS Visualization
Astronomical image reduction using the Tractor
 the Tractor DECaLS Fin Astronomical image reduction using the Tractor Dustin Lang McWilliams Postdoc Fellow Carnegie Mellon University visiting University of Waterloo UW / 2015-03-31 1 Astronomical image
A Library of the X-ray Universe: Generating the XMM-Newton Source Catalogues
 A Library of the X-ray Universe: Generating the XMM-Newton Source Catalogues Iris Traulsen Axel Schwope, Georg Lamer Leibniz-Institut für Astrophysik Potsdam (AIP) on behalf of the XMM-Newton Survey Science
Portal for ArcGIS: An Introduction. Catherine Hynes and Derek Law
 Portal for ArcGIS: An Introduction Catherine Hynes and Derek Law Agenda Web GIS pattern Product overview Installation and deployment Configuration options Security options and groups Portal for ArcGIS
Astroinformatics in the data-driven Astronomy
 Astroinformatics in the data-driven Astronomy Massimo Brescia 2017 ICT Workshop Astronomy vs Astroinformatics Most of the initial time has been spent to find a common language among communities How astronomers
The INES Archive in the era of Virtual Observatories. E. Solano Spanish Virtual Observatory LAEX CAB / INTA-CSIC
 The INES Archive in the era of Virtual Observatories E. Solano Spanish Virtual Observatory LAEX CAB / INTA-CSIC PV2009, ESAC, Dec 2009 Outline Introduction: Archives in in Astronomy The IUE Archive Curation
Galaxies & Introduction to Cosmology
 Galaxies & Introduction to Cosmology Other Galaxies: How many are there? Hubble Deep Field Project 100 hour exposures over 10 days Covered an area of the sky about 1/100 the size of the full moon Probably
Data Release 5. Sky coverage of imaging data in the DR5
 Data Release 5 The Sloan Digital Sky Survey has released its fifth Data Release (DR5). The spatial coverage of DR5 is about 20% larger than that of DR4. The photometric data in DR5 are based on five band
Reduced data products in the ESO Phase 3 archive (Status: 02 August 2017)
") Reduced data products in the ESO Phase 3 archive (Status: 02 August 2017) The ESO Phase 3 archive provides access to reduced and calibrated data products. All these data are stored in standard formats
Reduced data products in the ESO Phase 3 archive (Status: 02 August 2017) The ESO Phase 3 archive provides access to reduced and calibrated data products. All these data are stored in standard formats
New Extended Radio Sources From the NVSS
 Astrophysical Bulletin,, vol. 7, No. July, 7 Translated from Astrofizicheskij Byulleten,, vol.7, No., pp. 7- New Extended Radio Sources From the NVSS V.R. Amirkhanyan, V.L. Afanasiev and A. V. Moiseev
Active Galaxies & Quasars
 Active Galaxies & Quasars Normal Galaxy Active Galaxy Galactic Nuclei Bright Active Galaxy NGC 5548 Galaxy Nucleus: Exact center of a galaxy and its immediate surroundings. If a spiral galaxy, it is the
Science with the New Hubble Instruments. Ken Sembach STScI Hubble Project Scientist
 Science with the New Hubble Instruments Ken Sembach STScI Hubble Project Scientist 1 Hubble Has Improved Over Time Servicing missions have improved Hubble s vision. Hubble sees farther and with greater
The Sloan Digital Sky Survey
 The Sloan Digital Sky Survey Robert Lupton Xiaohui Fan Jim Gunn Željko Ivezić Jill Knapp Michael Strauss University of Chicago, Fermilab, Institute for Advanced Study, Japanese Participation Group, Johns