~++:$++~:+ ~: , $..q,, *A..l.,~,+,*- _._= - 4,... i.-_.-. -_. Q ,.,, -.;-...
|
|
|
- Iris Anderson
- 5 years ago
- Views:
Transcription

1 - +, $ -!! Department of Eneray under contract W-740SENQ $q,, *Al,~,+,*- = - 4, i-_ - -_ Q -+ +,,, - ;-,,,,, -,,,- ;, _,,: <: - -, :; : _O: =b@* Y-,-,,,, ; ~++:$++~:+ ~:,, - >_-=,-L7 L-L -+, ~~~ -? < -~= : ~iw - - ~ - - -, - - :-= es~+~~~+~=~ :~~
2 An Affiitive Opporhcrsit y Employer This work was supported by the US Air Force Weapons Laboratory - I,, : DISCLAIMER Thisreportwaspreparedasanaccountof worksponsoredbyanagencyor thewrdied-statescwer-ru-nent NeithertheUcutedStatesGovernmentnoranyagencythereof,norSSSYof theiremployees,makesacry warranty,exprksor tmplied,or assumesanylegaliiabihtyor responsibilityfor theaccuracy,completeness, osrasefulne=or acryinfocmatiorr,apparatus,produd,or processdisclosedor repreaantathatitsusewould notinfringeprivatelyownedrightsreferenceshereinto aasyspidlc corrvnercialproduct,process,or serviceby tradename,trrrdemaik,maarufacturer, or olhenviae,dws not necessarilyconstituteor implyits cstdorsecnent, recornrnendation, favoringby the UnitedStatesCovernmenlor anyagencythereof The view%andopinionsof authorscxpresed hereindo not necesr-ily stateor reflectthoseof theuruted StatesGmwnrrscntor anyagencythereof
3 LA-9475-MS UC-34 Issued: September 1982 Optical Properties of Explosive-Driven Shock Waves in Noble Gases C R Jones W C Davis J Los Alamos National Laboratory - ~~~~n~mos LosAlamos,NewMexico8755
4 OPTICAL PROPERTIES OF EXPLOSIVE-DRIVEN SHOCK WAVES IN NOBLE GASES by C R Jones and W C Davis ABSTRACT High explosives have been used to shock-heat rare gases to brightness temperatures up to K Temperatures were determined from radiometer signals at both 280 nm and 520 nm Shock velocities up to 9 mm/ps were used in both planar and cylindrical geometries Neon, argon, krypton, and xenon gases at atmospheric pressure were examined in planar shocks Using argon, the effects of initial gas pressure and an admixed molecular species were observed For a radial shock expansion in argon, brightness temperatures were measured over a range of shock velocities Close agreement between brightness temperatures measured at both uv and visible wavelengths indicated that the shock fronts were radiating a blackbody spectrum Timeresolved spectrograms of the emission also suggest that these sources are blackbody radiators For a cylindrical shock expansion in argon, explosive energy was converted to optical energy with an efficiency of 4% 1
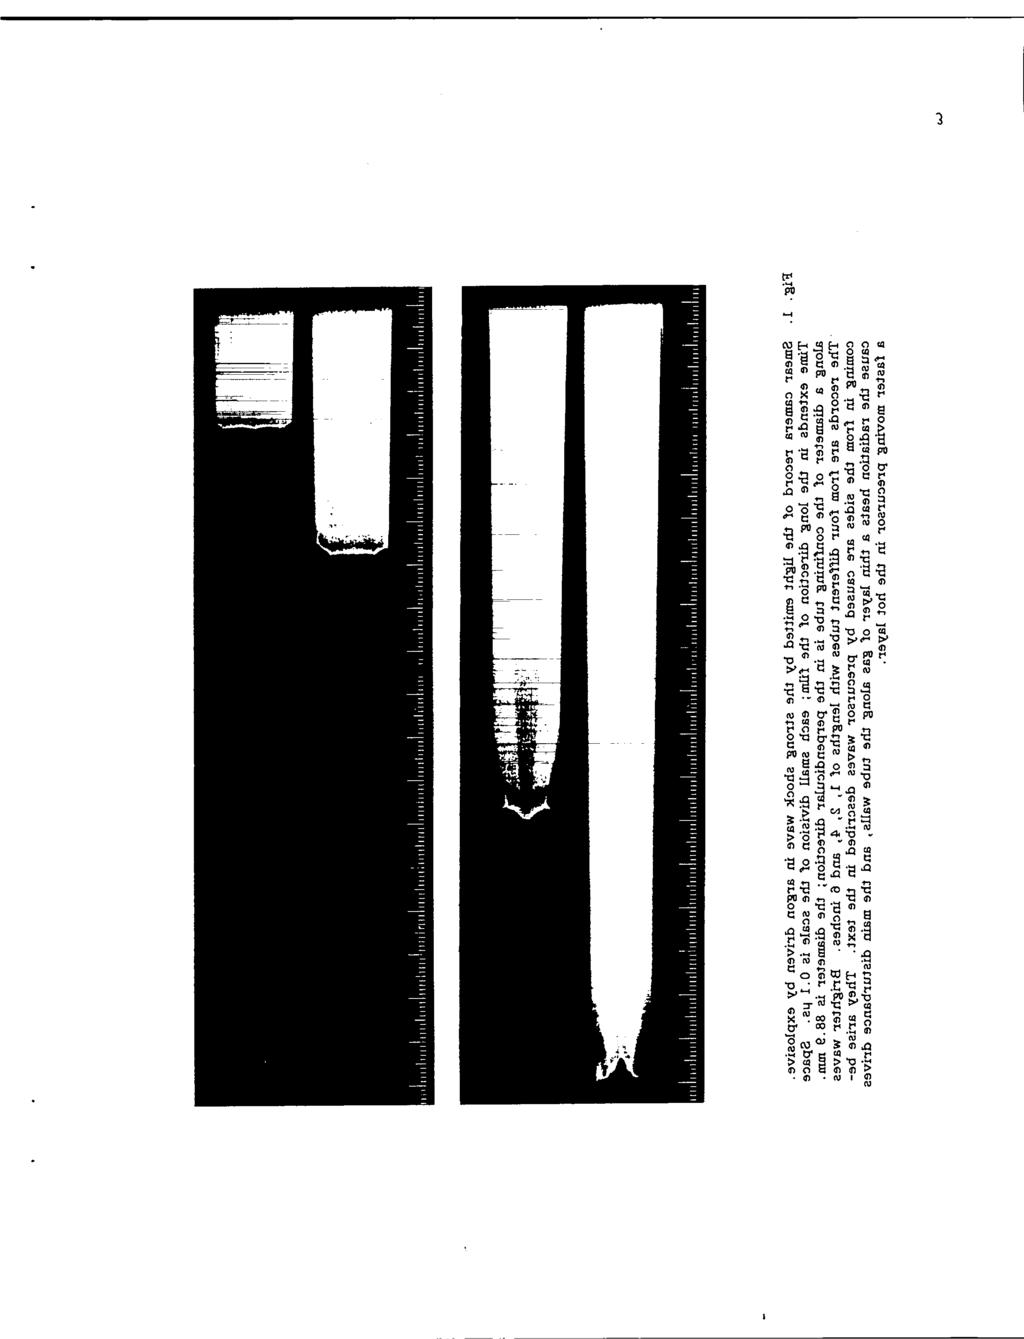
5 I I INTRODUCTION Experiments addressing optical properties of explosive shock-driven light sources are reported The major purpose of these experiments was to identifythe parameters affecting the brightness temperature of shock fronts created in rare gases by means of high explosives The basic apparatus for these experiments was the argon flash charge, which has been used for many years at the Laboratory and elsewhere as a bright visible light source for explosive-test photography As a result, these sources have been characterized fairly well in the visible part of the 1 spectrum In at least one program, however, there is a requirement for bright ultraviolet (UV) light sources Therefore, we have performed ap proximately 40 experiments on HE-driven light sources using both uv and visible diagnostics The primary goal was to determine the brightness temperature of both planar and cylindrical shocks in argon ga~ In addition, the temperature was measured for planar shocks in neon, krypton, and xenon We also determined the shock velocity and observed the shock front stability in both planar and cylindrical geometries In the planar geometry, the effect of a molecular impurity in argon was observed, as well as the effect of argon pressure In the next section, experiments on the planar shock waves will be discussed Following that, the cylindrical geometry experiments will be addressed The fourth section will compare these results with those of other workers In the final section, the results will be summarized and conclusions presented II EXPERIMENTS ON PLANAR SHOCK WAVES The first subsection will discuss the phenomenology of planar shock waves propagating down cylindrical tubes The important characteristics of these light sources, including various wall interactions, are featured The subsequent subsection will describe the experiments on the ultraviolet emission from these planar sources A The Explosive-Driven Argon Shock Tube The interacting waves in the argon shock tube or argon flash charge were photographed using a smear camera This camera has a narrow entrance slit and accepts and records only that light emitted along a diameter of the shock tube The image of the entrance slit is swept along the film after reflection from a rotating mirror The record on the film therefore shows the intensity of the light from the tube as it varies with time Time increases in the long direction of the film while space along a tube diameter is represented perpendicularly Four shock tubes were photographed Each tube was made of dural, with an inside diameter of 35 inches (889 mm) and a wall thickness of 025 inch (635 mm) The lengths of the tubes were 1 inch (254 mm), 2 inches (508 mm), 4 inches (1016 mm), and 6 inches (1524 mm), respectively The records are shown in Fig 1 Time marks on the films are 1 ps for each large division, so the total width is about 19 ps In the spatial direction each tube is 889 mm in diameter, and the width of the bright bands at the left edge corresponds to this distance The shock tubes were driven by a 4-inch diameter plane-wave lens (a P-040 lens made of Composition B and Baratol) that initiated a plane detonation wave in a disk of PBX-9404 explosive that was 4 inches ( 1016 mm) in diameter and 1 inch (254 mm) thick PBX-9404 is a highenergy plastic-bonded HMX composition Its density is 184 g/cm3, detonation velocity 8775 m/s, and detonation pressure 356 GPa The disk of PBX-9404 drives the shock wave in the tube; the lens merely provides almost simultaneous initiation of the disk on one face The explosive disk seals one end of the argon shock tube The other end is sealed by a glass window about 30 mm thick 1 At the left edge of the smear camera records, corresponding to the time when the detonation wave in the explosive reached the interface with the argon, we can see the light intensity rise to full brightness in about 01 ps (one small division) This risetime is the time needed to shock enough argon to get one or two optical depths so that it radiates as a blackbody The shock wave travela about 9 mm/ps and the density of the argon at one LOs Alsmos atmosphere is about fj0013 g/cm3, so that in O 1 ps about g/cm2 becomes optically thick The compression of the argon by the 2
6 !-l 3
7 shock is about 12, so the layer is only 0075 mm thick Ahead of it lies unshocked argon at atmospheric pressure, and behind it are the explosive product gases The striations in the light that persist for about 05 ps are caused by small imperfections in the wave from the explosive, amplified by the instability of the interface of the argon and explosive products As the argon layer becomes thicker, these little ripples lose their effect In a detonating explosive, the pressure is highest at the detonation front, and it falls rapidly in the gases following the front As time goes on, the pressure in the products driving the argon falls, and the shock wave slows down a little Since the temperature depends on the shock speed, the shock temperature and shock brightness decrease with time The decrease can be seen along the center of each shock tube, but only up to about 13 ps in the longest tube The x-t (length and time) data from the three tubes in which a plane segment of the main shock reaches the end window are fit fairly well by x = 697[1 - exp(-o013t)], with x in mm and t in ps The shock velocity, obtained by cliff erentiation, is hot The bright light is transmitted through it until it becomes optically thick, and then the light dims to correspond to its temperature The end of each record shows what happens as the shock wave reaches the glass window As the shock reflects, the pressure increases and the temperature jumps to a high value The light brightens correspondingly, but then very quickly goes out The cooling of an opaque Iayer next to the glass window is probably caused mainly by radiation Other experiments have ahown, however, that the rate of cooling depends on the composition of the surface of the window Perhaps some relatively cold glass, evaporated by the absorption radiation, mixes with the hot argon to form a cool, opaque layer at the interface The phenomena that occur at the wall of the dural tube may, perhaps, be more easily understood by first considering another analogous effect well known to those,who work with explosives It happens in cracks in the explosive, or in the space between explosive and metal when the parts do not fit closely Let us tpke the case of a cylinder of explosive in a metal tube with a space (filled with air) between the explosive and the tube Figure 2 shows the positions of various fronts after the detonation has proceeded up the U = 906 exp(-o013t) Radiation from the argon shock waves is absorbed by the tube boundaries The window on the end of the tube is transparent for a very narrow spectral region, and absorbs most of the radiation incident on it The gas next to the window is heated, and as it expands it drives a shock wave back toward the main shock The intersection of these two shocks can be seen in the short tube about a quarter of a microsecond before the Light goes out, and in the 2-inch tube about one-half microsecond before the end The light brightens for a very brief instant, and then it becomes dimmer than it would have been The reflected shock in the argon that has been heated by the main shock heats it even more, and the Jight brightens This very hot shock is optically thick very quickly because it is so hot The argon heated by the transmitted shock is not as // / Explosive Detonation Product frc goses Airspoce k Metol tube rsh::ko~rave \ interface l Products/oir A / Tube deflected by explosive Fig 2 Diagram of explosive in a metal tube with an air gap between the explosive and the tube The dense explosive-product gases drive a precursor shock in the air layer 4
8 tube for some distance The air in the annular gap is compressed by the expanding explosive products, and driven up the gap All the air that was in the gap is now compressed between the products-air interface and the shock wave in the air The shock in the air runs ahead of the detonation front, getting farther ahead as time goes on The shocked air transmits its pressure to the metal tube on one side and the unreacted explosive on the other The pressure is relatively smau, however, about O 1 GPa, and neither the solid explosive nor the metal deflects appreciably There are shocks in both, shown as lines from the front of the air shock going back at approximately the Mach angle Figure 3 shows the positions of the various fronts in the argon shock tube The thick heated layer of argon at the wall is less dense than the bulk of the argon, end it takes the place of the air gap in the explosive tube The shock in the bulk argon acts as the expanding explosive products did in Fig 2, driving the hot gas ahead of Argon layer Aeoted by radiation kcompressed gos from hot Ioyer Mach wave Compressed Argon Explosive product goses Fig 3 Diagram of an argon shock wave in a metal tube There is a layer of hot argon at the tube wall abead of the main disturbance, because the intense radiation from the hot argon at about 24 kk is absorbed at the wall and heats the gas near it A precursor is driven by the main shock wave, and it runs ahead in the hot layer The precursor in the hot layer cause s a shock wave (Mach wave) in the bulk of the argon, and this wave is responsible for some of the main features seen in the smear camera records it There is a big difference in the compressibility of the argon relative to that of the explosive, and the Mach wave from the precursor shock heats the argon appreciably The main shock then heats the gas further, so it appears brighter The smear camera trace, Fig 1, shows the brighter light from the gas that is precompressed by the Mach wave and then is shocked by the main shock, which starts at the outside of the tube and then moves in The compressed gas from the hot layer is not luminous enough to show in the picture, but its presence is shown by the way it obscures the light, thereby making the light region narrower as it runs (Note that the dark lines, which are defects in the camera slit and which run in the time direction, get closer to the edge as time goes on ) The precursor shock makes a little light when it hits the window; it can be seen at about 46 ps for the 2-inch tube, about 9 ps for the 4-inch tube, and about 142 ps for the 6-inch tube Its interaction with the window causes peculiarities in the outside ring as the main shock advances near the window The intersection of the Mach waves (at about 131 ps in the 6-inch tube), causes a strong brightening at the center All the oscilloscope traces of shock brightness show this effect The center of the wave moves very rapidly after the interaction, and while the center was last to reach the window in the 4-inch tube, it is first in the 6-inch tube After the interaction the shock wave has a convex section at its center, surrounded by a funnel-shaped shock The cusp at the intersection of these waves shows up as a pair of dark lines in the photographs Probably the details of wall interactions, etc, are of little importance for most purposes It is helpful to understand the details to be sure that some important process has not been missed It might be possible to enhance the performance of shock-tube light sources by putting in extra interactions to increase the light output The precursor waves and other interesting phenomena were studied long ago by R G Shreffler and R H Christian 2 Some of the ideas about the origin of these phenomena discussed here are apparently new Hydrodynamic modeling of the details will test the correctness of the new ideas 5
9 B Ultraviolet and Visible Emission from Planar Shock Waves in Rare Gases Radiometric measurements of the uv and visible radiation emitted by rare gas flash charges are discussed below The experimental technique will be presented first, followed by results obtained from various tests Tests were numbered UV- 1 through UV-38 in chronological order 1 Experimental Arrangement For these tests the source was an argon flash charge described previously and similar to that shown schematically in Fig 4 This shot was usually located a distance of approximately 65 m from the bunker window This device consists of an argon-filled tube with an explosive charge at one end and a window at the other The tube, of either cardboard or dural, was usually 30 cm in length and 875 cm in diameter A small gas port was located near each end to facilitate purging the system with argon In some experiments with a dural tube, an evacuation and fill procedure was used One end of the tube was sealed with the explosive, a 25- x 1O- X 10-cm block of PBX 94o4 In most tests a P40 explosive plane-wave lens was positioned between the detonator and primary explosive The other end of the tube was sealed with a thin aluminum plate in which was centered a l-cm-diam aperture A quartz window could be placed over this aperture, as shown, or could be omitted The Light source was directed toward the bunker window via an aluminized front-surface turning mirror shown in Fig 4 In this arrangement no fragments from the explosion reached the bunker window The one or two detectors used for these tests were located just inside the bunker window and were pointed directly toward the source The centers of the bunker window and detector all lay along a common optical axis that was collinear with the source axis Each of the detectors was an ITT F-4018 biplanar photodiode having an S-5 response, giving the detector good sensitivity between 200 and 500 nm These detectors have a linear dynamic range of nine orders of magnitude Although not required for this experiment, the response times of the detectors were less than a nanosecond The recommended bias voltage of 10 kv was applied to the detector for these tests ALUMINUM PLATE WITH PUMP AND / =m AMETER pmture FILL PORT \ ;= TUBE EXPLOSIVE Fig 4 Schematic of explosive flashlamp or argon flashcharge: typically the tube is 10 cm in diameter by 30 cm in length Variations include cardboard material for the tube, no window over aperture, no planewave lens on primary explosive, different rare gas fill, and use of a turning mirror to direct output toward detectors located inside bunker window A band-pass filter centered at 280 nm was mounted onto the front of one detector The passband of the filter was 20 nm FWHM and the peak transmittance was 17% The 2 5-cm-diam filter was larger than the 2 l-cm effective diameter of the detector Light leakage around the filter was reduced by securing the filter in the detector housing by means of a snug fitting O-ring The detector for the visible measurements was similarly equipped with a band-pass filter having a peak transmittance of 60% at 520 nm and a 9-rim FWHM 2 Experiment preparation, For each test, the argon flash charge was positioned approximately 65 m from the bunker window It was aligned by carefully boresighting the tube toward the bunker window The radiometers were positioned inside the bunker to be pointing directly toward the aperture in the source The optical distance between the source aperture and the detector was carefully measured with a tape measure and recorded The signal cable from each detector was terminated with 50 ohms at the input to one of the oscilloscopes The bias voltage on each detector was set at precisely 10 kv These were the conditions under which the detectors had been calibrated absolutely against standard lamps 3 After the argon purge through the argon flash charge had been flowing for several minutes at 05 CFM (for flash charges using a purge fill), the shot was fired For tests using other rare 6
10 gases or a gas mixture, the dural tube was evacuated after sealing with a trapped mechanical pump, then filled to the reported pressure(s) 3 Results from Tests UV-1-6 The firs t group of tests conducted in this series were Tests UV-1-6 The sources used argon in cardboard tubes described previously Although these tests 3 have been reported, much of that description will be repeated here since it also applies to many subsequent tests The uv light pulses resulting from Tests UV-2, 3, and 4 are shown in Fig 5 UV-2 was a repeat of the conditions of UV-1 In UV-2 there was no window over the source aperture and the detonation was initiated at a point at the rear center of the charge In UV-3 a uv-grade quartz window over the aperture was added In UV-4 there was the window in addition to a plane-wave initiation of the detonation Tests UV-5 and 6 were included only for verification of the first tests 4 Analysis of pulse shapes We will first discuss the qualitative features of the pulses In the top trace of Fig 5, the large off-scale feature at the end of the pulse is due to the shock-heated argon exiting the open aperture The brightness increase over that of the first part of the pulse is due to the increase in radiating area as the plasma mno QUARTZ WINDOW AND NO PLANE-WAVE LENS I I I I I I I I 1 1 I 1 1 I I I I I I I -+ p-lop Fig 5 Signals from UV-2, 3, and WITH QUARTZ WINDOW AND NO PLANE-WAVE LENS WITH QUARTZ WINDOW AND WITH PLANE-WAVE LENS 280-nm radiometer for Tests 4 is released through the aperture The time for this event to begin agrees approximately with the known time for the shock to travel down the tube In the lower two traces of Fig 5, this large pulse did not appear because the window prevented the plasma from escaping In the top and center traces the detonation originated from a point at the rear center of the charge The shock wave traveling through the argon is therefore diverging The bump near the center of the pulse is due to convergence of the reflected wave arising when the hemispherical shock wave collides with the cardboard walls The timing of this bump agrees with the photographic observation of the Mach stem on the axis of the tube at a time of 32 ps after the trigger In the lower trace in which plane-wave initiation was used, there is a much smaller center bump It is caused by convergence of the wall waves discussed above in Sec 11A This pulse has an almost constant brightness over the first 28 ps, after which time it linearly decays, then abruptly terminates In these sources, the light emission begins when the detonation wave exits the explosive material and enters the gas The abrupt termination of the pulse occurs when the shock wave reaches the window The small increase in intensity at the very end of the pulse is due to the higher temper+ure the gas reaches within the reflected shock In each test the distance between the inside face of the explosive and the aperture plate was 305 cm In the center trace the pulse length is 48 ps and in the lower trace 41,US These values correspond to average shock velocities in the two cases of 66 and 74 mm/ps, respectively Using the signals shown in Fig 5, the brightness temperature and a number of other radiometric quantities may be determined This is possible because the detector and its filter were calibrated absolutely using a standard deuterium source The process of determining the temperature of the source, as well as the calibration procedure, is described in Ref 3 The peak temperature or temperature of the source refers to the peak at the leading edge of the pulse For UV-2, 3, and 4 shown in Fig 5, the temperatures are 27 kk, 27 kk, and 31 kk, 7
11 respectively The higher temperature for UV-4 is not understood and should not be ascribable to the use of plane-wave lens initiation of the primary explosive (although other features of the signals can be) The UV-2 and 3 temperatures are in good agreement with those obtained from subsequent similar tests The decrease in emission after the initial peak is typical, reflecting the deceleration of the wave with time as discussed above In Tests UV-17, 18 the effects of different tube materials were compared, and the emission was recorded by a A = 280-nm and a A = 520-nm radiometer One tube was cardboard and the other dural, each having dimensions used before A plane-wave lens was used in each case The resulting signals are shown in Fig 6 At each wavelength the amplitudes for the two tests are nearly equal, indicating peak temperatures of 22 kk at A = 280 pm and 23 kk at A = 520 pm The agreement between the temperatures for the two wavelengths suggests that in this spectral region the source is emitting as a blackbody Note that in the case of the dural tube the pulse length is somewhat shorter, indicating a higher average shock velocity than in the cardboard tube In UV-20, 21 the effect of fill pressure on the performance of the argon flash charge is studied Using dural tubes, the argon pressures are 66 psia and 11 psia (local atmospheric pressure) The resulting signals are the top two in Fig i CAROBOARO TUBE P=ll PSIA ALUMINUM TUBE P=ll PSIA Fig 6 (The higher pulse amplitude for A = mv lops 2 mv 10 ps ) I 1 1 I I I I I I 1 r I I I I I I I I c mm r u A = 280 nm A=520nm Signals from 280-nm (left) and 520-nm (right) radiometers for Tests UV- 17,18 ARGON AT 66 PSIA ARGON AT 580 torr ARGON AT 570 torr WITH C3F71 AT 10 torr 10mV I- IIIIIIIIIIJ lops n ~=270nm -l 2mV m lops 1 I I 1 I I I 1 I 1 ; M)t=520nm Fig 7 Signals from both uv and visible radiometers for Tests UV-20, 21, and 22 Effects of argon pressure change are examined in upper two sets Lower two address effect of molecular species (having a large specific heat) added to argon compared to that in Fig 6 is due to replacing the front-surface aluminized turning mirror having an SiO overcoat with one without the overcoat for greater reflectivity in the ultraviolet ) The peak temperatures for the higher pressure case are T=26kKat A=280nmand T =23kKat A= 520 nm For the atmospheric pressure test, T = 24 kk at A=280nmand T=22 kkat A=520nm The greater pulse droop at the higher pressure is due to the expected larger deceleration of the shock wave through the medium of greater density The longer pulse length also suggests a greater deceleration UV-21, 22 compare flash-charge emission with and without an admixed molecular species, C3F71 These signals are the lower two in Fig 7 A broad absorption band in C3F71 centered at A = 270 nm absorbs most of the emission detected by the uv radiometer at early times However, as the emitting shock wave nears the end of the tube the optical density becomes small enough to allow penetration of the pulse tail The A = 520 nm emission, not absorbed by the additive, indicates a, 8
12 Test peak temperature of 22 kk No cooling of the shock wave by -2% molecular species occurs In UV-25, 27 this comparison is repeated with 50-torr The reduction in temperature was from C3F71 T = 23 kk to 22 kk for A = 520 nm We must conclude that -10% C3F71 does not reduce the shock front temperature However, the resulting heavier mixture was manifested in a longer pulse and a greater pulse droop, as discussed before The results with argon flash charges are summarized in Table 1 Averaging these data with two later argon shots discussed below indicates that the peak temperature of these sources is 25 flkkat A=280nm and 23tlkK ata= 520 nm These temperatures correspond to the initial shock velqcity of 9 mm/ps After this series was concluded, the radiometers were calibrated once again against the same standard lamps There were no changes in the calibration factors A modest effort was devoted to obtaining time-resolved spectra of argon flash charges A 4 rotating-mirror ultraviolet spectrograph, Los Alamos National Laboratory Model 40, was used One of the resulting records is shown in Fig 8 The spectral coverage is nm The top edge, near the Hg lamp spectrum, corresponds to the time the shock wave from the explosive entered the argon, and the lower edge is about 30 IJS later The absence of exposure at the ultraviolet end of the spectrum is probably the result of the lack of film sensitivity in that region The apparent lowered exposure near the green end is probably caused by the reduced efficiency of the diffraction grating, which is blazed for the near ultraviolet The three broad absorption features Number ANGON FL4SH TABLE I CSANGE SUMASY Argon Pressure Measured Temperature psia Added Gas A=280um A=520nm 11 none 27 I& 11 none none none none none 22 23ks none :: none none == C3F71 22 are thought to be high vibrational level Shumann - Runge bands of 02, showing absorption in the air between the flash charge and the spectrograph There may be some absorption by ozone below 290 nm There are several sharp absorption lines between 420 and 450 nm that have not been even tentatively identified These results, although the experiments done so far have shown only that it is possible to obtain spectra, show that corrections for absorption of some of the radiation by air between the shock source and the detector may be needed, and that the molecules responsible for the absorption can probably be identified 5 Results from Tests Using Other Noble - Gases Using flash charge set-ups similar to those described above, we have used the uv and visible radiometers to measure the temperature of shockwave fronts in neon, krypton, and xenon For comparison purposes, argon was included in this series Gases used in these tests were analyzed for impurities 5 For this purpose, a gas sample was taken directly from the gas cylinder and also drawn from the dural flash-charge cell after it was filled Only tbe A = 280 run radiometer was used for this series The light pulses obtained are shown in Fig 9 Two different tests were performed for each noble gas, which was drawn from separate cylinders where possible Helium was not included, because previous tests in other programs have shown that it yields very little light emission Data from these tests are summarized in Table 11 In comparing the performances of flash charges with fills of different noble gases, the variation of peak temperature is most apparent Shocks through the heavier noble gases resulted in higher peak temperatures The average shock wave velocity through the tube is lower for the heavier gases, but the specific heat is much smaller, and the peak temperature is approximately proportional to the square root of the atomic mass The time required for the light to reach full intensity near the first of the pulse is longer for lighter gases, a feature particularly noticeable for the case of neon in Fig 9 The lower temperatures in the lighter gases, and the energy of the first excited state, combine to make the opacity of shocked gas depend strongly on the atomic weight 9
13 SPEC1 ARGON FLASHCHARCE, o-3ops Fig 8 Time-resolved spectrogram of argon flash-charge emission Spectral coverage is 2S0-500 nm with Hg atomic lines included at top Time covered is 0- to 30-IJs portion of light output 10
14 UV PULSES FROM RARE GAS FIASH CHARGES nm h= 280 1,,,,, I I,,,, t I,, J XENON XRYPTON 5 mv ARGON lops D5 mv lops NEON ORDINATE: Li=lkW-cm-2-sr- -rim PER LARGE DIVISION Fig 9 Ultraviolet signals from flash charges containing xenon, krypton, argon, and neon w R re G s Al- At xc K Ne Ne Kc x SASS-GAS Peak Tempera turea 25 kx TABLE 11 FLASK-CNARGE SLMUARY Cylinder Gas Purity 99 7% 980% 99 6% 999% b b 994X Pur, ty of Gas From Shot 998X 983% 996% 890% 999% 993% 992% A = 280 fun, b These samples from same cylinder as first test with this gas have less kinetic energy Two of the experiments had the explosive initiated at one end of the long cylinder, and one experiment had the cylinder initiated along its central axis The first experiment was done because it was a small addition to an experiment being done for another purpose The original experiment had a cylinder of explosive, initiated at one end, arranged along the axis of a much larger steel tube The purpose of it was to study the motion of the tube For our purposes, we closed the tube with a glass sheet and changed the gas from air to argon, with no deleterious effect on the results for the tube motion study A diagram of the experimental arrangement is shown in Fig 10 The explosive was PBX-9501, a plastic-bonded HMX composition with density 184 g/cm3, detonation pressure about 36 GPa, and detonation velocity 878 mm/ps The cylinder was made up of 11 segments, each 508 mm diameter and 544 mm long, for a total length of 5985 mm The segments were glued together with careful alignment to make a / Explosive - Argon III EXPERIMENTS ON CYLINDRICAL SHOCK WAVES Measurements have been made on shock waves in argon gas driven by radial expansions from cylindrical explosions The first subsection will discuss the apparatus and phenomenology of these tests The second subsection will address the radiant emission from the cylindrical shock fronts A Argon Shock Waves Driven by Radial Expansion of Cylindrical Explosive Charges Three experiments have been done to obtain information about argon shock waves driven by c ylkzdrical explosive charges The expanding gases from a solid cylinder of explosive transfer a larger fraction of the explosive energy to the argon than plane-wave systems do, because in the cylindrical configuration the dense explosive gases ) 648 mm i L, \ Steel Seal Table ~ Detonator Fig 10 Diagram of the shot assembly with a cylinder of explosive in a steel cylinder The explosive is assembled from segments, each 508 mm dia and 544 mm long; the joints cause perturbation in the flow 11
15 uniform cylinder The steel cylinder was 635 mm thick, and was 648 mm inside diameter and 1524 mm long It was set on end on the ground, and a table about 900 mm tall was set inside it to hold the explosive A glass sheet was placed on the top of the steel cylinder The table was fitted with rubber to seal it to the cylinder The explosive was aligned on the axis of the cylinder, and the top end of the explosive was about 25 mm from the glass plate A square-shaped large mirror, 600 mm on a side, was placed above the glass at 45 to reflect light from the shock wave to the cameras The initiator and cabling came UP through the table Argon was flowed through the closed upper section of the tube at a rate of 12 cfm for 40 minutes to replace all the air with argon, forcing it out between the top flange and the glass sheet The flow was maintained through the detonation time The light from the conical shock wave in the argon gas was reflected from the overhead mirror to the bunker and through a beamsplitter to two separate image-intensifier cameras One camera photographed the shock at 6002 ps after detonation, and the other at 6999 ps The later photograph is shown in Fig 11 The print was made to accentuate brightness differences, and the light is dimmer at the edges where the shock becomes weaker The print also shows poorly defined rings; these arise from the slight imperfections where the segments of the explosive cylinder are joined The presence of the rings allows some analysis of the photograph, because they allow for tracking those points From earlier work (particularly shot number C-3159), it was known that the argon shock made an angle of about 42 with the cylinder axis, and that the marked points moved out on a line making an angle of about 55 with the axis The points measured from both photographs are shown in Fig 12 The times that the pictures were taken, and the known detonation velocity, give the position of the detonation wave The limit of luminosity at the outer edge of the shock gives an approximate position for the shock near the initiation end of the charge These data give reasonable agreement with expectations, and show that even slow and weak shocks are still bright enough to be useful The uniformity of the 12 image-intensifier tubes is not good enough for quantitative brightness measurement without careful calibration, and it is not attempted with these data The initial shock velocity found here is 585 mm/ps, from U = D sin 8, where U is the shock velocity, D = 875 mm/ps is the detonation velocity in a 50-mm cylinder, and e is the angle the shock makes with the axis The second experiment was similar to the first, but it was done especially to measure the shock brightness and velocity The camera view was from the side instead of from the top, so the real shape of the shock could be recorded There were two shots, UV-15 (C-5082) and UV-16 (C-5083), and two image-intensifier photographs are taken of each, so there are four records, and each record has two sides The container for the argon was a plywood box, constructed in the shape of a cube approximately 600 mm on a side, with a glass window in one side In addition to the camera records, the box had holes to allow ultraviolet light to reach detectors; these results are described separately Photographs were taken at 500 and 700 ps after detonation One of the later photographs is shown in Fig 13 The angle of the shock wave to the cylinder axis was measured along both sides of the picture in all the pictures The shock shape is nearly steady (unchanging in time) for all but the outermost parts, and velocities can be obtained from the angles by using the steady detonation velocity (along the explosive stick), which is 875 mm/ps, in the equation U = D sin 6 The results are given in Table III The distance in this table is the position behind the detonation front By invoking the steady flow assumption, distance can be converted to time, and the velocity at that time used with the intensity vs time record from the stationary ultraviolet detector positioned on the centerline The flow in the outermost parts is not steady, because it is driven by the first segment which has no explosive behind it (Fig 12), and the scattering of readable points in the table shows where it deviates The results are plotted in Fig 14, where it is easy to see how the points from the non stead y flow leave the smooth curve The steady part is given by the least-squares fit U = 1138 exp(-t/620) t

16 , Fig 11 Photograph of the light from the shock wave in argon driven by a cylinder of explosive initiated at one end The rings in the wave are produced by the small perturbations from the joints of the explosive segments Shot No C-5045-B 13
17 600 n Integration gives L- = 7056[1 -exp(-t/620)] t t : L o mm Fig 12 Shock positions found by analysis of the photographs Experimental points are measured positions of the perturbation rings seen- in the shock wave From other experiments done earlier, the shock angle was known to be about 42 initially, and the particle motion was known to make an angle of about 55 with the axis The third experiment, UV-23, was similar to the first and second, but with an important difference The cylinder of explosive was initiated along its axis, simultaneously, rather than from one end The detonation wave propagated outward from the axis, and drove the argon gas in the direction of its own motion This higher initial velocity instead of being cone cylindrical Simultaneous axial arrangement gives a much to the argon shock, and, shaped, the shock wave is initiation was obtained using a line-wave generator, diagrmnmed in Fig 15 The explosive is an extrudable composition that is cured after extrusion so it becomes a stable, rubbery solid It is held in a plastic form that has the spaces for the explosive tracks It works because the detonation runs the same distance in each track, and thus arrives at the end, the line, at the same time at each point Two line-wave generators were inserted into a groove cut into the axis of the explosive cylinder The line-wave generators stick out of the cylinder, and therefore the shock wave is not a complete cy~der We believe that the presence of the remains of the lfnewave generators does not seriously perturb the remainder of the shock wave TABLE III Distance ~ ARGON SHOCKVELOCITIES Time Velocities - (mni/ps) Average I!Ew!Q ,
18 Fig 13 Side view of light from the shock wave in argon driven by a cylinder of explosive initiated at one end The perturbations caused by the joints in the charge are visible, but it can be seen at the edges that they cause almost no variation in the shock shape The regular cross hatching is caused by the structure of the fiber-optics output plate of the camera tube Shot No C-5083-D Test UV-16 15
19 10 I I I I I Trocks of extrudoble explosive Plastic \ body 9 8 z +7 E E 1 \ \ P 7 hitioting track Thin cover I [ 1, I I o [ t (/ls) Fig 14 Plot of shock velocity vs time for the second and third experiments The lower curve is for the end-initiated second experiment The points depart from a smooth curve where the flow has not yet become steady There are two parts to it because there were photographs taken at two times The upper curve is for the axially initiated third experiment The outward-directed detonation wave gives a high initial shock velocity Two image-intensifier cameras were used to view the cylindrical shock wave, with a beamsplitter sending light from the same lens to each intensifier A photograph taken at 1674 MS after the detonation reached the surface of the explosive is shown in Fig 16 The perturbation on the left in the picture was caused by the joint between the two line-wave generators The additional perturbations in the right half arise from the early shocking of some of the explosive through the thin cover of the line-wave generators These have been removed in later assemblies by adding a brass cover to the line-wave generator The perturbation from tie interaction of the two line-wave generators remains The picture is printed at high contrast, so the perturbations are enhanced The other image-intensifier camera was pulsed four times, Fig 15 giving a t \ Lineof ini+iotion Explosive cylinder along cylinder oxis Diagram of a line-wave generator, and end view of the axially initiated explosive charge The line-wave generator is initiated at one point, and the detonation wave in the tracks of extrudable explosive runs the same distance in every track The explosive is contained in the thick plastic form, and has only a thin cover over it multiple exposure of the shock wave The photograph is shown in Fig 17 The times of the exposures were 223 ps, 723 ps, 1420 ps, and 3023 ps after the detonation Wave reached the explosive surface The time that the detonation wave reached the surface was detected by electrical switches on the surface; these also served to check that the wave reached the surface points nearly simultaneously In addition to the camera records, the experiment also used photodetectors The intensity rise at the instant the wave reached the wall of the box and reflected showed in the oscilloscope traces, and gave the time of that event In all, then, there are five time-distance pairs from the photographs, one from the explosive surface switches, and one from the photodetectors The values are given in Table IV These data are well represented by the least-squares fit r = 8322[1 - exp(-t/277)] t t2 16

20 I - -: r=-: -, i&,-,, ~ 1 9-**4, 4, ~ 1 - i, - s -,O,wm [- 7 * + -0 **,- - *S L- +-, **@lwd 8 #; 1 1 Fig 16 Photograph of a cylindrically expanding shock wave The perturbation on the left is caused by the interaction between the two line-wave generators These extra ones on the right are caused by the shock transmitted through the thin plastic cover of the line-wave generator by the extrudable explosive Shot No C-5101-B Test UV-23
21 TAME IV DISTANCE-TIUS VALUSS FOR THS AXIALLY INITIATED CYLINDSS & A_ talc (Cdw) 1018 This fit can be differentiated to get the velocity as U = 350 exp(-t/2377) t The calculated values are also listed in the table The form used for these fits was chosen by trial and error, and has no physical basis The initial velocity seems too high, and reflects the difficulty of fitting where the curve is very steep The velocity behavior is the upper curve in Fig 14 The curve of velocity vs time for the axially initiated explosive lies above the curve for endinitiated explosive The shock wave is much stronger, initially, when the shock is driven in the direction the detonation was going At late times, the curves would probably cross if the endinitiated explosive cylinder were long enough to be steady at those times This is because the strong shock leaves more energy in the gas behind the radiating shock front, as it has been at a higher temperature and, even though it has expanded, it is still at a higher temperature Although it is well known that the expansion of gases from a cylinder forms additional shocks behind the main shock, these data do not show their presence The photodetector data are also almost smooth, with only faint indications of any accelerations of the front Apparently the extra shocks have little effect The smooth fits given here seem to be adequate When the distance-time fits given here are used to calculate the radiating area, one must remember that the radial distance for them was measured from the explosive surface The real radius is obtained by adding the radius of the explosive stick, 254 mm, to the distances given by the fit B Ultraviolet and Visible Emission from RadiaLly Expanding Shock Waves in Argon The previous subsection has described nonradiometric measurements made on radially expanding shocks in argon In the latter three of these tests, radiometers previously described were used to measure the temperature of the shock fronts In tests UV-15, 16 the end-initiated stick of HE and the resulting shock shown in Fig 13 were observed by 280-nm radiometers through two holes bored in one wall of the plywood enclosure These holes were at the appropriate height in the box wall such that the detectors viewed into the box near the midplane of the vertical explosive One detector viewed through its hole at normal incidence to the surface of the HE cylinder The other view line was paratlel to this one but offset 18 cm horizontally from the first That is, it observed the radial shock expansion obliquely The two signals from Test UV- 16 are shown in Fig 18 These traces began 200 ps after the trigger pulse to the detonator The detector having the normal view of the HE stick shows the time required for the detonation wave to reach the height of the detector s field of view on the stick The detector having the oblique view begins seeing light later because the shock front must also travel out ward from the stick before reaching its field of view [The normal and oblique are used for brevity; the normal view is colinear with a radial component of the expanding front Since the front is conical over much of its area, the normal detector line of sight is at a vertical angle (-35 ) to the shock front The oblique detector is also at this vertical angle in addition to viewing obliquely to the radial component] The slow upward ramp at early times in the normal view results from light scattered onto the detector from various parts of the box The large bump on the tail of the other signal is due to the explosive fireball entering the field of view of this detector We have determined the temperatures observed by each detector during each test The temperature changes with time during the test as shown in Fig 18, so we have shown two temperatures for each light pulse The temperatures are shown in 18

22 Fig 17 Multiple-exposure photograph of the cylindrically expanding shock wave These four superimposed photographs give the wave position at four precisely known times Shot No C-5101-D Test UV-23
23 2 mv lops TAMS V RADIAL-SHOCKT2HPERA27MSSAT VAR1OIIST1tiWi NORMAL VIEW ~ ~ Time+, IIS Tem erauce, K IN-15 Normal 48 18,500 i ,600 t ,000 : 1700 G Oblique 76 14,700 i zoo 98 12,100 f 200 I I w-16 No ,500 i ,800 i ,200 s 1300 Oblique 70 14,300 i 200 OBLIQUE VIEW 94 10,8FXI t 200 * Tme elapsed betwma trisger pulse t detonator and ceadins of radimewr,8 1 Fig 18 Radiometer signals from Test UV-16 at A-280 nm Table V, where time begins at the detonator trigger (Remember that for UV - 16, shown in Fig 18, there is a 20-ps delay) The first time listed for the normal incidence view corresponds to the peak of this light pulse, while the second time refers to the peak of the oblique-view detector This time entry and the last one permit a comparison between the two views at the same time These latter two times are 4 ps earlier for UV-16 than for UV- 15, apparently because of a small difference in the hole separations in the two enclosures Table V shows good agreement between the two tests for similar positions on the light pulses The larger uncertainties for the later time entries for the normal-view detector are due to the uncertainty in the baseline position as discussed above The temperatures recorded here are less than the 25-kK values for planar geometries because the shock velocity is considerably less in this endinitiated, radially expanding conf igu ration In this case the initial shock velocity was measured to be 6 mm/ps compared with 9 mm/ps in the planar case (with argon) Azimuthal symmetry, shown to appiy to these shocks in Fig 11, suggests that for times at which both detectors see the shock front, the measured temperatures should be equal Table V shows that this is not the case The 2,000- to 3, 000-K lesser temperature for the oblique view may be due to the longer argon pathlength or a wall interaction layer for that detector If the shock is emitting as a perfect blackbody, the radiance, and therefore temperature, should be independent of the angle of incidence at which the detector views the shock front In Test UV-23 the explosive charge and enclosure were similar to those just described However, the cylindrical explosive was simultaneously initiated along its axis resulting in a shock front of cylindrical shape Radiometers calibrated at A = 280 nm and A = 520 nm monitored the expanding shock normal to its surface The resulting signals are shown in Fig 19 From these radiometer signals we can determine the shock front temperature at various times during its travel to the enclosure walls These data may be combined with the velocity values from Table IV for a plot of brightness temperature vs shock velocity shown in Fig 20 Temperatures corresponding to faster motion of the shock exhibit good agreement between the two wavelengths and to the similar temperatures measured for the 9-mm/ps shocks in planar argon shocks The increasing discrepancy between the measurements at the two wavelengths with decreasing shock velocity is puzzling and unexpected It is reasonable to speculate that, because of the time sequence of the points in Fig 20, the faster reduction in the uv temperature with shock velocity, 20
24 , 10mV RADIATION FROM CYLINDRICAL SHOT LWG INITIATION 2 +x30 LONG 9501 IN 2 CUBICAL BOX A= 280 nm TB = 25,000 Fig 20 K lops Radiometer signals from Test UV-23 0~=520nm O TEST UV -23 ~zsonm Cl 8 no huv-15,16 0 o 2mV lops m I I ! t 1 I J X=520nm TB = 26,000 at A = 280 and c1 44s (mm/@) K 520 nm 1 Dependence of the brightness temperature on the shock velocity for a cylindrically expanding shock wave in argon gas With the exception of point marked otherwise, the data are from different times of expansion in Test UV-23 See Table IV and Fig 19 may be due to a light-induced absorption process occurring between the shock wave and the detector Since there was no window over the enclosure aperture through which the source was observed, vacuum ultraviolet radiation may have created absorbing species (e g, excited oxygen or ozone) in the air path Further examination of the radiating properties of the expanding shock front is instructive In Table VI the shock radius, area, and measured temperature are tabulated for various times, along with the total radiant emittance (ot4), the spectral emittance for A = 280 nm, and these latter two quantities integrated over the shock front area Since the length of explosive was 30 cm, this value was used in computing the radiating area While Fig 16 shows that in this test many disturbances reduce the effective shock area, we are assuming that more sophisticated initiation techniques would eliminate these cooler regions and allow uniform emission from the full cylindrical surface Since the temperature drops as the shock expands, both M and MA must fall SISO However, the total radiated power from the total shock surface rises as the shock expands up through at least t = 30 ps The spectral emittance at A = 280 nm rises even faster and continues to do so through at least 50 ps where it apparently is close to peaking An approximate time integration over the pulse of Fig 19 shows a total radiated energy of this source to be - 2 x 10⁵ J during the first 50 ps The explosive energy release from this quantity of 9501 high explosive is known to be 5 x 10⁶ J The radiation yield is then 4% The yield into specified bands within the radiation spectrum can be similarly determined The greater mechanical coupling of the explosive energy to heavier gases indicates that a significantly greater efficiency would be realized The data of Table II combined 4 with the UT relationship for a blackbody radiator suggests that a radiation yield of 16%%is expected for a cylindrical shock wave in Xe
25 TABLE VI SAOIOtlETRIC PROPERTIES OF CYLISORICAL SMOCK SVSFACE UV-23 A=, Cmz H = UT&b %= A6=4 A~HA 2nr~2 ~ Ma ye w -CM-2 w-cm-z-m-l w w-rim- o x x x OX1O x X X X I 53X x XI09 587x XI X x109 S45X X x x x106 Temperature measured by A = 520 radiometer b ToL1 radi md power per square centimeter, emittance, Of shock surface c spectral mit Lance at A = 280 nm Iv DISCUSSION AND COMPARISON WITH OTHER RESULTS Optical radiation from shock fronts has been investigated both experimentally and theoretically for several decades Zel dovich and Raizer in their textbook6 discuss this subject in some detail, with particular emphasis on shock waves in air Of interest here is that for shock waves of the strength used in our studies the front radiates as a blackbody They also treat in detail the phenomenon of the preheating layer This layer lies in front of the radiating shock front and attenuates the light on its path to the detection system Hard ultraviolet radiation, from sufficiently hot shock fronts, induces opacity in the otherwise cold gas through photoionization, photoexcitation, and photochemistry in this layer Screening of the shock front from the detectors therefore occurs, whose magnitude increases strongly with shock velocity and which depends also upon the gas and wavelength being observed For example, in air strong screening occurs for shock temperatures in 6 excess of 90,000 K, beyond which the optically measured brightness temperature is substantially less than the true temperature behind the front It is well known that the absorption of oxygen begins at 186 nm and extends downward into the harder ultraviolet For the brightness temperatures of -25 kk measured in our experiments, the emission peak of the corresponding blackbody radiation occurs at a A = 116 nm At this wavelength 6 is -1 ~ cm- 1 the absorption coefficient of air For experiments conducted here without a window over the source aperture, light-induced phenomena in the air path are expected This is the likely source of absorption bands observed in the timeresolved spectra reported in Section II Zatsepin et al 7 have measured the luminescence of shock f rents in air, argon, and xenon over a large range of shock velocities Brightness of the fronts was observed at 330, 430, and 560 nm and at angles of incidence to the shock front of 90 and 45 One important result from this work was that at higher velocities the normalincidence radiation usually indicated a significantly higher temperature than the 45 radiation In this respect, our results of Table V are consistent with theirs They ascribe this behavior to the greater pathlength through the absorbing preheating layer for the oblique path According to their results at lower velocities, however, the opacity of the preheating layer should be insufficient to affect this difference at our velocities However, they do point out that for longer light pulses the screening layer can be more absorbing The duration of our light pulses appears to be much longer than theirs, so a screening layer could, have been responsible for the temperature differences in Table V Available data for shock waves in argon are plotted in Fig 21 The ultraviolet points from Ref 7 are shown along with Soviet theoretical predictions Also included are data points from 8 this work and theoretical curves of Kerley A single data point from each of the works of Zinn et 1 10 al, Model, 9 and Kiselev and Krokhin is also 22
26 34 I +, Fig 21 plotted 32 2e : / - KERLEY THEORY SOVIET THEORY i, z S 24, A I a / I i /7, Ae,l 4 : I I 1 AI It A UV,VISIBLE, CONGER,of al A w, CURRESULTS UV ZATSEPIN,OI al Cl GREEN,OUR OATA teeen, RED, MODEL ZINN ot d O BLUE, KISELEV and KROKHIN SIUJf, ROTH o U: (km/s) Measured and theoretical brightness temperatures of shock fronts in argon gas as a function of shock velocity Our points are from cylindrical expansions (UV-23), except for those poizits with error bars that represent averages of planar shock results The experimental points from Zatsepin et al are in excellent agreement with Soviet equation-of-state theory up to shock velocities of 14 km/see, where subsequent departure from theory is attributed to the screening layer Our ultraviolet data are in very good agreement with Soviet theory Our 520-nm data show substantial departure from the Soviet curve in Fig 21 We do not know why our 520-nm points are above the curve for the cylindrical tests and below it for the average of planar shocks For both visible and UV, our data indicate a fall-off from the trend for the higher velocities Zatsepin et al do not observe this fall-off until velocities of 15 km/see are reached The data point from Model in Fig 21 represents a large departure from theory In Fig 22 available brightness temperature data for xenon are shown along with theoretical curves Most of the points are from Zatsepin et al recorded at A = 430 nm One point each from our work and from Model is included It is thought that the screening layer is responsible for 7 most of the points lying below the curve Again, however, our results agree rather well with those L U, (km/s) Fig 22 Measured and theoretical brightness temperatures of shock front in xenon gas as a function of shock velocity Our datum is from planar shock wave studies from Ref 7 8 Kerley s theory M in excellent agreement with our results He also computed temperatures for argon at PO = 0006 gin/cc density (-46 local atmospheres), obtaining -10% higher temperatures near 9 mm/ps shock velocities than at 1 atm This result also agrees with our data, shown in Fig 7 Other rare gases have been investigated, but less extensively Model reportsg a temperature of 34 kk for a 172 -km/see shock wave in krypton Rothll measured 38 kk for a velocity of 83 km/see, somewhat higher than our value 12 of 30 kk Tsikufi and POPOV report a temperature of 32 kk at A = 280 nm and at a velocity of 8-9 km/see Our value, obtained at that wavelength and similar shock velocity, is in good agreement with this result For neon, also, the measurements of Tsikulizz 12 and Popov are in very good agreement with our results, shown in Table II In Section II, we reported measurements showing that 10% C3F71 added to argon gas did not affect significantly the brightness temperature of a shock through the mixture We were somewhat surprised that the molecular species, having a large specific heat, did not cool the gas, or alternatively affect the preheating layer 23
27 Zatsepin et al 7 observed that a 5%, air admixture to argon greatly reduced the brightness temperature of the shock front at velocities above 10 mm/ ps energy radiated according to a blackbody calculation was 2 x 10⁵ J for an explosive energy to optical energy yield of 4% Greater efficiencies using xenon can be expected v SUMMARY AND CONCLUSIONS High explosives have been used to shock-heat rare gases to measured brightness temperatures Up to 36,000 K The area of the radiating shock fronts was large in both the planar and cylindrical geometries used Close agreement between temperatures measured at both ultraviolet and visible wavelengths indicates that the sources are blackbody radiators The continuous nature of the emission spectrum of the shockfront supports this conclusion The planar shocks reported here had radiating areas of 75 cm2 Shock waves through argon gas were studied extensively At a local one atmosphere the temperature measured for the emission from an argon shock at its peak velocity of 9 mm/ps was 25 kk At six times this pressure, the measured temperature was approximately 10% higher Up to 50 torr of a rather large molecule, C3F71, did not affect the temperature of the shock for 1 atm argon Substitution of other rare gases into the shock tube resulted in some measured emission signals that are proportional to the square root of the atomic weights For Xe a peak temperature of 36 kk was measured In radially expanding shock waves, stable large-area fronts in argon were observed The temperatures and profiles of shock fronts were measured using two initiation schemes Temperature and velocity as a function of time were determined and compared with results of other research For the axially initiated explosive, a cylindrical shock wave having an area beginning at 480 cm2 and expanding to 5500 cm2 was studied During this expansion, the temperature fell from 26 kk to 19 kk, but the area-integrated radiation from the front continued to rise over the full 50-ps observation time The total optical REFERENCES J Zinn, W C Davis, T R Schwartz, R C Anderson, and W D Gould, Theoretical and Experimental Studies of Strong Shock Waves in Air, Proceedings of the DNA Atmospheric Effects Symposium, San Diego, April 1973 R G Shreffler and R H Christian, Boundary Disturbances in High-Explosive Shock Tubes, J Appl Phys ~, (1954) The calibration procedure for the 280-nm detector is described in Internal Memorandum AP-2-80:240 The 520-nm radiometer was calibrated in a similar fashion against a quartzhalogen standard lamp B Brixner, Rotating-Mirror Sweeping-Image Spectrograph, Rev Sci Instr ~, ( 1967) E D Loughran, WX-2, used a mass spectrometer to quantitatively analyze samples obtained from each flash charge just prior to firing the shot Ya B Zel dovich and Yu P Raizer, Physics of Shockwaves and High-Temperature Hydrodynamic Phenomena (Academic Press, New York, 1966) Y A Zatsepin, E G Popov, and M A Tsikulin, Luminance of Shock Wave Fronts in Certain Gases, Sov Phys JETP ~,63-66 (1968) G Kerley, X-7, Unpublished Los Alamos Results ( 1982) He used ionization equilibrium theory described in LA Sh Model, Measurement of High Temperatures in Strong Shock Waves in Gases, Sov Phys JETP ~, (1957) Yu N Kuselev and V Z Krokhin, Measurement of Radiation from Strong Shock Waves in Gases Using Low-inertia Pyroelectric Detectors, Translated from Fiz Goreniya i Vzryva Q, (1976) J Roth, Measured Temperatures of Strong Shock Waves in Argon, J Appl Phys ~, ( 1964) M A Tsikulin and Ye G Popovj Radiating Properties of Shock Waves in Gases (Nauka, Novosibirsk, 1977) 24
28 Primed in Ihe UniM Slates of A -, Available fmm Nuiwml Teehmcd Information Savti US Depwtmcnt of Commcme 526S Poft Royal Rood Spnn~ekL VA Micmfxhe IAOI) W-N Pace Rsnse Pri= Code NTIS Page Range Wet Code NTIS Page Rm~e Prlu Code A A03 05 I 07s A IW AOS ACM A s AOS AW ml Ln AIO 2262S S1 27$ A A13 JOI 125 A S0 AIS A16 3?6 400 A17 Jol423 A18 4:6450 A A A21 SO1525 A22 S26-SS0 A2S S31S7S A24 S76600 A23 60 I up AW Con!~c! NTIS for ~ wcc quote
29
EXPLOSIVE-DRIVEN SHOCK WAVES IN ARGON
 EXPLOSIVE-DRIVEN SHOCK WAVES IN ARGON W. C. Davis, T. R. Salyer, S. I. Jackson, and T. D. Aslam Los Alamos National Laboratory Los Alamos, New Mexico 87545 Revision 6/30/2006 Abstract. Strong shock waves
Experiment 3 1. The Michelson Interferometer and the He- Ne Laser Physics 2150 Experiment No. 3 University of Colorado
 Experiment 3 1 Introduction The Michelson Interferometer and the He- Ne Laser Physics 2150 Experiment No. 3 University of Colorado The Michelson interferometer is one example of an optical interferometer.
Atomic Emission Spectra
 Atomic Emission Spectra Objectives The objectives of this laboratory are as follows: To build and calibrate a simple meter-stick spectroscope that is capable of measuring wavelengths of visible light.
Practical 1P4 Energy Levels and Band Gaps
 Practical 1P4 Energy Levels and Band Gaps What you should learn from this practical Science This practical illustrates some of the points from the lecture course on Elementary Quantum Mechanics and Bonding
Practical 1P4 Energy Levels and Band Gaps
 Practical 1P4 Energy Levels and Band Gaps What you should learn from this practical Science This practical illustrates some of the points from the lecture course on Elementary Quantum Mechanics and Bonding
high energy state for the electron in the atom low energy state for the electron in the atom
 Atomic Spectra Objectives The objectives of this experiment are to: 1) Build and calibrate a simple spectroscope capable of measuring wavelengths of visible light. 2) Measure several wavelengths of light
Name: Partner(s): 1102 or 3311: Desk # Date: Spectroscopy Part I
: 1102 or 3311: Desk # Date: Spectroscopy Part I") Name: Partner(s): 1102 or 3311: Desk # Date: Spectroscopy Part I Purpose Investigate Kirchhoff s Laws for continuous, emission and absorption spectra Analyze the solar spectrum and identify unknown lines
Name: Partner(s): 1102 or 3311: Desk # Date: Spectroscopy Part I Purpose Investigate Kirchhoff s Laws for continuous, emission and absorption spectra Analyze the solar spectrum and identify unknown lines
Exam 2. Study Question. Conclusion. Question. Question. study question continued
 PS 110A-Hatch-Exam 2 Review - 1 Exam 2 Take exam in Grant Bldg. starting Friday, 13 th, through Monday, 16 th (by 4:00 pm). No late fee associated with Monday, before 4:00. Allow at least 1 hour for exam.
APAS Laboratory { PAGE } Spectroscopy SPECTROSCOPY
 SPECTROSCOPY SYNOPSIS: In this lab you will eplore different types of emission spectra, calibrate a spectrometer using the spectrum of a known element, and use your calibration to identify an unknown element.
Atomic Spectra HISTORY AND THEORY
 Atomic Spectra HISTORY AND THEORY When atoms of a gas are excited (by high voltage, for instance) they will give off light. Each element (in fact, each isotope) gives off a characteristic atomic spectrum,
Atomic Spectra. d sin θ = mλ (1)
") Atomic Spectra Objectives: To measure the wavelengths of visible light emitted by atomic hydrogen and verify that the measured wavelengths obey the empirical Rydberg formula. To observe emission spectra
Atomic Spectra Objectives: To measure the wavelengths of visible light emitted by atomic hydrogen and verify that the measured wavelengths obey the empirical Rydberg formula. To observe emission spectra
AS 101: Day Lab #2 Summer Spectroscopy
 Spectroscopy Goals To see light dispersed into its constituent colors To study how temperature, light intensity, and light color are related To see spectral lines from different elements in emission and
Telescopes (Chapter 6)
") Telescopes (Chapter 6) Based on Chapter 6 This material will be useful for understanding Chapters 7 and 10 on Our planetary system and Jovian planet systems Chapter 5 on Light will be useful for understanding
Telescopes (Chapter 6) Based on Chapter 6 This material will be useful for understanding Chapters 7 and 10 on Our planetary system and Jovian planet systems Chapter 5 on Light will be useful for understanding
Unit-2 LASER. Syllabus: Properties of lasers, types of lasers, derivation of Einstein A & B Coefficients, Working He-Ne and Ruby lasers.
 Unit-2 LASER Syllabus: Properties of lasers, types of lasers, derivation of Einstein A & B Coefficients, Working He-Ne and Ruby lasers. Page 1 LASER: The word LASER is acronym for light amplification by
X Rays must be viewed from space used for detecting exotic objects such as neutron stars and black holes also observing the Sun.
 6/25 How do we get information from the telescope? 1. Galileo drew pictures. 2. With the invention of photography, we began taking pictures of the view in the telescope. With telescopes that would rotate
What can laser light do for (or to) me?
 me?") What can laser light do for (or to) me? Phys 1020, Day 15: Questions? Refection, refraction LASERS: 14.3 Next Up: Finish lasers Cameras and optics 1 Eyes to web: Final Project Info Light travels more slowly
What can laser light do for (or to) me? Phys 1020, Day 15: Questions? Refection, refraction LASERS: 14.3 Next Up: Finish lasers Cameras and optics 1 Eyes to web: Final Project Info Light travels more slowly
Introduction to Infrared Thermometry
 TS-104 Introduction to Infrared Thermometry Fig. 1 - Blackbody Radiation Characteristics General Infrared thermometers have the ability to measure temperature without physical contact. The ability to accomplish
Burner Tubing Specification for the Turbulent Ethylene Non-Premixed Jet Flame
 Burner Tubing Specification for the Turbulent Ethylene Non-Premixed Jet Flame Figure 1 shows a schematic of the burner used to support the turbulent ethylene non-premixed jet flames. The dimensions of
Institute for Science and International Security
 Institute for Science and International Security ISIS IMAGERY BRIEF April 10, 2012 Early Satellite Image Shows Foundation for High Explosive Test Chamber at Parchin Site in Iran: What was the Chamber for?
Lab 10: Spectroscopy & the Hydrogen Atom Phy208 Fall 2008
 Lab 10: Spectroscopy & the Hydrogen Atom Phy208 Fall 2008 Name Section This sheet is the lab document your TA will use to score your lab. It is to be turned in at the end of lab. To receive full credit
Investigation of HE Driven Cylindrical Liner. Tai-Ho Tan and Stanley P. M a d
 -% LA-UR- 95-686 Title: Author(s): Investigation of HE Driven Cylindrical Liner Tai-Ho Tan and Stanley P. M a d DISCLAIMER This report was prepared as an account of work sponsored by an agency of the United
Lab 5 - ELECTRON CHARGE-TO-MASS RATIO
 81 Name Date Partners Lab 5 - ELECTRON CHARGE-TO-MASS RATIO OBJECTIVES To understand how electric and magnetic fields impact an electron beam To experimentally determine the electron charge-to-mass ratio
Experiment objectives: measure the ratio of Planck s constant to the electron charge h/e using the photoelectric effect.
 Chapter 1 Photoelectric Effect Experiment objectives: measure the ratio of Planck s constant to the electron charge h/e using the photoelectric effect. History The photoelectric effect and its understanding
Coherence and width of spectral lines with Michelson interferometer
 Coherence and width of spectral lines TEP Principle Fraunhofer and Fresnel diffraction, interference, spatial and time coherence, coherence conditions, coherence length for non punctual light sources,
DAY LABORATORY EXERCISE: SPECTROSCOPY
 AS101 - Day Laboratory: Spectroscopy Page 1 DAY LABORATORY EXERCISE: SPECTROSCOPY Goals: To see light dispersed into its constituent colors To study how temperature, light intensity, and light color are
Chapter 13 An Introduction to Ultraviolet/Visible Molecular Absorption Spectrometry
 Chapter 13 An Introduction to Ultraviolet/Visible Molecular Absorption Spectrometry 13A Measurement Of Transmittance and Absorbance Absorption measurements based upon ultraviolet and visible radiation
Lab #13: Polarization
 Lab #13: Polarization Introduction In this experiment we will investigate various properties associated with polarized light. We will study both its generation and application. Real world applications
Dept. of Physics, MIT Manipal 1
 Chapter 1: Optics 1. In the phenomenon of interference, there is A Annihilation of light energy B Addition of energy C Redistribution energy D Creation of energy 2. Interference fringes are obtained using
Infrared Temperature Calibration 101 Using the right tool means better work and more productivity
 Infrared Temperature Calibration 101 Using the right tool means better work and more productivity Application Note Infrared thermometers let you measure a target s surface temperature from a distance without
Lab 6 - ELECTRON CHARGE-TO-MASS RATIO
 101 Name Date Partners OBJECTIVES OVERVIEW Lab 6 - ELECTRON CHARGE-TO-MASS RATIO To understand how electric and magnetic fields impact an electron beam To experimentally determine the electron charge-to-mass
Engineering Physics 1 Prof. G.D. Vermaa Department of Physics Indian Institute of Technology-Roorkee
 Engineering Physics 1 Prof. G.D. Vermaa Department of Physics Indian Institute of Technology-Roorkee Module-04 Lecture-02 Diffraction Part - 02 In the previous lecture I discussed single slit and double
Physics 1C OPTICAL SPECTROSCOPY Rev. 2-AH. Introduction
 Introduction In this lab you will use a diffraction grating to split up light into its various colors (like a rainbow). You will assemble a spectrometer, incorporating the diffraction grating. A spectrometer
Lab 5 - ELECTRON CHARGE-TO-MASS RATIO
 79 Name Date Partners OBJECTIVES OVERVIEW Lab 5 - ELECTRON CHARGE-TO-MASS RATIO To understand how electric and magnetic fields impact an electron beam To experimentally determine the electron charge-to-mass
Chapter 1. Blackbody Radiation. Theory
 Chapter 1 Blackbody Radiation Experiment objectives: explore radiation from objects at certain temperatures, commonly known as blackbody radiation ; make measurements testing the Stefan-Boltzmann law in
B.Tech. First Semester Examination Physics-1 (PHY-101F)
") B.Tech. First Semester Examination Physics-1 (PHY-101F) Note : Attempt FIVE questions in all taking least two questions from each Part. All questions carry equal marks Part-A Q. 1. (a) What are Newton's
B.Tech. First Semester Examination Physics-1 (PHY-101F) Note : Attempt FIVE questions in all taking least two questions from each Part. All questions carry equal marks Part-A Q. 1. (a) What are Newton's
ASTRO Fall 2012 LAB #7: The Electromagnetic Spectrum
 ASTRO 1050 - Fall 2012 LAB #7: The Electromagnetic Spectrum ABSTRACT Astronomers rely on light to convey almost all of the information we have on distant astronomical objects. In addition to measuring
Preview from Notesale.co.uk Page 1 of 38
 F UNDAMENTALS OF PHOTONICS Module 1.1 Nature and Properties of Light Linda J. Vandergriff Director of Photonics System Engineering Science Applications International Corporation McLean, Virginia Light
Because light behaves like a wave, we can describe it in one of two ways by its wavelength or by its frequency.
 Light We can use different terms to describe light: Color Wavelength Frequency Light is composed of electromagnetic waves that travel through some medium. The properties of the medium determine how light
Review: Properties of a wave
 Radiation travels as waves. Waves carry information and energy. Review: Properties of a wave wavelength (λ) crest amplitude (A) trough velocity (v) λ is a distance, so its units are m, cm, or mm, etc.
THE DIFFRACTION GRATING SPECTROMETER
 Purpose Theory THE DIFFRACTION GRATING SPECTROMETER a. To study diffraction of light using a diffraction grating spectrometer b. To measure the wavelengths of certain lines in the spectrum of the mercury
The Quantum Model of the Hydrogen Atom
 Physics 109 Science 1 Experiment 1 1 The Quantum Model of the Hydrogen Atom In this experiment you will use a spectrometer to determine the wavelengths of the visible lines of atomic hydrogen. The goal
Optics. Measuring the line spectra of inert gases and metal vapors using a prism spectrometer. LD Physics Leaflets P
 Optics Spectrometer Prism spectrometer LD Physics Leaflets P5.7.1.1 Measuring the line spectra of inert gases and metal vapors using a prism spectrometer Objects of the experiment Adjusting the prism spectrometer.
ATOMIC SPECTRA. Objective:
 1 ATOMIC SPECTRA Objective: To measure the wavelengths of visible light emitted by atomic hydrogen and verify the measured wavelengths against those predicted by quantum theory. To identify an unknown
Lab 5: Spectroscopy & the Hydrogen Atom Phy248 Spring 2009
 Lab 5: Spectroscopy & the Hydrogen Atom Phy248 Spring 2009 Name Section Return this spreadsheet to your TA that will use it to score your lab. To receive full credit you must use complete sentences and
Plasma Formation and Self-focusing in Continuum Generation
 Plasma Formation and Self-focusing in Continuum Generation Paper by Andrew Parkes Advisors: Jennifer Tate, Douglass Schumacher The Ohio State University REU 2003 Supported by NSF I. Abstract This summer
Properties of Electromagnetic Radiation Chapter 5. What is light? What is a wave? Radiation carries information
 Concepts: Properties of Electromagnetic Radiation Chapter 5 Electromagnetic waves Types of spectra Temperature Blackbody radiation Dual nature of radiation Atomic structure Interaction of light and matter
LIQUID LIGTH GUIDE. Una Pale
 LIQUID LIGTH GUIDE Una Pale XV gymnasium, Faculty of electrical engineering and computing, University of Zagreb, Croatia 1. Introduction Light guide is a fiber-optic cable which is used to transfer signal
Topic 4 &11 Review Waves & Oscillations
 Name: Date: Topic 4 &11 Review Waves & Oscillations 1. A source produces water waves of frequency 10 Hz. The graph shows the variation with horizontal position of the vertical displacement of the surface
NORTHERN ILLINOIS UNIVERSITY PHYSICS DEPARTMENT. Physics 211 E&M and Quantum Physics Spring Lab #9: Diffraction Spectroscopy
 NORTHERN ILLINOIS UNIVERSITY PHYSICS DEPARTMENT Physics 211 E&M and Quantum Physics Spring 2018 Lab #9: Diffraction Spectroscopy Lab Writeup Due: Mon/Wed/Thu/Fri, April 30/ May 2/3/4, 2018 Background All
POLARIZATION OF LIGHT
 POLARIZATION OF LIGHT OVERALL GOALS The Polarization of Light lab strongly emphasizes connecting mathematical formalism with measurable results. It is not your job to understand every aspect of the theory,
K20: Temperature, Heat, and How Heat Moves
 K20: Temperature, Heat, and How Heat Moves Definition of Temperature Definition of Heat How heat flows (Note: For all discussions here, particle means a particle of mass which moves as a unit. It could
Photoelectric Effect
 PC1144 Physics IV Photoelectric Effect 1 Purpose Demonstrate the different predictions of the classical wave and quantum model of light with respect to the photoelectric effect. Determine an experimental
Taking fingerprints of stars, galaxies, and interstellar gas clouds. Absorption and emission from atoms, ions, and molecules
 Taking fingerprints of stars, galaxies, and interstellar gas clouds Absorption and emission from atoms, ions, and molecules 1 Periodic Table of Elements The universe is mostly hydrogen H and helium He
LABORATORY WRITE-UP MICHELSON INTERFEROMETER LAB AUTHOR S NAME GOES HERE STUDENT NUMBER:
 LABORATORY WRITE-UP MICHELSON INTERFEROMETER LAB AUTHOR S NAME GOES HERE STUDENT NUMBER: 111-22-3333 MICHELSON INTERFEROMETER 1. PURPOSE The purpose of this experiment is to give some practice in using
Radionuclide Imaging MII Detection of Nuclear Emission
 Radionuclide Imaging MII 3073 Detection of Nuclear Emission Nuclear radiation detectors Detectors that are commonly used in nuclear medicine: 1. Gas-filled detectors 2. Scintillation detectors 3. Semiconductor
Revision Guide. Chapter 7 Quantum Behaviour
 Revision Guide Chapter 7 Quantum Behaviour Contents CONTENTS... 2 REVISION CHECKLIST... 3 REVISION NOTES... 4 QUANTUM BEHAVIOUR... 4 Random arrival of photons... 4 Photoelectric effect... 5 PHASE AN PHASORS...
Radiation - Electromagnetic Waves (EMR): wave consisting of oscillating electric and magnetic fields that move at the speed of light through space.
: wave consisting of oscillating electric and magnetic fields that move at the speed of light through space.") Radiation - Electromagnetic Waves (EMR): wave consisting of oscillating electric and magnetic fields that move at the speed of light through space. Photon: a quantum of light or electromagnetic wave. Quantum:
Radiation - Electromagnetic Waves (EMR): wave consisting of oscillating electric and magnetic fields that move at the speed of light through space. Photon: a quantum of light or electromagnetic wave. Quantum:
Physics 476LW Advanced Physics Laboratory Atomic Spectroscopy
 Physics 476LW Atomic Spectroscopy 1 Introduction The description of atomic spectra and the Rutherford-Geiger-Marsden experiment were the most significant precursors of the so-called Bohr planetary model
Lab 6 - Electron Charge-To-Mass Ratio
 Lab 6 Electron Charge-To-Mass Ratio L6-1 Name Date Partners Lab 6 - Electron Charge-To-Mass Ratio OBJECTIVES To understand how electric and magnetic fields impact an electron beam To experimentally determine
Physics 23 Fall 1998 Lab 4 - The Hydrogen Spectrum
 Physics 3 Fall 998 Lab 4 - The Hydrogen Spectrum Theory In the late 800's, it was known that when a gas is excited by means of an electric discharge and the light emitted is viewed through a diffraction
Chapter 4 Scintillation Detectors
 Med Phys 4RA3, 4RB3/6R03 Radioisotopes and Radiation Methodology 4-1 4.1. Basic principle of the scintillator Chapter 4 Scintillation Detectors Scintillator Light sensor Ionizing radiation Light (visible,
Taking Fingerprints of Stars, Galaxies, and Other Stuff. The Bohr Atom. The Bohr Atom Model of Hydrogen atom. Bohr Atom. Bohr Atom
 Periodic Table of Elements Taking Fingerprints of Stars, Galaxies, and Other Stuff Absorption and Emission from Atoms, Ions, and Molecules Universe is mostly (97%) Hydrogen and Helium (H and He) The ONLY
Reference literature. (See: CHEM 2470 notes, Module 8 Textbook 6th ed., Chapters )
") September 17, 2018 Reference literature (See: CHEM 2470 notes, Module 8 Textbook 6th ed., Chapters 13-14 ) Reference.: https://slideplayer.com/slide/8354408/ Spectroscopy Usual Wavelength Type of Quantum
September 17, 2018 Reference literature (See: CHEM 2470 notes, Module 8 Textbook 6th ed., Chapters 13-14 ) Reference.: https://slideplayer.com/slide/8354408/ Spectroscopy Usual Wavelength Type of Quantum
The Emission Spectra of Light
 The Emission Spectra of Light Objectives: Theory: 1.... measured the wavelength limits of the color bands in the visible spectrum, 2.... measured the wavelengths of the emission lines of the hydrogen Balmer
Taking fingerprints of stars, galaxies, and interstellar gas clouds
 - - Taking fingerprints of stars, galaxies, and interstellar gas clouds Absorption and emission from atoms, ions, and molecules Periodic Table of Elements The universe is mostly hydrogen H and helium He
3 - Atomic Absorption Spectroscopy
 3 - Atomic Absorption Spectroscopy Introduction Atomic-absorption (AA) spectroscopy uses the absorption of light to measure the concentration of gas-phase atoms. Since samples are usually liquids or solids,
Introduction to FT-IR Spectroscopy
 Introduction to FT-IR Spectroscopy An FT-IR Spectrometer is an instrument which acquires broadband NIR to FIR spectra. Unlike a dispersive instrument, i.e. grating monochromator or spectrograph, an FT-IR
GA A22722 CENTRAL THOMSON SCATTERING UPGRADE ON DIII D
 GA A22722 CENTRAL THOMSON SCATTERING UPGRADE ON DIII D by D.G. NILSON, T.N. CARLSTROM, C.L. HSIEH, B.W. STALLARD, and R.E. STOCKDALE NOVEMBER 1997 DISCLAIMER This report was prepared as an account of work
Chapter 5. Past and Proposed Experiments Detecting Absolute Motion
 Chapter 5 Past and Proposed Experiments Detecting Absolute Motion In this Chapter I gave different interpretations for the results of some famous past experiments. My interpretations are based on the following
DIFFRACTION GRATING. OBJECTIVE: To use the diffraction grating in the formation of spectra and in the measurement of wavelengths.
 DIFFRACTION GRATING OBJECTIVE: To use the diffraction grating in the formation of spectra and in the measurement of wavelengths. THEORY: The operation of the grating is depicted in Fig. 1 on page Lens
hf = E 1 - E 2 hc = E 1 - E 2 λ FXA 2008 Candidates should be able to : EMISSION LINE SPECTRA
 1 Candidates should be able to : EMISSION LINE SPECTRA Explain how spectral lines are evidence for the existence of discrete energy levels in isolated atoms (i.e. in a gas discharge lamp). Describe the
H2 Physics Set A Paper 3 H2 PHYSICS. Exam papers with worked solutions. (Selected from Top JC) SET A PAPER 3.
 SET A PAPER 3.") H2 PHYSICS Exam papers with worked solutions (Selected from Top JC) SET A PAPER 3 Compiled by THE PHYSICS CAFE 1 P a g e Candidates answer on the Question Paper. No Additional Materials are required. READ
H2 PHYSICS Exam papers with worked solutions (Selected from Top JC) SET A PAPER 3 Compiled by THE PHYSICS CAFE 1 P a g e Candidates answer on the Question Paper. No Additional Materials are required. READ
Photoelectric Effect Experiment
 Experiment 1 Purpose The photoelectric effect is a key experiment in modern physics. In this experiment light is used to excite electrons that (given sufficient energy) can escape from a material producing
How does your eye form an Refraction
 Astronomical Instruments Eyes and Cameras: Everyday Light Sensors How does your eye form an image? How do we record images? How does your eye form an image? Refraction Refraction is the bending of light
Compact Knowledge: Absorbance Spectrophotometry. Flexible. Reliable. Personal.
 L A B O R A T O R Y C O M P E T E N C E Compact Knowledge: Absorbance Spectrophotometry Flexible. Reliable. Personal. The interaction of light with molecules is an essential and well accepted technique
Speed of Light in Air
 Speed of Light in Air Electromagnetic waves represent energy in the form of oscillating electric and magnetic fields which propagate through vacuum with a speed c = 2.9979246x10 8 m/s. Electromagnetic
Nanosecond Broadband Spectroscopy For Laser-Driven Compression Experiments
 Nanosecond Broadband Spectroscopy For Laser-Driven Compression Experiments Dylan K. Spaulding, R. Jeanloz Department of Earth and Planetary Science, University of California, Berkeley307 McCone Hall, Berkeley,
D-D FUSION NEUTRONS FROM A STRONG SPHERICAL SHOCK WAVE FOCUSED ON A DEUTERIUM BUBBLE IN WATER. Dr. Michel Laberge General Fusion Inc.
 D-D FUSION NEUTRONS FROM A STRONG SPHERICAL SHOCK WAVE FOCUSED ON A DEUTERIUM BUBBLE IN WATER Dr. Michel Laberge General Fusion Inc. SONOFUSION Sonofusion is making some noise A bit short in energy, ~mj
Photoelectron spectroscopy Instrumentation. Nanomaterials characterization 2
 Photoelectron spectroscopy Instrumentation Nanomaterials characterization 2 RNDr. Věra V Vodičkov ková,, PhD. Photoelectron Spectroscopy general scheme Impact of X-ray emitted from source to the sample
Design and Development of a Smartphone Based Visible Spectrophotometer for Analytical Applications
 Design and Development of a Smartphone Based Visible Spectrophotometer for Analytical Applications Bedanta Kr. Deka, D. Thakuria, H. Bora and S. Banerjee # Department of Physicis, B. Borooah College, Ulubari,
Chapter 10, Thermal Physics
 CHAPTER 10 1. If it is given that 546 K equals 273 C, then it follows that 400 K equals: a. 127 C b. 150 C c. 473 C d. 1 200 C 2. A steel wire, 150 m long at 10 C, has a coefficient of linear expansion
Electron Density Measurements of Argon Surface-Wave Discharges
 Plasma Chemistry and Plasma Processing, Vol. 5, No. 3, 1985 Electron Density Measurements of Argon Surface-Wave Discharges M. Brake, 1'2 J. Rogers, 1'3 M. Peters, 1 J. Asmussen, 1 and R. Kerber 1 Received
object objective lens eyepiece lens
 Advancing Physics G495 June 2015 SET #1 ANSWERS Field and Particle Pictures Seeing with electrons The compound optical microscope Q1. Before attempting this question it may be helpful to review ray diagram
Calibrating the Thermal Camera
 1 of 5 4/19/2012 5:33 AM from photonics.com: 12/01/2009 http://www.photonics.com/article.aspx?aid=40679 Calibrating the Thermal Camera As thermal cameras gain ground in the commercial market, testing becomes
HOMEWORK - Chapter 4 Spectroscopy
 Astronomy 10 HOMEWORK - Chapter 4 Spectroscopy Use a calculator whenever necessary. For full credit, always show your work and explain how you got your answer in full, complete sentences on a separate
Supplemental material for Bound electron nonlinearity beyond the ionization threshold
 Supplemental material for Bound electron nonlinearity beyond the ionization threshold 1. Experimental setup The laser used in the experiments is a λ=800 nm Ti:Sapphire amplifier producing 42 fs, 10 mj
PHYSICS 289 Experiment 3 Fall Heat transfer and the Greenhouse Effect
 PHYSICS 289 Experiment 3 Fall 2006 Heat transfer and the Greenhouse Effect Only a short report is required: worksheets, graphs and answers to the questions. Introduction In this experiment we study the
Laboratory Exercise. Atomic Spectra A Kirchoff Potpourri
 1 Name: Laboratory Exercise Atomic Spectra A Kirchoff Potpourri Purpose: To examine the atomic spectra from several gas filled tubes and understand the importance of spectroscopy to astronomy. Introduction
Conservation of Angular Momentum
 In analogy with linear momentum, one can define in rotational motion the quantities L, the angular momentum, and K, the rotational kinetic energy. For the rotation of a rigid body about a fixed axis, the
Chapter 11 FUNDAMENTALS OF THERMAL RADIATION
 Chapter Chapter Fundamentals of Thermal Radiation FUNDAMENTALS OF THERMAL RADIATION Electromagnetic and Thermal Radiation -C Electromagnetic waves are caused by accelerated charges or changing electric
Interested in exploring science or math teaching as a career?
 Interested in exploring science or math teaching as a career? Start with Step 1: EDUC 2020 (1 credit) Real experience teaching real kids! No commitment to continue with education courses Registration priority
Wave - Particle Duality of Light
 Properties of Light Objectives Explain wave-particle duality State the speed of light Describe electromagnetic waves and the electromagnetic spectrum Explain how light interacts with transparent and opaque
= nm. = nm. = nm
 Chemistry 60 Analytical Spectroscopy PROBLEM SET 5: Due 03/0/08 1. At a recent birthday party, a young friend (elementary school) noticed that multicolored rings form across the surface of soap bubbles.
Experiment #9. Atomic Emission Spectroscopy
 Introduction Experiment #9. Atomic Emission Spectroscopy Spectroscopy is the study of the interaction of light with matter. This interaction can be in the form of the absorption or the emission of electromagnetic
The Sun: Our Star. The Sun is an ordinary star and shines the same way other stars do.
 The Sun: Our Star The Sun is an ordinary star and shines the same way other stars do. Announcements q Homework # 4 is due today! q Units 49 and 51 Assigned Reading Today s Goals q Today we start section
Measuring Cosmic Ray Muon Decay Constant and Flux
 WJP, PHY381 (2015) Wabash Journal of Physics v3.3, p.1 Measuring Cosmic Ray Muon Decay Constant and Flux R.C. Dennis, D.T. Tran, J. Qi, and J. Brown Department of Physics, Wabash College, Crawfordsville,
ATOMIC SPECTRA. To identify elements through their emission spectra. Apparatus: spectrometer, spectral tubes, power supply, incandescent lamp.
 ATOMIC SPECTRA Objective: To measure the wavelengths of visible light emitted by atomic hydrogen and verify the measured wavelengths against those predicted by quantum theory. To identify elements through
Fast Z-Pinch Experiments at the Kurchatov Institute Aimed at the Inertial Fusion Energy
 1 Fast Z-Pinch Experiments at the Kurchatov Institute Aimed at the Inertial Fusion Energy A. Kingsep 1), S.Anan ev 1), Yu. Bakshaev 1), A. Bartov 1), P. Blinov 1), A. Chernenko 1), S. Danko 1), Yu. Kalinin
Chapter 4 Spectroscopy
 Chapter 4 Spectroscopy The beautiful visible spectrum of the star Procyon is shown here from red to blue, interrupted by hundreds of dark lines caused by the absorption of light in the hot star s cooler
Some Topics in Optics
 Some Topics in Optics The HeNe LASER The index of refraction and dispersion Interference The Michelson Interferometer Diffraction Wavemeter Fabry-Pérot Etalon and Interferometer The Helium Neon LASER A