arxiv: v1 [astro-ph.sr] 10 Jul 2009
|
|
|
- Griffin Austin
- 5 years ago
- Views:
Transcription
1 Astronomy & Astrophysics manuscript no. ms12521 c ESO 2018 August 29, 2018 The close circumstellar environment of Betelgeuse Adaptive optics spectro-imaging in the near-ir with VLT/NACO P. Kervella 1, T. Verhoelst 2, S. T. Ridgway 3, G. Perrin 1, S. Lacour 1, J. Cami 4, and X. Haubois 1 arxiv: v1 [astro-ph.sr] 10 Jul LESIA, Observatoire de Paris, CNRS UMR 8109, UPMC, Université Paris Diderot, 5 place Jules Janssen, Meudon, France 2 Instituut voor Sterrenkunde, K. U. Leuven, Celestijnenlaan 200D, B-3001 Leuven, Belgium 3 National Optical Astronomy Observatories, 950 North Cherry Avenue, Tucson, AZ 85719, USA 4 Physics and Astronomy Dept, University of Western Ontario, London ON N6A 3K7, Canada Received ; Accepted ABSTRACT Context. Betelgeuse is one the largest stars in the sky in terms of angular diameter. Structures on the stellar photosphere have been detected in the visible and near-infrared as well as a compact molecular environment called the MOLsphere. Mid-infrared observations have revealed the nature of some of the molecules in the MOLsphere, some being the precursor of dust. Aims. Betelgeuse is an excellent candidate to understand the process of mass loss in red supergiants. Using diffraction-limited adaptive optics (AO) in the near-infrared, we probe the photosphere and close environment of Betelgeuse to study the wavelength dependence of its extension, and to search for asymmetries. Methods. We obtained AO images with the VLT/NACO instrument, taking advantage of the cube mode of the CONICA camera to record separately a large number of short-exposure frames. This allowed us to adopt a lucky imaging approach for the data reduction, and obtain diffraction-limited images over the spectral range µm in 10 narrow-band filters. Results. In all filters, the photosphere of Betelgeuse appears partly resolved. We identify an asymmetric envelope around the star, with in particular a relatively bright plume extending in the southwestern quadrant up to a radius of approximately six times the photosphere. The CN molecule provides an excellent match to the 1.09µm bandhead in absorption in front of the stellar photosphere, but the emission spectrum of the plume is more difficult to interpret. Conclusions. Our AO images show that the envelope surrounding Betelgeuse has a complex and irregular structure. We propose that the southwestern plume is linked either to the presence of a convective hot spot on the photosphere, or to the rotation of the star. Key words. Stars: individual: Betelgeuse; Stars: imaging; Stars: supergiants; Stars: circumstellar matter; Techniques: high angular resolution; Methods: observational 1. Introduction Betelgeuse (α Ori, HD 39801, HR 2061) is one of the brightest stars at infrared wavelengths and has one of the largest apparent photospheric diameters ( 44 mas in the K band, from Perrin et al. 2004). It is a red supergiant of spectral type M2Iab with irregular flux variations. Because of its brightness and of its angular size, it has been an easy target for interferometers. It can even be resolved with large telescopes at short wavelengths, as demonstrated by Gilliland & Dupree (1996), who resolved its extended chromosphere using the Hubble Space Telescope at ultraviolet wavelengths. Several mysteries remain to be solved for such an object among which the structure of its convection and the mechanism of its mass loss. Similarities with Mira stars have been noted, including a significant thermal infrared excess, indicative of the presence of circumstellar dust. An important difference is that Betelgeuse is not subject to regular large amplitude pulsations which could levitate material high enough above the atmosphere where dust could form and be blown away by radiation pressure. The reason for the extension of the atmosphere is still unclear and another mechanism for dust formation and mass loss Send offprint requests to: P. Kervella Based on observations made with ESO telescopes at Paranal Observatory, under ESO program 082.D-0172(A). Correspondence to: Pierre.Kervella@obspm.fr needs to be invoked. A careful scrutiny of the object from the photospheric scale up to the distance in its circumstellar envelope (CSE) where dust can condense is the path to understanding this prototypical and enigmatic star. It is also known from interferometric observations in the thermal infrared domain by Bester et al. (1996) that Betelgeuse experiences episodic mass loss. Our new NACO observations aim at probing the close environment of Betelgeuse to etablish a link between the photosphere and mass loss. After a presentation of our observations in Sect. 2, we detail our analysis of the NACO images in Sect. 3, and discuss the observed features in Sect Observations and data reduction 2.1. Instrumental setup and observation log We observed Betelgeuse on the nights of 2 and 3 January 2009 using the Nasmyth Adaptive Optics System (NAOS, Rousset et al. 2003) of the Very Large Telescope (VLT), coupled to the CONICA infrared camera (Lenzen et al. 1998), abbreviated as NACO. NAOS is equipped with a tip-tilt mirror and a deformable mirror controlled by 185 actuators, as well as two wavefront sensors: one for visible light and one for the infrared domain. For our observations, we exclusively used the visible light wavefront sensor. The detector is a pixel ALADDIN InSb array. As its name indicates, NACO is installed
2 2 P. Kervella et al.: Adaptive optics spectro-imaging of Betelgeuse jitter. After a precentering at the integer pixel level, the images were sorted based on their maximum intensity, used as a proxy of the Strehl ratio. The 10% best images of each cube were then resampled up by a factor 4 using a cubic spline interpolation, and the star image was subsequently centered using gaussian fitting. The resulting cubes were eventually averaged to obtain the master images of each star used in the image analysis process described below. The initial oversampling of the image followed by the precise centering of the images gives an improved sampling of the image, as the residual atmospheric drizzle allows to retrieve sub-pixel sampling. This is particularly important in the J band, where the resolution of the telescope corresponds to only two NACO pixels. The selection of the best frames allowed us to reject the frames affected by the residual high-order distorsions. The result of this processing is presented in Fig. 2 for Betelgeuse and its primary PSF calibrator Aldebaran. Fig. 1. Transmissions of the NACO narrow-band filters (black curves) and of the atmosphere (from Lord 1992, thin grey curve). at the Nasmyth focus of the Unit Telescope 4 (Yepun), located on the eastern side of the VLT platform. The CONICA camera was read using the newly implemented cube mode that allows to record very short exposures (down to 7.2 ms) over part of the detector. As discussed in Sect. 2.2, this new capability is essential to reach truly diffraction limited imaging. We selected the smallest available pixel scale of ± 0.03 mas/pix (Masciadri et al. 2003). Table 1 gives the list of the observations of Betelgeuse and the PSF calibrator stars Aldebaran (HD 29139), 31 Ori (HD 36167) and δ Phe (HD 9362). Due to the brightness of Betelgeuse and Aldebaran, we employed narrow- and intermediate-band filters together with a neutral density filter (labeled ND2short ) with a transmission of about 1.5%. The observations of our fainter, secondary PSF calibrators (31 Ori and δ Phe) were obtained without neutral density filter. The transmission curves of the 10 narrow-band filters we used for our observations are shown in Fig. 1. They are also available through the NACO instrument web page at ESO Data processing The individual raw images were pre-processed (bias subtraction, flat-fielding, bad pixel masking) using the Yorick 2 and IRAF 3 software packages in a standard way, except that we did not subtract the negligible sky background. The quality of adaptive optics images is affected by a residual jitter of the star on the detector ( tip-tilt ), and by high-order residual wavefront distorsions. The star jitter is most probably caused by a combination of instrumental vibrations and atmospheric tip-tilt residuals, while the high-order distorsions are simply due to the limitations of the instrument performance. In order to obtain truly diffraction-limited image quality, especially at short wavelengths in the J band, it is essential to eliminate the perturbations from these two effects. Taking advantage of the newly implemented cube mode of CONICA, we obtained extremely short exposures that allowed us to freeze the image IRAF is distributed by the NOAO, which are operated by the Association of Universities for Research in Astronomy, Inc., under cooperative agreement with the National Science Foundation Efficiency of NACO full-pupil cube vs. standard mode In order to check the efficiency of the image recentering and selection, we processed a series of 10 data cubes obtained on the PSF calibrator Aldebaran (#001 to #010 in Table 1) with and without recentering the individual frames. The resulting images for three wavelengths are shown in Fig. 3. Already clearly visible on these images, we hereafter quantify the gain in image quality by processing the same data cubes using three methods: recentering, selection of the best 10% frames based on the peak flux in the image and co-addition, recentering and co-addition of all frames (no selection), coaddition without recentering of all frames (equivalent to a single long exposure of 72 s). From this exercise, it appears that the recentering of the frames before co-addition results in a spectacular increase of the Strehl ratio and a very significant decrease of the full width at half maximum (FWHM) of the star image (Fig. 4). As expected, this effect is stronger at shorter wavelengths, where the adaptive optics performance is comparatively lower. In the µm range, the improvement reaches a factor three in Strehl ratio and a factor two in FWHM. The improvement in FWHM brought by the selection of the frames with the best Strehl appears very small compared to the effect of the recentering. Selecting the 10% best frames improves the average Strehl by approximately 10% (relatively to centering without selection) for the shortest wavelengths. For our very bright targets, we chose to keep this selection criterion as the signal-to-noise ratio of the average images is essentially limited by the AO residuals, and not by the number of frames. As shown in Fig. 4, we can also compare the image FWHM with the theoretical diffraction limit of the telescope. Using a very simplified model of an 8 m primary mirror with a central 1.12 m obscuration, and a 20 mas uniform disk (UD) for Aldebaran, we obtained the theoretical FWHM shown as a thick grey curve. We chose this UD angular size as the angular diameter of Aldebaran was measured in the K band by Richichi & Roccatagliata (2005), who foundθ UD (K)=19.96±0.03 mas and θ LD (K)=20.58±0.03 mas. As a remark, the FWHM of our images is measured over a large sub-window that includes part of the adaptive optics photometric incoherent residuals (also called pedestal ). The resulting values are thus slightly overestimated, but have the advantage of being directly comparable between real and theoretical images. From these results, the frame-by-frame recentering of adaptive optics observations appears as a very efficient way to im-
 obtained on the PSF calibrator Aldebaran without centering or frame selection (left) and with centering and 10% best frame selection (right). The white disk in the 1.")


.")
3 P. Kervella et al.: Adaptive optics spectro-imaging of Betelgeuse 3 Fig. 3. Average frames of the NACO cubes #001 (1.04µm), #007 (1.64µm) and #010 (2.17µm) obtained on the PSF calibrator Aldebaran without centering or frame selection (left) and with centering and 10% best frame selection (right). The white disk in the 1.04 µm images represents the angular size of Aldebaran s photosphere (20 mas). The color scales are proportional to the square root of the flux, and are identical for the two images at each wavelength. prove the angular resolution compared to single long exposures. The spectacular increase in Strehl ratio observed at short wavelengths should also result in an improved sensitivity for faint object, but the necessity of combining a large number of frames results in a proportionally higher detector readout noise. For this reason, this data reduction strategy may not be optimal for K band observations where the gain is only 50% in Strehl ratio. However, in the J band, whenever a bright enough source is available to recenter the frames, the cube mode of NACO with short exposures will in most cases be more sensitive than classical long exposures. 3. Image analysis 3.1. Point spread function We obtained images of two unresolved and relatively fainter stars (31 Ori andδ Phe, # and # in Table 1) without neutral density filter, to check the influence of the ND filter on the PSF shape. We do not find evidence of an effect of Fig. 4. Upper panel: Relative Strehl ratio of the recentered and co-added images compared to the classic mode of NACO, without frame selection (dashed curve) and keeping only the 10% best peak flux frames (thin solid curve). Lower panel: Full width at half maximum of the NACO images of Aldebaran for the classic mode (black curve), frame centering without selection (dashed curve) and 10% best frames selection and centering (thin solid curve), compared to the theoretical diffraction pattern for a UT observing a uniform disk of 20 mas (grey curve). this filter on the PSF shape. However, considering the faintness of the CSE of Betelgeuse, we chose to strictly keep the same instrumental setup between Betelgeuse and the PSF to avoid any contamination in the deconvolved images. We therefore used Aldebaran as the PSF reference. To retrieve the true PSF of the telescope from the images of Aldebaran, we took into account the angular extension of the star. Although this star is significantly smaller (θ LD = 20.6 mas) than Betelgeuse (θ LD = 43.7 mas), it is not negligible compared to the resolution of the telescope in the J band. We therefore computed synthetic images of Aldebaran using its known LD size and model limb darkening coefficients in the J, H, and K bands from Claret s (2000) tables using Teff=4000K and log g=1.5. We then computed a classical Lucy-Richardson (L-R) deconvolution of the NACO images of Aldebaran (single iteration) using these synthetic images as the dirty beams. This procedure gives us
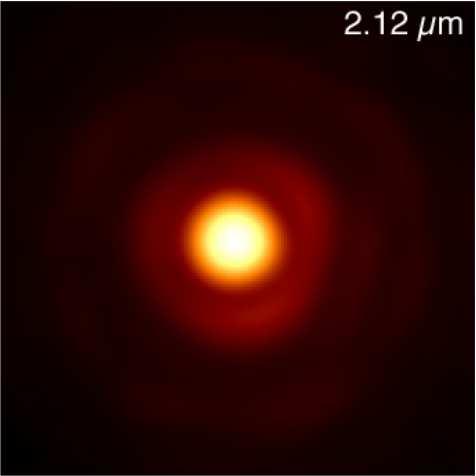
4 4 P. Kervella et al.: Adaptive optics spectro-imaging of Betelgeuse The overall agreement with our photometry is satisfactory, but a strong absorption feature around µm is present in our data and absent from the model spectrum. We also plotted in Fig. 5 a calibrated spectrum of Betelgeuse (Cushing et al. 2005) taken from the IRTF database 4, scaled by a factor 1.2 to match the brightness of Betelgeuse at the epoch of our observations. This spectrum also shows the absorption feature that is particularly strong at 1.09µm Image deconvolution Fig. 5. Calibrated photometry of Betelgeuse. The dots represent our photometry in the 10 narrow-band filters of NACO. The thin black curve represents the model spectrum of a T eff = K normal supergiant (Castelli & Kurucz 2003) normalized to a limb darkened disk angular diameter of 43.7 mas. The grey curve is a spectrum of Betelgeuse from the IRTF database (Cushing et al. 2005), scaled by a factor 1.2. the true PSF of the telescope for our ten narrow-band filters, i.e. the image of a point source Photometry of Betelgeuse For the photometric calibration of our images, we used a classical aperture photometry approach using Aldebaran as the calibrator. As we used non-standard narrow-band filters, we have to refer our measurements to a synthetic spectral energy distribution (SED) of Aldebaran, normalized by its interferometrically measured angular diameter. The shape of the SED of Aldebaran was read from the theoretical spectra table by Castelli & Kurucz (2003), for an effective temperature of K, solar metallicity, V T = 2 km.s 1 and log g = 1.5 (parameters approximated from Cayrel de Strobel et al. 2001). We then used the limb darkened disk angular diameter of 20.6 mas measured by Richichi & Roccatagliata (2005) to normalize this synthetic spectrum. We checked that the existing broadband photometric measurements are consistent with the resulting SED, but we did not used them to fit the SED. Considering the true profiles of the NACO filters we used for our observations (Fig. 1), we integrated the flux from Aldebaran in W.m 2.µm 1 in each band. We then normalized the flux integrated on the Betelgeuse images by the flux measured on Aldebaran using the same relatively narrow aperture (50 to 70 mas in radius, slightly increasing with wavelength). This approach allows us to integrate the full flux from the resolved Betelgeuse disk, while avoiding the adaptive optics halo. We did not consider the airmass difference between the two stars and the negligible infrared background. The resulting photometric measurements are shown in Fig. 5 for the ten narrow-band flters. In this figure, we plotted the synthetic spectrum of a normal supergiant with T eff = K, solar metallicity, V T = 2 km.s 1 and log g=0.0 from the Castelli & Kurucz (2003) library. We normalized the expected flux using the 43.7 mas angular diameter measured by Perrin et al. (2004). We deconvolved the images of Betelgeuse using the PSF images (Sect. 3.1) as the dirty beams and the Lucy-Richardson (L-R) algorithm. The images corresponding to the three imaging epochs of Betelgeuse were processed separately with the relevant PSF calibrator observation. The resulting average deconvolved images in the ten NACO narrow-band filters are presented in Fig. 6. We stopped the L-R deconvolution after 30 iterations, as the resulting images in the K band (2.12 and 2.17µm) show a full width at half maximum of the photosphere of Betelgeuse compatible with the LD size measured by interferometry (Fig. 6, left column), while no significant deconvolution artefact is present. In this process, we took into account the difference in rotational position of the pupil of the telescope between the two stars. We rotated the images of Aldebaran obtained in each filter to precisely match the telescope pupil position angle (hereafter abridged as PA ) of the corresponding images of Betelgeuse. In other words, the secondary mirror support spikes were brought to the same PA in Aldebaran s and Betelgeuse s images. This allowed us to avoid artefacts in the deconvolution of the Betelgeuse images. Although the presence of the spikes has a noticeable effect on the deconvolved images, we checked that the straight deconvolution of the Betelgeuse images by the Aldebaran images (without rotation) gives very similar results. Photometry on deconvolved images is a tricky task, but McNeil & Moody (2005) showed that the Lucy-Richardson algorithm preserves the photometric accuracy relatively well compared to other classical algorithms. We therefore normalized photometrically the deconvolved images presented in Fig. 6 ( mas field of view) by the total flux of Betelgeuse in each filter (in W.m 2.µm 1 ) as estimated in Sect. 3.2, and by the size of the resampled image pixel (3.315 mas/pix). The resulting physical unit of the images is therefore W.m 2.µm 1.sr 1 (surface brightness) Circumstellar envelope shape In the deconvolved images presented in Fig. 6, we observe the photosphere of Betelgeuse as a disk whose size appears mostly constant with wavelength (left columns). We also detect an extension of its envelope in the southwestern quadrant, at a PA of 200 ± 20 degrees (counted positively east of North), that we will subsequently refer to as a plume. The bright part of this plume extends up to a minimum radius of six times the photosphere of the star ( mas), and is already visible in the non-deconvolved images of Betelgeuse. At a distance of 4 R, its surface brightness in the 1.09µm band is 0.4% of the center of the stellar disk, and falls down to 0.1% at 6 R (Fig. 8). Two other faint extensions appear in the northeastern (PA 75 ) and northwestern (PA 310 ) quadrants. Although faint, their presence at all ten wavelengths (processed independently) indicates that they are likely real features. 4 spex/irtf Spectral Library/

. The color scale is logarithmic.")
5 P. Kervella et al.: Adaptive optics spectro-imaging of Betelgeuse 5 Fig. 7. Left panel: Positions of the 3D pseudo-slit, plotted over the image of Betelgeuse at 1.04 µm. The color scale is logarithmic to better show the extensions of the CSE. The central circle represents the photosphere of the star. The graduations from 0 to 6 are distances from the photosphere center in stellar radii for the spectra shown in Fig. 8. Right panel: Reconstructed long-slit spectrum of Betelgeuse (linear interpolation from the pseudo-slit cut in the Betelgeuse image cube). The color scale is logarithmic. The vertical lines indicate the central wavelengths of the NACO narrow-band filters (see also Fig. 1), and the 43.7 mas photospheric angular diameter is shown with green lines Photospheric and CSE spectral energy distributions Based on the deconvolved and photometrically calibrated images, we can analyze locally the SED of the CSE of Betelgeuse. Fig. 7 shows the pseudo-slit we used for this analysis, positioned in a north-south direction to include the brightest plume. The right part of this Figure shows the average surface brightness spectrum of Betelgeuse and its CSE over the pseudo-slit. The individual spectra observed at different distances from the center of the disk of Betelgeuse along the pseudo-slit are shown in Fig. 8 (they correspond to horizontal cuts in the right part of Fig. 7). We used the RMS dispersion of the pseudo-slit measurements on the three deconvolved and photometrically calibrated images of Betelgeuse obtained in each filter to estimate the systematic uncertainty of our measurements. This gave us the error bars shown in Fig. 8. The two fainter plumes visible in the Betelgeuse images in the northeastern and northwestern quadrants have similar spectra as the southern plume, with a maximum flux in the J band between 1.08 and 1.24 µm. 4. Discussion 4.1. Identification of the spectral features Both the photospheric spectrum and the spectra of the plume at different radii show a spectral feature from roughly 1.1 µm up to 1.3µm 5. Against the photosphere, it is seen in absorption, and without a strong background source, i.e. offset from the central star but at the location of the plume, it is observed in emission. The near-ir spectral range of red supergiant stars such as α Ori andµ Cep is the topic of a long-standing debate: several features have alternately been attributed to CN or H 2 O (Woolf et al. 1964, Wing & Spinrad 1970, Tsuji 2000). The current consensus is that features due to photospheric CN are present, as 5 As there is a gap in the NACO spectral coverage from 1.16 to 1.22µm (see Fig. 1), it is conceivable that we are in fact dealing with two separate features. Fig. 8. Surface brightness spectra of the close environment of Betelgeuse, averaged over the pseudo-slit width (44 mas). The vertical scales are in W.m 2.µm 1.sr 1, and the horizontal scale is the wavelength inµm. The radius (in R ) from the center of the photosphere is indicated in the upper right corner of each plot. predicted by the self-consistent hydrostatic models, and that water is detected in the poorly-understood close circumstellar environment (e.g. Jennings & Sada 1998, Verhoelst et al. 2006, Perrin et al. 2007). As we are limited by the transmission of Earth s atmosphere, our spectra do not cover the water bands which were discussed most (those with bandheads around 1.4 and 1.9µm.) Regarding the identification of the feature observed here, H 2 O is not a candidate since this molecule does not exhibit a clear band at this particular wavelength range. CN provides an excellent match to the bandhead, and by a careful choice of temperature (2 500 K) and column density ( cm 2 ), it is possible to model this absorption feature with a single slab of CN, without the introduction of unobserved features at the other wavelengths of CN opacity (see the upper panel of Fig. 9 for the model fit). Unfortunately, the same basic modelling approach does not work for the emission spectra: the prediction of the bluest feature is, in the optically thin case, far too narrow (lower panel of Fig. 9) and any combination of temperature and column density
6 6 P. Kervella et al.: Adaptive optics spectro-imaging of Betelgeuse detection of the plume in the K band is caused by a lack of resolving power, that results in a lower sensitivity of the L-R deconvolved images to extended sources. As a consequence, as we do not observe the expected emission feature around 1.9 µm, we cannot confirm our idenfication of CN, but cannot propose a viable alternative either Previous high angular resolution observations Fig. 9. Upper panel: The photospheric model spectrum (black), the model + CN slab spectrum (green), the predicted inband intensities (blue) and the observations (red). Lower panel: The emission spectrum of optically thin CN at K in green, the observations in red at a radius of 6 R and the predicted inband intensities in blue. Both plots use the same temperature and column density for the CN slab. that matches this broad feature, predicts a strong emission feature in the K band starting around 1.9µm, but is not observed. Neither clumpiness nor a difference between excitation temperature and source-function temperature or a source of continuous background emission help to solve this problem. Obscuration of the feature at 1.9µm is in theory possible with cold water vapour (cfr. the discussion on the identification of the observed absorption features at those wavelengths), but that would require a large water column density and a very particular geometry. An important aspect of our spectro-imaging observations is that the angular resolution decreases by a factor two in the K band compared to the J band (where the plume is most visible). In the L-R deconvolution process, the angular size of the bright photosphere is recovered properly (Fig. 6), but the detection of the plume is made more difficult by its much lower surface brightness (typically several hundred times fainter than the photosphere). We therefore cannot exclude that our marginal Thanks to its large angular diameter and correlatively high brightness, Betelgeuse has been an excellent target for high resolution observations using a broad palette of techniques: direct full-pupil imaging, aperture masking, speckle interferometry and long-baseline interferometry. This short summary of the existing observational reports is in no way complete, but is intended to give an overview of the detections of asymmetries and surface features on Betelgeuse. Such asymmetries could point at a link between the photosphere and the envelope of the star as observed in our NACO images. Early observations in the visible using the rotation shearing interferometer (Roddier & Roddier 1983, 1985; Roddier et al. 1986) revealed that in November 1980 and February 1982, asymmetric emission was present around Betelgeuse, and they proposed that it was caused by scattering in a dusty layer close to the star. The presence of two companions was suggested by Karovska et al. (1986), but our NACO observations do not show any point-like source down to a magnitude difference 5 in the JHK band over the field of view of our observations ( ). Observations in the visible obtained at the same epoch (February 1981) with the Mayall telescope by Christou et al. (1988) show the presence of PSF-subtraction residuals in the southwestern quadrant with a typical radius of the order of 100 mas, a size and position comparable to that of the plume detected with NACO. Hebden et al. (1987) observed Betelgeuse in the Hα line with the MMT in speckle interferometry at two epochs: December 1983 and November They identify mostly no asymmetry at both epochs up to a radius of 95 mas, while slightly larger extensions appear in the east-west and north-south directions at larger radii. In February 1989, Buscher et al. (1990) observed Betelgeuse using the WHT equipped with a non-redundant aperture mask and three narrow-band filters in the visible around λ=0.7µm. These authors detected an asymmetry on the surface of the star, that they interpret as a hot spot located at a PA of 280, with a relative flux contribution of 10-15%. Using the same instrument and technique, Wilson et al. (1992) re-observed Betelgeuse in January 1991, and also detected asymmetries on the disk of the star and a northeast-southwest elongation different from to the 1989 epoch. Gilliland & Dupree (1996) resolved the chromosphere of Betelgeuse at ultraviolet wavelengths using the Hubble Space Telescope equipped with the Faint Object Camera (FOC), and also obtained resolved spectra with the Goddard High Resolution Spectrograph (GHRS). These data were obtained in March 1995 and clearly show the resolved chromosphere in UV continuum, extending to more than twice the radius of the visible photosphere. The deconvolved FOC images consistently show an unresolved bright region located in the southwestern quadrant of the disk, where we observed the plume with NACO. Gilliland & Dupree (1996) estimate that the spot temperature is 200 K hotter than the surrounding chromosphere. The chromosphere observed atλ=255 nm with HST/FOC is on average much hotter ( 5000 K) than the overall effective temperature of the star ( 3600 K, Perrin et al. 2004).
7 P. Kervella et al.: Adaptive optics spectro-imaging of Betelgeuse 7 In October 1995, Burns et al. (1997) used the COAST interferometer atλ=0.80µm to observe Betelgeuse and found no asymmetry of the stellar disk itself, but their reconstructed image (their Fig. 4) shows an extension along the northeastsouthwest direction (PA 200 ), aligned with the NACO plume. Further observations obtained in November 1997 with COAST and the WHT telescope at visible and near infrared wavelengths (0.70, 0.91 and 1.29µm) by Young et al. (2000) also showed an asymmetry of the light distribution on the disk, that tends to decrease as wavelength increases. Interestingly, their 1.29 µm observations do not show any asymmetry, while our observations with NACO at 1.28 µm still show the presence of the southwestern plume. Tuthill et al. (1997) also used the WHT telescope in aperture masking mode around λ = 0.70 µm between January 1992 and December Depending on the epoch, they identified two to three hot spots with changing positions, and relative flux contributions of up to 20%, on the surface of Betelgeuse. Betelgeuse was observed in early 1998 by Hinz et al. (1998) using nulling interferometry in the mid-infrared (λ = 10 µm) with two mirrors of the Multiple Mirror Telescope separated by a baseline of 5 meters. This interferometric technique allows to cancel out the light from the unresolved star, leaving as a residual the emission from the circumstellar environment. Their resulting nulled image (their Fig. 3) shows a very extended ( 5 in diameter) asymmetric dusty envelope, with extensions in the southwestern, northwestern and northeastern directions, similar to the positions of the three plumes we observed with NACO. Smith et al. (2009) recently found a mildly clumpy, spherical shell around Betelgeuse in CO emission, from spatially resolved spectroscopy at λ 4.6 µm. Some interesting structures were detected 1 west of the star, but their identification to a mass loss event or envelope asymmetry is unclear. The single-mode two-telescope interferometric observations obtained by Perrin et al. (2004) and Chagnon et al. (2002) respectively in the K and L bands provided high accuracy photospheric angular diameters of Betelgeuse (θ LD K = 43.7± 0.10 mas,θ UD L = 42.17± 0.05 mas). However, due to the absence of closure phase measurements, it was not possible to check for the presence of asymmetry on the stellar disk. New observations of Betelgeuse with the three-telescope beam combiner IONIC installed at the IOTA interferometer were obtained in October 2005 and March 2006 by Haubois et al. (2006) in the infrared H band. They point at the presence of one very faint hot spot (relative flux 0.5%) in the northwestern quadrant of Betelgeuse (through model-fitting), or alternatively at two hot spots close to the center of the disk (through image reconstruction). Spectrally dispersed interferometric observations of Betelgeuse in the K band (obtained in January 2008) are reported by Ohnaka et al. (2009). These authors find a centrally symmetric emission on the apparent disk of the star in the continuum, but an inhomogeneous velocity field in the 2.303µm CO line, with a North-South preferential direction. This direction appears consistent with the preferential axis of the main plume we detected with NACO. At thermal infrared wavelengths (λ = µm), Tatebe et al. (2007) identified an asymmetry on the disk of Betelgeuse from three-telescope interferometric observations with the ISI instrument obtained in November and December They interpreted this asymmetry as the signature of a hot spot located on the southern limb of the star at a PA of This position is compatible with the PA of the plume we detect with NACO. Perrin et al. (2007) observed Betelgeuse with the two-telescope instrument VLTI/MIDI in the N band (λ= µm), detecting a molecular layer (the MOLsphere) containing H 2 O, SiO and Al 2 O 3 at a radius of 1.4 R from the star Rotation The rotation of a supergiant star as Betelgeuse is expected to be very slow, but it can have non-negligible effects on the stellar atmosphere structure. Uitenbroek et al. (1998) presented a detailed analysis of the HST/GHRS spectra first reported by Gilliland & Dupree (1996). They showed that chromospheric emission in the UV emission lines of Mg II extends to 270 mas from the center of the star, twice further than the UV continuum. In addition, thanks to a scanning of the instrument over the stellar disk, they could determine the projected rotational velocity of (v sin i=5 km/s), the PA of its polar axis (PA 235 ) and the inclination of the polar axis on the line of sight of (i=20 ). From spectroscopy and theoretical considerations, Gray (2000) obtained a similar rotational velocity. This position of the polar cap is compatible with the hot spot visible in the FOC images and the PA of the southwestern plume observed in our NACO images (PA= 200±20 ) 4.4. Origin of the southwestern plume The presence of the bright southwestern plume detected with NACO implies that the spherical symmetry observed on the infrared photosphere of Betelgeuse is not preserved in its close environment. Among the plausible mechanisms to explain its presence, two appear as promising: convection and rotation. Following the proposal by Schwarzschild (1975) and the simulation results by Freytag & Höfner (2008), a first hypothesis is that the very large convection cells enhance locally the massloss from the star, creating the observed plumes of molecules. However, although many studies have shown that the photosphere of Betelgeuse presents a significant degree of asymmetry, variable with time, the link with the chromosphere and the envelope remains to be established. A second hypothesis is that mass loss may be enhanced above the polar cap of the star, creating the southwestern plume of Betelgeuse. This possibility is supported by the HST imaging and spectroscopy by Uitenbroek et al. (1998), as it reveals the presence of a hot spot that could be located at the pole of the star. An interaction between this hot spot and the extended chromosphere of the star could result in a preferential production of molecules above the pole and the creation of a plume. 5. Conclusion From diffraction-limited observations in ten narrow-band filters spread over the JHK spectral domain, we find evidence for the presence of a complex CSE around Betelgeuse. The most conspicuous feature of this envelope is a bright plume extending in the southwestern quadrant up to a minimum distance of six photospheric radii. Its SED in emission appears complementary to a strong absorption feature present in the J band ( µm) on the photospheric spectrum. This points at the presence of a molecular layer, possibly CN, although the formal identification of the spectral signature of this molecule in the K band is not established. Two hypotheses could explain the formation of the plume: convection causing an enhanced mass loss above a large upwards moving convective cell, or rotation, through the presence of a hot spot at the location of the polar cap of the star. Further spectro-imaging observations resolving the photosphere
8 8 P. Kervella et al.: Adaptive optics spectro-imaging of Betelgeuse of Betelgeuse (e.g. by interferometry) should allow to discriminate between these possibilities, if a link can be established between photospheric hot spots (characteristic of convection) and the detected plume. Acknowledgements. We thank Dr. C. Lidman for his help in the preparation of these observations, and the ESO Paranal staff for their perfect execution in visitor mode at the telescope. STR acknowledges partial support by NASA grant NNH09AK731. This work also received the support of PHASE, the high angular resolution partnership between ONERA, Observatoire de Paris, CNRS and University Denis Diderot Paris 7. This research took advantage of the SIMBAD and VIZIER databases at the CDS, Strasbourg (France), and NASA s Astrophysics Data System Bibliographic Services. References Bester, M., Danchi, W. C., Hale, D., et al. 1996, ApJ, 463, 336 Burns, D., Baldwin, J. E., Boysen, R. C., et al. 1997, MNRAS, 290, L11 Buscher, D. F., Haniff, C. A., Baldwin, J. E., & Warner, P. J. 1990, MNRAS, 245, 7 Castelli, F. & Kurucz, R. L. 2003, Proc. IAU Symposium 210, Modelling of Stellar Atmospheres, Uppsala, Sweden, eds. N.E. Piskunov, W.W. Weiss. and D.F. Gray, 2003, ASP-S210, arxiv:astro-ph/ Cayrel de Strobel, G., Soubiran, C., & Ralite N. 2001, A&A, 373, 159 Chagnon, G., Mennesson, B., Perrin, G., et al. 2002, AJ, 124, 2821 Christou, J. C., Hesden, J. C., & Hege, E. K. 1988, ApJ, 327, 894 Claret, A., 2000, A&A, 363, 1081 Cushing, M. C., Rayner, J. T., & Vacca, W. D. 2005, ApJ, 623, 1115 Freytag, B., & Höfner, S. 2008, A&A, 483, 571 Gilliland, D. L., & Dupree, A. K. 1996, ApJ, 463, L29 Gray, D. F. 2000, ApJ, 532, 487 Haubois, X., Perrin, G., Lacour, S., et al. 2006, Proc. SF2A conf., Eds.: D. Barret, F. Casoli, G. Lagache, A. Lecavelier, L. Pagani, 471, Hebden, J. C., Eckart, A., & Hege, E. K. 1987, ApJ, 314, 690 Hinz, P. M., Angel, J. R. P., Hoffman, W. F., et al. 1998, Nature, 395, 251 Jennings, D. E., & Sada, P. V. 1998, Science, 279, 844 Karovska, M., Nisenson, P., & Noyes, R. 1986, ApJ, 308, 260 Lenzen, R., Hofmann, R., Bizenberger, P., & Tusche, A. 1998, SPIE 3354, 606 Lord, S. D. 1992, NASA Technical Memorandum Masciadri, E., Brandner, W., Bouy, H. et al. 2003, A&A, 411, 157 McNeil, S. R., & Moody, J. W. 2005, ApJ, 627, 701 Ohnaka, K., Hofmann, K.-H., Benisty, M., et al. 2009, A&A, in press, arxiv: Perrin, G., Ridgway, S. T., Coudé du Foresto, V., et al. 2004, A&A, 418, 675 Perrin, G., Verhoelst, T., Ridgway, S. T., et al. 2007, A&A, 474, 599 Richichi, A., & Roccatagliata, V. 2005, A&A, 433, 305 Roddier, C., & Roddier, F. 1983, ApJ, 270, L23 Roddier, F., & Roddier, C. 1985, ApJ, 295, L21 Roddier, F., Roddier, C., Petrov, R., et al. 1986, ApJ, 305, L77 Rousset, G., Lacombe, F., Puget, F., et al. 2003, Proc. SPIE 4839, 140 Schwarzschild, M. 1975, ApJ, 195, 137 Smith, N., Hinkle, K. H., & Ryde, N. 2009, AJ, 137, 3558 Tatebe, K., Chandler, A. A., Wishnow, E. H., et al. 2007, ApJ, 670, L21 Tsuji, T. 2000, ApJ, 538, 801 Tuthill, P. G., Haniff, C. A., & Baldwin, J. E. 1997, MNRAS, 285, 529 Uitenbroek, H., Dupree, A. K., & Gilliland, R. L. 1998, AJ, 116, 2501 Verhoelst, T., Decin, L., van Malderen, R.,et al. 2006, A&A, 447, 311 Young, J. S., Baldwin, J. E., Boysen, R. C., et al. 2000, MNRAS, 315, 635 Wilson, R. W.., Baldwin, J. E., Buscher, D. F., & Warner, P. J. 1992, MNRAS, 257, 369 Wing, R. F., & Spinrad, H. 1970, ApJ, 159, 973 Woolf, N. J., Schwarzschild, M., & Rose, W. K. 1964, ApJ, 140, 833


9 P. Kervella et al.: Adaptive optics spectro-imaging of Betelgeuse 9 Fig. 2. Average NACO images of Betelgeuse (left image of each column) and the PSF calibrator Aldebaran (right image of each column) in 10 narrow-band filters from 1.04 to 2.17 µm. The color scale is a function of the square root of the flux, normalized to the maximum and minimum value of each image, in order to emphasize the fainter parts of the images. The white disks in the lower right corners of the 1.04 µm images represent the photospheric angular diameters of Betelgeuse and Aldebaran.

10 10 P. Kervella et al.: Adaptive optics spectro-imaging of Betelgeuse Fig. 6. Lucy-Richardson deconvolved images of Betelgeuse (30 iterations). For each wavelength, the left image is the full-dynamic linear color scale image normalized to the maximum and minimum values. The 10 contours plotted in red correspond to flux levels of 1 000, 2 000, 4 000, 8 000, , , , and W.m 2.µm 1.sr 1. The right image uses a square root color scale with narrower color cuts (including 95% of the pixels) to emphasize the faint extensions of the CSE. The green circle corresponds to the 43.7 mas photospheric angular diameter of the star as measured by Perrin et al. (2004) from K band interferometric observations.
11 Table 1. Log of Betelgeuse observations with NACO. P. Kervella et al.: Adaptive optics spectro-imaging of Betelgeuse, Online Material p 1 Code Date & UT Object Filter ND a FOV DIT b N σ c AM c (pixels) (ms) ( ) T01:42: Aldebaran NB T01:44: Aldebaran NB T01:46: Aldebaran NB T01:48: Aldebaran NB T01:50: Aldebaran NB T01:52: Aldebaran NB T01:54: Aldebaran NB T01:56: Aldebaran NB T01:59: Aldebaran NB T02:01: Aldebaran NB T02:11: Betelgeuse NB T02:15: Betelgeuse NB T02:19: Betelgeuse NB T02:23: Betelgeuse NB T02:26: Betelgeuse NB T02:29: Betelgeuse NB T02:32: Betelgeuse NB T02:35: Betelgeuse NB T02:38: Betelgeuse NB T02:41: Betelgeuse NB T02:44: Betelgeuse NB T00:55: δ Phe NB T00:58: δ Phe NB T01:00: δ Phe NB T01:02: δ Phe NB T01:13: Aldebaran NB T01:16: Aldebaran NB T01:19: Aldebaran NB T01:21: Aldebaran NB T01:23: Aldebaran NB T01:32: Betelgeuse NB T01:34: Betelgeuse NB T01:36: Betelgeuse NB T01:38: Betelgeuse NB T01:41: Betelgeuse NB T01:44: Betelgeuse NB T01:46: Betelgeuse NB T01:49: Betelgeuse NB T01:51: Betelgeuse NB T01:54: Betelgeuse NB T02:02: Aldebaran NB T02:04: Aldebaran NB T02:07: Aldebaran NB T02:09: Aldebaran NB T02:12: Aldebaran NB T02:14: Aldebaran NB T02:16: Aldebaran NB T02:18: Aldebaran NB T02:22: Aldebaran NB T02:24: Aldebaran NB T02:32: Betelgeuse NB T02:34: Betelgeuse NB T02:37: Betelgeuse NB T02:39: Betelgeuse NB T02:41: Betelgeuse NB T02:44: Betelgeuse NB T02:46: Betelgeuse NB T02:48: Betelgeuse NB T02:51: Betelgeuse NB
12 P. Kervella et al.: Adaptive optics spectro-imaging of Betelgeuse, Online Material p 2 Table 1. continued T02:53: Betelgeuse NB T03:11: Ori NB T03:13: Ori NB T03:15: Ori NB T03:18: Ori NB a b c The symbol indicates that the neutral density filter was used ( indicates it was not used). DIT is the detector integration time. σ is the DIMM seeing at Paranal in the visible and AM is the airmass.
THE SPHERE VIEW OF BETELGEUSE
 Title : will be set by the publisher Editors : will be set by the publisher EAS Publications Series, Vol.?, 2013 THE SPHERE VIEW OF BETELGEUSE O. Chesneau 1, H.-M. Schmid 2, M. Carbillet 3, A. Chiavassa
Exploring the water and carbon monoxide shell around Betelgeuse with VLTI/AMBER
 Exploring the water and carbon monoxide shell around Betelgeuse with VLTI/AMBER Miguel Montargès, Pierre Kervella, Guy Perrin, Keiichi Ohnaka To cite this version: Miguel Montargès, Pierre Kervella, Guy
IR spectro-interferometry of cool evolved stars
 IR spectro-interferometry of cool evolved stars Keiichi Ohnaka Max-Planck-Institut für Radioastronomie Infrared Interferometry Group 1) Mid-IR interferometry of Mira stars 2) Near-IR spectro-interferometry
Imaging the complex atmosphere of cool evolved stars Observing stars like the Sun
 Imaging the complex atmosphere of cool evolved stars Observing stars like the Sun Keiichi Ohnaka Max Planck Institute for Radio Astronomy Bonn, Germany Graphics: L. Calçada (ESO) Mass-loss in cool evolved
How to calibrate interferometric data
 National Aeronautics and Space Administration Jet Propulsion Laboratory California Institute of Technology How to calibrate interferometric data Rachel Akeson 28 July 2006 Outline Calibration basics System
The close-in companion of the fast rotating Be star Achernar
 Astronomy & Astrophysics manuscript no. ms09765 c ESO 2013 December 13, 2013 Letter to the Editor The close-in companion of the fast rotating Be star Achernar P. Kervella 1, A. Domiciano de Souza 2, and
Characterizing Closure-phase Measurements at IOTA
 Characterizing Closure-phase Measurements at IOTA Ragland, S. 1,2,3, Traub, W. 1, Berger, J.-P. 4, Millan-Gabet, R. 5, Monnier, J. D. 6, Pedretti, E. 6, Schloerb, F. P. 7, Carleton, N. P. 1, Haguenauer,
Exoplanets Direct imaging. Direct method of exoplanet detection. Direct imaging: observational challenges
 Black body flux (in units 10-26 W m -2 Hz -1 ) of some Solar System bodies as seen from 10 pc. A putative hot Jupiter is also shown. The planets have two peaks in their spectra. The short-wavelength peak
arxiv: v1 [astro-ph.sr] 24 Jun 2011
![arxiv: v1 [astro-ph.sr] 24 Jun 2011](/thumbs/90/102832455.jpg "arxiv: v1 [astro-ph.sr] 24 Jun 2011") Astronomy & Astrophysics manuscript no. Betelgeuse-VISIR-v2r2 c ESO 2013 January 29, 2013 The close circumstellar environment of Betelgeuse II. Diffraction-limited spectro-imaging from 7.76 to 19.50 µm
Astronomy & Astrophysics manuscript no. Betelgeuse-VISIR-v2r2 c ESO 2013 January 29, 2013 The close circumstellar environment of Betelgeuse II. Diffraction-limited spectro-imaging from 7.76 to 19.50 µm
Speckles and adaptive optics
 Chapter 9 Speckles and adaptive optics A better understanding of the atmospheric seeing and the properties of speckles is important for finding techniques to reduce the disturbing effects or to correct
Jacques M. Beckers Advanced Development Program National Optical Astronomy Observatory * Tucson, Arizona 85726
 RESULTS FROM OPTICAL INTERFEROMETRY Jacques M. Beckers Advanced Development Program National Optical Astronomy Observatory * Tucson, Arizona 85726 ABSTRACT. The techniques of optical speckle and Michelson
Exoplanets Direct imaging. Direct method of exoplanet detection. Direct imaging: observational challenges
 Black body flux (in units 10-26 W m -2 Hz -1 ) of some Solar System bodies as seen from 10 pc. A putative hot Jupiter is also shown. The planets have two peaks in their spectra. The short-wavelength peak
, Th. Preibisch ', P. Stee 2, G. Weigelt ' Max-Planck-Institut f ur Radioastronomie, Auf dem H ugel 69, Bonn, Germany
 Stars with the B[e] phenomenon ASP Conference Series, Vol. **VOLUME**, Michaela Kraus & Anatoly S. Miroshnichenko The vicinity of the galactic supergiant B [e] star CPD-7 7 from near- and mid-ir long baseline
G.Witzel Physics and Astronomy Department, University of California, Los Angeles, CA , USA
 E-mail: shahzaman@ph1.uni-koeln.de A.Eckart E-mail: eckart@ph1.uni-koeln.de G.Witzel Physics and Astronomy Department, University of California, Los Angeles, CA 90095-1547, USA N. Sabha M. Zamaninasab
Near -IR interferometry:
 Near -IR interferometry: spectrally dispersed JHK-band IOTA / GI2T interferograms, advantages of NIR, and aims Gerd Weigelt Max-Planck Institute for Radioastronomy, Bonn Plan Interferometry with spectrally
The molecular and dusty composition of Betelgeuse s inner circumstellar environment ABSTRACT
 A&A 474, 599 608 (2007) DOI: 10.1051/0004-6361:20077863 c ESO 2007 Astronomy & Astrophysics The molecular and dusty composition of Betelgeuse s inner circumstellar environment G. Perrin 1,T.Verhoelst 2,,S.T.Ridgway
SpectroWeb: An Interactive Graphical Database of Digital Stellar Spectral Atlases
 : An Interactive Graphical Database of Digital Stellar Spectral Atlases arxiv:0707.3722v1 [astro-ph] 25 Jul 2007. A. LOBEL 1 1 Royal Observatory of Belgium, Ringlaan 3, Brussels, B-1180, Belgium ABSTRACT
The innermost circumstellar environment of massive young stellar objects revealed by infrared interferometry
 The innermost circumstellar environment of massive young stellar objects revealed by infrared interferometry Thomas Preibisch, Stefan Kraus, Keiichi Ohnaka Max Planck Institute for Radio Astronomy, Bonn
Extraction of Point Source Spectra from STIS Long Slit Data
 1997 HST Calibration Workshop Space Telescope Science Institute, 1997 S. Casertano, et al., eds. Extraction of Point Source Spectra from STIS Long Slit Data J. R. Walsh Spect Telescope European Coordinating
E-ELT METIS * AND MATISSE: PROSPECTS FOR AGB-STARS
 E-ELT METIS * AND MATISSE: PROSPECTS FOR AGB-STARS J. Hron 1, J. Blommaert 2, L. Decin 2, T. Lebzelter 1, C. Paladini 3,1, H. Van Winckel 2 and the METIS and MATISSE teams (1) Universitätssternwarte Wien,
THE EVOLVING SHAPES OF o CETI AND R LEONIS
 The Astrophysical Journal, 689:1289Y1294, 2008 December 20 # 2008. The American Astronomical Society. All rights reserved. Printed in U.S.A. THE EVOLVING SHAPES OF o CETI AND R LEONIS K. Tatebe, E. H.
Interferometric Observations of Supergiants: Direct Measures of the Very Largest Stars
 Interferometric Observations of Supergiants: Direct Measures of the Very Largest Stars Gerard T. van Belle PRIMA Instrument Scientist Observatory April 7, 2008 Interferometric Observations of Supergiants:
Calibration of ACS Prism Slitless Spectroscopy Modes
 The 2005 HST Calibration Workshop Space Telescope Science Institute, 2005 A. M. Koekemoer, P. Goudfrooij, and L. L. Dressel, eds. Calibration of ACS Prism Slitless Spectroscopy Modes S. S. Larsen, M. Kümmel
McMath-Pierce Adaptive Optics Overview. Christoph Keller National Solar Observatory, Tucson
 McMath-Pierce Adaptive Optics Overview Christoph Keller National Solar Observatory, Tucson Small-Scale Structures on the Sun 1 arcsec Important astrophysical scales (pressure scale height in photosphere,
The Binary System VV Cephei Eclipse Campaign 2017/2019 OHP-Meeting July 2017
 The Binary System VV Cephei Eclipse Campaign 2017/2019 OHP-Meeting July 2017 Ernst Pollmann International Working Group Active Spectroscopy in Astronomy http://astrospectroscopy.de 3 One of the best known
THE OBSERVATION AND ANALYSIS OF STELLAR PHOTOSPHERES
 THE OBSERVATION AND ANALYSIS OF STELLAR PHOTOSPHERES DAVID F. GRAY University of Western Ontario, London, Ontario, Canada CAMBRIDGE UNIVERSITY PRESS Contents Preface to the first edition Preface to the
Spectroscopy of giants and supergiants! Maria Bergemann MPIA Heidelberg"
 Spectroscopy of giants and supergiants! Maria Bergemann MPIA Heidelberg" Spectroscopy of (cool) giants and supergiants! Maria Bergemann MPIA Heidelberg" Outline! Motivation why do spectroscopy of giant
Fundamental stellar parameters
 Fundamental stellar parameters flux received at Earth f º = direct determination of Teff R = radius of the spherical star, D = distance to the star. Luminosity : L = 4π R 2 F º dº T eff 4 = 4π R 2 F =
NICMOS Status and Plans
 1997 HST Calibration Workshop Space Telescope Science Institute, 1997 S. Casertano, et al., eds. NICMOS Status and Plans Rodger I. Thompson Steward Observatory, University of Arizona, Tucson, AZ 85721
A down-to-earth guide to high-resolution solar observations. Kevin Reardon National Solar Observatory
 A down-to-earth guide to high-resolution solar observations Kevin Reardon kreardon@nso.edu National Solar Observatory Seeing Adaptive Optics Image Reconstruction Atmospheric Effects Spectral Lines Calibration
arxiv: v1 [astro-ph.sr] 21 Sep 2011
![arxiv: v1 [astro-ph.sr] 21 Sep 2011](/thumbs/87/95827975.jpg "arxiv: v1 [astro-ph.sr] 21 Sep 2011") **Volume Title** ASP Conference Series, Vol. **Volume Number** **Author** c **Copyright Year** Astronomical Society of the Pacific Weighing Betelgeuse: Measuring the mass ofαorionis from stellar limb-darkening
**Volume Title** ASP Conference Series, Vol. **Volume Number** **Author** c **Copyright Year** Astronomical Society of the Pacific Weighing Betelgeuse: Measuring the mass ofαorionis from stellar limb-darkening
Field Tests of elongated Sodium LGS wave-front sensing for the E-ELT
 Florence, Italy. May 2013 ISBN: 978-88-908876-0-4 DOI: 10.12839/AO4ELT3.13437 Field Tests of elongated Sodium LGS wave-front sensing for the E-ELT Gérard Rousset 1a, Damien Gratadour 1, TIm J. Morris 2,
About the angular diameter of red supergiant stars
 Mass loss of evolved stars Betlegeuse/PIONIER Antares/PIONIER CE Tau/PIONIER Conclusion About the angular diameter of red supergiant stars Miguel Montargès (IRAM) VLTI Community Days ESO Garching - March
SPATIALLY RESOLVED STIS SPECTRA OF BETELGEUSE S UPPER CHROMOSPHERE AND CIRCUMSTELLAR DUST ENVELOPE. A. Lobel
 1 SPATIALLY RESOLVED STIS SPECTRA OF BETELGEUSE S UPPER CHROMOSPHERE AND CIRCUMSTELLAR DUST ENVELOPE A. Lobel Harvard-Smithsonian Center for Astrophysics, 60 Garden Street, Cambridge, 02138 MA, USA Abstract
VLTI/AMBER studies of the atmospheric structure and fundamental parameters of red giant and supergiant stars
 **Volume Title** ASP Conference Series, Vol. **Volume Number** **Author** c **Copyright Year** Astronomical Society of the Pacific VLTI/AMBER studies of the atmospheric structure and fundamental parameters
End-to-end model for the Polychromatic Laser Guide Star project (ELP-OA)
") 1st AO4ELT conference, 04006 (2010) DOI:10.1051/ao4elt/201004006 Owned by the authors, published by EDP Sciences, 2010 End-to-end model for the Polychromatic Laser Guide Star project (ELP-OA) N. Meilard
1st AO4ELT conference, 04006 (2010) DOI:10.1051/ao4elt/201004006 Owned by the authors, published by EDP Sciences, 2010 End-to-end model for the Polychromatic Laser Guide Star project (ELP-OA) N. Meilard
The dusty disk and companion of L2 Puppis, a near AGB star, observed with VLT/SPHERE
 Characteristics VLT/NACO observations VLT/SPHERE observations Open questions The dusty disk and companion of L2 Puppis, a near AGB star, observed with VLT/SPHERE M. Montargès (IRAM), P. Kervella (CNRS/U.
Investigating Molecular Hydrogen in Active Regions with IRIS
 Investigating Molecular Hydrogen in Active Regions with IRIS Sarah A. Jaeggli1, Philip G. Judge2, Steven H. Saar3, Adrian N. Daw4, & The IRIS Team 1 Montana State University Altitude Observatory 3 Harvard-Smithsonian
INTERFEROMETRIC OBSERVATIONS OF EVOLVED STARS
 INTERFEROMETRIC OBSERVATIONS OF EVOLVED STARS Iva KAROVICOVA MPIA Heidelberg, Germany M. WITTKOWSKI ESO Garching, Germany D. A. BOBOLTZ Naval Observatory, USA E. FOSSAT Observatoire de la Côte d'azur,
The VLT dealing with the Atmosphere, a Night Operation point of view
 The VLT dealing with the Atmosphere, a Night Operation point of view Julio Navarrete European Organization for Astronomical Research in the Southern Hemisphere Alonso de Cordova 3107, Vitacura, Santiago-Chile
INFRARED SPECTRA AND VISIBILITIES AS PROBES OF THE OUTER ATMOSPHERES OF RED SUPERGIANT STARS
 3rd version INFRARED SPECTRA AND VISIBILITIES AS PROBES OF THE OUTER ATMOSPHERES OF RED SUPERGIANT STARS TAKASHI TSUJI Institute of Astronomy, School of Science, The University of Tokyo 2-21-1, Osawa,
The Potential of Ground Based Telescopes. Jerry Nelson UC Santa Cruz 5 April 2002
 The Potential of Ground Based Telescopes Jerry Nelson UC Santa Cruz 5 April 2002 Contents Present and Future Telescopes Looking through the atmosphere Adaptive optics Extragalactic astronomy Planet searches
1. Give short answers to the following questions. a. What limits the size of a corrected field of view in AO?
 Astronomy 418/518 final practice exam 1. Give short answers to the following questions. a. What limits the size of a corrected field of view in AO? b. Describe the visibility vs. baseline for a two element,
]) by fitting it with a uniform disk visibility curve. The raw visibilities were calibrated by observing Tau, 1. INTRODUCTION 2.
![]) by fitting it with a uniform disk visibility curve. The raw visibilities were calibrated by observing Tau, 1. INTRODUCTION 2.](/thumbs/89/99050148.jpg "]) by fitting it with a uniform disk visibility curve. The raw visibilities were calibrated by observing Tau, 1. INTRODUCTION 2.") The Astrophysical Journal, 588:1064 1071, 2003 May 10 # 2003. The American Astronomical Society. All rights reserved. Printed in U.S.A. INTERFEROMETRY ON MIRA IN THE MID-INFRARED: CYCLIC VARIABILITY OF
The Astrophysical Journal, 588:1064 1071, 2003 May 10 # 2003. The American Astronomical Society. All rights reserved. Printed in U.S.A. INTERFEROMETRY ON MIRA IN THE MID-INFRARED: CYCLIC VARIABILITY OF
1. The AGB dust budget in nearby galaxies
 **Volume Title** ASP Conference Series, Vol. **Volume Number** **Author** c **Copyright Year** Astronomical Society of the Pacific Identifying the chemistry of the dust around AGB stars in nearby galaxies
arxiv: v2 [astro-ph.sr] 9 Sep 2011
![arxiv: v2 [astro-ph.sr] 9 Sep 2011](/thumbs/92/109046464.jpg "arxiv: v2 [astro-ph.sr] 9 Sep 2011") Draft version January 21, 2013 Preprint typeset using L A TEX style emulateapj v. 11/10/09 THE NON-UNIFORM, DYNAMIC ATMOSPHERE OF BETELGEUSE OBSERVED AT MID-INFRARED WAVELENGTHS V. Ravi 1, E. H. Wishnow,
Draft version January 21, 2013 Preprint typeset using L A TEX style emulateapj v. 11/10/09 THE NON-UNIFORM, DYNAMIC ATMOSPHERE OF BETELGEUSE OBSERVED AT MID-INFRARED WAVELENGTHS V. Ravi 1, E. H. Wishnow,
High contrast imaging at 3-5 microns. Philip M. Hinz University of Arizona Matt Kenworthy, Ari Heinze, John Codona, Roger Angel
 High contrast imaging at 3-5 microns Philip M. Hinz University of Arizona Matt Kenworthy, Ari Heinze, John Codona, Roger Angel University of Arizona ABSTRACT The 6.5 m MMT with its integrated deformable
Spectral Resolution in Interferometry
 Spectral Resolution in Interferometry Christopher Tycner Michelson Postdoctoral Fellow @ U. S. Naval Observatory Flagstaff Station Outline Spectral Resolution in Interferometry Implementation Benefits
Pipeline reductions of AMBER calibrator data
 Pipeline reductions of AMBER calibrator data Christian A. Hummel ESO, Karl-Schwarzschild-Str. 2, 85748 Garching, Germany ABSTRACT Service (and visitor) mode operations by ESO involving the three-beam NIR
Measurement of the stellar irradiance
 Measurement of the stellar irradiance Definitions Specific Intensity : (monochromatic) per unit area normal to the direction of radiation per unit solid angle per unit wavelength unit (or frequency) per
Phase-Referencing and the Atmosphere
 Phase-Referencing and the Atmosphere Francoise Delplancke Outline: Basic principle of phase-referencing Atmospheric / astrophysical limitations Phase-referencing requirements: Practical problems: dispersion
Near-Infrared Imaging Observations of the Orion A-W Star Forming Region
 Chin. J. Astron. Astrophys. Vol. 2 (2002), No. 3, 260 265 ( http: /www.chjaa.org or http: /chjaa.bao.ac.cn ) Chinese Journal of Astronomy and Astrophysics Near-Infrared Imaging Observations of the Orion
Lab 4 Radial Velocity Determination of Membership in Open Clusters
 Lab 4 Radial Velocity Determination of Membership in Open Clusters Sean Lockwood 1, Dipesh Bhattarai 2, Neil Lender 3 December 2, 2007 Abstract We used the Doppler velocity of 29 stars in the open clusters
IMPROVING THE DECONVOLUTION METHOD FOR ASTEROID IMAGES: OBSERVING 511 DAVIDA, 52 EUROPA, AND 12 VICTORIA
 IMPROVING THE DECONVOLUTION METHOD FOR ASTEROID IMAGES: OBSERVING 511 DAVIDA, 52 EUROPA, AND 12 VICTORIA Z Robert Knight Department of Physics and Astronomy University of Hawai`i at Hilo ABSTRACT Deconvolution
PoS(NIC X)242. Evolutionary Tracks of Betelgeuse
242. Evolutionary Tracks of Betelgeuse") a Center for Astrophysics, JINA, Department of Physics, University of Notre Dame b Lawrence Livermore National Laboratory, Livermore, CA E-mail: mdolan2@nd.edu, gmathews@nd.edu, ddearborn@llnl.gov We have
a Center for Astrophysics, JINA, Department of Physics, University of Notre Dame b Lawrence Livermore National Laboratory, Livermore, CA E-mail: mdolan2@nd.edu, gmathews@nd.edu, ddearborn@llnl.gov We have
The molecular and dusty composition of Betelgeuse s inner circumstellar environment
 The molecular and dusty composition of Betelgeuse s inner circumstellar environment Guy Perrin, Tijl Verhoelst, Stephen Ridgway, Jan Cami, Quynh Nhu Nguyen, Olivier Chesneau, Bruno Lopez, Christoph Leinert,
TECHNICAL REPORT. Doc #: Date: Rev: JWST-STScI , SM-12 August 31, Authors: Karl Gordon, Ralph Bohlin. Phone:
 When there is a discrepancy between the information in this technical report and information in JDox, assume JDox is correct. TECHNICAL REPORT Title: Title: JWST Absolute Flux Calibration II: Expanded
THE ASYMMETRIC DUST ENVIRONMENT OF IK TAURI
 The Astrophysical Journal, 636:1067 1077, 2006 January 10 # 2006. The American Astronomical Society. All rights reserved. Printed in U.S.A. THE ASYMMETRIC DUST ENVIRONMENT OF IK TAURI J. Weiner, K. Tatebe,
Suppressing Speckle Noise for Simultaneous Differential Extrasolar Planet Imaging (SDI) at the VLT and MMT
 at the VLT and MMT") Direct Imaging of Exoplanets: Science and Techniques Proceedings IAU Colloquium No. 200, 2005 C. Aime and F. Vakili, Eds. c 2005 International Astronomical Union DOI: 00.0000/X000000000000000X Suppressing
Direct Imaging of Exoplanets: Science and Techniques Proceedings IAU Colloquium No. 200, 2005 C. Aime and F. Vakili, Eds. c 2005 International Astronomical Union DOI: 00.0000/X000000000000000X Suppressing
CHEMICAL ABUNDANCE ANALYSIS OF RC CANDIDATE STAR HD (46 LMi) : PRELIMINARY RESULTS
 : PRELIMINARY RESULTS") Dig Sites of Stellar Archeology: Giant Stars in the Milky Way Ege Uni. J. of Faculty of Sci., Special Issue, 2014, 145-150 CHEMICAL ABUNDANCE ANALYSIS OF RC CANDIDATE STAR HD 94264 (46 LMi) : PRELIMINARY
Dig Sites of Stellar Archeology: Giant Stars in the Milky Way Ege Uni. J. of Faculty of Sci., Special Issue, 2014, 145-150 CHEMICAL ABUNDANCE ANALYSIS OF RC CANDIDATE STAR HD 94264 (46 LMi) : PRELIMINARY
Science Opportunities in Stellar Physics. Douglas R. Gies CHARA, Georgia State Univ., and the Stellar Physics Working Group
 Science Opportunities in Stellar Physics Douglas R. Gies CHARA, Georgia State Univ., gies@chara.gsu.edu and the Stellar Physics Working Group General Themes! Fundamental properties! Interior structure
Absolute Flux Calibration for STIS First-Order, Low-Resolution Modes
 Instrument Science Report STIS 97-14 Absolute Flux Calibration for STIS First-Order, Low-Resolution Modes Ralph Bohlin, Space Telescope Science Institute Nicholas Collins, Hughes STX/LASP/GSFC Anne Gonnella,
Near-infrared guiding and tip-tilt correction for the UC Berkeley Infrared Spatial Interferometer
 Near-infrared guiding and tip-tilt correction for the UC Berkeley Infrared Spatial Interferometer E. A. Lipman, M. Bester, W. C. Danchi, and C. H. Townes Space Sciences Laboratory and Department of Physics
Keck Adaptive Optics Note 1069
 Keck Adaptive Optics Note 1069 Tip-Tilt Sensing with Keck I Laser Guide Star Adaptive Optics: Sensor Selection and Performance Predictions DRAFT to be updated as more performance data becomes available
Adaptive Optics for the Giant Magellan Telescope. Marcos van Dam Flat Wavefronts, Christchurch, New Zealand
 Adaptive Optics for the Giant Magellan Telescope Marcos van Dam Flat Wavefronts, Christchurch, New Zealand How big is your telescope? 15-cm refractor at Townsend Observatory. Talk outline Introduction
The Effective Spectral Resolution of the WFC and HRC Grism
 The Effective Spectral Resolution of the WFC and HRC Grism A. Pasquali, N. Pirzkal, J.R. Walsh, R.N. Hook, W. Freudling, R. Albrecht, R.A.E. Fosbury March 7, 2001 ABSTRACT We present SLIM simulations of
Dust properties of galaxies at redshift z 5-6
 Dust properties of galaxies at redshift z 5-6 Ivana Barisic 1, Supervisor: Dr. Peter L. Capak 2, and Co-supervisor: Dr. Andreas Faisst 2 1 Physics Department, University of Zagreb, Zagreb, Croatia 2 Infrared
The HST Set of Absolute Standards for the 0.12 µm to 2.5 µm Spectral Range
 Instrument Science Report CAL/SCS-010 The HST Set of Absolute Standards for the 0.12 µm to 2.5 µm Spectral Range L. Colina, R. Bohlin, D. Calzetti, C. Skinner, S. Casertano October 3, 1996 ABSTRACT A proposal
Study of the evolution of the ACS/WFC sensitivity loss
 Instrument Science Report ACS 2013 01 Study of the evolution of the ACS/WFC sensitivity loss Leonardo Úbeda and Jay Anderson Space Telescope Science Institute January 28, 2013 ABSTRACT We present a study
A Calibration Method for Wide Field Multicolor. Photometric System 1
 A Calibration Method for Wide Field Multicolor Photometric System 1 Xu Zhou,Jiansheng Chen, Wen Xu, Mei Zhang... Beijing Astronomical Observatory,Chinese Academy of Sciences, Beijing 100080, China Beijing
Report on the new EFOSC2 VPH grisms
 Report on the new EFOSC2 VPH grisms Ivo Saviane Lorenzo Monaco v 1.0 March 01, 2008 1 Introduction In January 2008 the ULTRASPEC project delivered two volume-phased holographic grisms (VPHG) to be used
RFI Mitigation for the Parkes Galactic All-Sky Survey (GASS)
") RFI Mitigation for the Parkes Galactic All-Sky Survey (GASS) Peter Kalberla Argelander-Institut für Astronomie, Auf dem Hügel 71, D-53121 Bonn, Germany E-mail: pkalberla@astro.uni-bonn.de The GASS is a
RFI Mitigation for the Parkes Galactic All-Sky Survey (GASS) Peter Kalberla Argelander-Institut für Astronomie, Auf dem Hügel 71, D-53121 Bonn, Germany E-mail: pkalberla@astro.uni-bonn.de The GASS is a
HST Observations of the Gravitational Lens Systems HE and J03.13
 1997 HST Calibration Workshop Space Telescope Science Institute, 1997 S. Casertano, et al., eds. HST Observations of the Gravitational Lens Systems HE 1104 1805 and J03.13 M. Remy, J.-F. Claeskens, 1 and
Letter to the Editor. Revealing deuterium Balmer lines in H II regions with VLT-UVES ASTRONOMY AND ASTROPHYSICS LETTER
 Astron. Astrophys. 364, L31 L35 (2000) Letter to the Editor ASTRONOMY AND ASTROPHYSICS Revealing deuterium Balmer lines in H II regions with VLT-UVES G. Hébrard 1,D.Péquignot 2, J.R. Walsh 3, A. Vidal-Madjar
DETERMINATION OF STELLAR ROTATION WITH GAIA AND EFFECTS OF SPECTRAL MISMATCH. A. Gomboc 1,2, D. Katz 3
 537 DETERMINATION OF STELLAR ROTATION WITH GAIA AND EFFECTS OF SPECTRAL MISMATCH A. Gomboc,2, D. Katz 3 University in Ljubljana, Jadranska 9, 00 Ljubljana, Slovenia 2 ARI, Liverpool John Moores University,
The Four-Quadrant Phase Mask Coronagraph. IV. First Light at the Very Large Telescope
 Publications of the Astronomical Society of the Pacific, 116:1061 1071, 2004 November 2004. The Astronomical Society of the Pacific. All rights reserved. Printed in U.S.A. The Four-Quadrant Phase Mask
arxiv: v1 [astro-ph.sr] 23 Feb 2013
![arxiv: v1 [astro-ph.sr] 23 Feb 2013](/thumbs/72/66262834.jpg "arxiv: v1 [astro-ph.sr] 23 Feb 2013") Astronomy & Astrophysics manuscript no. DelVel4-Astrom-v3r1 c ESO 017 August, 017 The nearby eclipsing stellar system δ Velorum IV. Differential astrometry with VLT/NACO at the 100 microarcsecond level
Astronomy & Astrophysics manuscript no. DelVel4-Astrom-v3r1 c ESO 017 August, 017 The nearby eclipsing stellar system δ Velorum IV. Differential astrometry with VLT/NACO at the 100 microarcsecond level
THE ABSOLUTE DIMENSIONS OF THE OVERCONTACT BINARY FI BOOTIS
 The Astronomical Journal, 132:1153Y1157, 2006 September # 2006. The American Astronomical Society. All rights reserved. Printed in U.S.A. A THE ABSOLUTE DIMENSIONS OF THE OVERCONTACT BINARY FI BOOTIS Dirk
arxiv:astro-ph/ v1 13 May 2004
 MID INFRARED OBSERVATIONS OF VAN MAANEN 2: NO SUBSTELLAR COMPANION J. Farihi and E. E. Becklin arxiv:astro-ph/0405245v1 13 May 2004 Department of Physics & Astronomy, 8371 Math Sciences Building, University
Are dust shell models well-suited to explain interferometric data of late-type stars in the near-infrared?
 Astronomy & Astrophysics manuscript no. dust art February 23, 2004 (DOI: will be inserted by hand later) Are dust shell models well-suited to explain interferometric data of late-type stars in the near-infrared?
1 Lecture, 2 September 1999
 1 Lecture, 2 September 1999 1.1 Observational astronomy Virtually all of our knowledge of astronomical objects was gained by observation of their light. We know how to make many kinds of detailed measurements
Achieving high resolution
 Achieving high resolution Diffraction-limited performance with single telescopes with Adaptive Optics Or sparse aperture masking Use masks to sub-divide telescope primary into a numnber of subapertures
Young stellar objects and their environment
 Recent Advances in Star Formation: Observations and Theory ASI Conference Series, 2012, Vol. 4, pp 107 111 Edited by Annapurni Subramaniam & Sumedh Anathpindika Young stellar objects and their environment
CHARA Collaboration Year-Eight Science Review. VLTI update. F. Delplancke
 VLTI update F. Delplancke Summary Infrastructure Current instruments: MIDI, AMBER, PIONIER Under test & commissioning: PRIMA 2 nd generation instruments Long Range Plan Infrastructure Infrastructure 4
Introduction of near-infrared (NIR) spectroscopy. Ken-ichi Tadaki (NAOJ)
 spectroscopy. Ken-ichi Tadaki (NAOJ)") Introduction of near-infrared (NIR) spectroscopy Ken-ichi Tadaki (NAOJ) Near-infrared in astronomy absorption by terrestrial atmosphere - wavelength range of 1-5 um - observable windows are limited (J,
Introduction of near-infrared (NIR) spectroscopy Ken-ichi Tadaki (NAOJ) Near-infrared in astronomy absorption by terrestrial atmosphere - wavelength range of 1-5 um - observable windows are limited (J,
FINITO: Three-Way Interferometric Fringe Sensor for VLTI
 FINITO: Three-Way Interferometric Fringe Sensor for VLTI M. Gai 1, L. Corcione 1, M.G. Lattanzi 1, B. Bauvir 2, D. Bonino 1, D. Gardiol 1, A. Gennai 2, D. Loreggia 1, G. Massone 1, S. Menardi 2 1 INAF
Exoplanets in the mid-ir with E-ELT & METIS
 Exoplanets in the mid-ir with E-ELT & METIS Wolfgang Brandner (MPIA), Eric Pantin (CEA Saclay), Ralf Siebenmorgen (ESO), Sebastian Daemgen (MPIA/ESO), Kerstin Geißler (MPIA/ESO), Markus Janson (MPIA/Univ.
PACS Spectroscopy performance and calibration PACS Spectroscopy performance and calibration
 1 of 18 PACS Spectroscopy performance and PICC-KL-TN-041 Prepared by With inputs by Bart Vandenbussche Joris Blommaert Alessandra Contursi Helmut Feuchtgruber Christophe Jean Albrecht Poglitsch Pierre
arxiv: v1 [astro-ph] 3 Oct 2007
![arxiv: v1 [astro-ph] 3 Oct 2007](/thumbs/94/121768396.jpg "arxiv: v1 [astro-ph] 3 Oct 2007") Peremennye Zvezdy 27, No.4, 2007 Variable Stars 27, No.4, 2007 SAI, INASAN, Astronet.ru Moscow, Russia 3 October 2007 arxiv:0710.0765v1 [astro-ph] 3 Oct 2007 PHOTOMETRIC OBSERVATIONS OF SUPERNOVA 2002hh
Peremennye Zvezdy 27, No.4, 2007 Variable Stars 27, No.4, 2007 SAI, INASAN, Astronet.ru Moscow, Russia 3 October 2007 arxiv:0710.0765v1 [astro-ph] 3 Oct 2007 PHOTOMETRIC OBSERVATIONS OF SUPERNOVA 2002hh
MULTIWAVELENGTH DIFFRACTION-LIMITED IMAGING OF THE EVOLVED CARBON STAR IRC II.
 The Astrophysical Journal, 624:352 358, 2005 May 1 # 2005. The American Astronomical Society. All rights reserved. Printed in U.S.A. MULTIWAVELENGTH DIFFRACTION-LIMITED IMAGING OF THE EVOLVED CARBON STAR
Indirect Methods: gravitational perturbation of the stellar motion. Exoplanets Doppler method
 Indirect Methods: gravitational perturbation of the stellar motion Exoplanets The reflex motion of the star is proportional to M p /M * This introduces an observational bias that favours the detection
A quasi-time-dependent radiative transfer model of OH arxiv:astro-ph/ v2 22 Jun 2005
 Astronomy & Astrophysics manuscript no. 2135 February 2, 28 (DOI: will be inserted by hand later) A quasi-time-dependent radiative transfer model of OH14.9+2.4 arxiv:astro-ph/52269v2 22 Jun 25 D. Riechers
Introduction to Interferometer and Coronagraph Imaging
 Introduction to Interferometer and Coronagraph Imaging Wesley A. Traub NASA Jet Propulsion Laboratory and Harvard-Smithsonian Center for Astrophysics Michelson Summer School on Astrometry Caltech, Pasadena
arxiv: v2 [astro-ph.sr] 9 Nov 2009
![arxiv: v2 [astro-ph.sr] 9 Nov 2009](/thumbs/79/79220856.jpg "arxiv: v2 [astro-ph.sr] 9 Nov 2009") Astronomy & Astrophysics manuscript no. 12927 c ESO 2009 November 11, 2009 Imaging the spotty surface of Betelgeuse in the H band X. Haubois 1, G. Perrin 1, S. Lacour 1, T. Verhoelst 2, S. Meimon 3, L.
Astronomy & Astrophysics manuscript no. 12927 c ESO 2009 November 11, 2009 Imaging the spotty surface of Betelgeuse in the H band X. Haubois 1, G. Perrin 1, S. Lacour 1, T. Verhoelst 2, S. Meimon 3, L.
arxiv:astro-ph/ v1 2 Oct 2002
 **TITLE** ASP Conference Series, Vol. **VOLUME***, **YEAR OF PUBLICATION** **NAMES OF EDITORS** The Extra-Solar Planet Imager (ESPI) arxiv:astro-ph/0210046v1 2 Oct 2002 P. Nisenson, G.J. Melnick, J. Geary,
A NEW METHOD FOR ADAPTIVE OPTICS POINT SPREAD FUNCTION RECONSTRUCTION
 Florence, Italy. May 2013 ISBN: 978-88-908876-0-4 DOI: 10.12839/AO4ELT3.13328 A NEW METHOD FOR ADAPTIVE OPTICS POINT SPREAD FUNCTION RECONSTRUCTION J. Exposito 1a, D. Gratadour 1, G. Rousset 1, Y. Clénet
OPTICAL PHOTOMETRY. Observational Astronomy (2011) 1
 1") OPTICAL PHOTOMETRY Observational Astronomy (2011) 1 The optical photons coming from an astronomical object (star, galaxy, quasar, etc) can be registered in the pixels of a frame (or image). Using a ground-based
OPTICAL PHOTOMETRY Observational Astronomy (2011) 1 The optical photons coming from an astronomical object (star, galaxy, quasar, etc) can be registered in the pixels of a frame (or image). Using a ground-based
Reduction procedure of long-slit optical spectra. Astrophysical observatory of Asiago
 Reduction procedure of long-slit optical spectra Astrophysical observatory of Asiago Spectrograph: slit + dispersion grating + detector (CCD) It produces two-dimension data: Spatial direction (x) along
2. Stellar atmospheres: Structure
 2. Stellar atmospheres: Structure 2.1. Assumptions Plane-parallel geometry Hydrostatic equilibrium, i.e. o no large-scale accelerations comparable to surface gravity o no dynamically significant mass loss