Two-Dimensional Power, Phase, and Coherence Spectra of Solar Dynamics Observatory Helioseismic Observables
|
|
|
- Duane Pope
- 5 years ago
- Views:
Transcription
1 Solar Physics DOI: / Two-Dimensional Power, Phase, and Coherence Spectra of Solar Dynamics Observatory Helioseismic Observables Rachel Howe 1 Kiran Jain 2 RichardSBogart 3 Deborah A Haber 4 Charles S Baldner 3 c Springer Abstract While the Helioseismic and Magnetic Imager [HMI] aboard the Solar Dynamics Observatory [SDO] provides Doppler velocity [V], continuum intensity [I C ] and line depth observations, each of which is sensitive to the 5-minute acoustic spectrum, the Atmospheric Imaging Array [AIA] also observes at wavelengths specifically the 1600 and 1700 Angstrom bands that are formed in the upper photosphere and have good sensitivity to acoustic modes. In this paper we consider the characteristics of the acoustic spectra in AIA and HMI observables for a 15-degree region around active region NOAA We map the acoustic power distribution for the different observables and the HMI Line Core (Continuum minus Line Depth) and the phase and coherence functions for selected observable pairs, as a function of position and frequency. Five-minute power in all observables is suppressed in the sunspot and also in plage areas. Above the acoustic cut off frequency the behaviour is more complicated: power in HMI I C is still suppressed in the presence of surface magnetic fields, while power in HMI I L and the AIA bands is suppressed in areas of surface field but enhanced in an extended area around the active region, and power in HMI V is enhanced in a narrow zone around strong field concentrations and suppressed in a wider surrounding area. The relative phase of the observables, and their cross-coherence functions, are also altered around the active region. These effects may help us to understand the interaction of waves and magnetic fields in the different layers of the photosphere, and will need to be taken into account in multi-wavelength local helioseismic analysis of active regions. Keywords: Helioseismology, Chromospheric oscillations, Ultraviolet observations, Magnetic fields, Active regions, Acoustic power maps 1 School of Physics and Astronomy, University of Birmingham, Edgbaston, Birmingham B15 2TT, UK rhowe@noao.edu 2 National Solar Observatory, 950 N. Cherry Avenue, Tucson AZ 85719, USA 3 Stanford University, Stanford, CA , USA 4 JILA, University of Colorado, Boulder, CO, USA SOLA: ms.tex; 1 March 2012; 15:17; p. 1
2 R. Howe et al. 1. Introduction Helioseismology relies on the observation of waves, as they affect light from the outer layers of the Sun, to infer the structure and dynamics of the otherwise invisible deeper layers. By studying the oscillations in multiple wavelengths of light and hence at different heights in the atmosphere simultaneously, it is possible to probe the layers of the atmosphere. Such investigations, aiming both to better understand the behaviour of the waves and their interaction with magnetic fields, and to improve the inference of subsurface properties, have a long history. The launch in February 2010 of the Solar Dynamics Observatory [SDO], carrying both the Helioseismic and Magnetic Imager [HMI] and the Atmospheric Imaging Assembly [AIA], provides new opportunities for cross-spectral helioseismic analysis, with full-disc, high-cadence images at many UV and EUV wavelengths from AIA as well as photospheric Doppler velocity, continuum and magnetic data from HMI. As discussed by Howe et al. (2011), who considered the Sun-as-a-star spectra from the AIA and HMI observables, the AIA 1600 Å and 1700 Å near-ultraviolet bands show a clear signature of the five-minute acoustic spectrum that is much less contaminated by granulation noise than the continuum intensity in HMI s visible 6173 Å line. Both the effect of surface magnetic activity on helioseismic waves in local areas, and the phase and coherence relationships between the velocity and the intensity of radiation at different wavelengths (and hence from different heights in the solar atmosphere), have been studied for nearly two decades. Brown et al. (1992) reported finding small areas associated with active regions that produced a disproportionate amount of acoustic power in the mhz frequency band in ground-based Doppler observations using the Fe I 5576 Å line, while Braun et al. (1992) made the first observations of clear acoustic haloes around active regions in the same frequency band using Ca K intensity. However, atmospheric seeing can have confusing effects on ground-based intensity observations (Hill et al., 2001). The picture became clearer with the launch of the Michelson Doppler Imager [MDI] (Scherrer et al., 1995) aboard the Solar and Heliospheric Observatory [SOHO], which allowed full-disk observations from space in both intensity and velocity using the 6768 Å Ni line. Jain and Haber (2002) studied the power distribution in the line depth, Doppler velocity, and continuum intensity observables from MDI. In both sunspot and plage regions they found that the power in areas of strong magnetic field was suppressed in all observables, while for velocity and line depth (but not for continuum intensity) there was a halo of enhanced power surrounding the magnetic field concentrations, which they concluded was acoustic in origin. The Transition Region and Coronal Observer [TRACE] made possible high-resolution, space-based observations in the 1600 and 1700 Å bands. Judge, Tarbell, and Wilhelm (2001) used data from another SOHO instrument, SUMER (Solar Ultraviolet Measurements of Emitted Radiation), TRACE, and MDI to investigate the oscillations in the chromosphere. This work established for the first time that the chromospheric modes were primarily the same p modes seen in the photosphere. Krijger et al. (2001) used TRACE to study oscillations in the 1600 Å UV band in quiet Sun SOLA: ms.tex; 1 March 2012; 15:17; p. 2


, AIA 1600 (c), AIA 1700 (d),")
.")
,")
 and")


3 Local helioseismic power and phase for HMI and AIA UV observables Figure 1. Mean values of each observable for 2010 May 23: HMI V (a), HMI I C (b), AIA 1600 (c), AIA 1700 (d), HMI I L (e), and HMI longitudinal magnetic field strength (f). Figure 2. The mean magnetic inclination (a), courtesy K. Hayashi, an AIA 304 Å image(b) and an AIA 171 Å image (c), for the area of interest on 2010 May 23. The contours overlaid on panels a and b show the mean magnetic field strength with contours at 100G intervals. SOLA: ms.tex; 1 March 2012; 15:17; p. 3
, 5 mhz (b), 7 mhz (c), 9 mhz (d), and in longitude and temporal frequency along the horizontal line shown in panels a-d (e).")
 also looked at acoustic power around an active region in short (2 4 hour) stretches of TRACE data and did not find a high-frequency acoustic halo in the 1600 or 1700 Å bands.")
 in the 40 60 degree range. However, the exact origin of these high-frequency haloes remains unclear.")
 spatially-resolved phase measurements were made, for example, by Deubner et al.")

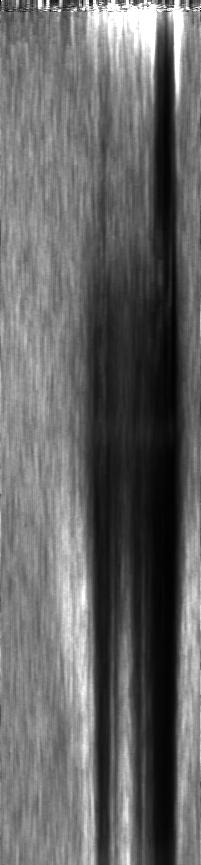
4 R. Howe et al. Figure 3. Slices through the smoothed relative-power maps for HMI I C, at 3 mhz (a), 5 mhz (b), 7 mhz (c), 9 mhz (d), and in longitude and temporal frequency along the horizontal line shown in panels a-d (e). and found enhanced power at 3-minute periods around patches of network field. Muglach (2003) also looked at acoustic power around an active region in short (2 4 hour) stretches of TRACE data and did not find a high-frequency acoustic halo in the 1600 or 1700 Å bands. Schunker and Braun (2011) have examined the power distribution for velocity observations from MDI and found that the excess high-frequency power corresponds to regions with the magnetic field inclination (as deduced from potential-field source-surface extrapolation) in the degree range. However, the exact origin of these high-frequency haloes remains unclear. The relative phase of the Doppler velocity and the intensity in various wavelength bands has been studied for more than two decades in both resolved and unresolved observations. Early (ground-based) spatially-resolved phase measurements were made, for example, by Deubner et al. (1990, 1992); in the latter paper they used three different wavelengths including the Na D line, formed in the lower chromosphere. These measurements revealed a complicated pattern of phase relationships that was not easily explained by simple models. Moretti et al. (2007) made ground-based observations from the South Pole using the MOTH instrument (Finsterle et al., 2004), taking high-cadence images in the Sodium and Potassium D-lines. The Sodium line shows clear evidence of a high-frequency halo around an active region. In this paper we will examine the behaviour and relationships of the different observables in a small region of the solar surface containing an active region as observed by HMI and AIA, and show how the power and phase of the oscillations is affected by the presence of local magnetic fields. For this purpose we will show observations of NOAA active region on 23 May We have also examined the data for the same region over the two preceding and following days; the results are very similar and for reasons of space are not shown in this paper. SOLA: ms.tex; 1 March 2012; 15:17; p. 4


. Figure 5.")
. In section 2 we will describe our")


5 Local helioseismic power and phase for HMI and AIA UV observables Figure 4. Slices through the smoothed relative-power maps for HMI V at 3 mhz (a), 5 mhz (b), 7 mhz (c), 9 mhz (d), and in longitude and temporal frequency along the horizontal line shown in panels a-d (e). Figure 5. Slices through the smoothed relative-power maps for HMI I L, at 3 mhz (a), 5 mhz (b), 7 mhz (c), 9 mhz (d), and in longitude and temporal frequency along the horizontal line shown in panels a-d (e). In section 2 we will describe our data and analysis and define the phase and coherence spectra. In section 3 we show the region in each of the observables; in section 4 we present the power maps for each observable, and in section 5 we show the phase and coherence spectra. In section 6 we discuss our findings. SOLA: ms.tex; 1 March 2012; 15:17; p. 5

, and in longitude and temporal frequency along")


![magnetogram, a Doppler velocity image [HMI V ], a](/docs-images/91/104714604/images/6-7.jpg "continuum intensity image [HMI I C ], a Line Depth")
![image [HMI Ld] and also a Line Width image, which is](/docs-images/91/104714604/images/6-8.jpg "not considered SOLA: ms.tex; 1 March 2012; 15:17; p.")
6 R. Howe et al. Figure 6. Slices through the smoothed relative-power maps for AIA 1700, at 3 mhz (a), 5 mhz (b), 7 mhz (c), 9 mhz (d), and in longitude and temporal frequency along the horizontal line shown in panels a-d (e). Figure 7. Slices through the smoothed relative-power maps for AIA 1600, at 3 mhz (a), 5 mhz (b), 7 mhz (c), 9 mhz (d), and in longitude and temporal frequency along the horizontal line shown in panels a-d (e). 2. Data and Analysis 2.1. Helioseismic Observables from the Solar Dynamics Observatory The HMI observables are produced from observations of the Fe I line at 6173 Å by combining filtergrams taken with different configurations of the instrument s filters. For each 45-second interval there is a line-of-sight magnetogram, a Doppler velocity image [HMI V ], a continuum intensity image [HMI I C ], a Line Depth image [HMI Ld] and also a Line Width image, which is not considered SOLA: ms.tex; 1 March 2012; 15:17; p. 6
7 Local helioseismic power and phase for HMI and AIA UV observables here. For this investigation we consider the HMI I C and HMI V observables and also a Line Core intensity observable [Hmi I L ] formed by taking the difference between HMI I C and HMI Ld. The resolution of the pixel images is approximately 0.5 arcsec. Norton et al. (2006) found that the height of formation of the HMI 6173 Å line spans the range from 20 km at the wings to 270 km at the core. Fleck, Couvidat, and Straus (2011) have calculated that the height of formation of the HMI Doppler velocity is approximately 100 km, slightly lower than that of the Ni 6768 Å line used by MDI. However, the finite resolution of the instruments raises the effective height of formation by about 50 km at disk centre in both cases. We can therefore say that the HMI I C observable is formed considerably lower in the atmosphere than HMI I L,withHMIV at an intermediate depth. The AIA 1600 Å images for the day analyzed have a cadence of 24 s, while the cadence for 1700 Å was 48 seconds. (More recent data have used a consistent 24s cadence for both, but the cadences were adjusted several times during the early months of AIA observations.) These images are also taken at pixels, but because AIA allows more room around the limb of the solar image the resolution is approximately 0.6 arcsec. The 1700 Åbandisbelievedtobeformed in the upper photosphere; Judge, Tarbell, and Wilhelm (2001) put it at km, around the temperature minimum between the upper photosphere and lower chromosphere. The 1600 Å band includes the C iv line and samples both the transition region at the top of the chromosphere and the upper photosphere. The calculations of Fossum and Carlsson (2005) for the equivalent TRACE bandpasses give mean formation heights of 360 km and 480 km for the 1700 and 1600 Å bands, with FWHM of 385 and 185 km respectively; these authors also note that the passbands are double peaked, with the 1700 Åinparticular having two almost equal components centered at 402 ± 259 and 208 ± 174 km. The helioseismic signal in the 1600 Å band, therefore, is in general somewhat contaminated by flare activity, but there are no strong flares during the day analysed. It seems unlikely that the strong global p-mode signal found by Howe et al. (2011) in both 1600 Å and 1700 Å bands could originate as high as the transition region, and we therefore suspect that the helioseismic response in this bandpass is associated with the continuum rather than the C iv line and pertains to a height range not very far above that involved in the 1700 Å band. We should note that the calibration and registration of the AIA data are less thorough than for the HMI data, so there is a possibility of position errors and small drifts, of the order of a fraction of a pixel over several days, which could affect comparisons at the pixel level but should not be a serious problem for the analysis described here, which involves smoothing over several detector pixels. The data were obtained from the JSOC web site, The website allows the extraction of a tracked hg patch from each image; these patches can be chosen to be centred on a given heliographic location but are not remapped. For each observable we obtained a 24-hour sequence of such patches centred on the location of AR 11072, covering the whole of 2010 May 23. These patches were based on images from the aia.lev1 series and the (level 1.5) series hmi.v 45s, hmi.ic 45s and hmi.ld 45s; these are the most final calibrations of the data available at the time of writing. The data were then remapped to a SOLA: ms.tex; 1 March 2012; 15:17; p. 7
8 R. Howe et al. common pixel grid, 15 heliographic degrees on each side, evenly spaced in heliographic latitude and longitude, and interpolated to a uniform 45 second cadence. A running mean over 15 minutes was subtracted from each remapped pixel time series to remove effects such as daily variations due to the orbit of SDO Phase and Coherence Functions The relationship between two time series in the Fourier domain can be expressed in terms of the cross-spectrum, the phase difference, and the cross-coherence, which we define as follows. Let P A (ν) andp B (ν) be the complex Fourier spectra of two time series. The cross spectrum is defined as CROSS(ν) P AB = P A (ν) PB (ν) (1) The phase difference δφ A,B can be written as δφ AB (ν) =arg P AB (ν). (2) We adopt the convention that a positive value of δφ AB means that A leads B. The coherence spectrum, a measure of the correlation of the two spectra as a function of frequency, can be written as COH AB (ν) = P AB (ν) PA (ν) 2 P B (ν) 2. (3) The angle brackets formally denote the expectation value; in practice this can be approximated by a mean over many short spectra as in the work of Elsworth et al. (1994), a smoothing by a running mean in the frequency domain, as used by Jiménez et al. (1999), or, for resolved-sun observations (Severino et al., 2001; Barban, Hill, and Kras, 2004) an average over all azimuthal orders m for a given degree l. For a finite amount of data these approximations may give slightly different results. In the present work we use a 3-dimensional boxcar smoothing of the data cube of one-dimensional power spectra, smoothing over 3 remapped pixels in the spatial direction and 0.3 mhz in temporal frequency. 3. Images In Figure 1 we show the mean image for each of the observables for 2010 May 23. On this date the active region was somewhat mature, with a well-defined leading spot and a following-polarity region consisting mostly of strong plage with a couple of small sunspots, and was close to the central meridian. In the Doppler velocity panel the supergranulation is clearly visible; the active region disrupts the supergranular pattern and produces the familiar artifactual appearance of an upflow on one side of the penumbra and a downflow on the other. The sunspot umbra and penumbra show as darkened areas in all the intensity observables, but SOLA: ms.tex; 1 March 2012; 15:17; p. 8
9 Local helioseismic power and phase for HMI and AIA UV observables the weaker fields in the following polarity region and surrounding network are bright in the AIA bands and in HMI I L. The network fields clearly correspond to the supergranule boundaries. For additional context, we show in Figure 2 the mean magnetic field inclination from Milne-Eddington inversions of HMI magnetograms and the AIA images at 304 and 171 Å, which show the structure of the overlying coronal loops that connect the leading and following regions. 4. Power Maps In order to study the local power distribution in each observable, we calculated the power spectrum in each pixel of the remapped data cubes. The spectra were then smoothed over 25 bins (about 0.3 mhz) in temporal frequency and three bins in each spatial direction, and the power at each frequency was normalized by the mean power for that frequency across the whole data cube. We now examine the power maps for each observable in turn, taking them in ascending order of height of formation HMI I C Figure 3 shows four sample relative power maps at 3, 5, 7, and 9 mhz and a slice through the stack of relative power maps at constant latitude passing through the body of the active region, for the HMI I C data cube. The acoustic cut-off frequency in quiet Sun is around 5mHz. In this case, and for all the other intensity observables, we divided each time series by the mean intensity for the pixel to remove the unwanted effects of brighter regions. Power is suppressed in the active region at all frequencies; there is very little variation in the pattern of power suppression with frequency, though there is slightly stronger suppression in the five-minute band and above than in the granulation ( 2.5 mhz) range. There is no sign of any haloes of excess power. The narrow spike of excess power within the sunspot around 5mHz is seen in only one of the other four days examined and may be a noise artifact. The power map shows somewhat finer detail at higher frequencies, presumably due to the way that the low-frequency limit of the p-mode spectrum at the f-mode ridge shifts towards higher spatial frequencies with increasing temporal frequency HMI Velocity In Figure 4 we show the results for the HMI V power. Here we see the wellknown suppression of the acoustic power in the active region in the five-minute frequency band, and a weak, broad halo of excess power surrounding the active region at 5 mhz. In the 7 mhz band the excess power has shrunk to a narrow belt outlining the active region and surrounded by a wider region of suppressed power, with a hint of a more diffuse enhancement beyond that. At this frequency, the suppression of power within the sunspot is much weaker and even cancelled out by the enhancement around the edges. Examination of the longitude-frequency slice suggests that the halo of enhanced power contracts towards the active region with increasing frequency.. SOLA: ms.tex; 1 March 2012; 15:17; p. 9
10 R. Howe et al HMI I L Figure 5 shows slices through the power maps for HMI I L. Here, there is a strong halo of excess power so strong that we have used a wider greyscale range than for the I C and V maps above about 6 mhz surrounding the active region, but farther out than that seen in the velocity observations. This region is beyond that where there is any detectable concentration of surface magnetic field, and has no obvious correspondence to the morphology of the overlying magnetic loops as revealed in the AIA 304 Å and 171 Å images. At 7 mhz, it occupies about the same area as the outer band of reduced power in the velocity power map. Within the halo, there are tendrils of power suppression that correspond to concentrations of plage field, giving it a patchy appearance. As in the velocity observations, this halo appears to contract with increasing frequency, and at 9 mhz it has collapsed to a narrow band around the sunspots, much the same as that seen in the HMI V at 7 mhz. The existence of the halo is consistent with the findings of Jain and Haber (2002), who saw a similar phenomenon in the MDI line depth observations AIA 1700 and 1600 Finally, we show the power-map slices for AIA 1700 (Figure 6) and AIA 1600 (Figure 7). As in HMI I L, the power in the active region is more strongly suppressed at 5 mhz than in the five-minute band, and suppression is also visible for weak network field concentrations in the quiet Sun. Also as seen in HMI I L,there is an outlying halo of high-frequency excess power surrounding the active region. This appears to contradict the findings of Muglach (2003), who did not find any excess power in these bands in TRACE observations. However, we reiterate that this power excess is at a greater distance from the active region than the halo in velocity, and also occurs at higher temporal frequencies. Haloes of excess power have also been seen in ground-based observations using chromospheric lines, for example by Moretti et al. (2007) in the Na D line and by Braun et al. (1992) in Ca K. The halo region contracts and weakens with increasing frequency, becoming indistinct by about 10 mhz, but the collapse and encroachment on the active region seen in the HMI V and HMI I L cases do not happen up to the 10.4 mhz Nyquist frequency of the 1700 Å data set, and a re-analysis of the 1600 Å data with the full 24 s temporal resolution did not reveal any such effect at higher frequencies dimensional phase and coherence maps The phase and coherence of the individual remapped pixel time series, as a function of position and frequency, can be derived using Eq. 2 and Eq. 3. When the coherence is low there is little relationshipbetween the two signals and we can expect the apparent phase difference to be close to zero after spatial averaging. In Figures 8 to 15 we show these quantities for the combination of HMI V with HMI I C,HMII L, AIA 1700, and AIA The velocity is treated as positive in SOLA: ms.tex; 1 March 2012; 15:17; p. 10

,5mhz(b),7mhz(c),9 mhz (d), and in")
. Figure 9.")
.")


11 Local helioseismic power and phase for HMI and AIA UV observables Figure 8. Slices through the HMI I C /HMI V phase,at3mhz(a),5mhz(b),7mhz(c),9 mhz (d), and in longitude and temporal frequency along the horizontal line shown in panels a-d (e). Figure 9. Slices through the HMI I C /HMI V coherence, at 3 mhz (a), 5 mhz (b), 7 mhz (c), 9 mhz (d), and in longitude and temporal frequency along the horizontal line shown in panels a-d (e). the direction away from the observer. In all cases, the coherence with the velocity is sharply reduced within the active region, which is understandable due to the greatly reduced mode power and consequent reduction in signal-to-noise ratio. There is, however, a local increase in coherence in the core of the sunspot for all three cases. This may be a real effect, but we should be cautious of common spurious, or at least complicating, effects within the sunspot umbra, such as noise interacting with the steep gradients of power and intensity, contamination by other spectral lines due to reduced temperatures, and possible cross-talk between the HMI observables in the presence of strong fields. SOLA: ms.tex; 1 March 2012; 15:17; p. 11


 as illustrated by")
 and Jiménez et al. (1999).")


12 R. Howe et al. Figure 10. Slices through the HMI I L /HMI V phase, at 3 mhz (a), 5 mhz (b), 7 mhz (c), 9 mhz (d), and in longitude and temporal frequency along the horizontal line shown in panels a-d (e). Figure 11. Slices through the HMI I L /HMI V coherence at 3 mhz (a), 5 mhz (b), 7 mhz (c), 9 mhz (d), and in longitude and temporal frequency along the horizontal line shown in panels a-d (e). The phase difference between HMI V and HMI I C shows a sharp discontinuity at around 2.5 mhz, the upper limit of the granulation signal; this phenomenon has been well known since the work of, for example, Staiger (1985) as illustrated by Deubner et al. (1990), Deubner et al. (1990) and Jiménez et al. (1999). In the core of the active region this boundary is shifted to lower frequencies, perhaps due to the suppression of convective motions by the surface fields. The weaker fields of the plage area have very little effect on the I V phase in the five-minute band, but do modulate the HMI I L HMIV phase difference. In the HMI I L and SOLA: ms.tex; 1 March 2012; 15:17; p. 12

, 7 mhz (c), 9 mhz (d), and in longitude and temporal")


")
13 Local helioseismic power and phase for HMI and AIA UV observables Figure 12. Slices through the AIA 1700/HMI V phase at 3 mhz (a), 5 mhz (b), 7 mhz (c), 9 mhz (d), and in longitude and temporal frequency along the horizontal line shown in panels a-d (e). Figure 13. Slices through the AIA 1700/HMI V coherence at 3 mhz (a), 5 mhz (b), 7 mhz (c), 9 mhz (d), and in longitude and temporal frequency along the horizontal line shown in panels a-d (e). AIA cases, the discontinuity is smaller and the low-frequency behaviour more complicated, with the phase in the plage region heavily disrupted. While the quiet-sun phase difference between HMI I and HMI V becomes slowly less negative with increasing frequency, the opposite is true for HMI I L and the UV bands. Another interesting feature is that the high-frequency coherence between the HMI V and the UV intensities is higher in the halo zone around the active region than in the surrounding quiet Sun; this region (which, as mentioned above, does not correspond to any detectable magnetic fields) also shows a shift in the SOLA: ms.tex; 1 March 2012; 15:17; p. 13
, 5")


14 R. Howe et al. Figure 14. Slices through the AIA 1600/HMI V phase at 3 mhz (a), 5 mhz (b), 7 mhz (c), 9 mhz (d), and in longitude and temporal frequency along the horizontal line shown in panels a-d (e). Figure 15. Slices through the AIA 1600/HMI V coherence at 3 mhz (a), 5 mhz (b), 7 mhz (c), 9 mhz (d), and in longitude and temporal frequency along the horizontal line shown in panels a-d (e). phase between these observables that varies smoothly with distance from the active region, going from a difference of about 100 degrees for the 1700 Åand 160 degrees for the 1600 Å band in quiet Sun far away from the active region at 7 mhz to nearly in-phase within it. While the coherence of HMI V with AIA 1600 and 1700 look very similar at lower frequencies, the 9mHz map shows a different pattern; while for the 1700 band the coherence is weakly enhanced over most of the extended halo region except for the active region core and an external fringe of reduced coherence, for the 1600 band there is a high-coherence fringe surrounding a patch of reduced coherence over the wider active region. SOLA: ms.tex; 1 March 2012; 15:17; p. 14
15 Local helioseismic power and phase for HMI and AIA UV observables On the other hand, the coherence between HMI V and HMI I L is reduced in the same region and frequency range, and the phase difference varies from 130 degrees in quiet Sun to 90 degrees in the active region. At 3mHz, conversely, the phase difference between HMI V and both HMI I L and AIA 1600 and 1700 is more negative within the active region than in quiet Sun. It is curious that the quiet-sun phase is more negative than that for the AIA bands, as this would seem to imply (if we are dealing with upward-traveling waves) that the HMI I L is actually probing a higher level of the atmosphere than the UV bands. 6. Discussion We have examined the acoustic power distribution around an active region in a number of HMI and AIA observables, and the phase and coherence relationships between the intensity observables and the HMI Doppler velocity. Five-minute power in all observables is suppressed in the sunspot (which is dark at all wavelengths) and also in plage areas (bright in AIA bands and HMI I L ). Above the acoustic cut-off frequency the behaviour is more complicated. Power in HMI I C is suppressed in the presence of surface fields at all frequencies, while power in HMI V is enhanced in a narrow zone around field concentrations (especially plage) and suppressed in a wider surrounding area; these results are consistent with earlier work using MDI. Power in HMI I L and the AIA bands is suppressed in areas of surface field but in contrast to the results of Muglach (2003) enhanced in an extended area around the active region. In the HMI I L case, the pattern of narrow halo, encroaching on the region where the fiveminute power is suppressed, and surrounding region of suppressed power, seen for the HMI V at 7mHz, is seen instead at 9mHz. For the UV bands, however, this pattern does not appear at any frequency; instead, the halo power fades with increasing frequency and vanishes above about 10mHz while the power suppression remains. In all cases but HMI I C, the regions of enhancement and suppression of power appear to move inwards towards the active region at increasing frequency. The relative phase of the observables is altered around active regions. While the apparently in-phase behaviour of most observables in strong-field areas is associated with low coherence and thus of low significance, there are exceptions to this. In particular, in the 7 mhz frequency band there are areas close to the active region where the AIA 1700 and 1600 bands are both close in phase to the HMI velocity and coherent with it, whereas in the quiet Sun well away from the active region the phase difference is close to 90 degrees and the coherence is lower. This effect is not seen in the HMI I L, which is otherwise very similar in its behaviour to the UV bands, though there is a phase difference between the two observables.at9 mhz the 1600and 1700 Å bands also show qualitatively different behaviour, suggesting that though there may be substantial overlap between the two wavelength bands, the highest-frequency waves are sensing different layers of the atmosphere. Clearly, within the halo zone surrounding the active region the propagation and reflection of the high-frequency waves differs from that over quiet SOLA: ms.tex; 1 March 2012; 15:17; p. 15
16 R. Howe et al. Sun, whether due to alteration in the height of formation of the observables, thermal changes, or the direct effect of magnetic fields in trapping, scattering or transforming the waves; also, there are qualitative differences between the purely photospheric observables even at the relatively high formation level of the HMI I L and the UV bands. In general, the higher the observable is formed, the higher the frequency at which the halo of excess power is found, and the more extensive the halo at the lowest frequency at which it appears. It is tempting to interpret these halo effects in terms of spreading magnetic field canopies, as has been suggested, for example, by Moretti et al. (2007), but we note that the extent of the highfrequency halo does not exactly match the morphology of the overlying field seen in the EUV images. The size of the halo and the inner and outer regions of suppressed power appear to vary with frequency as well as with the height of formation of the observable used, contracting with increasing frequency. If the patterns of power distribution are related to spreading out of magnetic fields with height, this would imply that the higher-frequency pseudomodes are being reflected or absorbed at lower layers than the lower-frequency ones. These effects no doubt also influence the changes in the local helioseismic parameters of modes above the acoustic cut-off frequency, seen for example by Howe et al. (2004, 2008), which tend to be in the opposite sense from those experienced by modes in the 5-minute range. Eventually, we hope to carry out multi-wavelength helioseismic analysis using HMI and AIA data together to extract parameters for local and global acoustic spectra. As the results described here demonstrate, any such analysis will need to take into account the effects of active regions on the phase and coherence of the oscillations. The continuous, high-cadence, full-disk observations of HMI and AIA allow us to study the behaviour of waves in the photosphere and lower chromosphere at a level of detail that has not previously been possible. These observations may help us to improve our understanding of the interaction of waves and magnetic fields in the different layers of the photosphere. Acknowledgements RH thanks the National Solar Observatory for computing support, and Yvonne Elsworth for useful discussions. SDO data courtesy SDO (NASA) and the AIA and HMI consortia. This work was partly supported by NASA grant NNH12AT11I to NSO. This research has made use of NASA s Astrophysics Data System. References Barban, C., Hill, F., Kras, S.: 2004, Astrophys. J. 602, 516. doi: / Braun, D.C., Lindsey, C., Fan, Y., Jefferies, S.M.: 1992, Astrophys. J. 392, 739. doi: / Brown, T.M., Bogdan, T.J., Lites, B.W., Thomas, J.H.: 1992, Astrophys. J. 394, L65. doi: / Deubner, F.-L., Fleck, B., Marmolino, C., Severino, G.: 1990, Astron. Astrophys. 236, 509. Deubner, F.-L., Fleck, B., Schmitz, F., Straus, T.: 1992, Astron. Astrophys. 266, 560. Elsworth, Y., Howe, R., Isaak, G.R., McLeod, C.P., Miller, B.A., New, R., Speake, C.C., Wheeler, S.J.: 1994, Mon. Not. R. Astr. Soc. 269, 529. SOLA: ms.tex; 1 March 2012; 15:17; p. 16
17 Local helioseismic power and phase for HMI and AIA UV observables Finsterle, W., Jefferies, S.M., Cacciani, A., Rapex, P., Giebink, C., Knox, A., Dimartino, V.: 2004, Solar Phys. 220, 317. doi: /b:sola b. Fleck, B., Couvidat, S., Straus, T.: 2011, Solar Phys. 271, 27. doi: /s Fossum, A., Carlsson, M.: 2005, Astrophys. J. 625, 556. doi: / Hill, F., Ladenkov, O., Ehgamberdiev, S., Chou, D.-Y.: 2001, In: A. Wilson & P. L. Pallé (ed.) SOHO 10/GONG 2000 Workshop: Helio- and Asteroseismology at the Dawn of the Millennium, ESA Special Publication 464, 219. Howe, R., Komm, R.W., Hill, F., Haber, D.A., Hindman, B.W.: 2004, Astrophys. J. 608, 562. doi: / Howe, R., Haber, D.A., Hindman, B.W., Komm, R., Hill, F., Gonzalez Hernandez, I.: 2008, In: R.Howe,R.W.Komm,K.S.Balasubramaniam,&G.J.D.Petrie (ed.)subsurface and Atmospheric Influences on Solar Activity, Astronomical Society of the Pacific Conference Series 383, 305. Howe, R., Hill, F., Komm, R., Broomhall, A., Chaplin, W.J., Elsworth, Y.: 2011, Journal of Physics Conference Series 271(1), doi: / /271/1/ Jain, R., Haber, D.: 2002, Astron. Astrophys. 387, doi: / : Jiménez, A., Roca Cortés, T., Severino, G., Marmolino, C.: 1999, Astrophys. J. 525, doi: / Judge, P.G., Tarbell, T.D., Wilhelm, K.: 2001, Astrophys. J. 554, 424. doi: / Krijger, J.M., Rutten, R.J., Lites, B.W., Straus, T., Shine, R.A., Tarbell, T.D.: 2001, Astron. Astrophys. 379, doi: / : Moretti, P.F., Jefferies, S.M., Armstrong, J.D., McIntosh, S.W.: 2007, Astron. Astrophys. 471, 961. doi: / : Muglach, K.: 2003, Astron. Astrophys. 401, 685. doi: / : Norton, A.A., Graham, J.P., Ulrich, R.K., Schou, J., Tomczyk, S., Liu, Y., Lites, B.W., López Ariste, A., Bush, R.I., Socas-Navarro, H., Scherrer, P.H.: 2006, Solar Phys. 239, 69. doi: /s y. Scherrer, P.H., Bogart, R.S., Bush, R.I., Hoeksema, J.T., Kosovichev, A.G., Schou, J., Rosenberg, W., Springer, L., Tarbell, T.D., Title, A., Wolfson, C.J., Zayer, I., MDI Engineering Team: 1995, Solar Phys. 162, 129. Schunker, H., Braun, D.C.: 2011, Solar Phys. 268, 349. doi: /s Severino, G., Magrì, M., Oliviero, M., Straus, T., Jefferies, S.M.: 2001, Astrophys. J. 561, 444. doi: / Staiger, J.: 1985,. PhD thesis, Thesis, University of Freiburg i. Br., (1985). SOLA: ms.tex; 1 March 2012; 15:17; p. 17
18 SOLA: ms.tex; 1 March 2012; 15:17; p. 18
Analysis of Helioseismic Power-Spectrum Diagram of A Sunspot
 Solar Physics DOI: 10.1007/ - - - - Analysis of Helioseismic Power-Spectrum Diagram of A Sunspot Junwei Zhao 1 Dean-Yi Chou 2 c Springer Abstract The continuous high spatial-resolution Doppler observation
arxiv: v1 [astro-ph.sr] 6 Aug 2009
![arxiv: v1 [astro-ph.sr] 6 Aug 2009](/thumbs/74/69735951.jpg "arxiv: v1 [astro-ph.sr] 6 Aug 2009") Solar Physics DOI: 10.1007/ - - - - Time-Distance Solar Far-Side Imaging Using Three-Skip Acoustic Signals arxiv:0908.0962v1 [astro-ph.sr] 6 Aug 2009 S. Ilonidis 1 J. Zhao 1 T. Hartlep 2,3 c Springer Abstract
Solar Physics DOI: 10.1007/ - - - - Time-Distance Solar Far-Side Imaging Using Three-Skip Acoustic Signals arxiv:0908.0962v1 [astro-ph.sr] 6 Aug 2009 S. Ilonidis 1 J. Zhao 1 T. Hartlep 2,3 c Springer Abstract
4+ YEARS OF SCIENTIFIC RESULTS WITH SDO/HMI
 4+ YEARS OF SCIENTIFIC RESULTS WITH SDO/HMI Sebastien Couvidat and the HMI team Solar Metrology Symposium, October 2014 The HMI Instrument HMI Science Goals Evidence of Double-Cell Meridional Circulation
Physical Properties of Wave Motion in Inclined Magnetic Fields Within Sunspot Penumbrae
 Solar Physics DOI: 10.1007/ - - - - Physical Properties of Wave Motion in Inclined Magnetic Fields Within Sunspot Penumbrae H. Schunker 1,2 D.C. Braun 3 C. Lindsey 3 P.S. Cally 2 c Springer Abstract At
Surface Magnetic Field Effects in Local Helioseismology
 Astron. Nachr. / AN 999, No. 88, 789 794 (2006) / DOI please set DOI! Surface Magnetic Field Effects in Local Helioseismology H. Schunker 1,2,, D.C. Braun 3, and P.S. Cally 1 1 Centre for Stellar and Planetary
Towards Waveform Heliotomography: Observing Interactions of Helioseismic Waves with a Sunspot
 Solar Physics DOI: 10.1007/ - - - - Towards Waveform Heliotomography: Observing Interactions of Helioseismic Waves with a Sunspot Junwei Zhao Alexander G. Kosovichev Stathis Ilonidis c Springer Abstract
Time-Distance Imaging of Solar Far-Side Active Regions
 Time-Distance Imaging of Solar Far-Side Active Regions Junwei Zhao W. W. Hansen Experimental Physics Laboratory, Stanford University, Stanford, CA94305-4085 ABSTRACT It is of great importance to monitor
Observations of Umbral Flashes
 Proceedings of 12th Cambridge Workshop on Cool Stars, Stellar Systems, & The Sun, 2003 University of Colorado. Observations of Umbral Flashes L.H.M. Rouppe van der Voort 1, J.M. Krijger 2 Abstract. We
PHASE-SENSITIVE HOLOGRAPHY OF SOLAR ACTIVITY
 PHASE-SENSITIVE HOLOGRAPHY OF SOLAR ACTIVITY D. C. BRAUN, and C. LINDSEY Solar Physics Research Corporation, 4720 Calle Desecada, Tucson, AZ 85718, U.S.A. e-mails: dbraun@solar.stanford.edu; lindsey@sprc.com
Interpreting HMI multi-height velocity measurements Kaori Nagashima
 Interpreting HMI multi-height velocity measurements Kaori Nagashima Postdoc of Interior of the Sun and Stars Dept. @MPS (May 2012 - ) Collaborators of this study: L. Gizon, A. Birch, B. Löptien, S. Danilovic,
Probing Magnetic Fields in the Solar Convection Zone with Meridional Flow
 Probing Magnetic Fields in the Solar Convection Zone with Meridional Flow Zhi-Chao Liang 22 Dec. 2015, MPS, Göttingen Liang, Z.-C. & Chou, D.-Y., 2015, Probing Magnetic Fields at the Base of the Solar
Received: 21 September 2011 / Accepted: 19 March 2012 / Published online: 6 April 2012 Springer Science+Business Media B.V. 2012
 Solar Phys (2012) 279:295 316 DOI 10.1007/s11207-012-9976-x Comparison of Line-of-Sight Magnetograms Taken by the Solar Dynamics Observatory/Helioseismic and Magnetic Imager and Solar and Heliospheric
The Persistence of Apparent Non-Magnetostatic Equilibrium in NOAA 11035
 Polarimetry: From the Sun to Stars and Stellar Environments Proceedings IAU Symposium No. 305, 2015 K.N. Nagendra, S. Bagnulo, c 2015 International Astronomical Union R. Centeno, & M. Martínez González,
Physical Properties of Wave Motion in Inclined Magnetic Fields within Sunspot Penumbrae
 Solar Phys (2008) 251: 341 359 DOI 10.1007/s11207-008-9142-7 HELIOSEISMOLOGY, ASTEROSEISMOLOGY, AND MHD CONNECTIONS Physical Properties of Wave Motion in Inclined Magnetic Fields within Sunspot Penumbrae
The Sun s Dynamic Atmosphere
 Lecture 16 The Sun s Dynamic Atmosphere Jiong Qiu, MSU Physics Department Guiding Questions 1. What is the temperature and density structure of the Sun s atmosphere? Does the atmosphere cool off farther
Acoustic Power Absorption in Sunspots and Quiet-Sun from Hankel-Fourier Transform on HMI and AIA Data. Sébastien Couvidat, 04/13/2012
 Acoustic Power Absorption in Sunspots and Quiet-Sun from Hankel-Fourier Transform on HMI and AIA Data Sébastien Couvidat, 04/13/2012 Braun, Duvall, & LaBonte (1987): in polar coordinates (r,θ) waves can
FARSIDE HELIOSEISMIC HOLOGRAPHY: RECENT ADVANCES
 FARSIDE HELIOSEISMIC HOLOGRAPHY: RECENT ADVANCES I. González Hernández 1, F. Hill 1, C. Lindsey 2, D. Braun 2, P. Scherrer 3, and S.M. Hanasoge 3 1 National Solar Observatory, Tucson, Arizona, USA 2 NorthWest
Time Distance Study of Isolated Sunspots
 Astron. Nachr. / AN 999, No. 88, 789 792 (2006) / DOI please set DOI! Time Distance Study of Isolated Sunspots Sergei Zharkov, Christopher J. Nicholas, and Michael J. Thompson Solar Physics and upper-atmosphere
CONTAMINATION BY SURFACE EFFECTS OF TIME-DISTANCE HELIOSEISMIC INVERSIONS FOR SOUND SPEED BENEATH SUNSPOTS
 The Astrophysical Journal, 661:558Y567, 2007 May 20 # 2007. The American Astronomical Society. All rights reserved. Printed in U.S.A. CONTAMINATION BY SURFACE EFFECTS OF TIME-DISTANCE HELIOSEISMIC INVERSIONS
AIA DATA ANALYSIS OVERVIEW OF THE AIA INSTRUMENT
 AIA DATA ANALYSIS OVERVIEW OF THE AIA INSTRUMENT SDO SUMMER SCHOOL ~ August 2010 ~ Yunnan, China Marc DeRosa (LMSAL) ~ derosa@lmsal.com WHAT IS SDO? The goal of Solar Dynamics Observatory (SDO) is to understand:
Logistics 2/14/17. Topics for Today and Thur. Helioseismology: Millions of sound waves available to probe solar interior. ASTR 1040: Stars & Galaxies
 ASTR 1040: Stars & Galaxies Pleiades Star Cluster Prof. Juri Toomre TAs: Piyush Agrawal, Connor Bice Lecture 9 Tues 14 Feb 2017 zeus.colorado.edu/astr1040-toomre Topics for Today and Thur Helioseismology:
(Astro)Physics 343 Lecture # 5: Sun, Stars, and Planets; Fourier Transforms
Physics 343 Lecture # 5: Sun, Stars, and Planets; Fourier Transforms") (Astro)Physics 343 Lecture # 5: Sun, Stars, and Planets; Fourier Transforms Schedule for the next week Office hours: Mon 5:00 6:20pm = Baker; Thu 3:20 4:40 = Lindner + Sections A, B, F = Baker; Sections
(Astro)Physics 343 Lecture # 5: Sun, Stars, and Planets; Fourier Transforms Schedule for the next week Office hours: Mon 5:00 6:20pm = Baker; Thu 3:20 4:40 = Lindner + Sections A, B, F = Baker; Sections
An Overview of the Details
 Guiding Questions The Sun Our Extraordinary Ordinary Star 1. What is the source of the Sun s energy? 2. What is the internal structure of the Sun? 3. How can astronomers measure the properties of the Sun
Calculation of Observables from HMI Data (REVISED ON JULY 15, 2011)
") Calculation of Observables from HMI Data REVISED ON JULY 15, 011) Sébastien Couvidat and the HMI team W.W. Hansen Experimental Physics Laboratory, Stanford University, Stanford, CA 94305-4085, USA 1. INRODUCION
Calculation of Observables from HMI Data REVISED ON JULY 15, 011) Sébastien Couvidat and the HMI team W.W. Hansen Experimental Physics Laboratory, Stanford University, Stanford, CA 94305-4085, USA 1. INRODUCION
Observations of Sunspot Oscillations in G Band and Ca II H Line with Solar Optical Telescope on Hinode
 PASJ: Publ. Astron. Soc. Japan 59, S631 S636, 2007 November 30 c 2007. Astronomical Society of Japan. Observations of Sunspot Oscillations in G Band and Ca II H Line with Solar Optical Telescope on Hinode
Stanford Helioseismology Workshop 6-9 August Sébastien Couvidat & Paul Rajaguru HEPL, Stanford University
 Stanford Helioseismology Workshop 6-9 August 2007 Ring-Like Structures in the Travel-Time maps of Sunspots Sébastien Couvidat & Paul Rajaguru HEPL, Stanford University Time-Distance Helioseismology Phase-speed
Received: 16 September 2010 / Accepted: 23 March 2011 / Published online: 4 May 2011 Springer Science+Business Media B.V. 2011
 Solar Phys (2012) 275:375 390 DOI 10.1007/s11207-011-9757-y THE SOLAR DYNAMICS OBSERVATORY Time Distance Helioseismology Data-Analysis Pipeline for Helioseismic and Magnetic Imager Onboard Solar Dynamics
Lecture 17 The Sun October 31, 2018
 Lecture 17 The Sun October 31, 2018 1 2 Exam 2 Information Bring a #2 pencil! Bring a calculator. No cell phones or tablets allowed! Contents: Free response problems (2 questions, 10 points) True/False
PTYS/ASTR 206. The Sun 3/1/07
 The Announcements Reading Assignment Review and finish reading Chapter 18 Optional reading March 2006 Scientific American: article by Gene Parker titled Shielding Space Travelers http://en.wikipedia.org/wiki/solar_variability
Oscillations and running waves observed in sunspots
 Astron. Astrophys. 363, 306 310 (2000) Oscillations and running waves observed in sunspots II. Photospheric waves A.A. Georgakilas 1,2, E.B. Christopoulou 1,3, and S. Koutchmy 4 1 Thessalias 13, 13231
The Sun. The Sun Is Just a Normal Star 11/5/2018. Phys1411 Introductory Astronomy. Topics. Star Party
 Foundations of Astronomy 13e Seeds Phys1411 Introductory Astronomy Instructor: Dr. Goderya Chapter 8 The Sun Star Party This Friday November 9 weather permitting. See the flyer for updates in case of cancellations
Long-Period Oscillations of Sunspots Observed by SOHO/MDI
 Solar Physics DOI: 10.1007/s11207-013-0451-0 Long-Period Oscillations of Sunspots Observed by SOHO/MDI V.I. Efremov 1 L.D. Parfinenko 1 A.A. Solov'ev 1 E.A. Kirichek 1 Springer Abstract We processed magnetograms
arxiv: v1 [astro-ph] 2 Oct 2007
![arxiv: v1 [astro-ph] 2 Oct 2007](/thumbs/94/121336069.jpg "arxiv: v1 [astro-ph] 2 Oct 2007") Speed of Meridional Flows and Magnetic Flux Transport on the Sun Michal Švanda, 1,2, Alexander G. Kosovichev 3, and Junwei Zhao 3 arxiv:0710.0590v1 [astro-ph] 2 Oct 2007 ABSTRACT We use the magnetic butterfly
Speed of Meridional Flows and Magnetic Flux Transport on the Sun Michal Švanda, 1,2, Alexander G. Kosovichev 3, and Junwei Zhao 3 arxiv:0710.0590v1 [astro-ph] 2 Oct 2007 ABSTRACT We use the magnetic butterfly
Physics 343 Lecture # 5: Sun, Stars, and Planets; Bayesian analysis
 Physics 343 Lecture # 5: Sun, Stars, and Planets; Bayesian analysis Schedule for the next week Office hours: Thu 5:00 6:20pm = Deshpande; Fri 10:20 11:40 = Baker + on call Sections A, C = Baker; Sections
Flare Energy Release in the Low Atmosphere
 Flare Energy Release in the Low Atmosphere Alexander G. Kosovichev, Viacheslav M. Sadykov New Jersey Institute of Technology Ivan N. Sharykin, Ivan V. Zimovets Space Research Institute RAS Santiago Vargas
Helioseismology. Jesper Schou Max Planck Institute for Solar System Research
 Helioseismology Jesper Schou Max Planck Institute for Solar System Research schou@mps.mpg.de Page 1 of 60 Helioseismology The study of the Sun using waves Similar to Earth seismology Sounds waves are trapped
The Sun Our Extraordinary Ordinary Star
 The Sun Our Extraordinary Ordinary Star 1 Guiding Questions 1. What is the source of the Sun s energy? 2. What is the internal structure of the Sun? 3. How can astronomers measure the properties of the
An Overview of the Details
 The Sun Our Extraordinary Ordinary Star 1 Guiding Questions 1. What is the source of the Sun s energy? 2. What is the internal structure of the Sun? 3. How can astronomers measure the properties of the
pre Proposal in response to the 2010 call for a medium-size mission opportunity in ESA s science programme for a launch in 2022.
 Solar magnetism explorer (SolmeX) Exploring the magnetic field in the upper atmosphere of our closest star preprint at arxiv 1108.5304 (Exp.Astron.) or search for solmex in ADS Hardi Peter & SolmeX team
Power halo and magnetic shadow in a solar quiet region observed in the Hα line ABSTRACT
 A&A 510, A41 (2010) DOI: 10.1051/0004-6361/200912841 c ESO 2010 Astronomy & Astrophysics Power halo and magnetic shadow in a solar quiet region observed in the Hα line I. Kontogiannis 1,2, G. Tsiropoula
Supporting Calculations for NASA s IRIS Mission. I. Overview
 Supporting Calculations for NASA s IRIS Mission. I. Overview Eugene Avrett Harvard-Smithsonian Center for Astrophysics, 60 Garden Street, Cambridge, MA 02138 Understanding the solar chromosphere continues
PHOTOSPHERIC PLASMA FLOWS AROUND A SOLAR SPOT. 1. Introduction
 PHOTOSPHERIC PLASMA FLOWS AROUND A SOLAR SPOT VASYL B. YURCHYSHYN and HAIMIN WANG Big Bear Solar Observatory, Big Bear City, CA 92314, U.S.A. (e-mail: vayur@bbso.njit.edu) (Received 2 January 2001; accepted
Logistics 2/13/18. Topics for Today and Thur+ Helioseismology: Millions of sound waves available to probe solar interior. ASTR 1040: Stars & Galaxies
 ASTR 1040: Stars & Galaxies Pleiades Star Cluster Prof. Juri Toomre TAs: Peri Johnson, Ryan Horton Lecture 9 Tues 13 Feb 2018 zeus.colorado.edu/astr1040-toomre Topics for Today and Thur+ Helioseismology:
Observation of Chromospheric Sunspot at. Millimeter Range with the Nobeyama 45 m. Telescope
 Observation of Chromospheric Sunspot at Millimeter Range with the Nobeyama 45 m Telescope Running Head: Chromospheric observation with the Nobeyama 45 m telescope Kazumasa Iwai 1 and Masumi Shimojo 2 1,
Helioseismic and Magnetic Imager for Solar Dynamics Observatory
 Helioseismic and Magnetic Imager for Solar Dynamics Observatory Concept Study Report Appendix A HMI Science Plan SU-HMI-S014 2 July 2003 Stanford University Hansen Experimental Physics Laboratory and Lockheed-Martin
arxiv: v1 [astro-ph.sr] 3 Nov 2010
![arxiv: v1 [astro-ph.sr] 3 Nov 2010](/thumbs/92/109675299.jpg "arxiv: v1 [astro-ph.sr] 3 Nov 2010") arxiv:1011.0799v1 [astro-ph.sr] 3 Nov 2010 Local helioseismology of sunspot regions: comparison of ring-diagram and time-distance results A.G. Kosovichev 1, S. Basu 2, R. Bogart 1, T.L. Duvall, Jr 3, I.
arxiv:1011.0799v1 [astro-ph.sr] 3 Nov 2010 Local helioseismology of sunspot regions: comparison of ring-diagram and time-distance results A.G. Kosovichev 1, S. Basu 2, R. Bogart 1, T.L. Duvall, Jr 3, I.
arxiv: v1 [astro-ph.sr] 25 May 2017
![arxiv: v1 [astro-ph.sr] 25 May 2017](/thumbs/87/95896475.jpg "arxiv: v1 [astro-ph.sr] 25 May 2017") Astronomy & Astrophysics manuscript no. ms c ESO 2017 May 26, 2017 Helioseismic Holography of Simulated Sunspots: dependence of the travel time on magnetic field strength and Wilson depression T. Felipe
Astronomy & Astrophysics manuscript no. ms c ESO 2017 May 26, 2017 Helioseismic Holography of Simulated Sunspots: dependence of the travel time on magnetic field strength and Wilson depression T. Felipe
A STUDY OF TRANSITION REGION AND CORONAL DOPPLER SHIFTS IN A SOLAR CORONAL HOLE. M. D. Popescu 1,2 and J. G. Doyle 1
 A STUDY OF TRANSITION REGION AND CORONAL DOPPLER SHIFTS IN A SOLAR CORONAL HOLE M. D. Popescu 1,2 and J. G. Doyle 1 1 Armagh Observatory, College Hill, Armagh BT61 9DG, N. Ireland 2 Astronomical Institute
Line-of-sight observables algorithms for HMI tested with Interferometric BI-dimensional Spectrometer (IBIS) spectro-polarimetric observations
 spectro-polarimetric observations") Line-of-sight observables algorithms for HMI tested with Interferometric BI-dimensional Spectrometer (IBIS) spectro-polarimetric observations S. Couvidat, S.P. Rajaguru, R. Wachter, K. Sankarasubramanian,
Line-of-sight observables algorithms for HMI tested with Interferometric BI-dimensional Spectrometer (IBIS) spectro-polarimetric observations S. Couvidat, S.P. Rajaguru, R. Wachter, K. Sankarasubramanian,
HMI multi height Dopplergram study
 Nagashima et al. 2014 SoPh Interpreting the Helioseismic and Magnetic Imager (HMI) Multi Height Velocity Measurements HMI multi height Dopplergram study Kaori Nagashima (MPS) Collaborators: L. Gizon, A.
Physics 343 Lecture # 5: Sun, stars, and planets; (more) statistics
 statistics") Physics 343 Lecture # 5: Sun, stars, and planets; (more) statistics Schedule for the next week Office hours: Thu 5:00 6:00pm = Rivera; Fri 3:20 4:40 = Baker + on call Sections A, C, F, G = Baker; Sections
Physics 343 Lecture # 5: Sun, stars, and planets; (more) statistics Schedule for the next week Office hours: Thu 5:00 6:00pm = Rivera; Fri 3:20 4:40 = Baker + on call Sections A, C, F, G = Baker; Sections
arxiv: v1 [astro-ph.sr] 8 Feb 2012
![arxiv: v1 [astro-ph.sr] 8 Feb 2012](/thumbs/90/104336730.jpg "arxiv: v1 [astro-ph.sr] 8 Feb 2012") Evidence for collapsing fields in corona and photosphere during the 15 February 2011 X2.2 flare: SDO AIA and HMI Observations S. Gosain 1,2 arxiv:1202.1784v1 [astro-ph.sr] 8 Feb 2012 Received sgosain@nso.edu
Evidence for collapsing fields in corona and photosphere during the 15 February 2011 X2.2 flare: SDO AIA and HMI Observations S. Gosain 1,2 arxiv:1202.1784v1 [astro-ph.sr] 8 Feb 2012 Received sgosain@nso.edu
The Origin of the Solar Cycle & Helioseismology
 The Origin of the Solar Cycle & Helioseismology What is the solar cycle? Simple concept of cycle mechanism, dynamo What is helioseismology? Global properties of the solar interior Local properties of the
STELLAR PHYSICS OF THE SOLAR INTERIOR IN THE COMING DECADE
 STELLAR PHYSICS OF THE SOLAR INTERIOR IN THE COMING DECADE A Science White Paper for the Astro 2010 Decadal Survey Submitted for consideration by the Stars and Stellar Evolution Panel Frank Hill National
Solar-B. Report from Kyoto 8-11 Nov Meeting organized by K. Shibata Kwasan and Hida Observatories of Kyoto University
 Solar-B Report from Kyoto 8-11 Nov Meeting organized by K. Shibata Kwasan and Hida Observatories of Kyoto University The mission overview Japanese mission as a follow-on to Yohkoh. Collaboration with USA
The solar atmosphere
 45 SAMI K. SOLANKI* AND REINER HAMMER** The solar atmosphere As a typical star, and the only one that can be spatially resolved by direct means, the study of the Sun has provided an insight into many of
Solar Structure. Connections between the solar interior and solar activity. Deep roots of solar activity
 Deep roots of solar activity Michael Thompson University of Sheffield Sheffield, U.K. michael.thompson@sheffield.ac.uk With thanks to: Alexander Kosovichev, Rudi Komm, Steve Tobias Connections between
The Synchronic Frame of Photospheric Magnetic field: The Improved Synoptic Frame
 1 The Synchronic Frame of Photospheric Magnetic field: The Improved Synoptic Frame X. P. Zhao, J. T. Hoeksema and P. H. Scherrer W. W. Hansen Experimental Physics Laboratory, Stanford University Short
Phys 100 Astronomy (Dr. Ilias Fernini) Review Questions for Chapter 8
 Review Questions for Chapter 8") Phys 100 Astronomy (Dr. Ilias Fernini) Review Questions for Chapter 8 MULTIPLE CHOICE 1. Granulation is caused by a. sunspots. * b. rising gas below the photosphere. c. shock waves in the corona. d. the
Phys 100 Astronomy (Dr. Ilias Fernini) Review Questions for Chapter 8 MULTIPLE CHOICE 1. Granulation is caused by a. sunspots. * b. rising gas below the photosphere. c. shock waves in the corona. d. the
Motion of magnetic elements at the solar equator observed by SDO/HMI
 AGU 2012, #SH41D 2129 3~7 Dec. 2012 Motion of magnetic elements at the solar equator observed by SDO/HMI Keiji Hayashi*, A. A. Norton, Y. Liu, X. Sun, and J. T. Hoeksema (W. W. Hansen Experimental Physics
The Synchronic Frame of Photospheric Magnetic field: The Improved Synoptic Frame
 1 The Synchronic Frame of Photospheric Magnetic field: The Improved Synoptic Frame X. P. Zhao, J. T. Hoeksema and P. H. Scherrer W. W. Hansen Experimental Physics Laboratory, Stanford University Short
Chapter 1. Introduction. 1.1 Motivation
 Chapter 1 Introduction 1.1 Motivation The Sun is a fascinating star, which not only supports life on the Earth, but also exhibits some extraordinary scientific phenomena, such as solar flares, coronal
Magnetic Field Elements at High Latitude: Lifetime and Rotation Rate
 Solar Phys (2009) 260: 289 298 DOI 10.1007/s11207-009-9450-6 Magnetic Field Elements at High Latitude: Lifetime and Rotation Rate Y. Liu J. Zhao Received: 14 May 2009 / Accepted: 31 August 2009 / Published
Received 2002 January 19; accepted 2002 April 15; published 2002 May 6
 The Astrophysical Journal, 571:L181 L185, 2002 June 1 2002. The American Astronomical Society. All rights reserved. Printed in U.S.A. LARGE-SCALE SOLAR CORONAL STRUCTURES IN SOFT X-RAYS AND THEIR RELATIONSHIP
Solar Magnetism. Differential Rotation, Sunspots, Solar Cycle. Guest lecture: Dr. Jeffrey Morgenthaler Jan 30, 2006
 Solar Magnetism Differential Rotation, Sunspots, Solar Cycle Guest lecture: Dr. Jeffrey Morgenthaler Jan 30, 2006 Neutrino Summary Principle of CONSERVATION OF ENERGY led to proposal of neutrino by Wolfgang
The Structure of the Sun. CESAR s Booklet
 How stars work In order to have a stable star, the energy it emits must be the same as it can produce. There must be an equilibrium. The main source of energy of a star it is nuclear fusion, especially
1. INTRODUCTION 2. NOISE ASSESSMENT
 The Astrophysical Journal, 689: L161 L165, 2008 December 20 2008. The American Astronomical Society. All rights reserved. Printed in U.S.A. PROSPECTS FOR THE DETECTION OF THE DEEP SOLAR MERIDIONAL CIRCULATION
Calculation of the sun s acoustic impulse response by multidimensional
 Calculation of the sun s acoustic impulse response by multidimensional spectral factorization J. E. Rickett and J. F. Claerbout Geophysics Department, Stanford University, Stanford, CA 94305, USA Abstract.
Guidepost. Chapter 08 The Sun 10/12/2015. General Properties. The Photosphere. Granulation. Energy Transport in the Photosphere.
 Guidepost The Sun is the source of light an warmth in our solar system, so it is a natural object to human curiosity. It is also the star most easily visible from Earth, and therefore the most studied.
Temperature Reconstruction from SDO:AIA Filter Images
 Temperature Reconstruction from SDO:AIA Filter Images A report by Chris Gilbert Astrophysical and Planetary Sciences, University of Colorado Boulder ASTR 5700; Stellar Astrophysics, Spring 2016 Abstract
Toward Interplanetary Space Weather: Strategies for Manned Missions to Mars
 centre for fusion, space and astrophysics Toward Interplanetary Space Weather: Strategies for Manned Missions to Mars Presented by: On behalf of: Jennifer Harris Claire Foullon, E. Verwichte, V. Nakariakov
Derivation of the Solar Plage Index using the Flare Monitoring Telescope at the Hida Observatory
 Derivation of the Solar Plage Index using the Flare Monitoring Telescope at the Hida Observatory Hiroko Watanabe (Kyoto Univ.) Collaborators: Ayumi Asai, Satoru UeNo, Reizaburo Kitai (Kyoto Univ.), Satoshi
Outline. Astronomy: The Big Picture. Earth Sun comparison. Nighttime observing is over, but a makeup observing session may be scheduled. Stay tuned.
 Nighttime observing is over, but a makeup observing session may be scheduled. Stay tuned. Next homework due Oct 24 th. I will not be here on Wednesday, but Paul Ricker will present the lecture! My Tuesday
Characterization of High-Degree Modes using MDI, HMI and GONG data
 **Volume Title** ASP Conference Series, Vol. **Volume Number** **Author** c **Copyright Year** Astronomical Society of the Pacific Characterization of High-Degree Modes using MDI, HMI and GONG data S.G.
The Sun ASTR /17/2014
 The Sun ASTR 101 11/17/2014 1 Radius: 700,000 km (110 R ) Mass: 2.0 10 30 kg (330,000 M ) Density: 1400 kg/m 3 Rotation: Differential, about 25 days at equator, 30 days at poles. Surface temperature: 5800
TRACE DOWNFLOWS AND ENERGY RELEASE
 TRACE DOWNFLOWS AND ENERGY RELEASE Ayumi Asai (1), T. Yokoyama (2), M. Shimojo (3), R. TanDokoro (4), M. Fujimoto (4), and K. Shibata (1) (1 ) Kwasan and Hida Observatories, Kyoto University, Kyoto, 607-8471
arxiv: v2 [astro-ph.sr] 19 Jun 2015
![arxiv: v2 [astro-ph.sr] 19 Jun 2015](/thumbs/82/86600813.jpg "arxiv: v2 [astro-ph.sr] 19 Jun 2015") Astronomy & Astrophysics manuscript no. resolved_vorticity c ESO 218 July 3, 218 Spatially resolved vertical vorticity in solar supergranulation using helioseismology and local correlation tracking J.
Astronomy & Astrophysics manuscript no. resolved_vorticity c ESO 218 July 3, 218 Spatially resolved vertical vorticity in solar supergranulation using helioseismology and local correlation tracking J.
1. Solar Atmosphere Surface Features and Magnetic Fields
 1. Solar Atmosphere Surface Features and Magnetic Fields Sunspots, Granulation, Filaments and Prominences, Coronal Loops 2. Solar Cycle: Observations The Sun: applying black-body radiation laws Radius
Local helioseismology: methods and challenges
 1 Local helioseismology: methods and challenges Doug Braun contributions from A. Birch (MPS), G. Barnes, A. Crouch, T. Felipe, KD Leka (NWRA) M. Rempel, Y. Fan (NCAR) 2 outline meeting the challenges of
Results from Chromospheric Magnetic Field Measurements
 Results from Chromospheric Magnetic Field Measurements Andreas Lagg Max-Planck-Institut für Sonnensystemforschung, Katlenburg-Lindau Outline: The average chromosphere Magnetic structures canopy spicules
CONCORDIASTRO/Italy: A Solar High-Resolution Observation Program at Dome-C
 Mem. S.A.It. Suppl. Vol. 2, 181 c SAIt 2003 Memorie della Supplementi CONCORDIASTRO/Italy: A Solar High-Resolution Observation Program at Dome-C G. Severino 1, V. Andretta 1, F. Berrilli 2, E. Cascone
Observables Processing for the Helioseismic and Magnetic Imager Instrument on the Solar Dynamics Observatory
 Solar Physics DOI: 10.1007/ - - - - 1 2 Observables Processing for the Helioseismic and Magnetic Imager Instrument on the Solar Dynamics Observatory 3 4 5 6 7 S. Couvidat 1 J. Schou 2,1 J.T. Hoeksema 1
Is the polar region different from the quiet sun? Hinode Observations on polar fields
 Is the polar region different from the quiet sun? Hinode Observations on polar fields Saku Tsuneta (NAOJ) Ulysses (McComas etal 2000) What is going on in polar region? Source of fast solar wind Location
Propagating waves in the sunspot umbra chromosphere. N. I. Kobanov and D. V. Makarchik
 A&A 424, 671 675 (2004) DOI: 10.1051/0004-6361:20035960 c ESO 2004 Astronomy & Astrophysics Propagating waves in the sunspot umbra chromosphere N. I. Kobanov and D. V. Makarchik Institute of Solar-Terrestrial
HELIOSTAT III - THE SOLAR CHROMOSPHERE
 HELIOSTAT III - THE SOLAR CHROMOSPHERE SYNOPSIS: In this lab you will observe, identify, and sketch features that appear in the solar chromosphere. With luck, you may have the opportunity to watch a solar
The Interior Structure of the Sun
 The Interior Structure of the Sun Data for one of many model calculations of the Sun center Temperature 1.57 10 7 K Pressure 2.34 10 16 N m -2 Density 1.53 10 5 kg m -3 Hydrogen 0.3397 Helium 0.6405 The
The Michelson Doppler Imager on. The Michelson Doppler Imager èhereafter referred to as MDIè is an instrument designed
 Chapter 3 The Michelson Doppler Imager on SOHO The Michelson Doppler Imager èhereafter referred to as MDIè is an instrument designed to probe the interior of the Sun by measuring the photospheric manifestations
The Extreme Solar Activity during October November 2003
 J. Astrophys. Astr. (2006) 27, 333 338 The Extreme Solar Activity during October November 2003 K. M. Hiremath 1,,M.R.Lovely 1,2 & R. Kariyappa 1 1 Indian Institute of Astrophysics, Bangalore 560 034, India.
Analysis of sudden variations in photospheric magnetic fields during a large flare and their influences in the solar atmosphere
 Research in Astronomy and Astrophysics PAPER Analysis of sudden variations in photospheric magnetic fields during a large flare and their influences in the solar atmosphere To cite this article: Brajesh
IRIS observation of penumbral microjets in the chromosphere and their transition region counterpart
 IRIS observation of penumbral microjets in the chromosphere and their transition region counterpart Y. Katsukawa (NAOJ), Y. Kimura (Univ. of Tokyo) T. J. Okamoto (Nagoya Univ.), T. Tarbell (LMSAL) IRIS-4
Dual-line analysis of sunspot oscillations
 Mem. S.A.It. Vol. 78, 98 c SAIt 2007 Memorie della Dual-line analysis of sunspot oscillations K. Tziotziou 1, G. Tsiropoula 1, N. Mein 2, and P. Mein 2 1 National Observatory of Athens, Institute for Space
arxiv: v1 [astro-ph.sr] 4 May 2016
![arxiv: v1 [astro-ph.sr] 4 May 2016](/thumbs/73/68155401.jpg "arxiv: v1 [astro-ph.sr] 4 May 2016") On the relationship between sunspot structure and magnetic field changes associated with solar flares arxiv:1605.01163v1 [astro-ph.sr] 4 May 2016 Received Y. L. Song 1,2 & M. Zhang 1 ; accepted 1 Key Laboratory
On the relationship between sunspot structure and magnetic field changes associated with solar flares arxiv:1605.01163v1 [astro-ph.sr] 4 May 2016 Received Y. L. Song 1,2 & M. Zhang 1 ; accepted 1 Key Laboratory
The Subsurface Structure of Sunspots as seen with 2- skip Time- Distance Helioseismology
 The Subsurface Structure of Sunspots as seen with 2- skip Time- Distance Helioseismology Tom Duvall MPS GöBngen Paul Cally, Damien Przybylski Monash Robert Cameron, Kaori Nagashima MPS GöBngen Z (Mm) Talk
Date of delivery: 29 June 2011 Journal and vol/article ref: IAU Number of pages (not including this page): 7
: 7") Date of delivery: 29 June 2011 Journal and vol/article ref: IAU 1101493 Number of pages (not including this page): 7 Author queries: Typesetter queries: Non-printed material: The Physics of Sun and Star
Date of delivery: 29 June 2011 Journal and vol/article ref: IAU 1101493 Number of pages (not including this page): 7 Author queries: Typesetter queries: Non-printed material: The Physics of Sun and Star
The Magnetic Sun. CESAR s Booklet
 The Magnetic Sun CESAR s Booklet 1 Introduction to planetary magnetospheres and the interplanetary medium Most of the planets in our Solar system are enclosed by huge magnetic structures, named magnetospheres
The information you need will be on the internet. Please label your data with the link you used, in case we need to look at the data again.
 Solar Activity in Many Wavelengths In this lab you will be finding the sidereal rotation period of the Sun from observations of sunspots, you will compare the lifetimes of larger and smaller sunspots,
Multi-wavelength VLA and Spacecraft Observations of Evolving Coronal Structures Outside Flares
 Multi-Wavelength Investigations of Solar Activity Proceedings of IAU Symposium No. 223, 2004 A.V. Stepanov, E.E. Benevolenskaya & A.G. Kosovichev, eds. Multi-wavelength VLA and Spacecraft Observations
Solar Magnetic Fields Jun 07 UA/NSO Summer School 1
 Solar Magnetic Fields 2 12 Jun 07 UA/NSO Summer School 1 Solar Magnetic Fields 2 (12 June) An introduction to the instruments and techniques used to remotely measure the solar magnetic field Stokes Vectors
arxiv: v1 [astro-ph.sr] 17 Sep 2014
![arxiv: v1 [astro-ph.sr] 17 Sep 2014](/thumbs/94/119407229.jpg "arxiv: v1 [astro-ph.sr] 17 Sep 2014") Mon. Not. R. Astron. Soc., 1?? (22) Printed 29 September 218 (MN LATEX style file v2.2) Improved magnetogram calibration of Solar Magnetic Field Telescope and its comparison with the Helioseismic and Magnetic
Mon. Not. R. Astron. Soc., 1?? (22) Printed 29 September 218 (MN LATEX style file v2.2) Improved magnetogram calibration of Solar Magnetic Field Telescope and its comparison with the Helioseismic and Magnetic
The Solar Physics Research Integrated Network Group SPRING
 The Solar Physics Research Integrated Network Group Markus Roth, Sanjay Gosain, Frank Hill, Michael Thompson European Space Weather Week November 23, 2015 The Need for Synoptic Observations of the Sun