STUDY OF CRITICAL GAP AND ITS EFFECT ON ENTRY CAPACITY OF A ROUNDABOUT IN MIXED TRAFFIC CONDITIONS
|
|
|
- Gabriella Houston
- 5 years ago
- Views:
Transcription


1 STUDY OF CRITICAL GAP AND ITS EFFECT ON ENTRY CAPACITY OF A ROUNDABOUT IN MIXED TRAFFIC CONDITIONS PRESENTED BY, Revathy Pradeep School Of Planning And Architecture, New Delhi GUIDED BY, Dr. Sewa Ram Associate Professor, Dept. Of Transport Planning and Prof. Dr. P.K Sarkar Head of the Department 1 Dept. Of Transport Planning
2 Objectives of the Study Need for Study Presently we use Wardrop equation 1. To critically review various for calculating weaving capacity of a methods to evaluate critical roundabout. gap. Whereas there is no exact method in Indian scenario evaluating entry presently capacity for of a 2. Derive a model critical and entry capacity for Mixed Traffic conditions. roundabout. 3. relating Hence a study of critical gap and its relation to entry capacity in Indian scenario need to be undertaken. 2
3 ROUNDABOUT Roundabouts are intersections with a generally circular shape, characterized by yield on entry and circulation around a central island As per HCM 2010 FLOW PARAMETERS (Veh/Hr) Qe Entry flow Qc Circulating flow a Component of entry, exit flow b Component of entry flow undergoing weaving behavior c Component of circulating flow exiting the roundabout d Component of circulating flow going for right turning behavior and U turn Qc+Qe Total flow in weaving section p (b+c)/(a+b+c+d) 3
4 CAPACITY OF A ROUNDABOUT Entry Capacity of each arm of a Roundabout Total Approach Capacity Of a roundabout Weaving capacity of the roundabout The capacity of roundabouts depends on two major factors: Various Geometric components of the roundabout Circulating flow in the Roundabout ENTRY CAPACITY The capacity of a roundabout is directly influenced by flow patterns. The intersection can be analyzed by both regression as well as analytical model. Regression model: Analytical models: Use of analytical models of preferred for our study since this could help us study acceptability of existing capacity models in the Indian scenario. For this study we will be using the GAP ACCEPTANCE MODEL 4
5 PARAMETERS IN GAP ACCEPTANCE MODELS Gap: A gap is defined as the time span between two consecutive circulating vehicles that create conflict with an entering vehicle. Critical Gap: Critical gap is defined as the minimum gap that all entering drivers of similar locations will accept, assuming all entering drivers are consistent and homogeneous. Follow up Time Follow up time is defined as the time span between two queued vehicles entering the circulating stream in the same gap. Headway: It is the time between two following vehicles and is measured from the first vehicle s front bumper to the following vehicle s front bumper. 5


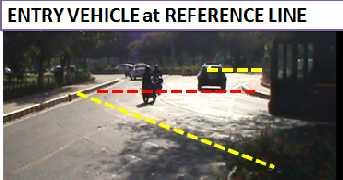
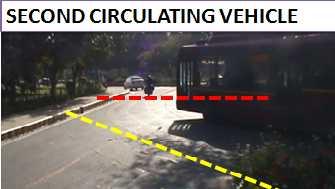
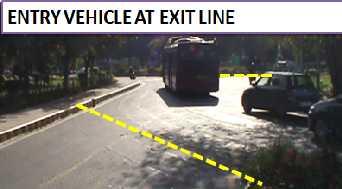
6 Data Collection Video graphic Survey was undertaken SURVEY DURATION: 2Hours in morning and evening Data to be Extracted from the Video Accepted and Rejected gap of Individual Entry Vehicles Video camera should be focused on complete weaving section or entire roundabout GAP DATA EXTRACTION : Marking entry and exit line ENTRY VEHICLE Marking reference line REFERENCE LINE 6


7 Gap Data Extraction As an entry vehicle enters the weaving section the entry time of its front and rare bumper is noted down After its entry the time of front bumper of first circulation vehicle crossing the dynamic reference line in weaving section is noted down The front and rare bumper time of all circulating vehicles are noted down Till the entry vehicle accepts a gap Its exit time is noted down at the end of the weaving section 7
8 Gap Data Extraction 8

9 INPUT PARAMETERS FOR GAP ACCEPTANCE MODEL Critical Gap Input data for gap acceptance At an intersection we have: one major stream (priority movement) of volume qp one minor stream of volume qn tc = critical gap = minimum time gap in the priority stream which a minor street driver is ready to accept for crossing or entering the major stream conflict zone 9
10 Methods for evaluating Selection of a suitable method Critical gap was Evaluated using the following methods: METHOD INPUT DATA DRAWBACKS 1. Logit method 2. Harder method LOGIT, HARDER, Only Accepted Gap for a roundabout is collected and taken as input data, 3. Raff s method Calculates the probability of driver to accept the gap Doesn t have a strong Mathematical base 4. Maximum likelihood method RAFF s Doesn t have a strong Mathematical base 5. Modified MLM (IIT R) Accepted Gap and rejected gap for a roundabout is collected and taken as input data MLM Input Data is accepted and rejected gap of individual consistent drivers decreases the sample size considerably Modified MLM (IIT R) Input Data is accepted and rejected gap of individual consistent drivers Modified MLM method is found to be the best to used 10

11 Overview of critical gap results OVERVIEW OF CRITICAL GAP RESULTS DIFFERENT METHODS LOGIT HARDER RAFF MLM Modified MLM CRRI
12 Entry Capacity Analysis :Methodology Tabulate Entry Flow and Circulating Flow from all the arms of the roundabout For a each value of circulating flow identify the maximum Entry flow i.e. Entry Capacity Plot Entry Capacity Vs. Circulating Flow Input these values into HCM Equation and develop Capacity equation for the roundabout Calculate Critical Gap and Average Follow-Up Time Fit an exponential trend line for Entry Capacity Compare HCM Equation with Field Equation Calculate correction factor to relate HCM equation to Field Equation Validate Corrected equation with data set from other roundabout 12
 Intersection of Nyaya")
 A1 A2 A3 A4 7.64 7.45 7.60 7.")
13 STUDY AREA ID DIAMETER (M) Type Minor Major dia(avg) axis axis Roundabout-1(RA1) Intersection of Nyaya Marg 4 ARM 55.3 and Satya Marg near Italy Embassy APPROCH (M) A1 A2 A3 A
14 HCM (2010) Entry Capacity Model C e = A * e B*Vc Where, 3600 A = tf B= t c 0.5* t f 3600 Ce= Entry Capacity Vc=Circulating Volume tf = follow-up time (s) tc = critical gap (s) HCM Equation For RA1 Parameters Value tc 1.82 HCM Equation tf Ce = x e^( Vc) A 1997 B
15 Entry CapacitY, Ce (Veh/hr) Developing Correction Factor for HCM Capacity Model Entry Capacity Vs Circulating Flow HCM y = e-3E-04x y = 2128e-6E-04x R² = HCM 1000 FIELD DATA Expon. (HCM ) Circulating Flow, Qc (Veh/hr) The field equation is lower than HCM Equation. Capacity is overestimated Possible reasons could be lower value of Critical Gap. In U.S conditions critical gap comes out to be 2.8 seconds whereas for us the Critical Gap is 1.82 seconds Also follow-up time is lower 15
16 CORRECTION FACTOR METHOD 1 In this method the ratio of Entry capacity from HCM Equation to Entry capacity from field equation is multiplied This the Difference in capacities is not constant the circulating flow is divided into three bands. And separate correction factors are calculated for each band METHOD 2 In this method the difference between entry capacity from field equation and HCM equation is plotted against Circulating Flow. A trend line is fit for this graph. An equation for the difference in Entry capacity Values with respect to the circulating volume Is developed. Source: Roundabout Model Calibration Issues and a Case Study By Rahmi Akcelik,May 2005 Based upon this equation a value is added as a correction factor to the Entry capacity from HCN equation 16
 instead of estimated value of (tf ) can be calculated by: tf = tf (Q1/Q1 ) Source: Roundabout Model")
17 Method 1 The maximum Capacity is obtained under very low circulation flow conditions. Hence There is a decrease in capacity with increase in circulating flow rate. Hence to match the Observed Capacity value of Q1,the follow-up Headway to be specified (tf ) instead of estimated value of (tf ) can be calculated by: tf = tf (Q1/Q1 ) Source: Roundabout Model Calibration Issues and a Case Study By Rahmi Akcelik,May 2005 Since difference is increasing with increase in Qc the Correction factor can be applied to separate bands of Qc Hence the Qc is divided into 3 separate band Circulating flow (Qc) < >
18 Correction factor from both methods METHOD 1: 2000 Entry Capacity Vs Circulating Flow y = e-3E-04x y = e-3E-04x 1800 Entry CapacitY, Ce (Veh/hr) Field Trendline y = 2128e-6E-04x 1600 y = e-3E-04x TRENDLINE Qc<1000 Qc Between 1000 to 2000 Qc>2000 Expon. (TRENDLINE) Expon. (Qc<1000) 600 Expon. (Qc Between 1000 to 2000) Expon. (Qc>2000) Circulating Flow, Qc (Veh/hr) 4000 Expon. (HCM EQUATION) 18
19 Corrected entry capacity model (Method 1) Circulating flow Correction Factor < > Vc tc Tf Tf CORRECTED Ce CORRECTED FIELD Ce EQUATION Ce= Entry Capacity Vc=Circulating Volume tf = follow-up time (s), tc = critical gap (s) tf = Corrected Follow-up time (s) c = Correction Factor INFERENCE: CORRECTION FACTOR This method doesn t give a uniform capacity equation the values produced This method of developing corrected equation is not preferable since in causes the follow-up time to be greater than the critical gap. 19
20 Difference between Field and HCM equation Entry capacity ROUNDABOUT IN MIXED TRAFFIC CONDITIONS Method Difference between Field and HCM equation Entry capacity Vs Circulating Flow Difference between Field and HCM equation Entry capacity Circulating Flow, Qc (Veh/hr) The difference between the entry capacity from the field equation and the HCM equation is plotted against the value of corresponding Circulating Flow It is seen that the difference is constantly increasing till Circulating Flow of 2500 veh/hr A trend line is fit for this graph. An equation for the difference in Entry capacity Values with respect to the circulating volume Is developed. Based upon this equation a value is added as a correction factor to the Entry 20capacity from HCN equation
21 Entry CapacitY, Ce (Veh/hr) METHOD 2: Field Trendline y = 2128e-6E-04x Entry Capacity Vs Circulating Flow trendline Corrected Equation HCM Equation Expon. (trendline) Expon. (HCM Equation) Circulating Flow, Qc (Veh/hr) 21
22 Corrected entry capacity model (Method 2) Correction Factor (C.f)= 5 *(Vc0.5615) Vc tc tf Vc Ce Difference Corrected Ce Field Trendline (Ce) This method gives an uniform capacity equation with lesser variation from the field capacity equation 22
 Major ICD dia(avg) ICD 1 ICD 2 axis (avg) 56.3 57.05 78.1 APPROCH (M) A1 1.65 tf 1.6305 A 2208 B 0.000232 A3 A4 75.2 76.65 7.81 7.41 7.75 7.")
23 VALIDATION DIAMETER (M) ID Type RA- 2 (Intersection of Shanti Path 4 ARM and Panchshel Marg near US Embassy ) Parameters Minor axis 57.8 ICD (M) Major ICD dia(avg) ICD 1 ICD 2 axis (avg) APPROCH (M) A tf A 2208 B A3 A Value tc A2 23
24 Entry CapacitY, Ce (Veh/hr) COMPARISON OF FIELD EQUATION WITH CORRECTED EQUATION BY METHOD 2 (Data from RA-2) Ce(trendline) 1500 y = e-5E-05x 1000 y = e-1E-05x 500 coorected hcm Expon. (Ce(trendline)) Expon. (HCM Equation) Circulating Flow, Qc (Veh/hr) METHOD 2 Qc HCM Equation Ce(trendline) Correction CORRECTED Y= 2108*e^( * Vc) Factor HCM HCM Equation The second model is consistent with the data from other roundabout The first method doesn t work for all type to roundabout as it applies correction to the average follow up time which is varying drastically in our case The model from the second method holds valid due to similarity in flow conditions of both the roundabouts 24
25 Total Capacity Tabulate Entry and circulating Flow from all the four arms separately Plot Circulating Flow Vs Time for all four arms respectively Identify the lowest value of Circulating Flow Calculate Entry Capacity for the arm with least Qc (Ce) Note down entry flow in the other three arms at the same time TOTAL CAPACITY = Ce+Qe1+Qe2+Qe3 Arm 1 Time Qe Arm 2 QC Time Qe ARM3 QC Time Qe Arm4 QC Time Qe QC

26 Total Capacity CIRCULATING FLOW vs TIME Circulating Flow(Veh/hr) ARM 3 Qe3=132 Qe2=1224 ARM 2 Qc=516 Qc= 108 ARM ARM2 ARM3 500 ARM4 0 ARM 4 Qc= Time Ce=1867 Ce Qc1=1608 Qe1=540 Minim um Qc ARM 1 Correct TOTAL HCM ion Correct CAPACI Ce Factor ed Ce ARM1 ARM2 ARM3 ARM4 TY ARM ARM ARM ARM MAX 3775
27 Level of Service An attempt has been made to identify the LOS of the roundabout based upon out comings of the Ph.D. thesis undertaken by Dr. Sewa Ram. The research made an effort to study the different roundabouts with different geometrics demonstrating varying traffic flow. From this study LOS off case study roundabouts was evaluated. One of the case study roundabout in the above study has similar geometric and traffic characteristics to the Roundabout-1 (Intersection of Nyaya Satya Marg). Hence LOS of this Roundabout is taken into consideration. 27

28 Level of Service An attempt has been made to identify the LOS of the roundabout based upon out comings of the Ph.D. thesis undertaken by Dr. Sewa Ram. From the Research paper Roundabout 3 matches with the traffic and geometric conditions the our case study roundabout The LOS of the Case study Roundabout comes out to be LOS C 28
29 Conclusion Correction Factor(C.f)= 5 *(Vc^0.5615) When the on field Entry capacity for circulating flow of 250Veh/hr is less than 2000veh/hr the above equation can used to calculate entry capacity. The total capacity comes out to be 3775Veh/hr for the case study roundabout Scope for further studies With a larger data base a Generic equation can be evaluated using the similar procedure. With a larger data set LOS can be evaluated for varying geometric conditions Effect of traffic composition of roundabout capacity Evaluation of capacity in PCU/hr (Static and dynamic) 29

30 30
31 ANNEXURES 31

32 LOGIT METHOD 32
33 Procedure: The time scale is divided into intervals of constant duration say t=0.5 For each vehicle queuing on the entry stream we have to observe all circulating stream gaps which are presented to the driver and, in addition, the accepted gap. From these observations we have to calculate the following frequencies and relative values: Ni= number of all gaps of size, which are provided to entry vehicles Ai= number of accepted gaps of size i Pa= Percentage of gaps accepted Calculate the probability of gaps being accepted in the given interval. ( ) Plot a graph of logarithm of the above obtained value versus the average gap size of the various interval. Develop a linear trend line for the points obtained. Critical gap will be at a point were Probality of acceptance will be 0.5 that is value of ( = 1 => ln (( ) )= 0 ) Hence on equating the equation of the trend line to zero we obtain the 33 value of critical gap.

34 HARDER METHOD 34
35 HARDER METHOD Procedure: The time scale is divided into intervals of constant duration say t=0.5 The centre of each interval i is denoted by ti For each vehicle queuing on the entry stream we have to observe all circulating stream gaps which are presented to the driver and, in addition, the accepted gap. From these observations we have to calculate the following frequencies and relative values: N= number of all gaps of size, which are provided to entry vehicles Ai= number of accepted gaps of size i ri= Ai/Ni The ai values are corrected by a floating average procedure, where each is also weighted with the Ai values. Finally the value of Critical gap (Tc) is found by calculating the probability of gap being accepted in a given interval Major Drawback of both Harder and Logit method is that they only take into account the accepted gaps of drivers they don t account for the gap rejection by the drivers. These methods only provide the probability of driver accepting a certain gap they don t have a strong mathematical background. 35

36 RAFF S METHOD 36
37 RAFF S METHOD The earliest method for estimating critical gaps seems to be that by Raff. In this method the empirical distribution functions of accepted gaps Fa(t) and rejected gaps Fr(t) Is taken. When the sum of cumulative probabilities of accepted gaps and rejected gaps is equal to 1 then a gap of length t is equal to critical gap tc. It means the number of rejected gaps larger than critical gap is equal to the number of accepted gaps smaller than critical gap. Tc is that value of t at which the following functions intercept 1 (t) and (t) where Fa (t) is the cumulative proportion of accepted gap; Fr (t) is the cumulative proportion of rejected gap; t is the headway of two continued vehicles of circulating stream. Raff s method though considers both accepted and rejected gap of individual drivers it is not backed any strong mathematical model. 37

38 MAXIMUM LIKLIHOOD METHOD 38
39 MAXIMUM LIKELIHOOD METHOD MLM uses two terms of gaps accepted gaps and maximum rejected gaps. The maximum rejected gap is the maximum value of all rejected gaps during a driver waits to running into the roundabout. The mean and variance of critical gap can be calculated by use of the maximum likelihood function of probability theory In this method it is assumed that critical gap follows lognormal distribution, [ ] Likelihood of critical gap is taken as the log of the above function. where F(ai) is the logarithm of the gap accepted by the ith driver; F(ri) is the logarithm of the maximum gap rejected by the ith driver, ri=0 if no gap was rejected; 39
40 Procedure The maximum gap rejected (ri) and Accepted Gap of individual drivers is recorded The likelihood of critical gap is calculated. The assume mean and variance of critical gap as 7.0 and 3.0. Now calculate mean and variance of log of critical gap using the following equations. =ln ( + 1) and = ln( ) 0.5 Where, m is the mean of critical gap s is the standard deviation Iterate the values of σ and µ. Substitute into the equation the calculate critical gap =. In MLM method the use of Log function multiple times in calculating likelihood of critical gap causes errors in the outputs in cases were we have very low values of accepted and rejected gaps. 40

41 HCM IIT ROORKEE METHOD 41
42 This method works on the assumption that the critical gap of individual drivers lie somewhere between the maximum rejected gap and accepted gap Ie. Ri+ x =Tc - (1) Ai - x = Tc - (2) When x->0 that gap obtained will be critical gap Hence if we minimize the following function we obtain critical gap n Min Abs Tc R i Abs Ai Tc i 1 This method gives results close to that critical gap values obtained by Maximum Likelihood Method. The method is less tedious also removal of Use of Log function helps remove chances of error during calculations. 42

43 MODIFIED MLM METHOD (By CRRI) By the earlier equation there was a large variation in the values obtained by it. A slight change in the equation helps reduce the huge variations in the calculated values. Here we use a slightly modified version of the earlier mentioned equation. SQRT(0.5*[(Ai-Tc)^2+(Tc-Ri)^2] 43
CHAPTER 2. CAPACITY OF TWO-WAY STOP-CONTROLLED INTERSECTIONS
 CHAPTER 2. CAPACITY OF TWO-WAY STOP-CONTROLLED INTERSECTIONS 1. Overview In this chapter we will explore the models on which the HCM capacity analysis method for two-way stop-controlled (TWSC) intersections
Design Priciples of Traffic Signal
 Design Priciples of Traffic Signal Lecture Notes in Transportation Systems Engineering Prof. Tom V. Mathew Contents 1 Overview 1 2 Definitions and notations 2 3 Phase design 3 3.1 Two phase signals.................................
CHAPTER 3. CAPACITY OF SIGNALIZED INTERSECTIONS
 CHAPTER 3. CAPACITY OF SIGNALIZED INTERSECTIONS 1. Overview In this chapter we explore the models on which the HCM capacity analysis method for signalized intersections are based. While the method has
Roundabout Level of Service
 Roundabout Level of Service Rahmi Akçelik Director Akcelik & Associates Pty Ltd email: rahmi.akcelik@sidrasolutions.com web: www.sidrasolutions.com 8 January 2009 Contents 1. Introduction... 1 2. Fundamental
CE351 Transportation Systems: Planning and Design
 CE351 Transportation Systems: Planning and Design TOPIC: Level of Service (LOS) at Traffic Signals 1 Course Outline Introduction to Transportation Highway Users and their Performance Geometric Design Pavement
Impact of Geometric Factors on the Capacity of Single-Lane Roundabouts
 Impact of Geometric Factors on the Capacity of Single-Lane Roundabouts by Mark T. Johnson, P.E., Corresponding Author MTJ Roundabout Engineering 313 Price Pl., Suite 11 Madison, WI 53705 608-238-5000 mark@mtjengineering.com
Traffic Progression Models
 Traffic Progression Models Lecture Notes in Transportation Systems Engineering Prof. Tom V. Mathew Contents 1 Introduction 1 2 Characterizing Platoon 2 2.1 Variables describing platoon............................
Evaluation of Main Roundabouts of Kurukshetra
 Evaluation of Main Roundabouts of Kurukshetra *G Veerababu * P.G.Student Dept. of Civil Engineering, NIT Kurukshetra, Kurukshetra, Haryana, India. Abstract Traffic rotary is a specialized form of at-grade
Traffic flow theory involves the development of mathematical relationships among
 CHAPTER 6 Fundamental Principles of Traffic Flow Traffic flow theory involves the development of mathematical relationships among the primary elements of a traffic stream: flow, density, and speed. These
Signalized Intersections
 Signalized Intersections Kelly Pitera October 23, 2009 Topics to be Covered Introduction/Definitions D/D/1 Queueing Phasing and Timing Plan Level of Service (LOS) Signal Optimization Conflicting Operational
Traffic signal design-ii
 CHAPTER 4. TRAFFIC SIGNAL DESIGN-II NPTEL May 3, 007 Chapter 4 Traffic signal design-ii 4.1 Overview In the previous chapter, a simple design of cycle time was discussed. Here we will discuss how the cycle
Chapter 5 Traffic Flow Characteristics
 Chapter 5 Traffic Flow Characteristics 1 Contents 2 Introduction The Nature of Traffic Flow Approaches to Understanding Traffic Flow Parameters Connected with Traffic Flow Categories of Traffic Flow The
MODELING PERMISSIVE LEFT-TURN GAP ACCEPTANCE BEHAVIOR AT SIGNALIZED INTERSECTIONS
 MODELING PERMISSIVE LEFT-TURN GAP ACCEPTANCE BEHAVIOR AT SIGNALIZED INTERSECTIONS Ismail Zohdy Thesis submitted to the faculty of the Virginia Polytechnic Institute and State University in partial fulfillment
Analytical Delay Models for Signalized Intersections
 Analytical Delay Models for Signalized Intersections Ali Payidar Akgungor and A. Graham R. Bullen INTRODUCTION Delay is the most important measure of effectiveness (MOE) at a signalized intersection because
Modeling Driver Behavior During Merge Maneuvers
 Southwest Region University Transportation Center Modeling Driver Behavior During Merge Maneuvers SWUTC/98/472840-00064-1 Center for Transportation Research University of Texas at Austin 3208 Red River,
1 h. Page 1 of 12 FINAL EXAM FORMULAS. Stopping Sight Distance. (2 ) N st U Where N=sample size s=standard deviation t=z value for confidence level
 N st U Where N=sample size s=standard deviation t=z value for confidence level") Page 1 of 12 FINAL EXAM FORMULAS Stopping Sight Distance 2 2 V V d 1.47Vt 1.075 i f a 2 2 Vi Vf d 1.47Vt 30( f 0.01 G) Where d = distance (ft) V = speed (mph) t = time (sec) a=deceleration rate (ft/sec
Page 1 of 12 FINAL EXAM FORMULAS Stopping Sight Distance 2 2 V V d 1.47Vt 1.075 i f a 2 2 Vi Vf d 1.47Vt 30( f 0.01 G) Where d = distance (ft) V = speed (mph) t = time (sec) a=deceleration rate (ft/sec
2.1 Traffic Stream Characteristics. Time Space Diagram and Measurement Procedures Variables of Interest
 2.1 Traffic Stream Characteristics Time Space Diagram and Measurement Procedures Variables of Interest Traffic Stream Models 2.1 Traffic Stream Characteristics Time Space Diagram Speed =100km/h = 27.78
Comparative evaluation of roundabout capacities under heterogeneous traffic conditions
 J. Mod. Transport. (215) 23(4):31 324 DOI 1.17/s4534-15-89-8 Comparative evaluation of roundabout capacities under heterogeneous traffic conditions Ramu Arroju 1 Hari Krishna Gaddam 1 Lakshmi Devi Vanumu
CHAPTER 5 DELAY ESTIMATION FOR OVERSATURATED SIGNALIZED APPROACHES
 CHAPTER 5 DELAY ESTIMATION FOR OVERSATURATED SIGNALIZED APPROACHES Delay is an important measure of effectiveness in traffic studies, as it presents the direct cost of fuel consumption and indirect cost
STRC 1st. Comparison of capacity between roundabout design and signalised junction design. Jian-an TAN, Citec ingénieurs conseils SA
 Comparison of capacity between roundabout design and signalised junction design Jian-an TAN, Citec ingénieurs conseils SA Conference paper STRC 2001 Session Engineering STRC 1st Swiss Transport Research
A Review of Gap-Acceptance Capacity Models
 29th Conference of Australian Institutes of Transport Research (CAITR 2007), University of South Australia, Adelaide, Australia, 5-7 December 2007 A Review of Gap-Acceptance Capacity Models Rahmi Akçelik
Signalized Intersection Delay Models
 Signalized Intersection Delay Models Lecture Notes in Transportation Systems Engineering Prof. Tom V. Mathew Contents 1 Introduction 1 2 Types of delay 2 2.1 Stopped Time Delay................................
Impact of Day-to-Day Variability of Peak Hour Volumes on Signalized Intersection Performance
 Impact of Day-to-Day Variability of Peak Hour Volumes on Signalized Intersection Performance Bruce Hellinga, PhD, PEng Associate Professor (Corresponding Author) Department of Civil and Environmental Engineering,
Vehicle Arrival Models : Count
 Transportation System Engineering 34. Vehicle Arrival Models : Count Chapter 34 Vehicle Arrival Models : Count h 1 h 2 h 3 h 4 h 5 h 6 h 7 h 8 h 9 h 10 t 1 t 2 t 3 t 4 Time Figure 34.1: Illustration of
A Cellular Automaton Model for Heterogeneous and Incosistent Driver Behavior in Urban Traffic
 Commun. Theor. Phys. 58 (202) 744 748 Vol. 58, No. 5, November 5, 202 A Cellular Automaton Model for Heterogeneous and Incosistent Driver Behavior in Urban Traffic LIU Ming-Zhe ( ), ZHAO Shi-Bo ( ô ),,
Research Article Headway Distributions Based on Empirical Erlang and Pearson Type III Time Methods Compared
 Research Journal of Applied Sciences, Engineering and Technology 7(21): 4410-4414, 2014 DOI:10.19026/rjaset.7.817 ISSN: 2040-7459; e-issn: 2040-7467 2014 Maxwell Scientific Publication Corp. Submitted:
Traffic Flow Theory and Simulation
 Traffic Flow Theory and Simulation V.L. Knoop Lecture 2 Arrival patterns and cumulative curves Arrival patterns From microscopic to macroscopic 24-3-2014 Delft University of Technology Challenge the future
CIVL 7012/8012. Continuous Distributions
 CIVL 7012/8012 Continuous Distributions Probability Density Function P(a X b) = b ò a f (x)dx Probability Density Function Definition: and, f (x) ³ 0 ò - f (x) =1 Cumulative Distribution Function F(x)
MnDOT Method for Calculating Measures of Effectiveness (MOE) From CORSIM Model Output
 From CORSIM Model Output") MnDOT Method for Calculating Measures of Effectiveness (MOE) From CORSIM Model Output Rev. April 29, 2005 MnDOT Method for Calculating Measures of Effectiveness (MOE) From CORSIM Model Output Table of
MnDOT Method for Calculating Measures of Effectiveness (MOE) From CORSIM Model Output Rev. April 29, 2005 MnDOT Method for Calculating Measures of Effectiveness (MOE) From CORSIM Model Output Table of
Empirical Relation between Stochastic Capacities and Capacities Obtained from the Speed-Flow Diagram
 Empirical Relation between Stochastic Capacities and Capacities Obtained from the Speed-Flow Diagram Dr.-Ing. Justin Geistefeldt Institute for Transportation and Traffic Engineering Ruhr-University Bochum
Bartin, Ozbay, Yanmaz-Tuzel and List 1
 Bartin, Ozbay, Yanmaz-Tuzel and List 1 MODELING AND SIMULATION OF UNCONVENTIONAL TRAFFIC CIRCLES Bekir Bartin Research Associate. Civil and Environmental Engineering Department Rutgers University, New
Signalized Intersection Delay Models
 Transportation System Engineering 56. Signalized Intersection Delay Models Chapter 56 Signalized Intersection Delay Models 56.1 Introduction Signalized intersections are the important points or nodes within
Unsignalized Intersections in Germany - a State of the Art by Werner Brilon, Ning Wu, and Lothar Bondzio
 Unsignalized Intersections in Germany - a State of the Art 1997 by Werner Brilon, Ning Wu, and Lothar Bondzio ABSTRACT This article has been published in: Proceedings of the Third International Symposium
Course Outline Introduction to Transportation Highway Users and their Performance Geometric Design Pavement Design
 Course Outline Introduction to Transportation Highway Users and their Performance Geometric Design Pavement Design Speed Studies - Project Traffic Queuing Intersections Level of Service in Highways and
Signalized Intersection Delay Models
 hapter 56 Signalized Intersection Delay Models 56.1 Introduction Signalized intersections are the important points or nodes within a system of highways and streets. To describe some measure of effectiveness
Signalized Intersection Delay Models
 Chapter 35 Signalized Intersection Delay Models 35.1 Introduction Signalized intersections are the important points or nodes within a system of highways and streets. To describe some measure of effectiveness
Traffic Modelling for Moving-Block Train Control System
 Commun. Theor. Phys. (Beijing, China) 47 (2007) pp. 601 606 c International Academic Publishers Vol. 47, No. 4, April 15, 2007 Traffic Modelling for Moving-Block Train Control System TANG Tao and LI Ke-Ping
Performance Analysis of Delay Estimation Models for Signalized Intersection Networks
 Performance Analysis of Delay Estimation Models for Signalized Intersection Networks Hyung Jin Kim 1, Bongsoo Son 2, Soobeom Lee 3 1 Dept. of Urban Planning and Eng. Yonsei Univ,, Seoul, Korea {hyungkim,
Section 5.1: Logistic Functions
 Section 5.1: Logistic Functions We can assume in many situations that growth is exponential. For population growth, an exponential model is a consequence of the assumption that percentage change (birth
Math 1311 Section 5.5 Polynomials and Rational Functions
 Math 1311 Section 5.5 Polynomials and Rational Functions In addition to linear, exponential, logarithmic, and power functions, many other types of functions occur in mathematics and its applications. In
Best Practices and Techniques for Clearing Intersection Layouts
 Research for winter highway maintenance Manual of Best Practices and Techniques for Clearing Intersection Layouts Prepared by: Yan Qi (Southern Illinois University Edwardsville) Dave Bergner (Monte Vista
YOU CAN BACK SUBSTITUTE TO ANY OF THE PREVIOUS EQUATIONS
 The two methods we will use to solve systems are substitution and elimination. Substitution was covered in the last lesson and elimination is covered in this lesson. Method of Elimination: 1. multiply
Speed-Flow and Bunching Relationships for Uninterrupted Flows
 25th Conference of Australian Institutes of Transport Research (CAITR 2003), University of South Australia, Adelaide, Australia, 3-5 December 2003 First Version: 2 December 03 Speed-Flow and Bunching Relationships
Fundamental Relations of Traffic Flow
 Fundamental Relations of Traffic Flow Lecture Notes in Transportation Systems Engineering Prof. Tom V. Mathew Contents 1 Overview 1 Time mean speed (v t ) 3 Space mean speed ( ) 4 Illustration of mean
Algebra 2 Mississippi College- and Career- Readiness Standards for Mathematics RCSD Unit 1 Data Relationships 1st Nine Weeks
 1 st Nine Weeks Algebra 2 Mississippi College- and Career- Readiness Standards for Mathematics Unit 1 Data Relationships Level 4: I can interpret key features of graphs and tables in terms of the quantities.
Parking Regulations Dundas Street West, from Bathurst Street to Dovercourt Road
 STAFF REPORT ACTION REQUIRED Parking Regulations Dundas Street West, from Bathurst Street to Dovercourt Road Date: October 28, 2008 To: From: Toronto and East York Community Council Director, Transportation
JEP John E. Jack Pflum, P.E. Consulting Engineering 7541 Hosbrook Road, Cincinnati, OH Telephone:
 JEP John E. Jack Pflum, P.E. Consulting Engineering 7541 Hosbrook Road, Cincinnati, OH 45243 Email: jackpflum1@gmail.com Telephone: 513.919.7814 MEMORANDUM REPORT Traffic Impact Analysis Proposed Soccer
Alg II Syllabus (First Semester)
") Alg II Syllabus (First Semester) Unit 1: Solving linear equations and inequalities Lesson 01: Solving linear equations Lesson 02: Solving linear inequalities (See Calculator Appendix A and associated video.)
Alg II Syllabus (First Semester) Unit 1: Solving linear equations and inequalities Lesson 01: Solving linear equations Lesson 02: Solving linear inequalities (See Calculator Appendix A and associated video.)
Supplementary Technical Details and Results
 Supplementary Technical Details and Results April 6, 2016 1 Introduction This document provides additional details to augment the paper Efficient Calibration Techniques for Large-scale Traffic Simulators.
Goal: Simplify and solve exponential expressions and equations
 Pre- Calculus Mathematics 12 4.1 Exponents Part 1 Goal: Simplify and solve exponential expressions and equations Logarithms involve the study of exponents so is it vital to know all the exponent laws.
1.225 Transportation Flow Systems Quiz (December 17, 2001; Duration: 3 hours)
") 1.225 Transportation Flow Systems Quiz (December 17, 2001; Duration: 3 hours) Student Name: Alias: Instructions: 1. This exam is open-book 2. No cooperation is permitted 3. Please write down your name
1.225 Transportation Flow Systems Quiz (December 17, 2001; Duration: 3 hours) Student Name: Alias: Instructions: 1. This exam is open-book 2. No cooperation is permitted 3. Please write down your name
Introduction. Probability and distributions
 Introduction. Probability and distributions Joe Felsenstein Genome 560, Spring 2011 Introduction. Probability and distributions p.1/18 Probabilities We will assume you know that Probabilities of mutually
VCE. VCE Maths Methods 1 and 2 Pocket Study Guide
 VCE VCE Maths Methods 1 and 2 Pocket Study Guide Contents Introduction iv 1 Linear functions 1 2 Quadratic functions 10 3 Cubic functions 16 4 Advanced functions and relations 24 5 Probability and simulation
Cell Transmission Models
 Cell Transmission Models Lecture Notes in Transportation Systems Engineering Prof. Tom V. Mathew Contents 1 Introduction 1 2 Single source and sink CTM model 2 2.1 Basic Premise...................................
MODELLING CRITICAL GAPS FOR U-TURN VEHICLES AT MEDIAN OPENINGS UNDER INDIAN MIXED TRAFFIC CONDITIONS
 MODELLING CRITICAL GAPS FOR U-TURN VEHICLES AT MEDIAN OPENINGS UNDER INDIAN MIXED TRAFFIC CONDITIONS SUPRABEET DATTA DEPARTMENT OF CIVIL ENGINEERING NATIONAL INSTITUTE OF TECHNOLOGY ROURKELA-769008, ODISHA
Cluster Heading Standard MVP. Analyze proportional relationships and use them to solve real- world and mathematical problems.
 Quarter 1 Review of 7 th and 8 th grade Standards: Review Total Days 45 REVIEW OF 7 th and 8 th grade standards: Ratios and Proportional Relationships Analyze proportional relationships and use them to
Assessing the uncertainty in micro-simulation model outputs
 Assessing the uncertainty in micro-simulation model outputs S. Zhu 1 and L. Ferreira 2 1 School of Civil Engineering, Faculty of Engineering, Architecture and Information Technology, The University of
Review Notes for IB Standard Level Math
 Review Notes for IB Standard Level Math 1 Contents 1 Algebra 8 1.1 Rules of Basic Operations............................... 8 1.2 Rules of Roots..................................... 8 1.3 Rules of Exponents...................................
Queuing delay models for single-lane roundaboutst. AIMEE FLANNERY*:j:, JEFFREY P. KHAROUFEH, NATARAJAN GAUTAMIl and LILY ELEFTERIADOUII
 Civil Engineering and Environmental Systems Vol. 22, No.3, September 2005, 133-150 to Taylor & Francis ~ Taylor&FrandsGroup Queuing delay models for single-lane roundaboutst AIMEE FLANNERY*:j:, JEFFREY
DIFFERENTIATION RULES
 3 DIFFERENTIATION RULES DIFFERENTIATION RULES We have: Seen how to interpret derivatives as slopes and rates of change Seen how to estimate derivatives of functions given by tables of values Learned how
Solve by equating exponents
 EXAMPLE 1 x Solve 4 = 1 Solve by equating exponents x 3 SOLUTION x 1 4 = x x 3 1 ( ) = ( ) x x + 3 = x = x + 3 x = 1 x 3 Write original equation. Rewrite 4 and base. 1 as powers with Power of a power property
ATM VP-Based Ring Network Exclusive Video or Data Traffics
 ATM VP-Based Ring Network Exclusive Video or Data Traffics In this chapter, the performance characteristic of the proposed ATM VP-Based Ring Network exclusive video or data traffic is studied. The maximum
Mathematics Standards for High School Advanced Quantitative Reasoning
 Mathematics Standards for High School Advanced Quantitative Reasoning The Advanced Quantitative Reasoning (AQR) course is a fourth-year launch course designed to be an alternative to Precalculus that prepares
Arterial signal optimization through traffic microscopic simulation
 Roma La Sapienza Master degree in Transport systems engineering Master thesis Arterial signal optimization through traffic microscopic simulation Candidate: Roberta Di Blasi Matricola 1695211 Supervisor:
Recent Researches in Engineering and Automatic Control
 Traffic Flow Problem Simulation in Jordan Abdul Hai Alami Mechanical Engineering Higher Colleges of Technology 17155 Al Ain United Arab Emirates abdul.alami@hct.ac.ae http://sites.google.com/site/alamihu
Probability and Statistics Concepts
 University of Central Florida Computer Science Division COT 5611 - Operating Systems. Spring 014 - dcm Probability and Statistics Concepts Random Variable: a rule that assigns a numerical value to each
Probability Methods in Civil Engineering Prof. Dr. Rajib Maity Department of Civil Engineering Indian Institution of Technology, Kharagpur
 Probability Methods in Civil Engineering Prof. Dr. Rajib Maity Department of Civil Engineering Indian Institution of Technology, Kharagpur Lecture No. # 36 Sampling Distribution and Parameter Estimation
Computing the Signal Duration to Minimize Average Waiting Time using Round Robin Algorithm
 Volume 4, No. 6, June 2013 Journal of Global Research in Computer Science RESEARCH PAPER Available Online at www.jgrcs.info Computing the Signal Duration to Minimize Average Waiting Time using Round Robin
Mathematics Standards for High School Algebra II
 Mathematics Standards for High School Algebra II Algebra II is a course required for graduation and is aligned with the College and Career Ready Standards for Mathematics in High School. Throughout the
Analysis and Design of Urban Transportation Network for Pyi Gyi Ta Gon Township PHOO PWINT ZAN 1, DR. NILAR AYE 2
 www.semargroup.org, www.ijsetr.com ISSN 2319-8885 Vol.03,Issue.10 May-2014, Pages:2058-2063 Analysis and Design of Urban Transportation Network for Pyi Gyi Ta Gon Township PHOO PWINT ZAN 1, DR. NILAR AYE
SPATIAL VARIABILITY MAPPING OF N-VALUE OF SOILS OF MUMBAI CITY USING ARCGIS
 SPATIAL VARIABILITY MAPPING OF N-VALUE OF SOILS OF MUMBAI CITY USING ARCGIS RESHMA RASKAR - PHULE 1, KSHITIJA NADGOUDA 2 1 Assistant Professor, Department of Civil Engineering, Sardar Patel College of
DOI /HORIZONS.B P40 UDC (71) MODELLING METRO STATION BOARDING AND ALIGHTING TIMES 1
 MODELLING METRO STATION BOARDING AND ALIGHTING TIMES 1") DOI 1.2544/HORIZONS.B.3.1.16.P4 UDC 625.42.25.6(71) MODELLING METRO STATION BOARDING AND ALIGHTING TIMES 1 Nikola Krstanoski Department of Transportation and Traffic Engineering Faculty for Technical Sciences
DOI 1.2544/HORIZONS.B.3.1.16.P4 UDC 625.42.25.6(71) MODELLING METRO STATION BOARDING AND ALIGHTING TIMES 1 Nikola Krstanoski Department of Transportation and Traffic Engineering Faculty for Technical Sciences
Flow and Capacity Characteristics on Two-Lane Rural Highways
 128 TRANSPORTATON RESEARCH RECORD 1320 Flow and Capacity Characteristics on Two-Lane Rural Highways ABSHA PoLus, JosEPH CRAus, AND MosHE LrvNEH Traffic operation on two-lane rural highways is unique; no
Mathematics Standards for High School Financial Algebra A and Financial Algebra B
 Mathematics Standards for High School Financial Algebra A and Financial Algebra B Financial Algebra A and B are two semester courses that may be taken in either order or one taken without the other; both
Course ID May 2017 COURSE OUTLINE. Mathematics 130 Elementary & Intermediate Algebra for Statistics
 Non-Degree Applicable Glendale Community College Course ID 010238 May 2017 Catalog Statement COURSE OUTLINE Mathematics 130 Elementary & Intermediate Algebra for Statistics is a one-semester accelerated
transportation research in policy making for addressing mobility problems, infrastructure and functionality issues in urban areas. This study explored
 ABSTRACT: Demand supply system are the three core clusters of transportation research in policy making for addressing mobility problems, infrastructure and functionality issues in urban areas. This study
Due: Monday November 26 th LAB 7: Rivers and Flood Frequency
 1 12.001 Due: Monday November 26 th LAB 7: Rivers and Flood Frequency Overview and Objectives This exercise will provide some hands-on experience with methods used for predicting flood frequency and magnitude.
30. (+) Use the unit circle to explain symmetry (odd and even) and periodicity of trigonometric functions. [F-TF]
![30. (+) Use the unit circle to explain symmetry (odd and even) and periodicity of trigonometric functions. [F-TF]](/thumbs/84/90578705.jpg "30. (+) Use the unit circle to explain symmetry (odd and even) and periodicity of trigonometric functions. [F-TF]") Pre-Calculus Curriculum Map (Revised April 2015) Unit Content Standard Unit 1 Unit Circle 29. (+) Use special triangles to determine geometrically the values of sine, cosine, and tangent for and use the
Pre-Calculus Curriculum Map (Revised April 2015) Unit Content Standard Unit 1 Unit Circle 29. (+) Use special triangles to determine geometrically the values of sine, cosine, and tangent for and use the
Real-Time and Embedded Systems (M) Lecture 5
 Lecture 5") Priority-driven Scheduling of Periodic Tasks (1) Real-Time and Embedded Systems (M) Lecture 5 Lecture Outline Assumptions Fixed-priority algorithms Rate monotonic Deadline monotonic Dynamic-priority algorithms
Priority-driven Scheduling of Periodic Tasks (1) Real-Time and Embedded Systems (M) Lecture 5 Lecture Outline Assumptions Fixed-priority algorithms Rate monotonic Deadline monotonic Dynamic-priority algorithms
401 Review. 6. Power analysis for one/two-sample hypothesis tests and for correlation analysis.
 401 Review Major topics of the course 1. Univariate analysis 2. Bivariate analysis 3. Simple linear regression 4. Linear algebra 5. Multiple regression analysis Major analysis methods 1. Graphical analysis
Lectures 5 & 6: Hypothesis Testing
 Lectures 5 & 6: Hypothesis Testing in which you learn to apply the concept of statistical significance to OLS estimates, learn the concept of t values, how to use them in regression work and come across
Data Collection. Lecture Notes in Transportation Systems Engineering. Prof. Tom V. Mathew. 1 Overview 1
 Data Collection Lecture Notes in Transportation Systems Engineering Prof. Tom V. Mathew Contents 1 Overview 1 2 Survey design 2 2.1 Information needed................................. 2 2.2 Study area.....................................
High School Modeling Standards
 High School Modeling Standards Number and Quantity N-Q.1 - Use units as a way to understand problems and to guide the solution of multi-step problems; choose and interpret units consistently in formulas;
Math 132. Population Growth: Raleigh and Wake County
 Math 132 Population Growth: Raleigh and Wake County S. R. Lubkin Application Ask anyone who s been living in Raleigh more than a couple of years what the biggest issue is here, and if the answer has nothing
Assignment #3; Exponential Functions
 AP Calculus Assignment #3; Exponential Functions Name: The equation identifies a family of functions called exponential functions. Notice that the ratio of consecutive amounts of outputs always stay the
Regression. Estimation of the linear function (straight line) describing the linear component of the joint relationship between two variables X and Y.
 describing the linear component of the joint relationship between two variables X and Y.") Regression Bivariate i linear regression: Estimation of the linear function (straight line) describing the linear component of the joint relationship between two variables and. Generally describe as a
Regression Bivariate i linear regression: Estimation of the linear function (straight line) describing the linear component of the joint relationship between two variables and. Generally describe as a
MATHia Unit MATHia Workspace Overview TEKS
 1 Function Overview Searching for Patterns Exploring and Analyzing Patterns Comparing Familiar Function Representations Students watch a video about a well-known mathematician creating an expression for
Control experiments for a network of signalized intersections using the.q simulator
 Control experiments for a network of signalized intersections using the.q simulator Jennie Lioris Alexander A. Kurzhanskiy Pravin Varaiya California PATH, University of California, Berkeley Abstract: The
Chapter 3. Exponential and Logarithmic Functions. 3.2 Logarithmic Functions
 Chapter 3 Exponential and Logarithmic Functions 3.2 Logarithmic Functions 1/23 Chapter 3 Exponential and Logarithmic Functions 3.2 4, 8, 14, 16, 18, 20, 22, 30, 31, 32, 33, 34, 39, 42, 54, 56, 62, 68,
Section 6.1: Composite Functions
 Section 6.1: Composite Functions Def: Given two function f and g, the composite function, which we denote by f g and read as f composed with g, is defined by (f g)(x) = f(g(x)). In other words, the function
A cork model for parking
 A cork model for parking Marco Alderighi U. Valle d Aosta SIET 2013 Venezia Marco Alderighi U. Valle d Aosta () Cork model SIET 2013 Venezia 1 / 26 The problem Many facilities, such as department stores,
Lesson 4b More on LOGARITHMS
 Lesson 4b More on LOGARITHMS Learning Packet Student Name Due Date Class Time/Day Submission Date THIS BOX FOR INSTRUCTOR GRADING USE ONLY Mini-Lesson is complete and information presented is as found
Lesson 18 - Solving & Applying Exponential Equations Using Logarithms
 Lesson 18 - Solving & Applying Exponential Equations Using Logarithms IB Math HL1 - Santowski 1 Fast Five! Solve the following:! (a) 5 x = 53! (b) log 3 38=x! (c) Solve 2 x = 7. HENCE, ALGEBRAICALLY solve
Prentice Hall Stats: Modeling the World 2004 (Bock) Correlated to: National Advanced Placement (AP) Statistics Course Outline (Grades 9-12)
 Correlated to: National Advanced Placement (AP) Statistics Course Outline (Grades 9-12)") National Advanced Placement (AP) Statistics Course Outline (Grades 9-12) Following is an outline of the major topics covered by the AP Statistics Examination. The ordering here is intended to define the
National Advanced Placement (AP) Statistics Course Outline (Grades 9-12) Following is an outline of the major topics covered by the AP Statistics Examination. The ordering here is intended to define the
Modeling Fundamentals: Concepts of Models and Systems Concepts of Modeling Classifications of Models
 Introduction to Modeling and Simulation Modeling Fundamentals: Concepts of Models and Systems Concepts of Modeling Classifications of Models OSMAN BALCI Professor Department of Computer Science Virginia
Neutron-Induced Radiation Areas
 Chapter 7 Neutron-Induced Radiation Areas As discussed in the beginning of Chapter 3, neutrons are produced in all nuclear weapon bursts. Some of these neutrons may be captured by the various elements
Unit 22: Sampling Distributions
 Unit 22: Sampling Distributions Summary of Video If we know an entire population, then we can compute population parameters such as the population mean or standard deviation. However, we generally don
MEZZO: OPEN SOURCE MESOSCOPIC. Centre for Traffic Research Royal Institute of Technology, Stockholm, Sweden
 MEZZO: OPEN SOURCE MESOSCOPIC SIMULATION Centre for Traffic Research Royal Institute of Technology, Stockholm, Sweden http://www.ctr.kth.se/mezzo 1 Introduction Mesoscopic models fill the gap between static
NFC ACADEMY COURSE OVERVIEW
 NFC ACADEMY COURSE OVERVIEW Algebra II Honors is a full-year, high school math course intended for the student who has successfully completed the prerequisite course Algebra I. This course focuses on algebraic
HS Algebra IIB Mathematics CC
 Scope And Sequence Timeframe Unit Instructional Topics 1 Week(s) 1 Week(s) 1 Week(s) 1 Week(s) 2 Week(s) 1 Week(s) 2 Week(s) 1 Week(s) Unit 1: Linear and Absolute Value Equations and Inequalities Unit