AP Statistics. The only statistics you can trust are those you falsified yourself. RE- E X P R E S S I N G D A T A ( P A R T 2 ) C H A P 9
|
|
|
- Jessica Hines
- 5 years ago
- Views:
Transcription
1 AP Statistics 1 RE- E X P R E S S I N G D A T A ( P A R T 2 ) C H A P 9 The only statistics you can trust are those you falsified yourself. Sir Winston Churchill ( ) (Attribution to Churchill is ironically falsified)

2 Goal of Re-expression 2 Make the distribution of a variable more symmetric: A symmetric distribution can be analyzed much more easily than a skewed distribution.
3 Goal of Re-expression 3 Make the spread of several groups more alike: With similar spreads, distributions are easier to compare.
4 Goal of Re-expression 4 Make the form of a scatterplot more linear: Linear regression is easy non-linear regression is not!
5 Goal of Re-expression 5 Make the scatter in a scatterplot spread out evenly rather than following a fan-shape: An even scatter is a necessary condition for analysis we will learn about later.
6 What Transformation? 6 Ladder of Powers (see p 237) Power 2 Name Square of data values Comment Try with unimodal distributions that are skewed to the left. 1 Raw data Data with positive and negative values and no bounds are less likely to benefit from re-expression. When in doubt, start here: ½ 0-1/2 Square root of data values We ll use logarithms here Reciprocal square root Counts often benefit from a square root reexpression. Measurements that cannot be negative often benefit from a log re-expression. An uncommon re-expression, but sometimes useful. -1 The reciprocal of the data Ratios of two quantities (e.g., mph) often benefit from a reciprocal.
7 Important Models log yˆ b b x Exponential Model: Original Data Transformed Data y log(y) x This is the zero power on the ladder. It is useful for values that grow (or shrink) by percentages. x
8 Important Models Logarithmic Model: 8 yˆ b b log x 0 1 Original Data Transformed Data y y x log(x) Data with a wide range of x-values or with a scatterplot that is very steep at the left and levels out towards the right.
9 Important Models log Power Model: 9 yˆ b b log x 0 1 Original Data Transformed Data y log(y3) x log(x) The authors of the textbook call this one the Goldilocks Model when steps on the ladder are either too big or too small.
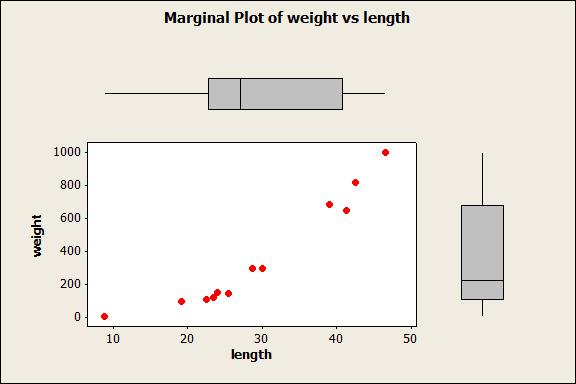
10 Example 10 Below are data from 12 perch caught in a lake in Finland (length in cm and weight in grams). Length (cm) Weight (g) Length (cm) Weight (g)

11 Example 11 In order to create a model to predict weight from length, start by looking at the data: There is a fairly strong, positive, and nonlinear association between weight and length.

12 Example 12
13 Example 13 We need to transform the data (one or both variables) to achieve a more linear relationship. In the biological sciences, power models are fairly common, so we ll start there. Take the logarithm of both variables (either base-10 or base-e log we don t care which). The association between the logs of the variables is quite linear.
14 Example 14 Create a linear model, and then check the residuals to determine if the model may be reasonable. Note you can t use either R or R-squared to determine if your model is reasonable. These statistics are only useful after you assess the model fit. Regression Analysis: log(w) versus log(l) The regression equation is log(w) = log(l) Predictor Coef SE Coef T P Constant log(l) S = R-Sq = 98.9% R-Sq(adj) = 98.7%

15 Example Linear Model remember your calculator doesn t know you are using logtransformed data when it produces the equation. 15 log weight log length The residuals appear to be fairly random, so this linear model is reasonably appropriate.
16 Example 16 Describe what the slope represents: log weight log length For every one-unit increase in the log of length, the log of weight increases by about 3.05.
17 Example 17 Describe what the correlation represents: Predictor Coef SE Coef T P Constant log(l) S = R-Sq = 98.9% R-Sq(adj) = 98.7% The correlation is the square root of R-squared, which is about This indicates there is a very strong, positive, linear relationship between the logs of weight and length.
18 Example 18 Describe what R-squared represents: Predictor Coef SE Coef T P Constant log(l) S = R-Sq = 98.9% R-Sq(adj) = 98.7% About 98.9% of the variability in the log of weight is accounted for by the regression with the log of length.
19 Example 19 Use the model to predict the weight of a perch that is 35 cm long. log weight log length log weight log 35 log weight weight 10 weight The predicted weight for a 35 cm perch is about 446 grams.
20 What Can Go Wrong? 20 Don t expect the re-expressed model to be perfect. Don t use R or R-squared to decide which is the best model. A transformation won t make a multimodal distribution unimodal. You can t transform data into a linear form if the scatterplot rises and falls in a cyclical manner. If your data has values of zero or that are negative, some transformations can t be done (logs, for example). Sometimes, if the negative data are close to zero, you can add a very small constant (1/2 and 1/6 are common) to all data values to make them all positive. If you have data that are dates (years), pick a reference year to be zero, and look at years from the point forward.
21 What Can Go Wrong? 21 Keep the model simple avoid making multiple transformations on the same variable, or mixing quite different transformations on both variables. Stay close to the ladder of powers.
22 Assignment Read Chapter 9 22 Exercises #15, 17-20, 25 xkcd.com
AP Statistics. Chapter 9 Re-Expressing data: Get it Straight
 AP Statistics Chapter 9 Re-Expressing data: Get it Straight Objectives: Re-expression of data Ladder of powers Straight to the Point We cannot use a linear model unless the relationship between the two
Start with review, some new definitions, and pictures on the white board. Assumptions in the Normal Linear Regression Model
 Start with review, some new definitions, and pictures on the white board. Assumptions in the Normal Linear Regression Model A1: There is a linear relationship between X and Y. A2: The error terms (and
Linear Regression. Linear Regression. Linear Regression. Did You Mean Association Or Correlation?
 Did You Mean Association Or Correlation? AP Statistics Chapter 8 Be careful not to use the word correlation when you really mean association. Often times people will incorrectly use the word correlation
MULTIPLE REGRESSION METHODS
 DEPARTMENT OF POLITICAL SCIENCE AND INTERNATIONAL RELATIONS Posc/Uapp 816 MULTIPLE REGRESSION METHODS I. AGENDA: A. Residuals B. Transformations 1. A useful procedure for making transformations C. Reading:
INFERENCE FOR REGRESSION
 CHAPTER 3 INFERENCE FOR REGRESSION OVERVIEW In Chapter 5 of the textbook, we first encountered regression. The assumptions that describe the regression model we use in this chapter are the following. We
Chapter 8. Linear Regression. Copyright 2010 Pearson Education, Inc.
 Chapter 8 Linear Regression Copyright 2010 Pearson Education, Inc. Fat Versus Protein: An Example The following is a scatterplot of total fat versus protein for 30 items on the Burger King menu: Copyright
appstats8.notebook October 11, 2016
 Chapter 8 Linear Regression Objective: Students will construct and analyze a linear model for a given set of data. Fat Versus Protein: An Example pg 168 The following is a scatterplot of total fat versus
Warm-up Using the given data Create a scatterplot Find the regression line
 Time at the lunch table Caloric intake 21.4 472 30.8 498 37.7 335 32.8 423 39.5 437 22.8 508 34.1 431 33.9 479 43.8 454 42.4 450 43.1 410 29.2 504 31.3 437 28.6 489 32.9 436 30.6 480 35.1 439 33.0 444
Conditions for Regression Inference:
 AP Statistics Chapter Notes. Inference for Linear Regression We can fit a least-squares line to any data relating two quantitative variables, but the results are useful only if the scatterplot shows a
Chapter 27 Summary Inferences for Regression
 Chapter 7 Summary Inferences for Regression What have we learned? We have now applied inference to regression models. Like in all inference situations, there are conditions that we must check. We can test
Chapter 8. Linear Regression. The Linear Model. Fat Versus Protein: An Example. The Linear Model (cont.) Residuals
 Residuals") Chapter 8 Linear Regression Copyright 2007 Pearson Education, Inc. Publishing as Pearson Addison-Wesley Slide 8-1 Copyright 2007 Pearson Education, Inc. Publishing as Pearson Addison-Wesley Fat Versus
Chapter 8 Linear Regression Copyright 2007 Pearson Education, Inc. Publishing as Pearson Addison-Wesley Slide 8-1 Copyright 2007 Pearson Education, Inc. Publishing as Pearson Addison-Wesley Fat Versus
1. Create a scatterplot of this data. 2. Find the correlation coefficient.
 How Fast Foods Compare Company Entree Total Calories Fat (grams) McDonald s Big Mac 540 29 Filet o Fish 380 18 Burger King Whopper 670 40 Big Fish Sandwich 640 32 Wendy s Single Burger 470 21 1. Create
HOLLOMAN S AP STATISTICS BVD CHAPTER 08, PAGE 1 OF 11. Figure 1 - Variation in the Response Variable
 Chapter 08: Linear Regression There are lots of ways to model the relationships between variables. It is important that you not think that what we do is the way. There are many paths to the summit We are
Inference for Regression Inference about the Regression Model and Using the Regression Line
 Inference for Regression Inference about the Regression Model and Using the Regression Line PBS Chapter 10.1 and 10.2 2009 W.H. Freeman and Company Objectives (PBS Chapter 10.1 and 10.2) Inference about
23. Inference for regression
 23. Inference for regression The Practice of Statistics in the Life Sciences Third Edition 2014 W. H. Freeman and Company Objectives (PSLS Chapter 23) Inference for regression The regression model Confidence
22S39: Class Notes / November 14, 2000 back to start 1
 Model diagnostics Interpretation of fitted regression model 22S39: Class Notes / November 14, 2000 back to start 1 Model diagnostics 22S39: Class Notes / November 14, 2000 back to start 2 Model diagnostics
Chapter 10 Re-expressing Data: Get It Straight!
 Chapter 0 Re-expressing Data: Get It Straight! 23 Chapter 0 Re-expressing Data: Get It Straight!. s. a) The residuals plot shows no pattern. No re-expression is needed. b) The residuals plot shows a curved
appstats27.notebook April 06, 2017
 Chapter 27 Objective Students will conduct inference on regression and analyze data to write a conclusion. Inferences for Regression An Example: Body Fat and Waist Size pg 634 Our chapter example revolves
Review of Regression Basics
 Review of Regression Basics When describing a Bivariate Relationship: Make a Scatterplot Strength, Direction, Form Model: y-hat=a+bx Interpret slope in context Make Predictions Residual = Observed-Predicted
Chapter 9 Re-expressing Data: Get It Straight!
 Chapter 9 Re-expressing Data: Get It Straight! 53 Chapter 9 Re-expressing Data: Get It Straight!. s. a) The residuals plot shows no pattern. No re-expression is needed. b) The residuals plot shows a curved
AP Statistics Unit 6 Note Packet Linear Regression. Scatterplots and Correlation
 Scatterplots and Correlation Name Hr A scatterplot shows the relationship between two quantitative variables measured on the same individuals. variable (y) measures an outcome of a study variable (x) may
AP STATISTICS Name: Period: Review Unit IV Scatterplots & Regressions
 AP STATISTICS Name: Period: Review Unit IV Scatterplots & Regressions Know the definitions of the following words: bivariate data, regression analysis, scatter diagram, correlation coefficient, independent
Fish act Water temp
 A regression of the amount of calories in a serving of breakfast cereal vs. the amount of fat gave the following results: Calories = 97.53 + 9.6525(Fat). Which of the following is FALSE? a) It is estimated
Correlation & Simple Regression
 Chapter 11 Correlation & Simple Regression The previous chapter dealt with inference for two categorical variables. In this chapter, we would like to examine the relationship between two quantitative variables.
Business Statistics. Lecture 9: Simple Regression
 Business Statistics Lecture 9: Simple Regression 1 On to Model Building! Up to now, class was about descriptive and inferential statistics Numerical and graphical summaries of data Confidence intervals
CS 147: Computer Systems Performance Analysis
 CS 147: Computer Systems Performance Analysis Advanced Regression Techniques CS 147: Computer Systems Performance Analysis Advanced Regression Techniques 1 / 31 Overview Overview Overview Common Transformations
Pre-Calculus Multiple Choice Questions - Chapter S8
 1 If every man married a women who was exactly 3 years younger than he, what would be the correlation between the ages of married men and women? a Somewhat negative b 0 c Somewhat positive d Nearly 1 e
AP Statistics Bivariate Data Analysis Test Review. Multiple-Choice
 Name Period AP Statistics Bivariate Data Analysis Test Review Multiple-Choice 1. The correlation coefficient measures: (a) Whether there is a relationship between two variables (b) The strength of the
Histogram of Residuals. Residual Normal Probability Plot. Reg. Analysis Check Model Utility. (con t) Check Model Utility. Inference.
 Check Model Utility. Inference.") Steps for Regression Simple Linear Regression Make a Scatter plot Does it make sense to plot a line? Check Residual Plot (Residuals vs. X) Are there any patterns? Check Histogram of Residuals Is it Normal?
Steps for Regression Simple Linear Regression Make a Scatter plot Does it make sense to plot a line? Check Residual Plot (Residuals vs. X) Are there any patterns? Check Histogram of Residuals Is it Normal?
Simple Linear Regression. Steps for Regression. Example. Make a Scatter plot. Check Residual Plot (Residuals vs. X)
") Simple Linear Regression 1 Steps for Regression Make a Scatter plot Does it make sense to plot a line? Check Residual Plot (Residuals vs. X) Are there any patterns? Check Histogram of Residuals Is it Normal?
Simple Linear Regression 1 Steps for Regression Make a Scatter plot Does it make sense to plot a line? Check Residual Plot (Residuals vs. X) Are there any patterns? Check Histogram of Residuals Is it Normal?
27. SIMPLE LINEAR REGRESSION II
 27. SIMPLE LINEAR REGRESSION II The Model In linear regression analysis, we assume that the relationship between X and Y is linear. This does not mean, however, that Y can be perfectly predicted from X.
Chapter 9. Correlation and Regression
 Chapter 9 Correlation and Regression Lesson 9-1/9-2, Part 1 Correlation Registered Florida Pleasure Crafts and Watercraft Related Manatee Deaths 100 80 60 40 20 0 1991 1993 1995 1997 1999 Year Boats in
Steps for Regression. Simple Linear Regression. Data. Example. Residuals vs. X. Scatterplot. Make a Scatter plot Does it make sense to plot a line?
 Steps for Regression Simple Linear Regression Make a Scatter plot Does it make sense to plot a line? Check Residual Plot (Residuals vs. X) Are there any patterns? Check Histogram of Residuals Is it Normal?
SMAM 319 Exam1 Name. a B.The equation of a line is 3x + y =6. The slope is a. -3 b.3 c.6 d.1/3 e.-1/3
 SMAM 319 Exam1 Name 1. Pick the best choice. (10 points-2 each) _c A. A data set consisting of fifteen observations has the five number summary 4 11 12 13 15.5. For this data set it is definitely true
Chapter 5 Friday, May 21st
 Chapter 5 Friday, May 21 st Overview In this Chapter we will see three different methods we can use to describe a relationship between two quantitative variables. These methods are: Scatterplot Correlation
BIVARIATE DATA data for two variables
 (Chapter 3) BIVARIATE DATA data for two variables INVESTIGATING RELATIONSHIPS We have compared the distributions of the same variable for several groups, using double boxplots and back-to-back stemplots.
Analysis of Bivariate Data
 Analysis of Bivariate Data Data Two Quantitative variables GPA and GAES Interest rates and indices Tax and fund allocation Population size and prison population Bivariate data (x,y) Case corr® 2 Independent
SMAM 314 Exam 42 Name
 SMAM 314 Exam 42 Name Mark the following statements True (T) or False (F) (10 points) 1. F A. The line that best fits points whose X and Y values are negatively correlated should have a positive slope.
SMAM 319 Exam 1 Name. 1.Pick the best choice for the multiple choice questions below (10 points 2 each)
") SMAM 319 Exam 1 Name 1.Pick the best choice for the multiple choice questions below (10 points 2 each) A b In Metropolis there are some houses for sale. Superman and Lois Lane are interested in the average
SMAM 319 Exam 1 Name 1.Pick the best choice for the multiple choice questions below (10 points 2 each) A b In Metropolis there are some houses for sale. Superman and Lois Lane are interested in the average
Study Guide AP Statistics
 Study Guide AP Statistics Name: Part 1: Multiple Choice. Circle the letter corresponding to the best answer. 1. Other things being equal, larger automobile engines are less fuel-efficient. You are planning
Related Example on Page(s) R , 148 R , 148 R , 156, 157 R3.1, R3.2. Activity on 152, , 190.
 R , 148 R , 148 R , 156, 157 R3.1, R3.2. Activity on 152, , 190.") Name Chapter 3 Learning Objectives Identify explanatory and response variables in situations where one variable helps to explain or influences the other. Make a scatterplot to display the relationship
Name Chapter 3 Learning Objectives Identify explanatory and response variables in situations where one variable helps to explain or influences the other. Make a scatterplot to display the relationship
Index I-1. in one variable, solution set of, 474 solving by factoring, 473 cubic function definition, 394 graphs of, 394 x-intercepts on, 474
 Index A Absolute value explanation of, 40, 81 82 of slope of lines, 453 addition applications involving, 43 associative law for, 506 508, 570 commutative law for, 238, 505 509, 570 English phrases for,
Inferences for Regression
 Inferences for Regression An Example: Body Fat and Waist Size Looking at the relationship between % body fat and waist size (in inches). Here is a scatterplot of our data set: Remembering Regression In
Chapter 7: Sampling Distributions
 Chapter 7: Sampling Distributions Section 7.1 What is a Sampling Distribution? The Practice of Statistics, 4 th edition For AP* STARNES, YATES, MOORE Chapter 7 Sampling Distributions 7.1 What is a Sampling
Chapter 7 9 Review. Select the letter that corresponds to the best answer.
 AP STATISTICS Chapter 7 9 Review MULTIPLE CHOICE Name: Per: Select the letter that corresponds to the best answer. 1. The correlation between X and Y is r = 0.35. If we double each X value, increase each
Chapter 8. Linear Regression /71
 Chapter 8 Linear Regression 1 /71 Homework p192 1, 2, 3, 5, 7, 13, 15, 21, 27, 28, 29, 32, 35, 37 2 /71 3 /71 Objectives Determine Least Squares Regression Line (LSRL) describing the association of two
Simple Linear Regression
 Simple Linear Regression OI CHAPTER 7 Important Concepts Correlation (r or R) and Coefficient of determination (R 2 ) Interpreting y-intercept and slope coefficients Inference (hypothesis testing and confidence
y = a + bx 12.1: Inference for Linear Regression Review: General Form of Linear Regression Equation Review: Interpreting Computer Regression Output
 12.1: Inference for Linear Regression Review: General Form of Linear Regression Equation y = a + bx y = dependent variable a = intercept b = slope x = independent variable Section 12.1 Inference for Linear
STA Module 5 Regression and Correlation. Learning Objectives. Learning Objectives (Cont.) Upon completing this module, you should be able to:
 Upon completing this module, you should be able to:") STA 2023 Module 5 Regression and Correlation Learning Objectives Upon completing this module, you should be able to: 1. Define and apply the concepts related to linear equations with one independent variable.
STA 2023 Module 5 Regression and Correlation Learning Objectives Upon completing this module, you should be able to: 1. Define and apply the concepts related to linear equations with one independent variable.
1) A residual plot: A)
 A residual plot: A)") 1) A residual plot: A) B) C) D) E) displays residuals of the response variable versus the independent variable. displays residuals of the independent variable versus the response variable. displays residuals
1) A residual plot: A) B) C) D) E) displays residuals of the response variable versus the independent variable. displays residuals of the independent variable versus the response variable. displays residuals
Correlation: basic properties.
 Correlation: basic properties. 1 r xy 1 for all sets of paired data. The closer r xy is to ±1, the stronger the linear relationship between the x-data and y-data. If r xy = ±1 then there is a perfect linear
Test 3A AP Statistics Name:
 Test 3A AP Statistics Name: Part 1: Multiple Choice. Circle the letter corresponding to the best answer. 1. Other things being equal, larger automobile engines consume more fuel. You are planning an experiment
EXAMINATIONS OF THE ROYAL STATISTICAL SOCIETY
 EXAMINATIONS OF THE ROYAL STATISTICAL SOCIETY HIGHER CERTIFICATE IN STATISTICS, 009 MODULE 4 : Linear models Time allowed: One and a half hours Candidates should answer THREE questions. Each question carries
5.1 Simplifying Rational Expressions
 5. Simplifying Rational Expressions Now that we have mastered the process of factoring, in this chapter, we will have to use a great deal of the factoring concepts that we just learned. We begin with the
Analysis of Covariance. The following example illustrates a case where the covariate is affected by the treatments.
 Analysis of Covariance In some experiments, the experimental units (subjects) are nonhomogeneous or there is variation in the experimental conditions that are not due to the treatments. For example, a
XVI. Transformations. by: David Scott and David M. Lane
 XVI. Transformations by: David Scott and David M. Lane A. Log B. Tukey's Ladder of Powers C. Box-Cox Transformations D. Exercises The focus of statistics courses is the exposition of appropriate methodology
28. SIMPLE LINEAR REGRESSION III
 28. SIMPLE LINEAR REGRESSION III Fitted Values and Residuals To each observed x i, there corresponds a y-value on the fitted line, y = βˆ + βˆ x. The are called fitted values. ŷ i They are the values of
Multiple Regression Methods
 Chapter 1: Multiple Regression Methods Hildebrand, Ott and Gray Basic Statistical Ideas for Managers Second Edition 1 Learning Objectives for Ch. 1 The Multiple Linear Regression Model How to interpret
[ ESS ESS ] / 2 [ ] / ,019.6 / Lab 10 Key. Regression Analysis: wage versus yrsed, ex
![[ ESS ESS ] / 2 [ ] / ,019.6 / Lab 10 Key. Regression Analysis: wage versus yrsed, ex](/thumbs/73/69434936.jpg "[ ESS ESS ] / 2 [ ] / ,019.6 / Lab 10 Key. Regression Analysis: wage versus yrsed, ex") Lab 1 Key Regression Analysis: wage versus yrsed, ex wage = - 4.78 + 1.46 yrsed +.126 ex Constant -4.78 2.146-2.23.26 yrsed 1.4623.153 9.73. ex.12635.2739 4.61. S = 8.9851 R-Sq = 11.9% R-Sq(adj) = 11.7%
Lab 1 Key Regression Analysis: wage versus yrsed, ex wage = - 4.78 + 1.46 yrsed +.126 ex Constant -4.78 2.146-2.23.26 yrsed 1.4623.153 9.73. ex.12635.2739 4.61. S = 8.9851 R-Sq = 11.9% R-Sq(adj) = 11.7%
Correlation and Regression
 Correlation and Regression Dr. Bob Gee Dean Scott Bonney Professor William G. Journigan American Meridian University 1 Learning Objectives Upon successful completion of this module, the student should
CHAPTER 5 FUNCTIONAL FORMS OF REGRESSION MODELS
 CHAPTER 5 FUNCTIONAL FORMS OF REGRESSION MODELS QUESTIONS 5.1. (a) In a log-log model the dependent and all explanatory variables are in the logarithmic form. (b) In the log-lin model the dependent variable
STA 108 Applied Linear Models: Regression Analysis Spring Solution for Homework #6
 STA 8 Applied Linear Models: Regression Analysis Spring 011 Solution for Homework #6 6. a) = 11 1 31 41 51 1 3 4 5 11 1 31 41 51 β = β1 β β 3 b) = 1 1 1 1 1 11 1 31 41 51 1 3 4 5 β = β 0 β1 β 6.15 a) Stem-and-leaf
Regression and Correlation
 Regression and Correlation Raja Almukkahal Larry Ottman Danielle DeLancey Addie Evans Ellen Lawsky Brenda Meery Say Thanks to the Authors Click http://www.ck12.org/saythanks (No sign in required) To access
7. Do not estimate values for y using x-values outside the limits of the data given. This is called extrapolation and is not reliable.
 AP Statistics 15 Inference for Regression I. Regression Review a. r à correlation coefficient or Pearson s coefficient: indicates strength and direction of the relationship between the explanatory variables
3.4 Exponential and Logarithmic Equations
 3.4 Exponential and Logarithmic Equations Pre-Calculus Mr. Niedert Pre-Calculus 3.4 Exponential and Logarithmic Equations Mr. Niedert 1 / 18 3.4 Exponential and Logarithmic Equations 1 Solving Simple Equations
Business Statistics. Lecture 10: Course Review
 Business Statistics Lecture 10: Course Review 1 Descriptive Statistics for Continuous Data Numerical Summaries Location: mean, median Spread or variability: variance, standard deviation, range, percentiles,
Prof. Bodrero s Guide to Derivatives of Trig Functions (Sec. 3.5) Name:
 Name:") Prof. Bodrero s Guide to Derivatives of Trig Functions (Sec. 3.5) Name: Objectives: Understand how the derivatives of the six basic trig functions are found. Be able to find the derivative for each of
Prof. Bodrero s Guide to Derivatives of Trig Functions (Sec. 3.5) Name: Objectives: Understand how the derivatives of the six basic trig functions are found. Be able to find the derivative for each of
SMAM 314 Computer Assignment 5 due Nov 8,2012 Data Set 1. For each of the following data sets use Minitab to 1. Make a scatterplot.
 SMAM 314 Computer Assignment 5 due Nov 8,2012 Data Set 1. For each of the following data sets use Minitab to 1. Make a scatterplot. 2. Fit the linear regression line. Regression Analysis: y versus x y
Chapter 7. Linear Regression (Pt. 1) 7.1 Introduction. 7.2 The Least-Squares Regression Line
 7.1 Introduction. 7.2 The Least-Squares Regression Line") Chapter 7 Linear Regression (Pt. 1) 7.1 Introduction Recall that r, the correlation coefficient, measures the linear association between two quantitative variables. Linear regression is the method of fitting
Chapter 7 Linear Regression (Pt. 1) 7.1 Introduction Recall that r, the correlation coefficient, measures the linear association between two quantitative variables. Linear regression is the method of fitting
Regression. Estimation of the linear function (straight line) describing the linear component of the joint relationship between two variables X and Y.
 describing the linear component of the joint relationship between two variables X and Y.") Regression Bivariate i linear regression: Estimation of the linear function (straight line) describing the linear component of the joint relationship between two variables and. Generally describe as a
Regression Bivariate i linear regression: Estimation of the linear function (straight line) describing the linear component of the joint relationship between two variables and. Generally describe as a
Lecture 18: Simple Linear Regression
 Lecture 18: Simple Linear Regression BIOS 553 Department of Biostatistics University of Michigan Fall 2004 The Correlation Coefficient: r The correlation coefficient (r) is a number that measures the strength
EXAMINATIONS OF THE ROYAL STATISTICAL SOCIETY
 EXAMINATIONS OF THE ROYAL STATISTICAL SOCIETY HIGHER CERTIFICATE IN STATISTICS, 2011 MODULE 4 : Linear models Time allowed: One and a half hours Candidates should answer THREE questions. Each question
Ph.D. Preliminary Examination Statistics June 2, 2014
 Ph.D. Preliminary Examination Statistics June, 04 NOTES:. The exam is worth 00 points.. Partial credit may be given for partial answers if possible.. There are 5 pages in this exam paper. I have neither
Lecture 12. Functional form
 Lecture 12. Functional form Multiple linear regression model β1 + β2 2 + L+ β K K + u Interpretation of regression coefficient k Change in if k is changed by 1 unit and the other variables are held constant.
IF YOU HAVE DATA VALUES:
 Unit 02 Review Ways to obtain a line of best fit IF YOU HAVE DATA VALUES: 1. In your calculator, choose STAT > 1.EDIT and enter your x values into L1 and your y values into L2 2. Choose STAT > CALC > 8.
Lecture 11: Linear Regression
 Lecture 11: Linear Regression Background Suppose we have an independent variable x (time for example). And, we have some other variable y, and we want to ask how the variable y depends on x (maybe y are
Looking at data: relationships
 Looking at data: relationships Least-squares regression IPS chapter 2.3 2006 W. H. Freeman and Company Objectives (IPS chapter 2.3) Least-squares regression p p The regression line Making predictions:
Vectors. Section 3: Using the vector product
 Vectors Section 3: Using the vector product Notes and Examples These notes contain subsections on Using the vector product in finding the equation of a plane The intersection of two planes The distance
LINEAR REGRESSION ANALYSIS. MODULE XVI Lecture Exercises
 LINEAR REGRESSION ANALYSIS MODULE XVI Lecture - 44 Exercises Dr. Shalabh Department of Mathematics and Statistics Indian Institute of Technology Kanpur Exercise 1 The following data has been obtained on
STA Module 10 Comparing Two Proportions
 STA 2023 Module 10 Comparing Two Proportions Learning Objectives Upon completing this module, you should be able to: 1. Perform large-sample inferences (hypothesis test and confidence intervals) to compare
Inferences for linear regression (sections 12.1, 12.2)
") Inferences for linear regression (sections 12.1, 12.2) Regression case history: do bigger national parks help prevent extinction? ex. area of natural reserves and extinction: 6 national parks in Tanzania
Inferences for linear regression (sections 12.1, 12.2) Regression case history: do bigger national parks help prevent extinction? ex. area of natural reserves and extinction: 6 national parks in Tanzania
Nonlinear Regression Curve Fitting and Regression (Statcrunch) Answers to selected problems
 Answers to selected problems") Nonlinear Regression Curve Fitting and Regression (Statcrunch) Answers to selected problems Act 1&3 1. a) Exponential growth fits well. b) Statcrunch: Ln ( Y ) = 8.5061554 + 0.5017053 ( x ) Exponential
Nonlinear Regression Curve Fitting and Regression (Statcrunch) Answers to selected problems Act 1&3 1. a) Exponential growth fits well. b) Statcrunch: Ln ( Y ) = 8.5061554 + 0.5017053 ( x ) Exponential
IT 403 Practice Problems (2-2) Answers
 Answers") IT 403 Practice Problems (2-2) Answers #1. Which of the following is correct with respect to the correlation coefficient (r) and the slope of the leastsquares regression line (Choose one)? a. They will
IT 403 Practice Problems (2-2) Answers #1. Which of the following is correct with respect to the correlation coefficient (r) and the slope of the leastsquares regression line (Choose one)? a. They will
Unit 6 - Introduction to linear regression
 Unit 6 - Introduction to linear regression Suggested reading: OpenIntro Statistics, Chapter 7 Suggested exercises: Part 1 - Relationship between two numerical variables: 7.7, 7.9, 7.11, 7.13, 7.15, 7.25,
10. Alternative case influence statistics
 10. Alternative case influence statistics a. Alternative to D i : dffits i (and others) b. Alternative to studres i : externally-studentized residual c. Suggestion: use whatever is convenient with the
Chapter 7: Sampling Distributions
 Chapter 7: Sampling Distributions Section 7.1 What is a Sampling Distribution? The Practice of Statistics, 4 th edition For AP* STARNES, YATES, MOORE Chapter 7 Sampling Distributions 7.1 What is a Sampling
What is the easiest way to lose points when making a scatterplot?
 Day #1: Read 141-142 3.1 Describing Relationships Why do we study relationships between two variables? Read 143-144 Page 144: Check Your Understanding Read 144-149 How do you know which variable to put
Confidence Interval for the mean response
 Week 3: Prediction and Confidence Intervals at specified x. Testing lack of fit with replicates at some x's. Inference for the correlation. Introduction to regression with several explanatory variables.
Algebra & Trig Review
 Algebra & Trig Review 1 Algebra & Trig Review This review was originally written for my Calculus I class, but it should be accessible to anyone needing a review in some basic algebra and trig topics. The
Linear Regression Communication, skills, and understanding Calculator Use
 Linear Regression Communication, skills, and understanding Title, scale and label the horizontal and vertical axes Comment on the direction, shape (form), and strength of the relationship and unusual features
Big-oh stuff. You should know this definition by heart and be able to give it,
 Big-oh stuff Definition. if asked. You should know this definition by heart and be able to give it, Let f and g both be functions from R + to R +. Then f is O(g) (pronounced big-oh ) if and only if there
> modlyq <- lm(ly poly(x,2,raw=true)) > summary(modlyq) Call: lm(formula = ly poly(x, 2, raw = TRUE))
) > summary(modlyq) Call: lm(formula = ly poly(x, 2, raw = TRUE))") School of Mathematical Sciences MTH5120 Statistical Modelling I Tutorial 4 Solutions The first two models were looked at last week and both had flaws. The output for the third model with log y and a quadratic
School of Mathematical Sciences MTH5120 Statistical Modelling I Tutorial 4 Solutions The first two models were looked at last week and both had flaws. The output for the third model with log y and a quadratic
Wed, June 26, (Lecture 8-2). Nonlinearity. Significance test for correlation R-squared, SSE, and SST. Correlation in SPSS.
. Nonlinearity. Significance test for correlation R-squared, SSE, and SST. Correlation in SPSS.") Wed, June 26, (Lecture 8-2). Nonlinearity. Significance test for correlation R-squared, SSE, and SST. Correlation in SPSS. Last time, we looked at scatterplots, which show the interaction between two variables,
Wed, June 26, (Lecture 8-2). Nonlinearity. Significance test for correlation R-squared, SSE, and SST. Correlation in SPSS. Last time, we looked at scatterplots, which show the interaction between two variables,
Chapter 3: Describing Relationships
 Chapter 3: Describing Relationships Section 3.2 The Practice of Statistics, 4 th edition For AP* STARNES, YATES, MOORE Chapter 3 Describing Relationships 3.1 Scatterplots and Correlation 3.2 Section 3.2
Is economic freedom related to economic growth?
 Is economic freedom related to economic growth? It is an article of faith among supporters of capitalism: economic freedom leads to economic growth. The publication Economic Freedom of the World: 2003
Math Lecture 3 Notes
 Math 1010 - Lecture 3 Notes Dylan Zwick Fall 2009 1 Operations with Real Numbers In our last lecture we covered some basic operations with real numbers like addition, subtraction and multiplication. This
Take-home Final. The questions you are expected to answer for this project are numbered and italicized. There is one bonus question. Good luck!
 Take-home Final The data for our final project come from a study initiated by the Tasmanian Aquaculture and Fisheries Institute to investigate the growth patterns of abalone living along the Tasmanian
Chapter 7 Linear Regression
 Chapter 7 Linear Regression 1 7.1 Least Squares: The Line of Best Fit 2 The Linear Model Fat and Protein at Burger King The correlation is 0.76. This indicates a strong linear fit, but what line? The line
Chapter 12 - Part I: Correlation Analysis
 ST coursework due Friday, April - Chapter - Part I: Correlation Analysis Textbook Assignment Page - # Page - #, Page - # Lab Assignment # (available on ST webpage) GOALS When you have completed this lecture,
AP Statistics L I N E A R R E G R E S S I O N C H A P 7
 AP Statistics 1 L I N E A R R E G R E S S I O N C H A P 7 The object [of statistics] is to discover methods of condensing information concerning large groups of allied facts into brief and compendious