Hypothesis Tests for One Population Mean
|
|
|
- Felix Logan
- 5 years ago
- Views:
Transcription
1 Hypthesis Tests fr One Ppulatin Mean Chapter 9 Ala Abdelbaki
2 Objective Objective: T estimate the value f ne ppulatin mean Inferential statistics using statistics in rder t estimate parameters We will be wrking with tw inference prcedures: (1) Z-Tests (2) T-Tests
3 The Basic Idea Accrding t lng-standing research, the average life-span f all green sea turtles is 80 years. Suppse yu are cnducting new research n green sea turtles. If yu are lking fr a breakthrugh finding, ideally, what wuld yu like t happen? Claim: Average life-span is 80 years Yur Cunter-claim: Average life-span is nt 80 years Nte: In hypthesis testing, either (1) the claim is true, r (2) the cunter-claim is true!
4 The Basic Idea (cntinued) The claim: Null Hypthesis The cunter-claim: Alternative Hypthesis H 0 : μ = 80 years (claim r status qu) H a : μ < 80 r H a : μ > 80 r H a : μ 80 (suspicins) There are tw pssibilities: Reject H 0 in favr f H a (i.e. claim is nt true) Fail t reject H 0, r accept H 0 (i.e. claim is true)

5 Example: Z-Test Fr years, the cmmissiner f the NBA has claimed that the average GPA is 3.0. We suspect the average GPA is actually less than 3.0 (we usually want this t be true). T test this claim, let s take a SRS f 64 players. We btain a sample mean GPA f 2.0. Assume a ppulatin standard deviatin f 1.0. Using ur sample mean, let s test the cmmissiner s claim at the α = 0.05 level f significance.
6 Example: Z-Test (cntinued) Null Hypthesis: H 0 : μ = 3.0 (claim r status qu) Alternative Hypthesis: H a : μ < 3.0 (ur suspicins) There are nly tw pssible slutins: If the sample mean is significantly less than 3.0, then reject the null hypthesis If the sample mean is greater than r clse enugh t 3.0, then fail t reject the null hypthesis In ur example, will we be inclined t reject r fail t reject the null hypthesis? (let s make an educated guess!)
7 Example: Z-Test (cntinued) We need t standardize the fllwing and cmpare: (1) the established mean (i.e. the claim) (2) the sample mean (1) We treat 3.0 as a hypthesized ppulatin mean, s let the assciated z = 0 (always assume the claim t be true) (2) T standardize the sample mean (called test statistic): z = x μ σ n = = 8
8 Example: Z-Test (cntinued) This indicates that the sample mean lies 8 standard deviatins away frm the claim!! S, we will be inclined t reject the null hypthesis, in favr f the alternative hypthesis. T cmplete the prblem, we cmpute the prbability f btaining z = -8 r z -8. This value is called the p-value. If p is small (i.e. p α), we reject H 0 If p is large (i.e. p > α), we fail t reject H 0
9 Example: Example: Z-Test Nn-pled (cntinued) t-interval (cntinued) A [1] natural We first fllw-up cnduct questin a Z-Test: is, hw much imprvement was made in reading ability frm these directed activities? Nte that the hypthesis test nly tells us whether imprvement Stat > Tests in reading > Z-Test was > Stats made r nt, but it desn t infrm the research n hw much imprvement [2] was After made. entering T answer the statistics, this questin, highlight we the calculate fllwing: a 95% cnfidence interval. μ 0 : 3.0; σ = 1; x = 2. 0; n = 64; μ: < μ 0 Cnclusin: We are 95% cnfident that the mean difference in reading skills between the treatment and cntrl [3] grups Highlight is between Calculate and and press Enter units. The margin f errr is ±9.23.
10 Example: Z-Test (cntinued) H 0 : μ = 3.0 (status qu) H a : μ < 3.0 (ur suspicins) Assumptins: (1) SRS; (2) Nrmal ppulatin r large sample; (3) Ppulatin standard deviatin is given Test statistic: z = 8.0 p = 0 Cnclusin: Since p 0.05, reject the null hypthesis in favr f the alternative hypthesis! At the 5% level f significance, the data prvide sufficient evidence t cnclude that mean high schl GPA amng all NBA players is actually less than 3.0.
11 Example: Critical-Value (cntinued) H 0 : μ = 3.0 (status qu) H a : μ < 3.0 (ur suspicins) Critical-Value Apprach: Using either a z-table r the invnrm(0.05) cmmand n yur calculatr, the critical-value is (since this is a left-tailed test). Definitin: The critical-value separates the rejectin regin frm the nn-rejectin regin. Cnclusin: Since the test statistic z = 8.0 lies in the rejectin regin, we reject the null hypthesis in favr f the alternative hypthesis!
12 Example: Critical-Value (cntinued) Steps t hypthesis testing Frmulate the tw hyptheses, H 0 versus H a Calculate the test statistic and the relevant p-value Cmpare the p-value with the stated significance level, (r cmpare the test statistic t the critical-value) State yur cnclusin in cntext
13 Sme Preliminary Remarks The researcher usually wants t reject the null hypthesis H 0 in favr f the alternative hypthesis H a There are tw appraches t hypthesis testing: (1) p- value apprach r (2) the critical-value apprach If p is small (i.e. p α), we reject H 0 If p is large (i.e. p > α), we fail t reject H 0 In the critical-value apprach: If the test statistic lies in the rejectin regin, then reject H 0 If the test statistic des nt lie in the rejectin regin, then fail t reject the H 0
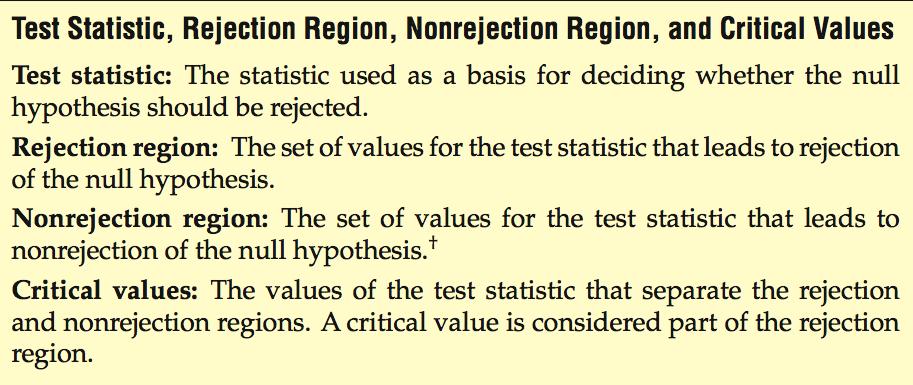
14 Sme Definitins

15 Null and Alternative Hyptheses

16 Example: Z-Test A cmpany that prduces snack fds uses a machine t package 454 g bags f pretzels. We assume that the net weights are nrmally distributed and that the ppulatin standard deviatin f all such weights is 7.8 g. A simple randm sample f 25 bags f pretzels has the net weights, in grams, displayed in the table belw. D the data prvide sufficient evidence t cnclude that the packaging machine is nt wrking prperly? Use alpha equal t 0.05
17 Example: Z-Test (cntinued) H 0 : μ = 454 g (machine is wrking prperly) H a : μ 454 g (machine is nt wrking prperly) Assumptins: The three assumptins are satisfied (what are they?) Test statistic: (This is the standardized sample mean) z = x μ σ n = = p = Cnclusin: Since p 0.05, reject the null hypthesis in favr f the alternative hypthesis! At the 5% level f significance, the data prvide sufficient evidence t cnclude that the machine is NOT wrking prperly.
18 Example: Critical-Value (slutin) H 0 : μ = 454 g (machine is wrking prperly) H a : μ 454 g (machine is nt wrking prperly) Critical-Value Apprach: Using either a z-table r the invnrm(0.025) cmmand n yur calculatr, the criticalvalues are 1.96 and 1.96 (this is a tw-tailed test). Cnclusin: Since the test statistic z = 2.56 lies in the rejectin regin, we reject the null hypthesis in favr f the alternative hypthesis! At the 5% level f significance, the data prvide sufficient evidence t cnclude that the machine is nt wrking prperly.
19 Example: Critical-Value (slutin)
20 Example: Z-Test The U.S. department f agriculture reprts that the mean cst f raising a child frm birth t age 2 in a rural area is $8,390. Yu believe that it csts mre than $8,390 t raise a child. Yu select a randm sample f 900 children (each with age 2) and find the mean cst is $8,425. The ppulatin standard deviatin is $1,540. At the 0.10 level f significance, is there enugh evidence t cnclude that the mean cst is different frm $8,390?
21 Example: Z-Test (cntinued) H 0 : μ = $8,390 (claim) H a : μ > $8,390 (ur suspicins) Assumptins: The 3 assumptins are satisfied (what are they?) Test statistic: (This is the standardized sample mean) z = x μ σ n = 8, 425 8, 390 1, = p = Cnclusin: Since p > 0.10, fail t reject the null hypthesis! At the 10% level f significance, we d nt have enugh evidence t reject the department s claim that the mean cst fr raising a child frm birth t age 2 is $8,390.
22 Example: Critical-Value (slutin) H 0 : μ = $8,390 (claim) H a : μ > $8,390 (ur suspicins) Critical-Value Apprach: Using either a z-table r the invnrm(0.10) cmmand n yur calculatr, the critical-value is 1.28 (this is a ne-tailed test). Cnclusin: Since the test statistic z = des NOT lie in the rejectin regin, we fail t reject the null hypthesis! At the 10% level f significance, we d nt have enugh evidence t reject the department s claim that the mean cst fr raising a child frm birth t age 2 is $8,390.

23 Example: Z-Test Suppse a battery manufacturer claims that the mean life f its AA batteries is 300 minutes. Yu suspect that this claim is nt valid, and that the batteries d nt actually last this lng. T test the claim, a researcher takes a simple randm sample f n = 100 batteries and measure the life f each. Suppse we btain a sample mean f 294 minutes. Assume that the ppulatin standard deviatin is 20 minutes. Des this indicate that the manufacturer s claim is wrng? Use a 0.05 level f significance.
24 Example: Z-Test (cntinued) 1. Which hyptheses are used t establish the claim? H 0 : μ = 294; H a : μ < 294 H 0 : μ = 300; H a : μ < 294 H 0 : μ = 300; H a : μ < 300 H 0 : μ = 300; H a : μ In this prblem μ represents the mean life f all AA batteries the sample mean life f the 300 AA batteries the hypthetical value μ 0 parts (a) and (c)
25 Example: Z-Test (cntinued) 3. In this prblem 300 is the numerical value f a parameter a statistic bth a parameter and a statistic neither a parameter nr a statistic 4. In this prblem 300 is the numerical value f a hypthetical value μ 0 the ppulatin mean the sample mean f a set f batteries nne f the abve
26 Example: Z-Test (slutin) H 0 : μ = 300 (status qu) H a : μ < 300 (ur suspicins) Assumptins: (1) SRS; (2) Nrmal ppulatin r large sample; (3) Ppulatin standard deviatin is given Test statistic: z = 3.0 p = Cnclusin: Since p 0.05, reject the null hypthesis in favr f the alternative hypthesis! At the 5% level f significance, the data prvide sufficient evidence t cnclude that all AA batteries last less than 300 minutes lng, n average.
27 Example: Critical-Value (slutin) H 0 : μ = 300 (status qu) H a : μ < 300 (ur suspicins) Critical-Value Apprach: Using either a z-table r the invnrm(0.05) cmmand n yur calculatr, the critical-value is (this is a left-tailed test). Cnclusin: Since the test statistic z = -3.0 lies in the rejectin regin, we reject the null hypthesis! At the 5% level f significance, the data prvide sufficient evidence t cnclude that all AA batteries last less than 300 minutes lng, n average.
28 Example: T-test An industrial cmpany claims that the mean ph level f water in NOVA Ludun s pnd is 6.8. Hwever, we suspect that the mean ph level is greater than 6.8. T test this claim, yu randmly select 36 water samples frm the pnd and measure the ph f each. The sample mean and sample standard deviatin are 6.85 and 0.24, respectively. Is there enugh evidence t reject the cmpany s claim at the 0.08 level f significance?
29 Example: T-test (slutin) H 0 : μ = 6.8 (claim) H a : μ > 6.8 (ur suspicins) Assumptins: The 3 assumptins are satisfied (what are they?) Test statistic: (This is the standardized sample mean) t = x μ s n = = p = 0.110, df = 35 Cnclusin: Since p > 0.08, fail t reject the null hypthesis! At the 8% level f significance, we d nt have enugh evidence t reject the industrial cmpany s claim that the mean ph level in NOVA s pnd (filled with geese) is equal t 6.8.
30 Example: Critical-Value (slutin) H 0 : μ = 6.8 (claim) H a : μ > 6.8 (ur suspicins) Critical-Value Apprach: Using either a t-table r the invt(0.08, 35) cmmand n yur calculatr, the critical-value is 1.44 (this is a right-tailed test). Cnclusin: Since the test statistic t = 1.25 des NOT lie in the rejectin regin, we fail t reject the null hypthesis! At the 8% level f significance, we d nt have enugh evidence t reject the industrial cmpany s claim that the mean ph level in NOVA s pnd (filled with geese) is equal t 6.8.
31 Example: T-test A cmpany manufactures ball bearings that are t be 1.25 inches in diameter. A randm sample f 81 ball bearings yields a mean diameter f inches. With a sample standard deviatin f inches, is there evidence t cnclude that the manufacturing prcess needs adjusting? Test the claim at the 0.05 level f significance
32 Example: T-test (cntinued) H 0 : μ = 1.25 (manufacturing des nt need adjusting) H a : μ 1.25 (manufacturing needs adjusting) Assumptins: The 3 assumptins are satisfied (what are they?) Test statistic: (This is the standardized sample mean) t = x μ s n = = p = 0.025, df = 80 Cnclusin: Since p 0.05, reject the null hypthesis! At the 5% level f significance, we have sufficient evidence t cnclude that the manufacturing prcess needs adjusting.
33 Example: Critical-Value (slutin) H 0 : μ = 1.25 (manufacturing des nt need adjusting) H a : μ 1.25 (manufacturing needs adjusting) Critical-Value Apprach: Using either a t-table r the invt(0.025, 80) cmmand n yur calculatr, the criticalvalues are and 1.99 (this is a tw-tailed test). Cnclusin: Since the test statistic t = lies in the rejectin regin, we reject the null hypthesis! At the 5% level f significance, we have sufficient evidence t cnclude that the manufacturing prcess needs adjusting.
34 Example: Nn-pled t-interval (cntinued) Example: T-test A An natural emplyment fllw-up infrmatin questin is, service hw much says imprvement that the mean was annual made pay in fr reading full-time ability female frm these wrkers directed ver age 25 activities? and withut Nte high that schl the hypthesis diplmas test is nly $22,000. tells us The whether annual pay imprvement fr a randm in reading sample was f 12 made full-time r nt, female but it desn t wrkers infrm withut the high research schl n diplmas hw much is imprvement listed belw. was At the made T level answer f significance, this questin, test we the calculate claim that a 95% the cnfidence mean salary interval. is $22,000, with suspicins that the actual mean salary is less than this amunt. Cnclusin: We are 95% cnfident that the mean difference in reading skills between the treatment and cntrl 19,009 22,790 18,328 18,161 16,631 23,028 grups is between and units. The margin f errr 19,114 is ± ,176 17,503 19,764 19,316 20,801
35 Example: T-test (cntinued) [1] We first enter the data in a list: Stat > Edit > Enter data in L 1 [2] Nw we cnduct a T-test: Stat > Tests > T-test > Data
36 Example: T-test (slutin) H 0 : μ = $22,000 (claim) H a : μ < $22,000 (ur suspicins) Assumptins: The 3 assumptins are satisfied (what are they?) Test statistic: t = 4.58 p < 0.001, df = 11 Cnclusin: Since p 0.05, reject the null hypthesis! At the 5% level f significance, we have sufficient evidence t cnclude that the mean annual pay amng all female wrkers withut high schl diplmas is less than $22,000.
37 Example: Critical-Value (cntinued) H 0 : μ = $22,000 (claim) H a : μ < $22,000 (ur suspicins) Critical-Value Apprach: Using either a t-table r the invt(0.05, 11) cmmand n yur calculatr, the critical-value is (this is a left-tailed test). Cnclusin: Since the test statistic t = lies in the rejectin regin, we reject the null hypthesis! At the 5% level f significance, we have sufficient evidence t cnclude that the mean annual pay amng all female wrkers withut high schl diplmas is less than $22,000.

38 Mre n p-values
39 Make a decisin Determine whether the researcher shuld reject r fail t reject the null hypthesis in each f the fllwing cases: 1. A right-tailed hypthesis test at level α = 0.05, and the p-value is A tw-tailed hypthesis test at level α = 0.05, and the p-value is A left-tailed hypthesis test at level α = 0.01, and the p-value is 0.08.
40 Make a decisin Determine whether the researcher shuld reject r fail t reject the null hypthesis in each f the fllwing cases: 1. A right-tailed hypthesis test at level α = The critical value is 1.645, and the test statistic is A tw-tailed hypthesis test at level α = The critical value are and 1.96, and the test statistic is A tw-tailed hypthesis test at level α = 0.10, and the test statistic is
41 Never 100% Sure In hypthesis testing, since ur decisin is based upn incmplete infrmatin (a sample rather than an entire ppulatin), there is always the pssibility that the researcher will make the wrng decisin. There are tw types f errrs: Type I Errr and Type II Errr.
42 Type I and II Errrs Frm the previus example, recall the fllwing hyptheses: H 0 : μ = $22,000 H a : μ < $22,000 A Type I errr ccurs if the null hypthesis is in fact true, but the results f the sampling lead us t reject the null hypthesis. A Type II errr ccurs if the null hypthesis is in fact false, but the results f the sampling lead us t fail t reject the null hypthesis.
43 Type I Errr (cntinued) A Type I errr ccurs when a true null hypthesis is rejected. In this case, a Type I errr wuld ccur if in fact μ = $22,000, yet the results f the sampling lead t the cnclusin that μ < $22,000. Interpretatin: A Type I errr ccurs if we cnclude that the mean salary f all female wrkers withut high schl diplmas is less than $22,000, when in fact the mean salary is equal t $22,000.
44 Type II Errr (cntinued) A Type II errr ccurs when a false null hypthesis is accepted. In this case, a Type II errr wuld ccur if in fact μ < $22,000, yet the results f the sampling lead t the cnclusin that μ = $22,000. Interpretatin: A Type II errr ccurs if we cnclude that the mean salary f all female wrkers withut high schl diplmas is equal t $22,000, when in fact the mean salary is less than $22,000.
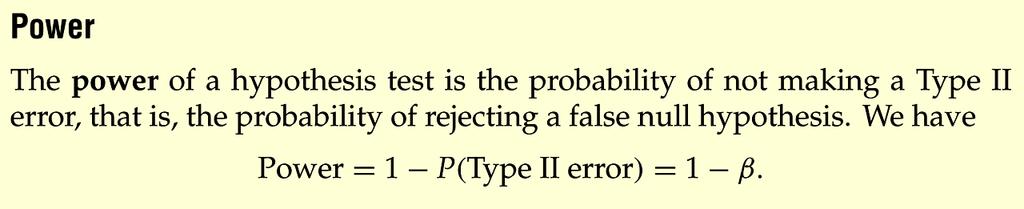
45 *Definitin: Pwer
46 When t use Z- r T-test Fr small samples say, less than 15 as lng as the ppulatin is nrmal r clse t being nrmal. Fr mderate samples say, frm 15 t 29 as lng as the data d nt cntain utliers, and as lng as the ppulatin is nt far frm being nrmally distributed. Fr large samples 30 r greater the prcedure can be used withut restrictin.
47 Example: Nn-pled t-interval (cntinued) Summary A natural Basic lgic: fllw-up Assume questin the null is, hypthesis hw much Himprvement 0 is true, and was either made reject in Hreading 0 r fail ability t reject frm H 0 these directed activities? Nte that the hypthesis test nly tells us whether Null hypthesis imprvement usually in has reading an equality was made sign r nt, but it desn t infrm the research n hw much imprvement was made. T answer this questin, we calculate a 95% cnfidence Researcher interval. typically wants a small p-value Cnclusin: Tw appraches: We are 95% (1) p-value cnfident r (2) that critical-value the mean difference in reading skills between the treatment and cntrl grups Tw types is between f errrs: Type and I and Type units. II The margin f errr is ±9.23.
CHAPTER 24: INFERENCE IN REGRESSION. Chapter 24: Make inferences about the population from which the sample data came.
 MATH 1342 Ch. 24 April 25 and 27, 2013 Page 1 f 5 CHAPTER 24: INFERENCE IN REGRESSION Chapters 4 and 5: Relatinships between tw quantitative variables. Be able t Make a graph (scatterplt) Summarize the
Large Sample Hypothesis Tests for a Population Proportion
 Ntes-10.3a Large Sample Hypthesis Tests fr a Ppulatin Prprtin ***Cin Tss*** 1. A friend f yurs claims that when he tsses a cin he can cntrl the utcme. Yu are skeptical and want him t prve it. He tsses
, which yields. where z1. and z2
 The Gaussian r Nrmal PDF, Page 1 The Gaussian r Nrmal Prbability Density Functin Authr: Jhn M Cimbala, Penn State University Latest revisin: 11 September 13 The Gaussian r Nrmal Prbability Density Functin
AP Statistics Notes Unit Two: The Normal Distributions
 AP Statistics Ntes Unit Tw: The Nrmal Distributins Syllabus Objectives: 1.5 The student will summarize distributins f data measuring the psitin using quartiles, percentiles, and standardized scres (z-scres).
Lesson Plan. Recode: They will do a graphic organizer to sequence the steps of scientific method.
 Lessn Plan Reach: Ask the students if they ever ppped a bag f micrwave ppcrn and nticed hw many kernels were unppped at the bttm f the bag which made yu wnder if ther brands pp better than the ne yu are
Lab 1 The Scientific Method
 INTRODUCTION The fllwing labratry exercise is designed t give yu, the student, an pprtunity t explre unknwn systems, r universes, and hypthesize pssible rules which may gvern the behavir within them. Scientific
SUPPLEMENTARY MATERIAL GaGa: a simple and flexible hierarchical model for microarray data analysis
 SUPPLEMENTARY MATERIAL GaGa: a simple and flexible hierarchical mdel fr micrarray data analysis David Rssell Department f Bistatistics M.D. Andersn Cancer Center, Hustn, TX 77030, USA rsselldavid@gmail.cm
READING STATECHART DIAGRAMS
 READING STATECHART DIAGRAMS Figure 4.48 A Statechart diagram with events The diagram in Figure 4.48 shws all states that the bject plane can be in during the curse f its life. Furthermre, it shws the pssible
o o IMPORTANT REMINDERS Reports will be graded largely on their ability to clearly communicate results and important conclusions.
 BASD High Schl Frmal Lab Reprt GENERAL INFORMATION 12 pt Times New Rman fnt Duble-spaced, if required by yur teacher 1 inch margins n all sides (tp, bttm, left, and right) Always write in third persn (avid
Section 5.8 Notes Page Exponential Growth and Decay Models; Newton s Law
 Sectin 5.8 Ntes Page 1 5.8 Expnential Grwth and Decay Mdels; Newtn s Law There are many applicatins t expnential functins that we will fcus n in this sectin. First let s lk at the expnential mdel. Expnential
ENSC Discrete Time Systems. Project Outline. Semester
 ENSC 49 - iscrete Time Systems Prject Outline Semester 006-1. Objectives The gal f the prject is t design a channel fading simulatr. Upn successful cmpletin f the prject, yu will reinfrce yur understanding
Lifting a Lion: Using Proportions
 Overview Students will wrk in cperative grups t slve a real-wrd prblem by using the bk Hw D yu Lift a Lin? Using a ty lin and a lever, students will discver hw much wrk is needed t raise the ty lin. They
Five Whys How To Do It Better
 Five Whys Definitin. As explained in the previus article, we define rt cause as simply the uncvering f hw the current prblem came int being. Fr a simple causal chain, it is the entire chain. Fr a cmplex
Statistics Statistical method Variables Value Score Type of Research Level of Measurement...
 Lecture 1 Displaying data... 12 Statistics... 13 Statistical methd... 13 Variables... 13 Value... 15 Scre... 15 Type f Research... 15 Level f Measurement... 15 Numeric/Quantitative variables... 15 Ordinal/Rank-rder
Resampling Methods. Chapter 5. Chapter 5 1 / 52
 Resampling Methds Chapter 5 Chapter 5 1 / 52 1 51 Validatin set apprach 2 52 Crss validatin 3 53 Btstrap Chapter 5 2 / 52 Abut Resampling An imprtant statistical tl Pretending the data as ppulatin and
Purpose: Use this reference guide to effectively communicate the new process customers will use for creating a TWC ID. Mobile Manager Call History
 Purpse: Use this reference guide t effectively cmmunicate the new prcess custmers will use fr creating a TWC ID. Overview Beginning n January 28, 2014 (Refer t yur Knwledge Management System fr specific
Math Foundations 20 Work Plan
 Math Fundatins 20 Wrk Plan Units / Tpics 20.8 Demnstrate understanding f systems f linear inequalities in tw variables. Time Frame December 1-3 weeks 6-10 Majr Learning Indicatrs Identify situatins relevant
Bootstrap Method > # Purpose: understand how bootstrap method works > obs=c(11.96, 5.03, 67.40, 16.07, 31.50, 7.73, 11.10, 22.38) > n=length(obs) >
 > n=length(obs) >") Btstrap Methd > # Purpse: understand hw btstrap methd wrks > bs=c(11.96, 5.03, 67.40, 16.07, 31.50, 7.73, 11.10, 22.38) > n=length(bs) > mean(bs) [1] 21.64625 > # estimate f lambda > lambda = 1/mean(bs);
Btstrap Methd > # Purpse: understand hw btstrap methd wrks > bs=c(11.96, 5.03, 67.40, 16.07, 31.50, 7.73, 11.10, 22.38) > n=length(bs) > mean(bs) [1] 21.64625 > # estimate f lambda > lambda = 1/mean(bs);
1b) =.215 1c).080/.215 =.372
 =.215 1c).080/.215 =.372") Practice Exam 1 - Answers 1. / \.1/ \.9 (D+) (D-) / \ / \.8 / \.2.15/ \.85 (T+) (T-) (T+) (T-).080.020.135.765 1b).080 +.135 =.215 1c).080/.215 =.372 2. The data shwn in the scatter plt is the distance
Practice Exam 1 - Answers 1. / \.1/ \.9 (D+) (D-) / \ / \.8 / \.2.15/ \.85 (T+) (T-) (T+) (T-).080.020.135.765 1b).080 +.135 =.215 1c).080/.215 =.372 2. The data shwn in the scatter plt is the distance
B. Definition of an exponential
 Expnents and Lgarithms Chapter IV - Expnents and Lgarithms A. Intrductin Starting with additin and defining the ntatins fr subtractin, multiplicatin and divisin, we discvered negative numbers and fractins.
CS 477/677 Analysis of Algorithms Fall 2007 Dr. George Bebis Course Project Due Date: 11/29/2007
 CS 477/677 Analysis f Algrithms Fall 2007 Dr. Gerge Bebis Curse Prject Due Date: 11/29/2007 Part1: Cmparisn f Srting Algrithms (70% f the prject grade) The bjective f the first part f the assignment is
BASD HIGH SCHOOL FORMAL LAB REPORT
 BASD HIGH SCHOOL FORMAL LAB REPORT *WARNING: After an explanatin f what t include in each sectin, there is an example f hw the sectin might lk using a sample experiment Keep in mind, the sample lab used
Confidence Intervals and Hypothesis Testing Basic Concepts: Let s start this important chapter with a problem:
 Cnfidence Intervals and Hypthesis Testing Basic Cncepts: Let s start this imprtant chapter with a prblem: The Twn f Newtn sits next t tw rivers, the Sac and Vanzetti. Newtn is made up f 168 land parcels,
Comparing Several Means: ANOVA. Group Means and Grand Mean
 STAT 511 ANOVA and Regressin 1 Cmparing Several Means: ANOVA Slide 1 Blue Lake snap beans were grwn in 12 pen-tp chambers which are subject t 4 treatments 3 each with O 3 and SO 2 present/absent. The ttal
CAUSAL INFERENCE. Technical Track Session I. Phillippe Leite. The World Bank
 CAUSAL INFERENCE Technical Track Sessin I Phillippe Leite The Wrld Bank These slides were develped by Christel Vermeersch and mdified by Phillippe Leite fr the purpse f this wrkshp Plicy questins are causal
Perfrmance f Sensitizing Rules n Shewhart Cntrl Charts with Autcrrelated Data Key Wrds: Autregressive, Mving Average, Runs Tests, Shewhart Cntrl Chart
 Perfrmance f Sensitizing Rules n Shewhart Cntrl Charts with Autcrrelated Data Sandy D. Balkin Dennis K. J. Lin y Pennsylvania State University, University Park, PA 16802 Sandy Balkin is a graduate student
Name: Block: Date: Science 10: The Great Geyser Experiment A controlled experiment
 Science 10: The Great Geyser Experiment A cntrlled experiment Yu will prduce a GEYSER by drpping Ments int a bttle f diet pp Sme questins t think abut are: What are yu ging t test? What are yu ging t measure?
COMP 551 Applied Machine Learning Lecture 11: Support Vector Machines
 COMP 551 Applied Machine Learning Lecture 11: Supprt Vectr Machines Instructr: (jpineau@cs.mcgill.ca) Class web page: www.cs.mcgill.ca/~jpineau/cmp551 Unless therwise nted, all material psted fr this curse
NAME: Prof. Ruiz. 1. [5 points] What is the difference between simple random sampling and stratified random sampling?
![NAME: Prof. Ruiz. 1. [5 points] What is the difference between simple random sampling and stratified random sampling?](/thumbs/86/94020496.jpg "NAME: Prof. Ruiz. 1. [5 points] What is the difference between simple random sampling and stratified random sampling?") CS4445 ata Mining and Kwledge iscery in atabases. B Term 2014 Exam 1 Nember 24, 2014 Prf. Carlina Ruiz epartment f Cmputer Science Wrcester Plytechnic Institute NAME: Prf. Ruiz Prblem I: Prblem II: Prblem
CS4445 ata Mining and Kwledge iscery in atabases. B Term 2014 Exam 1 Nember 24, 2014 Prf. Carlina Ruiz epartment f Cmputer Science Wrcester Plytechnic Institute NAME: Prf. Ruiz Prblem I: Prblem II: Prblem
Math 10 - Exam 1 Topics
 Math 10 - Exam 1 Tpics Types and Levels f data Categrical, Discrete r Cntinuus Nminal, Ordinal, Interval r Rati Descriptive Statistics Stem and Leaf Graph Dt Plt (Interpret) Gruped Data Relative and Cumulative
AP Statistics Practice Test Unit Three Exploring Relationships Between Variables. Name Period Date
 AP Statistics Practice Test Unit Three Explring Relatinships Between Variables Name Perid Date True r False: 1. Crrelatin and regressin require explanatry and respnse variables. 1. 2. Every least squares
Activity Guide Loops and Random Numbers
 Unit 3 Lessn 7 Name(s) Perid Date Activity Guide Lps and Randm Numbers CS Cntent Lps are a relatively straightfrward idea in prgramming - yu want a certain chunk f cde t run repeatedly - but it takes a
SticiGui Chapter 4: Measures of Location and Spread Philip Stark (2013)
") SticiGui Chapter 4: Measures f Lcatin and Spread Philip Stark (2013) Summarizing data can help us understand them, especially when the number f data is large. This chapter presents several ways t summarize
SticiGui Chapter 4: Measures f Lcatin and Spread Philip Stark (2013) Summarizing data can help us understand them, especially when the number f data is large. This chapter presents several ways t summarize
CHAPTER 4 DIAGNOSTICS FOR INFLUENTIAL OBSERVATIONS
 CHAPTER 4 DIAGNOSTICS FOR INFLUENTIAL OBSERVATIONS 1 Influential bservatins are bservatins whse presence in the data can have a distrting effect n the parameter estimates and pssibly the entire analysis,
NUMBERS, MATHEMATICS AND EQUATIONS
 AUSTRALIAN CURRICULUM PHYSICS GETTING STARTED WITH PHYSICS NUMBERS, MATHEMATICS AND EQUATIONS An integral part t the understanding f ur physical wrld is the use f mathematical mdels which can be used t
A New Evaluation Measure. J. Joiner and L. Werner. The problems of evaluation and the needed criteria of evaluation
 III-l III. A New Evaluatin Measure J. Jiner and L. Werner Abstract The prblems f evaluatin and the needed criteria f evaluatin measures in the SMART system f infrmatin retrieval are reviewed and discussed.
Unit 1: Introduction to Biology
 Name: Unit 1: Intrductin t Bilgy Theme: Frm mlecules t rganisms Students will be able t: 1.1 Plan and cnduct an investigatin: Define the questin, develp a hypthesis, design an experiment and cllect infrmatin,
We can see from the graph above that the intersection is, i.e., [ ).
.") MTH 111 Cllege Algebra Lecture Ntes July 2, 2014 Functin Arithmetic: With nt t much difficulty, we ntice that inputs f functins are numbers, and utputs f functins are numbers. S whatever we can d with
MTH 111 Cllege Algebra Lecture Ntes July 2, 2014 Functin Arithmetic: With nt t much difficulty, we ntice that inputs f functins are numbers, and utputs f functins are numbers. S whatever we can d with
Directions: Show all work. When using the calculator write down the function buttons used. not just write numerical solution write
 MAT 1272 Practic Exercises fr the Final Revised Spring 2017 (Ellner) Directins: Shw all wrk. When using the calculatr write dwn the functin buttns used. D nt just write a numerical slutin write A SENTENCE
Physics 2010 Motion with Constant Acceleration Experiment 1
 . Physics 00 Mtin with Cnstant Acceleratin Experiment In this lab, we will study the mtin f a glider as it accelerates dwnhill n a tilted air track. The glider is supprted ver the air track by a cushin
Tree Structured Classifier
 Tree Structured Classifier Reference: Classificatin and Regressin Trees by L. Breiman, J. H. Friedman, R. A. Olshen, and C. J. Stne, Chapman & Hall, 98. A Medical Eample (CART): Predict high risk patients
Fall 2013 Physics 172 Recitation 3 Momentum and Springs
 Fall 03 Physics 7 Recitatin 3 Mmentum and Springs Purpse: The purpse f this recitatin is t give yu experience wrking with mmentum and the mmentum update frmula. Readings: Chapter.3-.5 Learning Objectives:.3.
Math 105: Review for Exam I - Solutions
 1. Let f(x) = 3 + x + 5. Math 105: Review fr Exam I - Slutins (a) What is the natural dmain f f? [ 5, ), which means all reals greater than r equal t 5 (b) What is the range f f? [3, ), which means all
ALE 21. Gibbs Free Energy. At what temperature does the spontaneity of a reaction change?
 Name Chem 163 Sectin: Team Number: ALE 21. Gibbs Free Energy (Reference: 20.3 Silberberg 5 th editin) At what temperature des the spntaneity f a reactin change? The Mdel: The Definitin f Free Energy S
Chapter 2 GAUSS LAW Recommended Problems:
 Chapter GAUSS LAW Recmmended Prblems: 1,4,5,6,7,9,11,13,15,18,19,1,7,9,31,35,37,39,41,43,45,47,49,51,55,57,61,6,69. LCTRIC FLUX lectric flux is a measure f the number f electric filed lines penetrating
MATCHING TECHNIQUES. Technical Track Session VI. Emanuela Galasso. The World Bank
 MATCHING TECHNIQUES Technical Track Sessin VI Emanuela Galass The Wrld Bank These slides were develped by Christel Vermeersch and mdified by Emanuela Galass fr the purpse f this wrkshp When can we use
EASTERN ARIZONA COLLEGE Introduction to Statistics
 EASTERN ARIZONA COLLEGE Intrductin t Statistics Curse Design 2014-2015 Curse Infrmatin Divisin Scial Sciences Curse Number PSY 220 Title Intrductin t Statistics Credits 3 Develped by Adam Stinchcmbe Lecture/Lab
INSTRUMENTAL VARIABLES
 INSTRUMENTAL VARIABLES Technical Track Sessin IV Sergi Urzua University f Maryland Instrumental Variables and IE Tw main uses f IV in impact evaluatin: 1. Crrect fr difference between assignment f treatment
Inference in the Multiple-Regression
 Sectin 5 Mdel Inference in the Multiple-Regressin Kinds f hypthesis tests in a multiple regressin There are several distinct kinds f hypthesis tests we can run in a multiple regressin. Suppse that amng
If (IV) is (increased, decreased, changed), then (DV) will (increase, decrease, change) because (reason based on prior research).
 is (increased, decreased, changed), then (DV) will (increase, decrease, change) because (reason based on prior research).") Science Fair Prject Set Up Instructins 1) Hypthesis Statement 2) Materials List 3) Prcedures 4) Safety Instructins 5) Data Table 1) Hw t write a HYPOTHESIS STATEMENT Use the fllwing frmat: If (IV) is (increased,
Science Fair Prject Set Up Instructins 1) Hypthesis Statement 2) Materials List 3) Prcedures 4) Safety Instructins 5) Data Table 1) Hw t write a HYPOTHESIS STATEMENT Use the fllwing frmat: If (IV) is (increased,
CHM112 Lab Graphing with Excel Grading Rubric
 Name CHM112 Lab Graphing with Excel Grading Rubric Criteria Pints pssible Pints earned Graphs crrectly pltted and adhere t all guidelines (including descriptive title, prperly frmatted axes, trendline
Biochemistry Summer Packet
 Bichemistry Summer Packet Science Basics Metric Cnversins All measurements in chemistry are made using the metric system. In using the metric system yu must be able t cnvert between ne value and anther.
4th Indian Institute of Astrophysics - PennState Astrostatistics School July, 2013 Vainu Bappu Observatory, Kavalur. Correlation and Regression
 4th Indian Institute f Astrphysics - PennState Astrstatistics Schl July, 2013 Vainu Bappu Observatry, Kavalur Crrelatin and Regressin Rahul Ry Indian Statistical Institute, Delhi. Crrelatin Cnsider a tw
Checking the resolved resonance region in EXFOR database
 Checking the reslved resnance regin in EXFOR database Gttfried Bertn Sciété de Calcul Mathématique (SCM) Oscar Cabells OECD/NEA Data Bank JEFF Meetings - Sessin JEFF Experiments Nvember 0-4, 017 Bulgne-Billancurt,
TEST 3A AP Statistics Name: Directions: Work on these sheets. A standard normal table is attached.
 TEST 3A AP Statistics Name: Directins: Wrk n these sheets. A standard nrmal table is attached. Part 1: Multiple Chice. Circle the letter crrespnding t the best answer. 1. In a statistics curse, a linear
Distributions, spatial statistics and a Bayesian perspective
 Distributins, spatial statistics and a Bayesian perspective Dug Nychka Natinal Center fr Atmspheric Research Distributins and densities Cnditinal distributins and Bayes Thm Bivariate nrmal Spatial statistics
CHAPTER 3 INEQUALITIES. Copyright -The Institute of Chartered Accountants of India
 CHAPTER 3 INEQUALITIES Cpyright -The Institute f Chartered Accuntants f India INEQUALITIES LEARNING OBJECTIVES One f the widely used decisin making prblems, nwadays, is t decide n the ptimal mix f scarce
End of Course Algebra I ~ Practice Test #2
 End f Curse Algebra I ~ Practice Test #2 Name: Perid: Date: 1: Order the fllwing frm greatest t least., 3, 8.9, 8,, 9.3 A. 8, 8.9,, 9.3, 3 B., 3, 8, 8.9,, 9.3 C. 9.3, 3,,, 8.9, 8 D. 3, 9.3,,, 8.9, 8 2:
A proposition is a statement that can be either true (T) or false (F), (but not both).
 or false (F), (but not both).") 400 lecture nte #1 [Ch 2, 3] Lgic and Prfs 1.1 Prpsitins (Prpsitinal Lgic) A prpsitin is a statement that can be either true (T) r false (F), (but nt bth). "The earth is flat." -- F "March has 31 days."
400 lecture nte #1 [Ch 2, 3] Lgic and Prfs 1.1 Prpsitins (Prpsitinal Lgic) A prpsitin is a statement that can be either true (T) r false (F), (but nt bth). "The earth is flat." -- F "March has 31 days."
Differentiation Applications 1: Related Rates
 Differentiatin Applicatins 1: Related Rates 151 Differentiatin Applicatins 1: Related Rates Mdel 1: Sliding Ladder 10 ladder y 10 ladder 10 ladder A 10 ft ladder is leaning against a wall when the bttm
Modelling of Clock Behaviour. Don Percival. Applied Physics Laboratory University of Washington Seattle, Washington, USA
 Mdelling f Clck Behaviur Dn Percival Applied Physics Labratry University f Washingtn Seattle, Washingtn, USA verheads and paper fr talk available at http://faculty.washingtn.edu/dbp/talks.html 1 Overview
x x
 Mdeling the Dynamics f Life: Calculus and Prbability fr Life Scientists Frederick R. Adler cfrederick R. Adler, Department f Mathematics and Department f Bilgy, University f Utah, Salt Lake City, Utah
Lecture 13: Markov Chain Monte Carlo. Gibbs sampling
 Lecture 13: Markv hain Mnte arl Gibbs sampling Gibbs sampling Markv chains 1 Recall: Apprximate inference using samples Main idea: we generate samples frm ur Bayes net, then cmpute prbabilities using (weighted)
Chapter 8: The Binomial and Geometric Distributions
 Sectin 8.1: The Binmial Distributins Chapter 8: The Binmial and Gemetric Distributins A randm variable X is called a BINOMIAL RANDOM VARIABLE if it meets ALL the fllwing cnditins: 1) 2) 3) 4) The MOST
CONSTRUCTING STATECHART DIAGRAMS
 CONSTRUCTING STATECHART DIAGRAMS The fllwing checklist shws the necessary steps fr cnstructing the statechart diagrams f a class. Subsequently, we will explain the individual steps further. Checklist 4.6
Experiment #3. Graphing with Excel
 Experiment #3. Graphing with Excel Study the "Graphing with Excel" instructins that have been prvided. Additinal help with learning t use Excel can be fund n several web sites, including http://www.ncsu.edu/labwrite/res/gt/gt-
Assessment Primer: Writing Instructional Objectives
 Assessment Primer: Writing Instructinal Objectives (Based n Preparing Instructinal Objectives by Mager 1962 and Preparing Instructinal Objectives: A critical tl in the develpment f effective instructin
How T o Start A n Objective Evaluation O f Your Training Program
 J O U R N A L Hw T Start A n Objective Evaluatin O f Yur Training Prgram DONALD L. KIRKPATRICK, Ph.D. Assistant Prfessr, Industrial Management Institute University f Wiscnsin Mst training m e n agree that
Unit 1 Review. Vocabulary: Match the Definition on the left with the term on the right.
 Name: KEY Unit 1 Review Vcabulary: Match the Definitin n the left with the term n the right. 1. A pssible explanatin fr an bservatin that can be tested. H 2. The same experiment is set up multiple times
PSU GISPOPSCI June 2011 Ordinary Least Squares & Spatial Linear Regression in GeoDa
 There are tw parts t this lab. The first is intended t demnstrate hw t request and interpret the spatial diagnstics f a standard OLS regressin mdel using GeDa. The diagnstics prvide infrmatin abut the
How do scientists measure trees? What is DBH?
 Hw d scientists measure trees? What is DBH? Purpse Students develp an understanding f tree size and hw scientists measure trees. Students bserve and measure tree ckies and explre the relatinship between
Section 6-2: Simplex Method: Maximization with Problem Constraints of the Form ~
 Sectin 6-2: Simplex Methd: Maximizatin with Prblem Cnstraints f the Frm ~ Nte: This methd was develped by Gerge B. Dantzig in 1947 while n assignment t the U.S. Department f the Air Frce. Definitin: Standard
A Regression Solution to the Problem of Criterion Score Comparability
 A Regressin Slutin t the Prblem f Criterin Scre Cmparability William M. Pugh Naval Health Research Center When the criterin measure in a study is the accumulatin f respnses r behavirs fr an individual
**DO NOT ONLY RELY ON THIS STUDY GUIDE!!!**
 Tpics lists: UV-Vis Absrbance Spectrscpy Lab & ChemActivity 3-6 (nly thrugh 4) I. UV-Vis Absrbance Spectrscpy Lab Beer s law Relates cncentratin f a chemical species in a slutin and the absrbance f that
Writing Guidelines. (Updated: November 25, 2009) Forwards
 Forwards") Writing Guidelines (Updated: Nvember 25, 2009) Frwards I have fund in my review f the manuscripts frm ur students and research assciates, as well as thse submitted t varius jurnals by thers that the majr
Writing Guidelines (Updated: Nvember 25, 2009) Frwards I have fund in my review f the manuscripts frm ur students and research assciates, as well as thse submitted t varius jurnals by thers that the majr
https://goo.gl/eaqvfo SUMMER REV: Half-Life DUE DATE: JULY 2 nd
 NAME: DUE DATE: JULY 2 nd AP Chemistry SUMMER REV: Half-Life Why? Every radiistpe has a characteristic rate f decay measured by its half-life. Half-lives can be as shrt as a fractin f a secnd r as lng
MATCHING TECHNIQUES Technical Track Session VI Céline Ferré The World Bank
 MATCHING TECHNIQUES Technical Track Sessin VI Céline Ferré The Wrld Bank When can we use matching? What if the assignment t the treatment is nt dne randmly r based n an eligibility index, but n the basis
ECEN 4872/5827 Lecture Notes
 ECEN 4872/5827 Lecture Ntes Lecture #5 Objectives fr lecture #5: 1. Analysis f precisin current reference 2. Appraches fr evaluating tlerances 3. Temperature Cefficients evaluatin technique 4. Fundamentals
Unit Project Descriptio
 Unit Prject Descriptin: Using Newtn s Laws f Mtin and the scientific methd, create a catapult r trebuchet that will sht a marshmallw at least eight feet. After building and testing yur machine at hme,
This section is primarily focused on tools to aid us in finding roots/zeros/ -intercepts of polynomials. Essentially, our focus turns to solving.
 Sectin 3.2: Many f yu WILL need t watch the crrespnding vides fr this sectin n MyOpenMath! This sectin is primarily fcused n tls t aid us in finding rts/zers/ -intercepts f plynmials. Essentially, ur fcus
Department of Economics, University of California, Davis Ecn 200C Micro Theory Professor Giacomo Bonanno. Insurance Markets
 Department f Ecnmics, University f alifrnia, Davis Ecn 200 Micr Thery Prfessr Giacm Bnann Insurance Markets nsider an individual wh has an initial wealth f. ith sme prbability p he faces a lss f x (0
First Survey. Carried out by IPR feedback
 First Survey Carried ut by IPR feedback Hell my name is and I am calling frm IPR Feedback. IPR Feedback is a research center hired by Bccni University t study the pinins f the citizens f Arezz regarding
LHS Mathematics Department Honors Pre-Calculus Final Exam 2002 Answers
 LHS Mathematics Department Hnrs Pre-alculus Final Eam nswers Part Shrt Prblems The table at the right gives the ppulatin f Massachusetts ver the past several decades Using an epnential mdel, predict the
making triangle (ie same reference angle) ). This is a standard form that will allow us all to have the X= y=
 ). This is a standard form that will allow us all to have the X= y=") Intrductin t Vectrs I 21 Intrductin t Vectrs I 22 I. Determine the hrizntal and vertical cmpnents f the resultant vectr by cunting n the grid. X= y= J. Draw a mangle with hrizntal and vertical cmpnents
Intrductin t Vectrs I 21 Intrductin t Vectrs I 22 I. Determine the hrizntal and vertical cmpnents f the resultant vectr by cunting n the grid. X= y= J. Draw a mangle with hrizntal and vertical cmpnents
Technical Bulletin. Generation Interconnection Procedures. Revisions to Cluster 4, Phase 1 Study Methodology
 Technical Bulletin Generatin Intercnnectin Prcedures Revisins t Cluster 4, Phase 1 Study Methdlgy Release Date: Octber 20, 2011 (Finalizatin f the Draft Technical Bulletin released n September 19, 2011)
Department of Electrical Engineering, University of Waterloo. Introduction
 Sectin 4: Sequential Circuits Majr Tpics Types f sequential circuits Flip-flps Analysis f clcked sequential circuits Mre and Mealy machines Design f clcked sequential circuits State transitin design methd
INTERNAL AUDITING PROCEDURE
 Yur Cmpany Name INTERNAL AUDITING PROCEDURE Originatin Date: XXXX Dcument Identifier: Date: Prject: Dcument Status: Dcument Link: Internal Auditing Prcedure Latest Revisin Date Custmer, Unique ID, Part
Evaluating enterprise support: state of the art and future challenges. Dirk Czarnitzki KU Leuven, Belgium, and ZEW Mannheim, Germany
 Evaluating enterprise supprt: state f the art and future challenges Dirk Czarnitzki KU Leuven, Belgium, and ZEW Mannheim, Germany Intrductin During the last decade, mircecnmetric ecnmetric cunterfactual
A Matrix Representation of Panel Data
 web Extensin 6 Appendix 6.A A Matrix Representatin f Panel Data Panel data mdels cme in tw brad varieties, distinct intercept DGPs and errr cmpnent DGPs. his appendix presents matrix algebra representatins
M thematics. National 5 Practice Paper D. Paper 1. Duration 1 hour. Total marks 40
 N5 M thematics Natinal 5 Practice Paper D Paper 1 Duratin 1 hur Ttal marks 40 Yu may NOT use a calculatr Attempt all the questins. Use blue r black ink. Full credit will nly be given t slutins which cntain
Lim f (x) e. Find the largest possible domain and its discontinuity points. Why is it discontinuous at those points (if any)?
 e. Find the largest possible domain and its discontinuity points. Why is it discontinuous at those points (if any)?") THESE ARE SAMPLE QUESTIONS FOR EACH OF THE STUDENT LEARNING OUTCOMES (SLO) SET FOR THIS COURSE. SLO 1: Understand and use the cncept f the limit f a functin i. Use prperties f limits and ther techniques,
THESE ARE SAMPLE QUESTIONS FOR EACH OF THE STUDENT LEARNING OUTCOMES (SLO) SET FOR THIS COURSE. SLO 1: Understand and use the cncept f the limit f a functin i. Use prperties f limits and ther techniques,
Cambridge Assessment International Education Cambridge Ordinary Level. Published
 Cambridge Assessment Internatinal Educatin Cambridge Ordinary Level ADDITIONAL MATHEMATICS 4037/1 Paper 1 Octber/Nvember 017 MARK SCHEME Maximum Mark: 80 Published This mark scheme is published as an aid
PHOTOSYNTHESIS THE PRACTICALS 16 APRIL 2014
 PHOTOSYNTHESIS THE PRACTICALS 16 APRIL 2014 Lessn Descriptin In this lessn, we will: Review the prcess f phtsynthesis Study the starch test in leaves Study the varius practicals testing phtsynthesis Lk
CHAPTER 2 Algebraic Expressions and Fundamental Operations
 CHAPTER Algebraic Expressins and Fundamental Operatins OBJECTIVES: 1. Algebraic Expressins. Terms. Degree. Gruping 5. Additin 6. Subtractin 7. Multiplicatin 8. Divisin Algebraic Expressin An algebraic
Pattern Recognition 2014 Support Vector Machines
 Pattern Recgnitin 2014 Supprt Vectr Machines Ad Feelders Universiteit Utrecht Ad Feelders ( Universiteit Utrecht ) Pattern Recgnitin 1 / 55 Overview 1 Separable Case 2 Kernel Functins 3 Allwing Errrs (Sft
I. Analytical Potential and Field of a Uniform Rod. V E d. The definition of electric potential difference is
 Length L>>a,b,c Phys 232 Lab 4 Ch 17 Electric Ptential Difference Materials: whitebards & pens, cmputers with VPythn, pwer supply & cables, multimeter, crkbard, thumbtacks, individual prbes and jined prbes,
Computational modeling techniques
 Cmputatinal mdeling techniques Lecture 4: Mdel checing fr ODE mdels In Petre Department f IT, Åb Aademi http://www.users.ab.fi/ipetre/cmpmd/ Cntent Stichimetric matrix Calculating the mass cnservatin relatins
You need to be able to define the following terms and answer basic questions about them:
 CS440/ECE448 Sectin Q Fall 2017 Midterm Review Yu need t be able t define the fllwing terms and answer basic questins abut them: Intr t AI, agents and envirnments Pssible definitins f AI, prs and cns f
Competency Requirement Details for each badge (information added to badge metadata in
 Using digital badges fr develping high-schl chemistry labratry skills Nami Hennah and Michael K. Seery 1. Nrthamptn Schl fr Bys, Billing Rd, Nrthamptn NN1 5RT, UK. 2. EaStCHEM Schl f Chemistry, University