Lec 5: Factorial Experiment
|
|
|
- Pearl Richard
- 5 years ago
- Views:
Transcription
1 November 21, 2011
2 Example Study of the battery life vs the factors temperatures and types of material. A: Types of material, 3 levels. B: Temperatures, 3 levels.
3 Example Study of the battery life vs the factors temperatures and types of material. A: Types of material, 3 levels. B: Temperatures, 3 levels. In general, factorial designs are most efficient for the study of the effects of two or more factors.
4 Factorial Design In each complete trial or replication of the experiment all possible combinations of the levels of the factors are investigated.
5 Factorial Design In each complete trial or replication of the experiment all possible combinations of the levels of the factors are investigated. Question What s the advantage of the factorial design comparing with two-single factor experient?
6 Advantages of factorial design The two-factor factorial gives estimates with higher precision (given the same number of experimental units).
7 Advantages of factorial design The two-factor factorial gives estimates with higher precision (given the same number of experimental units). The two-factor factorial experiment makes it possible to detect interactions.
8 Example
9
10
11 Manual Calculation
12 Results for the example
13 15 o F 70 o F 125 o F Type Type Type average life average life Temperature type 1 type 2 type 3 Material type

14 15 o F 70 o F 125 o F Type Type Type
15 Multiple Comparison When interaction is significant, comparisons between the means of one factor (A) may be obscured by the interaction (AB). One approach to this situation is to fix factor B at a specific level and apply Tukey s test to the means of factor A at that level.
16 Multiple Comparison When interaction is significant, comparisons between the means of one factor (A) may be obscured by the interaction (AB). One approach to this situation is to fix factor B at a specific level and apply Tukey s test to the means of factor A at that level. Example MSE MSE T 0.05 = q 0.05 (a, f ) = q 0.05 (3, 27) = n 4 ȳ 13. ȳ 23. = 8 ȳ 33. ȳ 23. = 36 ȳ 33. ȳ 13. = 28
17 No interaction in a two-factor model

18 No interaction in a two-factor model
19 Model adequacy checking
20 One observation per cell case Model 1 y ij = µ + τ i + β j + (τβ) ij + ɛ ij i = 1, 2,..., a, j = 1, 2,..., b
21 One observation per cell case Model 1 y ij = µ + τ i + β j + (τβ) ij + ɛ ij i = 1, 2,..., a, j = 1, 2,..., b
22 One observation per cell case Model 1 y ij = µ + τ i + β j + (τβ) ij + ɛ ij i = 1, 2,..., a, j = 1, 2,..., b
23 One observation per cell case Model 1 y ij = µ + τ i + β j + (τβ) ij + ɛ ij i = 1, 2,..., a, j = 1, 2,..., b Model 2 y ij = µ + τ i + β j + ɛ ij i = 1, 2,..., a, j = 1, 2,..., b
24
25 Tukey single-degree-of-freedom test It is helpful in determining whether interaction is present or not. The procedure assumes (τβ) ij = γτ i β j. Then the test partitions the residual sum of squares into two part. One is SS N = [ a i=1 with 1 degree of freedom, and b j=1 y ijy i. y.j y.. (SS A + SS B + y 2.. ab )]2 abss A SS B, SS Error = SS residual SS N, with (a 1)(b 1) 1 degrees of freedom. To test the present of interaction, we compute F 0 = SS N SS Error /[(a 1)(b 1) 1] If F 0 > F α,1,(a 1)(b 1) 1, the hypothesis of no interaction must be rejected.
26 Question Is the two-factor factorial model with one observation per cell identical to the randomized complete block model?
27 Blocking in a Factorial Design Example Study of the battery life vs the factors temperatures and types of material. A: Types of material, 3 levels. B: Temperatures, 3 levels. 9 combinations of A and B. 4 observations per combination. In total 36 observations.
28 Example Study of the battery life vs the factors temperatures and types of material. A: Types of material, 3 levels. B: Temperatures, 3 levels. 9 combinations of A and B. 4 observations per combination. In total 36 observations. 4 blocks.
29
30 Source DF Anova SS MeanSquare F Value Pr > F temperature <.0001 material Interaction block Error Total
31 Three factorial experiment y ijkl = µ + τ i + β j + γ r + (τβ) ij + (τγ) ik + (βγ) jk + (τβγ) ijk + ɛ ijkl i = 1, 2,, a j = 1, 2,, b k = 1, 2,, c l = 1, 2,, n
32
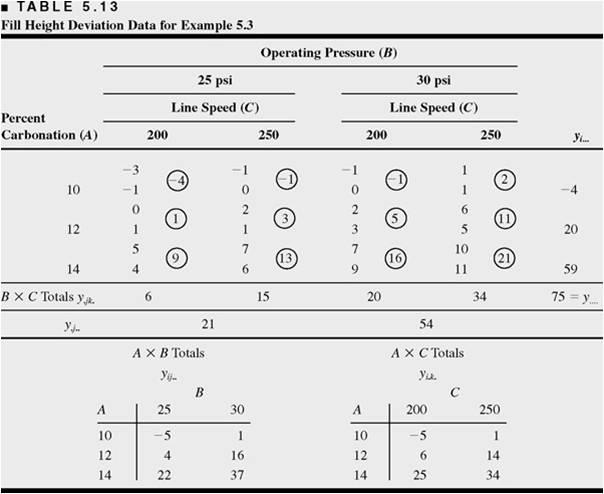
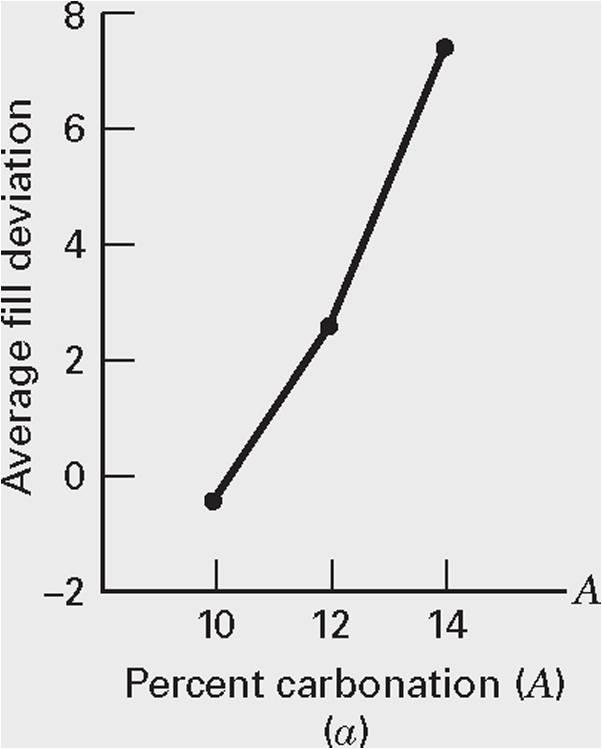
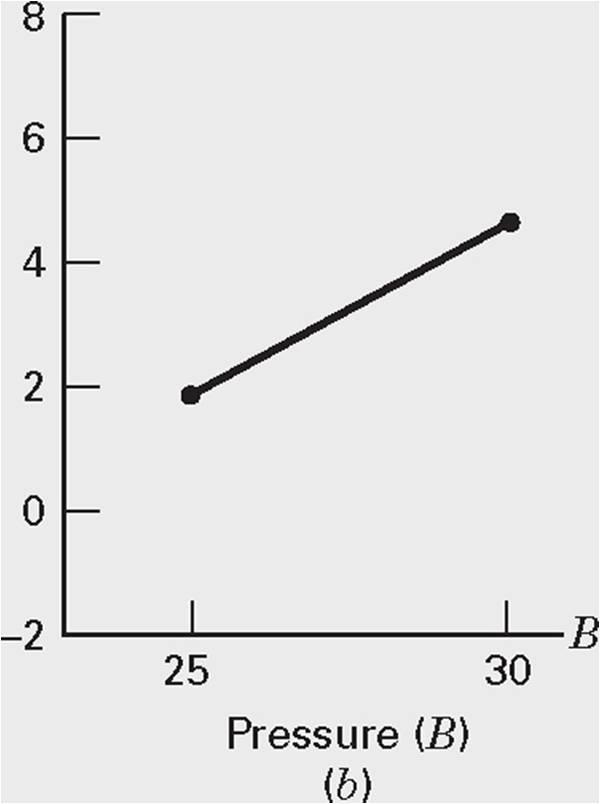
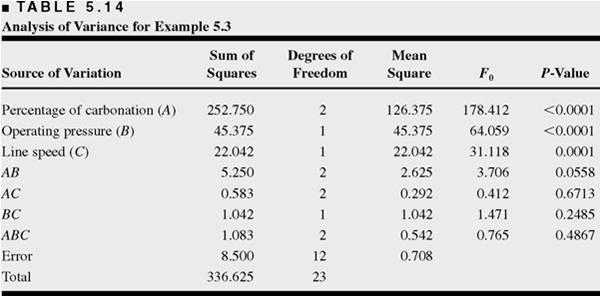
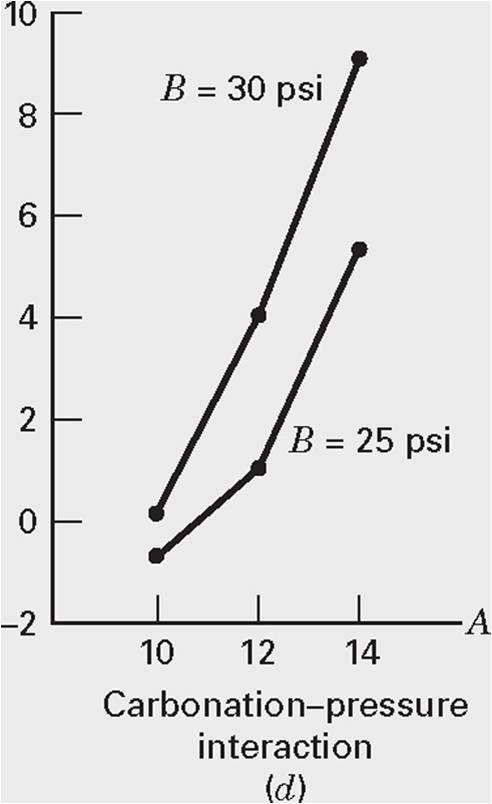
33 Example Soft drink bottling Fill correct volume Response variable: difference from correct volume Carbonation (10%, 12%, 14% ) Pressure (25psi, 30psi) Line speed (200bpm, 250bpm)
34

35
36
37
Lecture 9: Factorial Design Montgomery: chapter 5
 Lecture 9: Factorial Design Montgomery: chapter 5 Page 1 Examples Example I. Two factors (A, B) each with two levels (, +) Page 2 Three Data for Example I Ex.I-Data 1 A B + + 27,33 51,51 18,22 39,41 EX.I-Data
Contents. TAMS38 - Lecture 6 Factorial design, Latin Square Design. Lecturer: Zhenxia Liu. Factorial design 3. Complete three factor design 4
 Contents Factorial design TAMS38 - Lecture 6 Factorial design, Latin Square Design Lecturer: Zhenxia Liu Department of Mathematics - Mathematical Statistics 28 November, 2017 Complete three factor design
Stat 217 Final Exam. Name: May 1, 2002
 Stat 217 Final Exam Name: May 1, 2002 Problem 1. Three brands of batteries are under study. It is suspected that the lives (in weeks) of the three brands are different. Five batteries of each brand are
Factorial designs. Experiments
 Chapter 5: Factorial designs Petter Mostad mostad@chalmers.se Experiments Actively making changes and observing the result, to find causal relationships. Many types of experimental plans Measuring response
Lecture 10. Factorial experiments (2-way ANOVA etc)
") Lecture 10. Factorial experiments (2-way ANOVA etc) Jesper Rydén Matematiska institutionen, Uppsala universitet jesper@math.uu.se Regression and Analysis of Variance autumn 2014 A factorial experiment
Lecture 10. Factorial experiments (2-way ANOVA etc) Jesper Rydén Matematiska institutionen, Uppsala universitet jesper@math.uu.se Regression and Analysis of Variance autumn 2014 A factorial experiment
Factorial Treatment Structure: Part I. Lukas Meier, Seminar für Statistik
 Factorial Treatment Structure: Part I Lukas Meier, Seminar für Statistik Factorial Treatment Structure So far (in CRD), the treatments had no structure. So called factorial treatment structure exists if
Design and Analysis of Experiments
 Design and Analysis of Experiments Part VIII: Plackett-Burman, 3 k, Mixed Level, Nested, and Split-Plot Designs Prof. Dr. Anselmo E de Oliveira anselmo.quimica.ufg.br anselmo.disciplinas@gmail.com Plackett-Burman
Contents. TAMS38 - Lecture 8 2 k p fractional factorial design. Lecturer: Zhenxia Liu. Example 0 - continued 4. Example 0 - Glazing ceramic 3
 Contents TAMS38 - Lecture 8 2 k p fractional factorial design Lecturer: Zhenxia Liu Department of Mathematics - Mathematical Statistics Example 0 2 k factorial design with blocking Example 1 2 k p fractional
Lec 1: An Introduction to ANOVA
 Ying Li Stockholm University October 31, 2011 Three end-aisle displays Which is the best? Design of the Experiment Identify the stores of the similar size and type. The displays are randomly assigned to
Chapter 5 Introduction to Factorial Designs
 Chapter 5 Introduction to Factorial Designs 5. Basic Definitions and Principles Stud the effects of two or more factors. Factorial designs Crossed: factors are arranged in a factorial design Main effect:
Statistics For Economics & Business
 Statistics For Economics & Business Analysis of Variance In this chapter, you learn: Learning Objectives The basic concepts of experimental design How to use one-way analysis of variance to test for differences
Multiple comparisons - subsequent inferences for two-way ANOVA
 1 Multiple comparisons - subsequent inferences for two-way ANOVA the kinds of inferences to be made after the F tests of a two-way ANOVA depend on the results if none of the F tests lead to rejection of
Ch 2: Simple Linear Regression
 Ch 2: Simple Linear Regression 1. Simple Linear Regression Model A simple regression model with a single regressor x is y = β 0 + β 1 x + ɛ, where we assume that the error ɛ is independent random component
Analysis of Variance and Design of Experiments-I
 Analysis of Variance and Design of Experiments-I MODULE VIII LECTURE - 35 ANALYSIS OF VARIANCE IN RANDOM-EFFECTS MODEL AND MIXED-EFFECTS MODEL Dr. Shalabh Department of Mathematics and Statistics Indian
These are multifactor experiments that have
 Design of Engineering Experiments Nested Designs Text reference, Chapter 14, Pg. 525 These are multifactor experiments that have some important industrial applications Nested and split-plot designs frequently
MEMORIAL UNIVERSITY OF NEWFOUNDLAND DEPARTMENT OF MATHEMATICS AND STATISTICS FINAL EXAM - STATISTICS FALL 1999
 MEMORIAL UNIVERSITY OF NEWFOUNDLAND DEPARTMENT OF MATHEMATICS AND STATISTICS FINAL EXAM - STATISTICS 350 - FALL 1999 Instructor: A. Oyet Date: December 16, 1999 Name(Surname First): Student Number INSTRUCTIONS
STATISTICS 368 AN EXPERIMENT IN AIRCRAFT PRODUCTION Christopher Wiens & Douglas Wiens
 STATISTICS 368 AN EXPERIMENT IN AIRCRAFT PRODUCTION Christopher Wiens & Douglas Wiens April 21, 2005 The progress of science. 1. Preliminary description of experiment We set out to determine the factors
Lecture 10: Experiments with Random Effects
 Lecture 10: Experiments with Random Effects Montgomery, Chapter 13 1 Lecture 10 Page 1 Example 1 A textile company weaves a fabric on a large number of looms. It would like the looms to be homogeneous
Comparing Nested Models
 Comparing Nested Models ST 370 Two regression models are called nested if one contains all the predictors of the other, and some additional predictors. For example, the first-order model in two independent
Design & Analysis of Experiments 7E 2009 Montgomery
 Chapter 5 1 Introduction to Factorial Design Study the effects of 2 or more factors All possible combinations of factor levels are investigated For example, if there are a levels of factor A and b levels
Power & Sample Size Calculation
 Chapter 7 Power & Sample Size Calculation Yibi Huang Chapter 7 Section 10.3 Power & Sample Size Calculation for CRDs Power & Sample Size for Factorial Designs Chapter 7-1 Power & Sample Size Calculation
Summary of Chapter 7 (Sections ) and Chapter 8 (Section 8.1)
 and Chapter 8 (Section 8.1)") Summary of Chapter 7 (Sections 7.2-7.5) and Chapter 8 (Section 8.1) Chapter 7. Tests of Statistical Hypotheses 7.2. Tests about One Mean (1) Test about One Mean Case 1: σ is known. Assume that X N(µ, σ
Summary of Chapter 7 (Sections 7.2-7.5) and Chapter 8 (Section 8.1) Chapter 7. Tests of Statistical Hypotheses 7.2. Tests about One Mean (1) Test about One Mean Case 1: σ is known. Assume that X N(µ, σ
Analysis of Variance
 Analysis of Variance Blood coagulation time T avg A 62 60 63 59 61 B 63 67 71 64 65 66 66 C 68 66 71 67 68 68 68 D 56 62 60 61 63 64 63 59 61 64 Blood coagulation time A B C D Combined 56 57 58 59 60 61
Two (or more) factors, say A and B, with a and b levels, respectively.
 factors, say A and B, with a and b levels, respectively.") Factorial Designs ST 516 Two (or more) factors, say A and B, with a and b levels, respectively. A factorial design uses all ab combinations of levels of A and B, for a total of ab treatments. When both
Factorial Designs ST 516 Two (or more) factors, say A and B, with a and b levels, respectively. A factorial design uses all ab combinations of levels of A and B, for a total of ab treatments. When both
Ch 3: Multiple Linear Regression
 Ch 3: Multiple Linear Regression 1. Multiple Linear Regression Model Multiple regression model has more than one regressor. For example, we have one response variable and two regressor variables: 1. delivery
Outline Topic 21 - Two Factor ANOVA
 Outline Topic 21 - Two Factor ANOVA Data Model Parameter Estimates - Fall 2013 Equal Sample Size One replicate per cell Unequal Sample size Topic 21 2 Overview Now have two factors (A and B) Suppose each
Chapter 5 Introduction to Factorial Designs Solutions
 Solutions from Montgomery, D. C. (1) Design and Analysis of Experiments, Wiley, NY Chapter 5 Introduction to Factorial Designs Solutions 5.1. The following output was obtained from a computer program that
PROBLEM TWO (ALKALOID CONCENTRATIONS IN TEA) 1. Statistical Design
 1. Statistical Design") PROBLEM TWO (ALKALOID CONCENTRATIONS IN TEA) 1. Statistical Design The purpose of this experiment was to determine differences in alkaloid concentration of tea leaves, based on herb variety (Factor A)
PROBLEM TWO (ALKALOID CONCENTRATIONS IN TEA) 1. Statistical Design The purpose of this experiment was to determine differences in alkaloid concentration of tea leaves, based on herb variety (Factor A)
Process Capability Analysis Using Experiments
 Process Capability Analysis Using Experiments A designed experiment can aid in separating sources of variability in a quality characteristic. Example: bottling soft drinks Suppose the measured syrup content
Two-Way Analysis of Variance - no interaction
 1 Two-Way Analysis of Variance - no interaction Example: Tests were conducted to assess the effects of two factors, engine type, and propellant type, on propellant burn rate in fired missiles. Three engine
Theorem A: Expectations of Sums of Squares Under the two-way ANOVA model, E(X i X) 2 = (µ i µ) 2 + n 1 n σ2
 2 = (µ i µ) 2 + n 1 n σ2") identity Y ijk Ȳ = (Y ijk Ȳij ) + (Ȳi Ȳ ) + (Ȳ j Ȳ ) + (Ȳij Ȳi Ȳ j + Ȳ ) Theorem A: Expectations of Sums of Squares Under the two-way ANOVA model, (1) E(MSE) = E(SSE/[IJ(K 1)]) = (2) E(MSA) = E(SSA/(I
identity Y ijk Ȳ = (Y ijk Ȳij ) + (Ȳi Ȳ ) + (Ȳ j Ȳ ) + (Ȳij Ȳi Ȳ j + Ȳ ) Theorem A: Expectations of Sums of Squares Under the two-way ANOVA model, (1) E(MSE) = E(SSE/[IJ(K 1)]) = (2) E(MSA) = E(SSA/(I
Lecture 10: Factorial Designs with Random Factors
 Lecture 10: Factorial Designs with Random Factors Montgomery, Section 13.2 and 13.3 1 Lecture 10 Page 1 Factorial Experiments with Random Effects Lecture 9 has focused on fixed effects Always use MSE in
3. Factorial Experiments (Ch.5. Factorial Experiments)
") 3. Factorial Experiments (Ch.5. Factorial Experiments) Hae-Jin Choi School of Mechanical Engineering, Chung-Ang University DOE and Optimization 1 Introduction to Factorials Most experiments for process
3. Factorial Experiments (Ch.5. Factorial Experiments) Hae-Jin Choi School of Mechanical Engineering, Chung-Ang University DOE and Optimization 1 Introduction to Factorials Most experiments for process
Battery Life. Factory
 Statistics 354 (Fall 2018) Analysis of Variance: Comparing Several Means Remark. These notes are from an elementary statistics class and introduce the Analysis of Variance technique for comparing several
Chapter 11: Factorial Designs
 Chapter : Factorial Designs. Two factor factorial designs ( levels factors ) This situation is similar to the randomized block design from the previous chapter. However, in addition to the effects within
Lecture 7: Latin Square and Related Design
 Lecture 7: Latin Square and Related Design Montgomery: Section 4.2-4.3 Page 1 Automobile Emission Experiment Four cars and four drivers are employed in a study for possible differences between four gasoline
Statistics for Managers Using Microsoft Excel Chapter 10 ANOVA and Other C-Sample Tests With Numerical Data
 Statistics for Managers Using Microsoft Excel Chapter 10 ANOVA and Other C-Sample Tests With Numerical Data 1999 Prentice-Hall, Inc. Chap. 10-1 Chapter Topics The Completely Randomized Model: One-Factor
Design of Engineering Experiments Chapter 5 Introduction to Factorials
 Design of Engineering Experiments Chapter 5 Introduction to Factorials Text reference, Chapter 5 page 170 General principles of factorial experiments The two-factor factorial with fixed effects The ANOVA
. Example: For 3 factors, sse = (y ijkt. " y ijk
 ANALYSIS OF BALANCED FACTORIAL DESIGNS Estimates of model parameters and contrasts can be obtained by the method of Least Squares. Additional constraints must be added to estimate non-estimable parameters.
DESAIN EKSPERIMEN BLOCKING FACTORS. Semester Genap 2017/2018 Jurusan Teknik Industri Universitas Brawijaya
 DESAIN EKSPERIMEN BLOCKING FACTORS Semester Genap Jurusan Teknik Industri Universitas Brawijaya Outline The Randomized Complete Block Design The Latin Square Design The Graeco-Latin Square Design Balanced
DESAIN EKSPERIMEN Analysis of Variances (ANOVA) Semester Genap 2017/2018 Jurusan Teknik Industri Universitas Brawijaya
 Semester Genap 2017/2018 Jurusan Teknik Industri Universitas Brawijaya") DESAIN EKSPERIMEN Analysis of Variances (ANOVA) Semester Jurusan Teknik Industri Universitas Brawijaya Outline Introduction The Analysis of Variance Models for the Data Post-ANOVA Comparison of Means Sample
DESAIN EKSPERIMEN Analysis of Variances (ANOVA) Semester Jurusan Teknik Industri Universitas Brawijaya Outline Introduction The Analysis of Variance Models for the Data Post-ANOVA Comparison of Means Sample
Stat 6640 Solution to Midterm #2
 Stat 6640 Solution to Midterm #2 1. A study was conducted to examine how three statistical software packages used in a statistical course affect the statistical competence a student achieves. At the end
Chapter 12. Analysis of variance
 Serik Sagitov, Chalmers and GU, January 9, 016 Chapter 1. Analysis of variance Chapter 11: I = samples independent samples paired samples Chapter 1: I 3 samples of equal size J one-way layout two-way layout
Lecture 5: Comparing Treatment Means Montgomery: Section 3-5
 Lecture 5: Comparing Treatment Means Montgomery: Section 3-5 Page 1 Linear Combination of Means ANOVA: y ij = µ + τ i + ɛ ij = µ i + ɛ ij Linear combination: L = c 1 µ 1 + c 1 µ 2 +...+ c a µ a = a i=1
Stat 579: Generalized Linear Models and Extensions
 Stat 579: Generalized Linear Models and Extensions Mixed models Yan Lu Feb, 2018, week 7 1 / 17 Some commonly used experimental designs related to mixed models Two way or three way random/mixed effects
STAT 705 Chapters 23 and 24: Two factors, unequal sample sizes; multi-factor ANOVA
 STAT 705 Chapters 23 and 24: Two factors, unequal sample sizes; multi-factor ANOVA Timothy Hanson Department of Statistics, University of South Carolina Stat 705: Data Analysis II 1 / 22 Balanced vs. unbalanced
Lec 3: Model Adequacy Checking
 November 16, 2011 Model validation Model validation is a very important step in the model building procedure. (one of the most overlooked) A high R 2 value does not guarantee that the model fits the data
Lecture 11: Nested and Split-Plot Designs
 Lecture 11: Nested and Split-Plot Designs Montgomery, Chapter 14 1 Lecture 11 Page 1 Crossed vs Nested Factors Factors A (a levels)and B (b levels) are considered crossed if Every combinations of A and
Nested Designs & Random Effects
 Nested Designs & Random Effects Timothy Hanson Department of Statistics, University of South Carolina Stat 506: Introduction to Design of Experiments 1 / 17 Bottling plant production A production engineer
Note: The problem numbering below may not reflect actual numbering in DGE.
 Stat664 Year 1999 DGE Note: The problem numbering below may not reflect actual numbering in DGE. 1. For a balanced one-way random effect model, (a) write down the model and assumptions; (b) write down
Introduction. Chapter 8
 Chapter 8 Introduction In general, a researcher wants to compare one treatment against another. The analysis of variance (ANOVA) is a general test for comparing treatment means. When the null hypothesis
ANOVA Situation The F Statistic Multiple Comparisons. 1-Way ANOVA MATH 143. Department of Mathematics and Statistics Calvin College
 1-Way ANOVA MATH 143 Department of Mathematics and Statistics Calvin College An example ANOVA situation Example (Treating Blisters) Subjects: 25 patients with blisters Treatments: Treatment A, Treatment
Chap The McGraw-Hill Companies, Inc. All rights reserved.
 11 pter11 Chap Analysis of Variance Overview of ANOVA Multiple Comparisons Tests for Homogeneity of Variances Two-Factor ANOVA Without Replication General Linear Model Experimental Design: An Overview
More about Single Factor Experiments
 More about Single Factor Experiments 1 2 3 0 / 23 1 2 3 1 / 23 Parameter estimation Effect Model (1): Y ij = µ + A i + ɛ ij, Ji A i = 0 Estimation: µ + A i = y i. ˆµ = y..  i = y i. y.. Effect Modell
STAT 525 Fall Final exam. Tuesday December 14, 2010
 STAT 525 Fall 2010 Final exam Tuesday December 14, 2010 Time: 2 hours Name (please print): Show all your work and calculations. Partial credit will be given for work that is partially correct. Points will
CHAPTER 4 Analysis of Variance. One-way ANOVA Two-way ANOVA i) Two way ANOVA without replication ii) Two way ANOVA with replication
 Two way ANOVA without replication ii) Two way ANOVA with replication") CHAPTER 4 Analysis of Variance One-way ANOVA Two-way ANOVA i) Two way ANOVA without replication ii) Two way ANOVA with replication 1 Introduction In this chapter, expand the idea of hypothesis tests. We
CHAPTER 4 Analysis of Variance One-way ANOVA Two-way ANOVA i) Two way ANOVA without replication ii) Two way ANOVA with replication 1 Introduction In this chapter, expand the idea of hypothesis tests. We
Formal Statement of Simple Linear Regression Model
 Formal Statement of Simple Linear Regression Model Y i = β 0 + β 1 X i + ɛ i Y i value of the response variable in the i th trial β 0 and β 1 are parameters X i is a known constant, the value of the predictor
The legacy of Sir Ronald A. Fisher. Fisher s three fundamental principles: local control, replication, and randomization.
 1 Chapter 1: Research Design Principles The legacy of Sir Ronald A. Fisher. Fisher s three fundamental principles: local control, replication, and randomization. 2 Chapter 2: Completely Randomized Design
Increasing precision by partitioning the error sum of squares: Blocking: SSE (CRD) à SSB + SSE (RCBD) Contrasts: SST à (t 1) orthogonal contrasts
 à SSB + SSE (RCBD) Contrasts: SST à (t 1) orthogonal contrasts") Lecture 13 Topic 9: Factorial treatment structures (Part II) Increasing precision by partitioning the error sum of squares: s MST F = = MSE 2 among = s 2 within SST df trt SSE df e Blocking: SSE (CRD)
Lecture 13 Topic 9: Factorial treatment structures (Part II) Increasing precision by partitioning the error sum of squares: s MST F = = MSE 2 among = s 2 within SST df trt SSE df e Blocking: SSE (CRD)
One-Way Analysis of Variance. With regression, we related two quantitative, typically continuous variables.
 One-Way Analysis of Variance With regression, we related two quantitative, typically continuous variables. Often we wish to relate a quantitative response variable with a qualitative (or simply discrete)
Chapter 10. Design of Experiments and Analysis of Variance
 Chapter 10 Design of Experiments and Analysis of Variance Elements of a Designed Experiment Response variable Also called the dependent variable Factors (quantitative and qualitative) Also called the independent
Topic 29: Three-Way ANOVA
 Topic 29: Three-Way ANOVA Outline Three-way ANOVA Data Model Inference Data for three-way ANOVA Y, the response variable Factor A with levels i = 1 to a Factor B with levels j = 1 to b Factor C with levels
Multiple comparisons The problem with the one-pair-at-a-time approach is its error rate.
 Multiple comparisons The problem with the one-pair-at-a-time approach is its error rate. Each confidence interval has a 95% probability of making a correct statement, and hence a 5% probability of making
1 Use of indicator random variables. (Chapter 8)
") 1 Use of indicator random variables. (Chapter 8) let I(A) = 1 if the event A occurs, and I(A) = 0 otherwise. I(A) is referred to as the indicator of the event A. The notation I A is often used. 1 2 Fitting
1 Use of indicator random variables. (Chapter 8) let I(A) = 1 if the event A occurs, and I(A) = 0 otherwise. I(A) is referred to as the indicator of the event A. The notation I A is often used. 1 2 Fitting
TWO OR MORE RANDOM EFFECTS. The two-way complete model for two random effects:
 TWO OR MORE RANDOM EFFECTS Example: The factors that influence the breaking strength of a synthetic fiber are being studied. Four production machines and three operators are randomly selected. A two-way
Assignment 6 Answer Keys
 ssignment 6 nswer Keys Problem 1 (a) The treatment sum of squares can be calculated by SS Treatment = b a ȳi 2 Nȳ 2 i=1 = 5 (5.40 2 + 5.80 2 + 10 2 + 9.80 2 ) 20 7.75 2 = 92.95 Then the F statistic for
Unit 6: Orthogonal Designs Theory, Randomized Complete Block Designs, and Latin Squares
 Unit 6: Orthogonal Designs Theory, Randomized Complete Block Designs, and Latin Squares STA 643: Advanced Experimental Design Derek S. Young 1 Learning Objectives Understand the basics of orthogonal designs
Chapter 4 Experiments with Blocking Factors
 Chapter 4 Experiments with Blocking Factors 許湘伶 Design and Analysis of Experiments (Douglas C. Montgomery) hsuhl (NUK) DAE Chap. 4 1 / 54 The Randomized Complete Block Design (RCBD; 隨機化完全集區設計 ) 1 Variability
Analysis of Variance. Read Chapter 14 and Sections to review one-way ANOVA.
 Analysis of Variance Read Chapter 14 and Sections 15.1-15.2 to review one-way ANOVA. Design of an experiment the process of planning an experiment to insure that an appropriate analysis is possible. Some
In a one-way ANOVA, the total sums of squares among observations is partitioned into two components: Sums of squares represent:
 Activity #10: AxS ANOVA (Repeated subjects design) Resources: optimism.sav So far in MATH 300 and 301, we have studied the following hypothesis testing procedures: 1) Binomial test, sign-test, Fisher s
y = µj n + β 1 b β b b b + α 1 t α a t a + e
 The contributions of distinct sets of explanatory variables to the model are typically captured by breaking up the overall regression (or model) sum of squares into distinct components This is useful quite
What If There Are More Than. Two Factor Levels?
 What If There Are More Than Chapter 3 Two Factor Levels? Comparing more that two factor levels the analysis of variance ANOVA decomposition of total variability Statistical testing & analysis Checking
6 Designs with Split Plots
 6 Designs with Split Plots Many factorial experimental designs are incorrectly analyzed because the assumption of complete randomization is not true. Many factorial experiments have one or more restrictions
Two-factor studies. STAT 525 Chapter 19 and 20. Professor Olga Vitek
 Two-factor studies STAT 525 Chapter 19 and 20 Professor Olga Vitek December 2, 2010 19 Overview Now have two factors (A and B) Suppose each factor has two levels Could analyze as one factor with 4 levels
Multi-Factor Experiments
 ETH p. 1/31 Multi-Factor Experiments Twoway anova Interactions More than two factors ETH p. 2/31 Hypertension: Effect of biofeedback Biofeedback Biofeedback Medication Control + Medication 158 188 186
Factorial and Unbalanced Analysis of Variance
 Factorial and Unbalanced Analysis of Variance Nathaniel E. Helwig Assistant Professor of Psychology and Statistics University of Minnesota (Twin Cities) Updated 04-Jan-2017 Nathaniel E. Helwig (U of Minnesota)
Contents. 2 2 factorial design 4
 Contents TAMS38 - Lecture 10 Response surface methodology Lecturer: Zhenxia Liu Department of Mathematics - Mathematical Statistics 12 December, 2017 2 2 factorial design Polynomial Regression model First
Econ 3790: Business and Economic Statistics. Instructor: Yogesh Uppal
 Econ 3790: Business and Economic Statistics Instructor: Yogesh Uppal Email: yuppal@ysu.edu Chapter 13, Part A: Analysis of Variance and Experimental Design Introduction to Analysis of Variance Analysis
STAT 135 Lab 10 Two-Way ANOVA, Randomized Block Design and Friedman s Test
 STAT 135 Lab 10 Two-Way ANOVA, Randomized Block Design and Friedman s Test Rebecca Barter April 13, 2015 Let s now imagine a dataset for which our response variable, Y, may be influenced by two factors,
Confidence Intervals, Testing and ANOVA Summary
 Confidence Intervals, Testing and ANOVA Summary 1 One Sample Tests 1.1 One Sample z test: Mean (σ known) Let X 1,, X n a r.s. from N(µ, σ) or n > 30. Let The test statistic is H 0 : µ = µ 0. z = x µ 0
" M A #M B. Standard deviation of the population (Greek lowercase letter sigma) σ 2
 σ 2") Notation and Equations for Final Exam Symbol Definition X The variable we measure in a scientific study n The size of the sample N The size of the population M The mean of the sample µ The mean of the
Notation and Equations for Final Exam Symbol Definition X The variable we measure in a scientific study n The size of the sample N The size of the population M The mean of the sample µ The mean of the
22s:152 Applied Linear Regression. Take random samples from each of m populations.
 22s:152 Applied Linear Regression Chapter 8: ANOVA NOTE: We will meet in the lab on Monday October 10. One-way ANOVA Focuses on testing for differences among group means. Take random samples from each
W&M CSCI 688: Design of Experiments Homework 2. Megan Rose Bryant
 W&M CSCI 688: Design of Experiments Homework 2 Megan Rose Bryant September 25, 201 3.5 The tensile strength of Portland cement is being studied. Four different mixing techniques can be used economically.
Statistics 512: Solution to Homework#11. Problems 1-3 refer to the soybean sausage dataset of Problem 20.8 (ch21pr08.dat).
.") Statistics 512: Solution to Homework#11 Problems 1-3 refer to the soybean sausage dataset of Problem 20.8 (ch21pr08.dat). 1. Perform the two-way ANOVA without interaction for this model. Use the results
Statistics 512: Solution to Homework#11 Problems 1-3 refer to the soybean sausage dataset of Problem 20.8 (ch21pr08.dat). 1. Perform the two-way ANOVA without interaction for this model. Use the results
ST4241 Design and Analysis of Clinical Trials Lecture 4: 2 2 factorial experiments, a special cases of parallel groups study
 ST4241 Design and Analysis of Clinical Trials Lecture 4: 2 2 factorial experiments, a special cases of parallel groups study Chen Zehua Department of Statistics & Applied Probability 8:00-10:00 am, Tuesday,
Linear regression. We have that the estimated mean in linear regression is. ˆµ Y X=x = ˆβ 0 + ˆβ 1 x. The standard error of ˆµ Y X=x is.
 Linear regression We have that the estimated mean in linear regression is The standard error of ˆµ Y X=x is where x = 1 n s.e.(ˆµ Y X=x ) = σ ˆµ Y X=x = ˆβ 0 + ˆβ 1 x. 1 n + (x x)2 i (x i x) 2 i x i. The
SAS Commands. General Plan. Output. Construct scatterplot / interaction plot. Run full model
 Topic 23 - Unequal Replication Data Model Outline - Fall 2013 Parameter Estimates Inference Topic 23 2 Example Page 954 Data for Two Factor ANOVA Y is the response variable Factor A has levels i = 1, 2,...,
Lecture 27 Two-Way ANOVA: Interaction
 Lecture 27 Two-Way ANOVA: Interaction STAT 512 Spring 2011 Background Reading KNNL: Chapter 19 27-1 Topic Overview Review: Two-way ANOVA Models Basic Strategy for Analysis Studying Interactions 27-2 Two-way
Analysis of Variance: Part 1
 Analysis of Variance: Part 1 Oneway ANOVA When there are more than two means Each time two means are compared the probability (Type I error) =α. When there are more than two means Each time two means are
Joint Probability Distributions
 Joint Probability Distributions ST 370 In many random experiments, more than one quantity is measured, meaning that there is more than one random variable. Example: Cell phone flash unit A flash unit is
QUEEN MARY, UNIVERSITY OF LONDON
 QUEEN MARY, UNIVERSITY OF LONDON MTH634 Statistical Modelling II Solutions to Exercise Sheet 4 Octobe07. We can write (y i. y.. ) (yi. y i.y.. +y.. ) yi. y.. S T. ( Ti T i G n Ti G n y i. +y.. ) G n T
Multiple Predictor Variables: ANOVA
 Multiple Predictor Variables: ANOVA 1/32 Linear Models with Many Predictors Multiple regression has many predictors BUT - so did 1-way ANOVA if treatments had 2 levels What if there are multiple treatment
Chapter 20 : Two factor studies one case per treatment Chapter 21: Randomized complete block designs
 Chapter 20 : Two factor studies one case per treatment Chapter 21: Randomized complete block designs Adapted from Timothy Hanson Department of Statistics, University of South Carolina Stat 705: Data Analysis
1-Way ANOVA MATH 143. Spring Department of Mathematics and Statistics Calvin College
 1-Way ANOVA MATH 143 Department of Mathematics and Statistics Calvin College Spring 2010 The basic ANOVA situation Two variables: 1 Categorical, 1 Quantitative Main Question: Do the (means of) the quantitative
STAT22200 Spring 2014 Chapter 13B
 STAT22200 Spring 2014 Chapter 13B Yibi Huang May 27, 2014 13.3.1 Crossover Designs 13.3.4 Replicated Latin Square Designs 13.4 Graeco-Latin Squares Chapter 13B - 1 13.3.1 Crossover Design (A Special Latin-Square
Multiple Linear Regression
 Multiple Linear Regression ST 430/514 Recall: a regression model describes how a dependent variable (or response) Y is affected, on average, by one or more independent variables (or factors, or covariates).
3. Design Experiments and Variance Analysis
 3. Design Experiments and Variance Analysis Isabel M. Rodrigues 1 / 46 3.1. Completely randomized experiment. Experimentation allows an investigator to find out what happens to the output variables when
OHSU OGI Class ECE-580-DOE :Design of Experiments Steve Brainerd
 Why We Use Analysis of Variance to Compare Group Means and How it Works The question of how to compare the population means of more than two groups is an important one to researchers. Let us suppose that
Unit 7: Random Effects, Subsampling, Nested and Crossed Factor Designs
 Unit 7: Random Effects, Subsampling, Nested and Crossed Factor Designs STA 643: Advanced Experimental Design Derek S. Young 1 Learning Objectives Understand how to interpret a random effect Know the different
COMPLETELY RANDOM DESIGN (CRD) -Design can be used when experimental units are essentially homogeneous.
 -Design can be used when experimental units are essentially homogeneous.") COMPLETELY RANDOM DESIGN (CRD) Description of the Design -Simplest design to use. -Design can be used when experimental units are essentially homogeneous. -Because of the homogeneity requirement, it may
COMPLETELY RANDOM DESIGN (CRD) Description of the Design -Simplest design to use. -Design can be used when experimental units are essentially homogeneous. -Because of the homogeneity requirement, it may