LECTURE NOTES FYS 4550/FYS EXPERIMENTAL HIGH ENERGY PHYSICS AUTUMN 2013 PART I A. STRANDLIE GJØVIK UNIVERSITY COLLEGE AND UNIVERSITY OF OSLO
|
|
|
- Dana Casey
- 5 years ago
- Views:
Transcription
1 LECTURE NOTES FYS 4550/FYS EXPERIMENTAL HIGH ENERGY PHYSICS AUTUMN 2013 PART I PROBABILITY AND STATISTICS A. STRANDLIE GJØVIK UNIVERSITY COLLEGE AND UNIVERSITY OF OSLO
2 Before embarking on the concept of probability, we will first define a set of other concepts. A stochastic experiment is characterized by: All possible elementary outcomes of the experiment are known Only one of the outcomes can occur in a single experiment The outcome of an experiment is not known a priori Example: throwing a dice Outcomes are: S={1,2,3,4,5,6} Can only observe one of these each time you throw Don t know beforehand what you will observe The set S is called the sample space of the experiment
3 An event A is one or more outcomes which satisfy certain specifications Example: A= odd number when throwing a dice An event is therefore also a subset of S Here: A={1,3,5} If B= even number, what is the subset of S describing B? The probability of occurence of an event A, P(A, is a number between 0 and 1 Intuitively a number for P(A close to 0 means that A is supposed to occur very rarely in an experiment, whereas a number close to 1 means that A occurs very often
4 There are three ways of quantifying probability 1. Classical approach, valid when all outcomes can be assumed equally likely. Probability is defined as number of favourable outcomes for a given event divided by total number of outcomes. Example: throwing a dice has N=6 different outcomes. Assume that the event A = observing 6 eyes. Only n=1 of the outcomes are favourable for A. P(A=n/N=1/6= Approach based on convergence value of relative frequency for a very large number of repeated, identical experiments. Example: throwing a dice, recording relative frequency of occurence of A for various numbers of trials 3. Subjective approach, reflecting degree of belief of occurence of a certain event A. Possible guideline: convergence value of a large number of hypothetical experiments
5 Convergence of relative frequency true probability relative frequency logarithm (base 10 of trials
6 Approach 2 forms the basis of frequentist statistics, whereas approach 3 is the baseline of Bayesian statistics Two different schools When estimating parameters from a set of data, the two approaches usually give the same numbers for the estimates if there is a large amount of data If there is little available data, estimates might differ No easy way of determining which approach is best Both approaches advocated in high-energy physics experiments Will not enter any further into such questions in this course
7 Will now look at probabilities of combinations of events Need some concepts from set theory: The union Α Β is a new event which occurs if A or B or both events occur. To events are disjoint if they cannot occur simultaneously The intersection A B is a new event which occurs if both A and B occurs The complement A is a new event which occurs if A does not occur
8 A Probability A B B S outcomes VENN DIAGRAM A B C (disjoint with A and B
9 The mathematical axioms of probability: 1. Probability is never negative, P(A 0 2. The probability for the event which corresponds to the entire sample space S (i.e. the probability of observing any of the possible outcomes of the experiment is equal to the unit value, i. e. P(S = 1 3. Probability must comply with the addition rule of disjoint events: P A2 An = P( A1 + P( A + P( A ( A1 2 n A couple of useful formulas which can be derived from the axioms: P( A = 1 P(A B = P( A + P( B P( A P( A B
10 A Probability A B B Concept of conditional probability: What is the probability of occurence of A given that we know B will occur, i. e. P(A B?
11 Recalling the definition of probability as the number of favourable outcomes divided by the total number of outcomes, we get: Example: throwing dice. A = {2, 4, 6}, B = {3, 4, 5, 6} What is P(A B?? 3 1 ( 4,6} { = = B A P B A ( ( / / ( B P B A P N N N N N N B A P tot B tot B A B B A = = = / 3 1/ ( ( ( = = = B P B A P B A P
12 A B Probability A B B B Important observation: and are disjoint! A B A B
13 Therefore: Expressing P(A in terms of a subdivision of S in a set of other, disjoint events is called the law of total probability. The general formulation of this law is: where all { } are disjoint and span the entire sample space S. ( ( ( ( ( ( ( (( ( B P B A P B P B A P B A P B A P B A B A P A P + = + = = = i i B i P B A P A P ( ( ( B i
14 From the definition of conditional probability it follows: A quick manipulation gives: which is called Bayes theorem. ( ( ( ( ( A B P A P B A P B P B A P = = ( ( ( ( A P B P B A P A B P =
15 By using the law of total probability, one ends up with the general formulation of Bayes theorem: which is an extremely important result in statistics. Particularly in Bayesian statistics this theorem is often used to update or refine the knowledge about a set of unknown parameters by the introduction of information from new data. = i i i j j j B P B A P B P B A P A B P ( ( ( ( (
16 This can be explained by a rewrite of Bayes theorem: P(parameters data α P(data parameters P(parameters. P(data parameters is often called the likelihood, P(parameters denotes the prior knowledge of the parameters, whereas P(parameters data is the posterior probability of the parameters given the data. If P(parameters cannot be deduced by any objective means, a subjective belief of its value is used in Bayesian statistics. Since there is no fundamental rule describing how to deduce this prior probability, Bayesian statistics is still debated (also in highenergy physics!
17 Definition of independence of events A and B: P(A B = P(A, i.e. any given information about B does not affect the probability of observing A. Physically this means that the events A and B are uncorrelated. For practical applications such independence can not be derived but rather has to be assumed, given the nature of the physical problem one intends to model. General multiplication rule for independent events A, A2,, : 1 A n P A 2 An = P( A1 P( A ( A1 2 n P( A
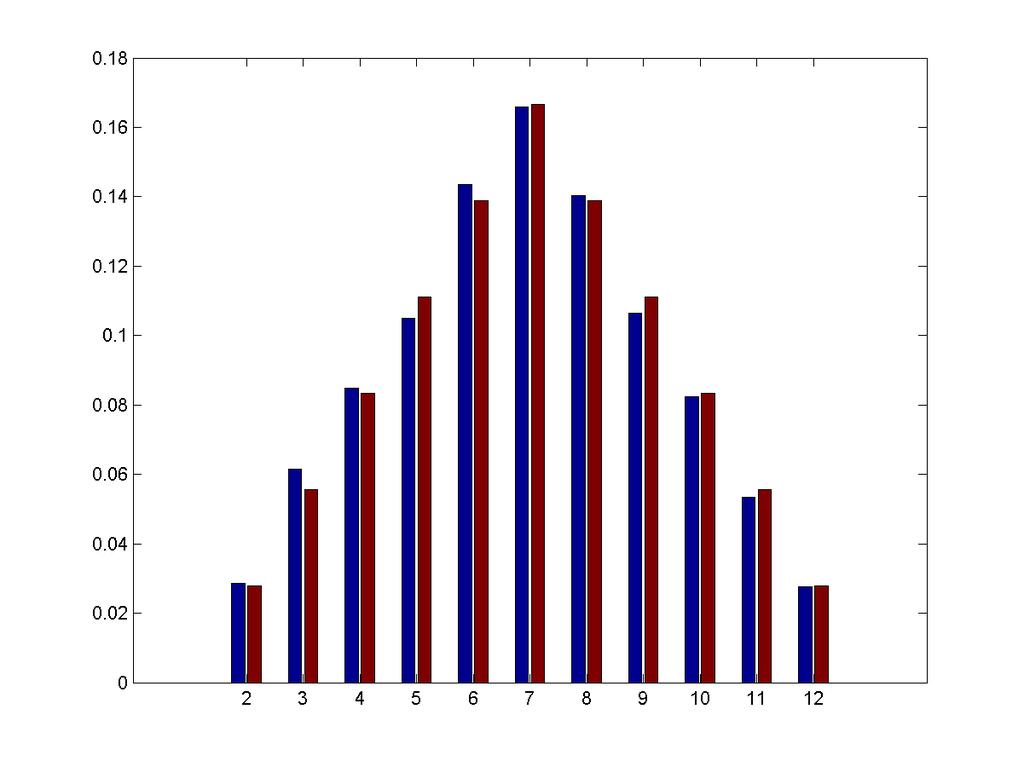
18 Stochastic or random variable: Number which can be attached to all outcomes of an experiment Example: throwing two dice, sum of number of spots Mathematical terminology: real-valued function defined over the elements of the sample space S of an experiment A capital letter is often used to denote a random variable, for instance X Simulation experiment: throwing two dice N times, recording sum of spots each time and calculating the relative frequency of occurence for each of the outcomes
19 N=10 Blue columns: observed rel. freq. Red columns: teoretically expected rel. freq.
20 N=20 Probability

21 N=100 Probability
22 N=1000 Probability

23 N=10000 Probability

24 N= Probability

25 N= Probability
26 N= Probability
27 The relative frequencies seem to converge towards the theoretically expected probabilities Such a diagram is an expression of a probability distribution: A list of all different values of a random variable together with the associated probabilities Mathematically: a function f(x = P(X=x defined for all possible values x of X (given by the experiment at hand The values of X can be discrete (like in the previous example, or continuous For continuous x, f(x is called a probability density function Simulation experiment: height of Norwegian men Collecting data, calculating relative frequencies of occurences in intervals of various widths

28 interval width 10 cm
29 interval width 5 cm

30 interval width 1 cm
31 interval width 0.5 cm
32 interval width 0 continuous probability distribution
33 Cumulative distribution function: F(a=P(X a For discrete, random variables: For continuous, random variables: = = = a x a x i i i i x f x X P a F ( ( ( = a dx x f a F ( (
34 It follows: P( a < X b = F( b F( a For continuous variables: P ( a < X b = f ( x dx b a
35 shaded area is P(a < X < b a b
36 shaded area is P(X < b b
37 shaded area is P(X > a a
38 A function u(x of a random variable X is also a random variable. The expectation value of such a function is: [ u( X ] Two very important special cases are: E = u( x f ( x dx 2 σ µ = E ( X = x f ( x dx 2 [( X µ ] = 2 = Var ( X = E ( x µ f ( x dx mean variance
39 The mean μ is the most important measure of the centre of the distribution of X. The variance, or its square root σ, the standard deviation, is the most important measure of the spread of the distribution of X around the mean. The mean is the first moment of X, whereas the variance is the second central moment of X. In general, the n th moment of X is α [ ] n X = n = E x f ( x dx n
40 The n th central moment is m [ ] n n n E ( X α 1 = ( x α1 f ( x = dx Another measure of the centre of the distribution of X is the median, defined as 1 F( x med = 2 or, in words, the value of of X of which half of the probability lies above and half lies below.
41 Assume now that X and Y are two random variables with a joint probability distribution function (pdf f(x,y. The marginal pdf of X is f x = f ( x, y dy 1 ( whereas the marginal pdf of Y is f 2( y = f ( x, y dx
42 The mean values of X and Y are µ µ X x f ( x, y dxdy = x f1( x = dx Y y f ( x, y dxdy = y f2( y = dy The covariance of X and Y is cov [ X, Y ] = E[ ( X µ X ( Y µ Y ] = E[ XY ] µ X µ Y
43 If several random variables are considered simultaneously, one frequently arranges the variables in a stochastic or random vector X = (, X,, T X1 2 X n The covariances are then naturally displayed in a covariance matrix cov ( X = cov( X cov( X cov( X 1 2 n,,, X X X cov( X cov( X cov( X 1 2 n,,, X X X cov( X cov( X cov( X 1 2 n,,, X X X n n n
44 If two variables X and Y are independent, the joint pdf can be written f ( x, y = f1( x f2( y The covariance of X and Y vanishes in this case (why?, and the variances add: V(X+Y=V(X+V(Y. If X and Y are not independent, the general formula is: V(X+Y=V(X+V(Y+2Cov(X,Y. For n mutually independent random variables the covariance matrix becomes diagonal (i.e. all off-diagonal terms are identically zero.
45 Y = ( Y, Y, 2, If a random vector is related to a vector X (with pdf f(x by a function Y(X, the pdf of Y is 1 Y n g( y = f ( x( y J where J is the absolute value of the determinant of a matrix J. This matrix is the so-called Jacobian of the transformation from Y to X: J = x y x y 1 1 n 1 x y x y 1 n n n
46 The transformation of the covariance matrix is where the inverse of J is The transformation from x to y must be one-to-one, such that the inverse functional relationship exists. 1 T 1 cov( cov( = J X J Y = n n n n x y x y x y x y J
47 Obtaining cov(y from cov(x as in the previous slide is a very much used technique in high-energy physics data analysis. It is called linear error propagation and is applicable any time one wants to transform from one set of estimated parameters to another Transformation between different sets of parameters describing a reconstructed particle track Transport of track parameters from one location in a detector to another. Will see examples later in the course
48 The characteristic function Φ(u associated with the pdf f(x is the Fourier transform of f(x: φ( u [ ] iux = Such functions are useful in deriving results about moments of random variables. The relation between Φ(u and the moments of X are i n n d φ n du If Φ(u is known, all moments of f(x can be calculated without the knowledge of f(x itself iux = E e e f ( x dx u= 0 n = x f ( x dx = α n
49 Some common probability distributions: Binomial distribution Poisson distribution Gaussian distribution Chisquare distribution Student s t distribution Gamma distribution We will take a closer look at some of them
50 Binomial distribution: Assume that we make n identical experiments with only two possible outcomes: success or no success The probability of success p is the same for all experiments The individual experiments are independent of each other The probability of x successes out of n trials is then P( X x n p x x = = 1 ( n x p Example: throwing dice n times Defining event of success to be occurence of six spots in a throw Probability p=1/6

51 probability distribution for number of successes in 5 throws
52 probability distribution for number of successes in 15 throws
53 probability distribution for number of successes in 50 throws anything familiar with the shape of this distribution?
54 Mean value and variance: E( X = np Var( X = np(1 p Five throws with a dice: E(# six spots = 5/6 Var(# six spots = 25/36 Std(# six spots = 5/6
55 Poisson distribution: Number of occurences of event A per given time (length, area, volume, interval is constant and equal to λ. Probability distribution of observing x occurences in the interval is P( X = x = e x! Both mean value and variance of X is λ. Example: number of particles in a beam passing through a given area in a given time must be Poisson distributed. If the average number λ is known, the probabilities for all x can be calculated according to the formula above. λ x λ
56 Gaussian distribution: Most frequently occurring distribution in nature. Most measurement uncertainties, disturbances of directions of charged particles when penetrating through (enough matter, number of ionizations created by charged particle in a slab of material etc. follow Gaussian distribution. Main reason: CENTRAL LIMIT THEOREM States that sum of n independent random variables converges to a Gaussian distribution when n is large enough, irrespective of the individual distributions of the variables. Abovementioned examples are typically of this type.
57 Gaussian probability density function with mean value μ and standard deviation σ: f ( x; µ, σ 2 = 1 2 2πσ e 2 ( x µ 2 / 2 σ For a random vector X of size n with mean value μ and covariance matrix V the function is (multivariate Gaussian distribution: f ( x; μ, V = ( 2π n / 2 1 det( V exp 1 2 T 1 ( x μ V ( x μ
58 Usual terminology: X ~ N(μ,σ : X is distributed according to a Gaussian (normal with mean value μ and standard deviation σ. 68 % of distribution within plus/minus one σ. 95 % of distribution within plus/minus two σ % of distribution within plus/minus three σ. Standard normal variable Z~N(0,1: Z=(X- μ/ σ Quantiles of the standard normal distribution: z α P( Z z < 1 = α α The value is denoted the 100 * α % quantile of the standard normal distribution Such quantiles can be found in tables or by computer programs
59 10 % quantile

60 5 % quantile (1.64
61 95 % of area within plus/ minus 2.5 % quantile (1.96
62 2 χ distribution: { X,, } If are independent, Gaussian random variables, then follow a X n n ( 2 X = i µ i χ χ i= 1 σ distribution with n degrees of freedom. Often used in evaluating level of compatibility between observed data and assumed pdf of the data Example: is position of measurement in a particle detector compatible with the assumed distribution of the measurement? Mean value is n and variance 2n. i 2

63 chisquare distribution with 10 degrees of freedom
64 Statistics Statistics is about making inference about a statistical model, given a set of data or measurements Parameters of a distribution Parameters describing the kinematics of a particle after a collision Position and momentum at some reference surface Parameters describing an interaction vertex (position, refined estimates of particle momenta Will consider two issues Parameter estimation Hypothesis tests and confidence intervals
65 Statistics Parameter estimation We want to estimate the unknown value of a parameter θ. An estimator is a function of the data which aims to estimate the value of θ as closely as possible. General estimator properties θ^ Consistency Bias Efficiency Robustness A consistent estimator is an estimator which converges to the true value of θ when the amount of data increases (formally, in the limit of infinite amount of data.
66 Statistics The bias b of an estimator is given as b = ^ E θ θ Since the estimator is a function of the data, it is itself a random variable with its own distribution. The expectation value of θ can be interpreted as the mean value of the estimate for a very large number of hypothetical, identical experiments. Obviously, unbiased (i.e. b=0 estimators are desirable.
67 Statistics The efficiency of an estimator is the inverse of the ratio of its variance to the minimum possible value. The minimum possible value is given by the Rao-Cramer-Frechet lower bound where I(θ is the Fisher information: ( min θ θ σ I b + = = 2 ; ( ln E ( i x i f I θ θ θ
68 Statistics The sum is over all the data, which are assumed independent and to follow the pdf f(x; θ. The expression of the lower bound is valid for all estimators with the same bias function b(θ (for unbiased estimators b(θ vanishes. If the variance of the estimator happens to be equal to the Cramer-Rao- Frechet lower bound, it is called a minimum variance lower bound estimator or a (fully efficient estimator. Different estimators of the same parameter can also be compared by looking at the ratios of the efficiencies. One then talks about relative efficiencies. Robustness is the (qualitative degree of insensitivity of the estimator to deviations in the assumed pdf of the data e.g. noise in the data not properly taken into account wrong data etc
69 Statistics Common estimators for the mean and variance are (often called the sample mean and the sample variance: The variances of these are: ( = = = = N i i N i i x x N s x N x = = ( ( σ σ N N m N s V N x V
70 Statistics For variables which obey the Gaussian distribution, this yields for large N std( s = σ 2N For Gaussian variables the sample mean is a fully efficient estimator. If the different measurements used in the calculation of the sample mean have different variances, a better estimator of the mean is a weighted sample mean: 1 = i xw i 2 σ i i σ i 1 2 x
71 Statistics The method of maximum likelihood: Assume that we have N independent measurements all obeying the pdf f(x;θ, where θ is a parameter vector consisting of n different parameters to be estimated. The maximum likelihood estimate is the value of the parameter vector θ which maximizes the likelihood function L N ( θ = f ( ; θ i= 1 Since the natural logarithm is a monotoneously increasing function, ln(l and L will have maximum for the same value of θ. x i θ
72 Statistics Therefore the maximum likelihood estimate can be found by solving the likelihood equations ln L θ for all i=1,..,n. ML-estimators are asymptotically (i.e. for large amounts of data unbiased and fully efficient Therefore very popular An estimate of the inverse of the covariance matrix of an MLestimate is ( 1 V evaluated at the estimated value of θ. ij i i = 2 ln L = θ θ j 0
73 Statistics The method of least squares. Simplest possible example: estimating the parameters of a straight line (intercept and tangent of inclination angle given a set of measurements. measurements fitted line
74 Statistics Least-squares approach: minimizing the sum of squared distances S between the line and the N measurements, S = N ( y i ( ax σ + b i= 1 variance of measurement i error with respect to the parameters of the line (i.e. a and b. This cost function or objective function S can be written in a more compact way by using matrix notation: i 2 2 S = ( T 1 y Hθ V ( y Hθ
75 Statistics Here y is a vector of measurements, θ is a vector of the parameters a and b, V is the (diagonal covariance matrix of measurements (consisting of the individual variances on the main diagonal, and H is given by 1 x1 H = 1 x N Taking the derivative of S with respect to θ, setting this to zero and solving for θ yields the least-squares solution to the problem.
76 Statistics The result is: θ ( T 1 1 T 1 H V H H y = V The covariance matrix of the estimated parameters is: cov ( ( 1 = H T V H 1 θ and the covariance matrix of the estimated positions cov ( ( T 1 1 T = H H V H H y y = Hθ is
77 Statistics Simulating lines Histogram of value of estimated intercept What is true value of intercept?
78 Statistics Simulating lines Histogram of value of tangent of angle of inclination What is true value?
79 Statistics Histograms of normalized residuals of estimated parameters. This means that for each fitted line and each estimated parameter, a quantity ((estimated parameter-true parameter/standard deviation of parameter is put into the histogram. If everything is OK with the fitting procedure, these histograms should have mean 0 and standard deviation 1. mean= std= mean= std=1.0011
80 Statistics Least-squares estimation is for instance used in track fitting in highenergy physics experiments. Track fitting is basically the same task as the line fit example: estimating a set of parameters describing a particle track through a tracking detector, given a set of measurements created by the particle. In the general case the track model is not a straight line but rather a helix (homogeneous magnetic field or some other trajectory obeying the equations of motion in an inhomogeneous magnetic field. The principles of the fitting procedure, however, are largely the same.
81 Statistics As long as there is a linear relationship between the parameters and the measurements, the least-squares method is linear. If this relationship is a non-linear function F(θ, the problem is said to be of a non-linear least-squares type: S = ( T 1 y F( θ V ( y F( θ There exists no direct solution to this problem, and one has to resort to an iterative approach (Gauss-Newton: Start out with an initial guess of θ, linearize function F around the initial guess by a Taylor expansion and solve the resulting linear least-squares problem Use the estimated value for θ as a new expansion point for F and repeat the step above Iterate until convergence (i.e. until θ changes less than a specified value from one iteration to the next
82 Statistics Relationship between maximum likelihood and least-squares: Consider a set of independent measurements y with mean values F(x;θ. If these measurements follow a Gaussian distribution, the loglikelihood function is basically 2ln L( θ = N i= 1 ( y F( ; θ i x i 2 σ i 2 plus some terms which do not depend on θ. Maximizing the log-likelihood function is in this case equivalent to minimizing the least-squares objective function.
83 Statistics Confidence intervals and hypothesis tests. Confidence intervals: Given a set of measurements of a parameter, calculate an interval that one can be e.g. 95 % sure that the true value of the parameter is within Such an interval is called a 95 % confidence interval of a parameter Example: collect N measurements believed to come from a Gaussian distribution with unknown mean value μ and known standard deviation σ. Use the sample mean value to calculate a 100(1-α % confidence interval for μ. From earlier: the sample mean is an unbiased estimator for μ with standard deviation σ/sqrt(n. X µ For large enough N, the quantity Z = is distributed according to a standard, normal distribution σ / N (mean value 0, standard deviation 1
84 Statistics Therefore: In words, there is a probability 1-α that the true mean is in the interval This interval is therefore a 100(1- α % confidence interval for μ. Such intervals are highly relevant in physics analysis. ( ( ( α σ µ σ α σ µ σ α σ µ σ α σ µ α α α α α α α α = + < < = < < = < < = < < 1 / / 1 / / 1 / / 1 / 2 / 2 / 2 / 2 / 2 / 2 / 2 / 2 / N z X N z X P N z X N z P N z X N z P z N X z P [ ] N z X N z X /, / 2 / 2 / σ σ α α +
85 Statistics Hypothesis tests: A hypothesis is a statement about the distribution of a vector x of data. Similar to the previous example: given a number N measurements, test whether the measurements come from a normal distribution with a certain expectation value μ or not. define a test statistic, i.e. the quantity to be used in the evaluation of the hypothesis. Here: the sample mean. define the significance level of the test, i.e. the probability that the hypothesis will be discarded even though it is true. determine the critical region of the test statistic, i.e. interval(s of values of the test statistic which will lead to the rejection of the hypothesis
86 Statistics We then state two competing hypotheses: A null hypothesis, stating that the expectation value is equal to a given value An alternative hypothesis, stating that the expectation value is not equal to the given value Mathematically: H H 0 1 : µ = : µ µ µ 0 0 Test statistic: Z = X σ / µ 0 N
87 Statistics Obtain a value of the test statistic from test data by calculating the sample mean and transforming to Z. Use the actual value of Z to determine whether the null hypothesis is rejected or not. Probability of being in shaded area: α Shaded area is therefore the critical region of Z for significance level α z α / 2 z α / 2
88 Statistics Alternatively: perform the test by calculating the so-called p-value of the test statistic. Given the actual value of the test statistic, what is the area below the pdf for the range of values of the test statistic starting from the actual one and extending to all values further away from the value defined by the null hypothesis? This area defines the p-value. For the current example this would correspond to adding two integrals of the pdf of the test statistic (because this is a so-called two-sided test: one from minus infinity to minus the absolute value of the actual value of the test statistic another from the absolute value of the actual value of the test statistic to plus infinity For a one-sided test one would stick to one integral of the abovementioned type If the p-value is less than the significance level: discard the null hypothesis. If not, don t discard it.
89 Statistics p-values can be used in so-called goodness-of-fit tests. In such tests one frequently uses a test statistic which is assumed to be chisquare distributed Is a measurement in a tracking detector compatible with belonging to a particle track defined by a set of other measurements? Is a histogram with a set of entries in different bins compatible with an expected histogram (defined by an underlying assumption of the distribution? Is the residual distributions of estimated parameters compatible with the estimated covariance matrix of the parameters? If one can calculate many independent values of the test statistic, the following procedure is often applied: Calculate the p-value of the test statistic each time the test statistic is calculated
90 Statistics The p-value itself is also a random variable, and it can be shown that it is distributed according to a uniform distribution if the test statistic origins from the expected (chisquare distribution. Create a histogram with the various p-values as entries and see whether it looks reasonably flat NB! With only one calculated p-value, the null hypothesis can be rejected but never confirmed! With many calculated p-values (as immediately above the null hypothesis can also (to a certain extent be confirmed! Example: line fit (as before For each fitted line, calculate the following chisquare: 2 χ = 1 ( T ( θ θ cov θ ( θ θ

91 Statistics Here θ is the true value of the parameter vector. For each value of the chisquare, calculate the corresponding p-value Integral of chisquare distribution from the value of the chisquare to infinity Given in tables or in standard computer programs (CERNLIB, CLHEP, MATLAB,. Fill up a histogram with the p-values and make a plot: Reasonably flat histogram, seems OK. What we really test here is that the estimated parameters are unbiased estimates of the true parameters, distributed according to a Gaussian with a covariance matrix as obtained in the estimate!!
BACKGROUND NOTES FYS 4550/FYS EXPERIMENTAL HIGH ENERGY PHYSICS AUTUMN 2016 PROBABILITY A. STRANDLIE NTNU AT GJØVIK AND UNIVERSITY OF OSLO
 ACKGROUND NOTES FYS 4550/FYS9550 - EXERIMENTAL HIGH ENERGY HYSICS AUTUMN 2016 ROAILITY A. STRANDLIE NTNU AT GJØVIK AND UNIVERSITY OF OSLO efore embarking on the concept of probability, we will first define
Statistics and Data Analysis
 Statistics and Data Analysis The Crash Course Physics 226, Fall 2013 "There are three kinds of lies: lies, damned lies, and statistics. Mark Twain, allegedly after Benjamin Disraeli Statistics and Data
Preliminary Statistics Lecture 2: Probability Theory (Outline) prelimsoas.webs.com
 prelimsoas.webs.com") 1 School of Oriental and African Studies September 2015 Department of Economics Preliminary Statistics Lecture 2: Probability Theory (Outline) prelimsoas.webs.com Gujarati D. Basic Econometrics, Appendix
1 School of Oriental and African Studies September 2015 Department of Economics Preliminary Statistics Lecture 2: Probability Theory (Outline) prelimsoas.webs.com Gujarati D. Basic Econometrics, Appendix
Statistics for Data Analysis. Niklaus Berger. PSI Practical Course Physics Institute, University of Heidelberg
 Statistics for Data Analysis PSI Practical Course 2014 Niklaus Berger Physics Institute, University of Heidelberg Overview You are going to perform a data analysis: Compare measured distributions to theoretical
Lectures on Statistical Data Analysis
 Lectures on Statistical Data Analysis London Postgraduate Lectures on Particle Physics; University of London MSci course PH4515 Glen Cowan Physics Department Royal Holloway, University of London g.cowan@rhul.ac.uk
Statistical Methods in Particle Physics. Lecture 2
 Statistical Methods in Particle Physics Lecture 2 October 17, 2011 Silvia Masciocchi, GSI Darmstadt s.masciocchi@gsi.de Winter Semester 2011 / 12 Outline Probability Definition and interpretation Kolmogorov's
Statistical Data Analysis Stat 3: p-values, parameter estimation
 Statistical Data Analysis Stat 3: p-values, parameter estimation London Postgraduate Lectures on Particle Physics; University of London MSci course PH4515 Glen Cowan Physics Department Royal Holloway,
Math Review Sheet, Fall 2008
 1 Descriptive Statistics Math 3070-5 Review Sheet, Fall 2008 First we need to know about the relationship among Population Samples Objects The distribution of the population can be given in one of the
Statistics. Lent Term 2015 Prof. Mark Thomson. 2: The Gaussian Limit
 Statistics Lent Term 2015 Prof. Mark Thomson Lecture 2 : The Gaussian Limit Prof. M.A. Thomson Lent Term 2015 29 Lecture Lecture Lecture Lecture 1: Back to basics Introduction, Probability distribution
If we want to analyze experimental or simulated data we might encounter the following tasks:
 Chapter 1 Introduction If we want to analyze experimental or simulated data we might encounter the following tasks: Characterization of the source of the signal and diagnosis Studying dependencies Prediction
Primer on statistics:
 Primer on statistics: MLE, Confidence Intervals, and Hypothesis Testing ryan.reece@gmail.com http://rreece.github.io/ Insight Data Science - AI Fellows Workshop Feb 16, 018 Outline 1. Maximum likelihood
Introduction to Statistical Methods for High Energy Physics
 Introduction to Statistical Methods for High Energy Physics 2011 CERN Summer Student Lectures Glen Cowan Physics Department Royal Holloway, University of London g.cowan@rhul.ac.uk www.pp.rhul.ac.uk/~cowan
Data Analysis and Monte Carlo Methods
 Lecturer: Allen Caldwell, Max Planck Institute for Physics & TUM Recitation Instructor: Oleksander (Alex) Volynets, MPP & TUM General Information: - Lectures will be held in English, Mondays 16-18:00 -
Lecture 1: Probability Fundamentals
 Lecture 1: Probability Fundamentals IB Paper 7: Probability and Statistics Carl Edward Rasmussen Department of Engineering, University of Cambridge January 22nd, 2008 Rasmussen (CUED) Lecture 1: Probability
Probability and Estimation. Alan Moses
 Probability and Estimation Alan Moses Random variables and probability A random variable is like a variable in algebra (e.g., y=e x ), but where at least part of the variability is taken to be stochastic.
MA/ST 810 Mathematical-Statistical Modeling and Analysis of Complex Systems
 MA/ST 810 Mathematical-Statistical Modeling and Analysis of Complex Systems Review of Basic Probability The fundamentals, random variables, probability distributions Probability mass/density functions
Fourier and Stats / Astro Stats and Measurement : Stats Notes
 Fourier and Stats / Astro Stats and Measurement : Stats Notes Andy Lawrence, University of Edinburgh Autumn 2013 1 Probabilities, distributions, and errors Laplace once said Probability theory is nothing
Brandon C. Kelly (Harvard Smithsonian Center for Astrophysics)
") Brandon C. Kelly (Harvard Smithsonian Center for Astrophysics) Probability quantifies randomness and uncertainty How do I estimate the normalization and logarithmic slope of a X ray continuum, assuming
Brandon C. Kelly (Harvard Smithsonian Center for Astrophysics) Probability quantifies randomness and uncertainty How do I estimate the normalization and logarithmic slope of a X ray continuum, assuming
Physics 403. Segev BenZvi. Parameter Estimation, Correlations, and Error Bars. Department of Physics and Astronomy University of Rochester
 Physics 403 Parameter Estimation, Correlations, and Error Bars Segev BenZvi Department of Physics and Astronomy University of Rochester Table of Contents 1 Review of Last Class Best Estimates and Reliability
Statistical Methods for Astronomy
 Statistical Methods for Astronomy Probability (Lecture 1) Statistics (Lecture 2) Why do we need statistics? Useful Statistics Definitions Error Analysis Probability distributions Error Propagation Binomial
Topic 2: Probability & Distributions. Road Map Probability & Distributions. ECO220Y5Y: Quantitative Methods in Economics. Dr.
 Topic 2: Probability & Distributions ECO220Y5Y: Quantitative Methods in Economics Dr. Nick Zammit University of Toronto Department of Economics Room KN3272 n.zammit utoronto.ca November 21, 2017 Dr. Nick
Statistische Methoden der Datenanalyse. Kapitel 1: Fundamentale Konzepte. Professor Markus Schumacher Freiburg / Sommersemester 2009
 Prof. M. Schumacher Stat Meth. der Datenanalyse Kapi,1: Fundamentale Konzepten Uni. Freiburg / SoSe09 1 Statistische Methoden der Datenanalyse Kapitel 1: Fundamentale Konzepte Professor Markus Schumacher
Statistical Methods in Particle Physics
 Statistical Methods in Particle Physics Lecture 11 January 7, 2013 Silvia Masciocchi, GSI Darmstadt s.masciocchi@gsi.de Winter Semester 2012 / 13 Outline How to communicate the statistical uncertainty
2. A Basic Statistical Toolbox
 . A Basic Statistical Toolbo Statistics is a mathematical science pertaining to the collection, analysis, interpretation, and presentation of data. Wikipedia definition Mathematical statistics: concerned
Statistical Methods for Particle Physics Lecture 1: parameter estimation, statistical tests
 Statistical Methods for Particle Physics Lecture 1: parameter estimation, statistical tests http://benasque.org/2018tae/cgi-bin/talks/allprint.pl TAE 2018 Benasque, Spain 3-15 Sept 2018 Glen Cowan Physics
Multivariate Statistics
 Multivariate Statistics Chapter 2: Multivariate distributions and inference Pedro Galeano Departamento de Estadística Universidad Carlos III de Madrid pedro.galeano@uc3m.es Course 2016/2017 Master in Mathematical
STATISTICS OF OBSERVATIONS & SAMPLING THEORY. Parent Distributions
 ASTR 511/O Connell Lec 6 1 STATISTICS OF OBSERVATIONS & SAMPLING THEORY References: Bevington Data Reduction & Error Analysis for the Physical Sciences LLM: Appendix B Warning: the introductory literature
Statistics. Lecture 2 August 7, 2000 Frank Porter Caltech. The Fundamentals; Point Estimation. Maximum Likelihood, Least Squares and All That
 Statistics Lecture 2 August 7, 2000 Frank Porter Caltech The plan for these lectures: The Fundamentals; Point Estimation Maximum Likelihood, Least Squares and All That What is a Confidence Interval? Interval
Physics 403. Segev BenZvi. Propagation of Uncertainties. Department of Physics and Astronomy University of Rochester
 Physics 403 Propagation of Uncertainties Segev BenZvi Department of Physics and Astronomy University of Rochester Table of Contents 1 Maximum Likelihood and Minimum Least Squares Uncertainty Intervals
Statistical Methods in Particle Physics
 Statistical Methods in Particle Physics Lecture 3 October 29, 2012 Silvia Masciocchi, GSI Darmstadt s.masciocchi@gsi.de Winter Semester 2012 / 13 Outline Reminder: Probability density function Cumulative
Lecture 25: Review. Statistics 104. April 23, Colin Rundel
 Lecture 25: Review Statistics 104 Colin Rundel April 23, 2012 Joint CDF F (x, y) = P [X x, Y y] = P [(X, Y ) lies south-west of the point (x, y)] Y (x,y) X Statistics 104 (Colin Rundel) Lecture 25 April
Bivariate distributions
 Bivariate distributions 3 th October 017 lecture based on Hogg Tanis Zimmerman: Probability and Statistical Inference (9th ed.) Bivariate Distributions of the Discrete Type The Correlation Coefficient
Single Maths B: Introduction to Probability
 Single Maths B: Introduction to Probability Overview Lecturer Email Office Homework Webpage Dr Jonathan Cumming j.a.cumming@durham.ac.uk CM233 None! http://maths.dur.ac.uk/stats/people/jac/singleb/ 1 Introduction
Recitation 2: Probability
 Recitation 2: Probability Colin White, Kenny Marino January 23, 2018 Outline Facts about sets Definitions and facts about probability Random Variables and Joint Distributions Characteristics of distributions
A Very Brief Summary of Statistical Inference, and Examples
 A Very Brief Summary of Statistical Inference, and Examples Trinity Term 2008 Prof. Gesine Reinert 1 Data x = x 1, x 2,..., x n, realisations of random variables X 1, X 2,..., X n with distribution (model)
L2: Review of probability and statistics
 Probability L2: Review of probability and statistics Definition of probability Axioms and properties Conditional probability Bayes theorem Random variables Definition of a random variable Cumulative distribution
Space Telescope Science Institute statistics mini-course. October Inference I: Estimation, Confidence Intervals, and Tests of Hypotheses
 Space Telescope Science Institute statistics mini-course October 2011 Inference I: Estimation, Confidence Intervals, and Tests of Hypotheses James L Rosenberger Acknowledgements: Donald Richards, William
Lecture 5. G. Cowan Lectures on Statistical Data Analysis Lecture 5 page 1
 Lecture 5 1 Probability (90 min.) Definition, Bayes theorem, probability densities and their properties, catalogue of pdfs, Monte Carlo 2 Statistical tests (90 min.) general concepts, test statistics,
Parameter estimation and forecasting. Cristiano Porciani AIfA, Uni-Bonn
 Parameter estimation and forecasting Cristiano Porciani AIfA, Uni-Bonn Questions? C. Porciani Estimation & forecasting 2 Temperature fluctuations Variance at multipole l (angle ~180o/l) C. Porciani Estimation
Statistical techniques for data analysis in Cosmology
 Statistical techniques for data analysis in Cosmology arxiv:0712.3028; arxiv:0911.3105 Numerical recipes (the bible ) Licia Verde ICREA & ICC UB-IEEC http://icc.ub.edu/~liciaverde outline Lecture 1: Introduction
Stat 5101 Lecture Notes
 Stat 5101 Lecture Notes Charles J. Geyer Copyright 1998, 1999, 2000, 2001 by Charles J. Geyer May 7, 2001 ii Stat 5101 (Geyer) Course Notes Contents 1 Random Variables and Change of Variables 1 1.1 Random
Statistics, Data Analysis, and Simulation SS 2015
 Statistics, Data Analysis, and Simulation SS 2015 08.128.730 Statistik, Datenanalyse und Simulation Dr. Michael O. Distler Mainz, 27. April 2015 Dr. Michael O. Distler
Advanced Herd Management Probabilities and distributions
 Advanced Herd Management Probabilities and distributions Anders Ringgaard Kristensen Slide 1 Outline Probabilities Conditional probabilities Bayes theorem Distributions Discrete Continuous Distribution
Statistical Methods in Particle Physics Lecture 1: Bayesian methods
 Statistical Methods in Particle Physics Lecture 1: Bayesian methods SUSSP65 St Andrews 16 29 August 2009 Glen Cowan Physics Department Royal Holloway, University of London g.cowan@rhul.ac.uk www.pp.rhul.ac.uk/~cowan
Statistical Methods for Particle Physics (I)
") Statistical Methods for Particle Physics (I) https://agenda.infn.it/conferencedisplay.py?confid=14407 Glen Cowan Physics Department Royal Holloway, University of London g.cowan@rhul.ac.uk www.pp.rhul.ac.uk/~cowan
Statistical Methods for Particle Physics (I) https://agenda.infn.it/conferencedisplay.py?confid=14407 Glen Cowan Physics Department Royal Holloway, University of London g.cowan@rhul.ac.uk www.pp.rhul.ac.uk/~cowan
Review of Statistics
 Review of Statistics Topics Descriptive Statistics Mean, Variance Probability Union event, joint event Random Variables Discrete and Continuous Distributions, Moments Two Random Variables Covariance and
Lecture Notes 1 Probability and Random Variables. Conditional Probability and Independence. Functions of a Random Variable
 Lecture Notes 1 Probability and Random Variables Probability Spaces Conditional Probability and Independence Random Variables Functions of a Random Variable Generation of a Random Variable Jointly Distributed
Probability Density Functions
 Statistical Methods in Particle Physics / WS 13 Lecture II Probability Density Functions Niklaus Berger Physics Institute, University of Heidelberg Recap of Lecture I: Kolmogorov Axioms Ingredients: Set
Probability and Distributions
 Probability and Distributions What is a statistical model? A statistical model is a set of assumptions by which the hypothetical population distribution of data is inferred. It is typically postulated
Practical Statistics
 Practical Statistics Lecture 1 (Nov. 9): - Correlation - Hypothesis Testing Lecture 2 (Nov. 16): - Error Estimation - Bayesian Analysis - Rejecting Outliers Lecture 3 (Nov. 18) - Monte Carlo Modeling -
EC212: Introduction to Econometrics Review Materials (Wooldridge, Appendix)
") 1 EC212: Introduction to Econometrics Review Materials (Wooldridge, Appendix) Taisuke Otsu London School of Economics Summer 2018 A.1. Summation operator (Wooldridge, App. A.1) 2 3 Summation operator For
1 EC212: Introduction to Econometrics Review Materials (Wooldridge, Appendix) Taisuke Otsu London School of Economics Summer 2018 A.1. Summation operator (Wooldridge, App. A.1) 2 3 Summation operator For
Parameter estimation! and! forecasting! Cristiano Porciani! AIfA, Uni-Bonn!
 Parameter estimation! and! forecasting! Cristiano Porciani! AIfA, Uni-Bonn! Questions?! C. Porciani! Estimation & forecasting! 2! Cosmological parameters! A branch of modern cosmological research focuses
Basics on Probability. Jingrui He 09/11/2007
 Basics on Probability Jingrui He 09/11/2007 Coin Flips You flip a coin Head with probability 0.5 You flip 100 coins How many heads would you expect Coin Flips cont. You flip a coin Head with probability
32. STATISTICS. 32. Statistics 1
 32. STATISTICS 32. Statistics 1 Revised April 1998 by F. James (CERN); February 2000 by R. Cousins (UCLA); October 2001, October 2003, and August 2005 by G. Cowan (RHUL). This chapter gives an overview
Statistics: Learning models from data
 DS-GA 1002 Lecture notes 5 October 19, 2015 Statistics: Learning models from data Learning models from data that are assumed to be generated probabilistically from a certain unknown distribution is a crucial
STATS 200: Introduction to Statistical Inference. Lecture 29: Course review
 STATS 200: Introduction to Statistical Inference Lecture 29: Course review Course review We started in Lecture 1 with a fundamental assumption: Data is a realization of a random process. The goal throughout
Why study probability? Set theory. ECE 6010 Lecture 1 Introduction; Review of Random Variables
 ECE 6010 Lecture 1 Introduction; Review of Random Variables Readings from G&S: Chapter 1. Section 2.1, Section 2.3, Section 2.4, Section 3.1, Section 3.2, Section 3.5, Section 4.1, Section 4.2, Section
Human-Oriented Robotics. Probability Refresher. Kai Arras Social Robotics Lab, University of Freiburg Winter term 2014/2015
 Probability Refresher Kai Arras, University of Freiburg Winter term 2014/2015 Probability Refresher Introduction to Probability Random variables Joint distribution Marginalization Conditional probability
Lecture Notes 1 Probability and Random Variables. Conditional Probability and Independence. Functions of a Random Variable
 Lecture Notes 1 Probability and Random Variables Probability Spaces Conditional Probability and Independence Random Variables Functions of a Random Variable Generation of a Random Variable Jointly Distributed
Exercises and Answers to Chapter 1
 Exercises and Answers to Chapter The continuous type of random variable X has the following density function: a x, if < x < a, f (x), otherwise. Answer the following questions. () Find a. () Obtain mean
Multivariate Regression
 Multivariate Regression The so-called supervised learning problem is the following: we want to approximate the random variable Y with an appropriate function of the random variables X 1,..., X p with the
* Tuesday 17 January :30-16:30 (2 hours) Recored on ESSE3 General introduction to the course.
 Recored on ESSE3 General introduction to the course.") Name of the course Statistical methods and data analysis Audience The course is intended for students of the first or second year of the Graduate School in Materials Engineering. The aim of the course
Name of the course Statistical methods and data analysis Audience The course is intended for students of the first or second year of the Graduate School in Materials Engineering. The aim of the course
Lecture 3. G. Cowan. Lecture 3 page 1. Lectures on Statistical Data Analysis
 Lecture 3 1 Probability (90 min.) Definition, Bayes theorem, probability densities and their properties, catalogue of pdfs, Monte Carlo 2 Statistical tests (90 min.) general concepts, test statistics,
Review of Probability Theory
 Review of Probability Theory Arian Maleki and Tom Do Stanford University Probability theory is the study of uncertainty Through this class, we will be relying on concepts from probability theory for deriving
FYST17 Lecture 8 Statistics and hypothesis testing. Thanks to T. Petersen, S. Maschiocci, G. Cowan, L. Lyons
 FYST17 Lecture 8 Statistics and hypothesis testing Thanks to T. Petersen, S. Maschiocci, G. Cowan, L. Lyons 1 Plan for today: Introduction to concepts The Gaussian distribution Likelihood functions Hypothesis
Statistics for the LHC Lecture 1: Introduction
 Statistics for the LHC Lecture 1: Introduction Academic Training Lectures CERN, 14 17 June, 2010 indico.cern.ch/conferencedisplay.py?confid=77830 Glen Cowan Physics Department Royal Holloway, University
Class 26: review for final exam 18.05, Spring 2014
 Probability Class 26: review for final eam 8.05, Spring 204 Counting Sets Inclusion-eclusion principle Rule of product (multiplication rule) Permutation and combinations Basics Outcome, sample space, event
Review of Probabilities and Basic Statistics
 Alex Smola Barnabas Poczos TA: Ina Fiterau 4 th year PhD student MLD Review of Probabilities and Basic Statistics 10-701 Recitations 1/25/2013 Recitation 1: Statistics Intro 1 Overview Introduction to
Statistics for scientists and engineers
 Statistics for scientists and engineers February 0, 006 Contents Introduction. Motivation - why study statistics?................................... Examples..................................................3
Probability. Table of contents
 Probability Table of contents 1. Important definitions 2. Distributions 3. Discrete distributions 4. Continuous distributions 5. The Normal distribution 6. Multivariate random variables 7. Other continuous
Chapter 1 Statistical Reasoning Why statistics? Section 1.1 Basics of Probability Theory
 Chapter 1 Statistical Reasoning Why statistics? Uncertainty of nature (weather, earth movement, etc. ) Uncertainty in observation/sampling/measurement Variability of human operation/error imperfection
Introduction to Probability and Statistics (Continued)
") Introduction to Probability and Statistics (Continued) Prof. icholas Zabaras Center for Informatics and Computational Science https://cics.nd.edu/ University of otre Dame otre Dame, Indiana, USA Email:
Introduction to Probability and Statistics (Continued) Prof. icholas Zabaras Center for Informatics and Computational Science https://cics.nd.edu/ University of otre Dame otre Dame, Indiana, USA Email:
RWTH Aachen Graduiertenkolleg
 RWTH Aachen Graduiertenkolleg 9-13 February, 2009 Glen Cowan Physics Department Royal Holloway, University of London g.cowan@rhul.ac.uk www.pp.rhul.ac.uk/~cowan Course web page: www.pp.rhul.ac.uk/~cowan/stat_aachen.html
Parameter Estimation and Fitting to Data
 Parameter Estimation and Fitting to Data Parameter estimation Maximum likelihood Least squares Goodness-of-fit Examples Elton S. Smith, Jefferson Lab 1 Parameter estimation Properties of estimators 3 An
32. STATISTICS. 32. Statistics 1
 32. STATISTICS 32. Statistics 1 Revised September 2007 by G. Cowan (RHUL). This chapter gives an overview of statistical methods used in High Energy Physics. In statistics, we are interested in using a
[y i α βx i ] 2 (2) Q = i=1
![[y i α βx i ] 2 (2) Q = i=1](/thumbs/75/72005858.jpg "[y i α βx i ] 2 (2) Q = i=1") Least squares fits This section has no probability in it. There are no random variables. We are given n points (x i, y i ) and want to find the equation of the line that best fits them. We take the equation
Least squares fits This section has no probability in it. There are no random variables. We are given n points (x i, y i ) and want to find the equation of the line that best fits them. We take the equation
UQ, Semester 1, 2017, Companion to STAT2201/CIVL2530 Exam Formulae and Tables
 UQ, Semester 1, 2017, Companion to STAT2201/CIVL2530 Exam Formulae and Tables To be provided to students with STAT2201 or CIVIL-2530 (Probability and Statistics) Exam Main exam date: Tuesday, 20 June 1
Statistical Data Analysis 2017/18
 Statistical Data Analysis 2017/18 London Postgraduate Lectures on Particle Physics; University of London MSci course PH4515 Glen Cowan Physics Department Royal Holloway, University of London g.cowan@rhul.ac.uk
Statistical inference
 Statistical inference Contents 1. Main definitions 2. Estimation 3. Testing L. Trapani MSc Induction - Statistical inference 1 1 Introduction: definition and preliminary theory In this chapter, we shall
Probability theory basics
 Probability theory basics Michael Franke Basics of probability theory: axiomatic definition, interpretation, joint distributions, marginalization, conditional probability & Bayes rule. Random variables:
Intro to Probability. Andrei Barbu
 Intro to Probability Andrei Barbu Some problems Some problems A means to capture uncertainty Some problems A means to capture uncertainty You have data from two sources, are they different? Some problems
Physics 6720 Introduction to Statistics April 4, 2017
 Physics 6720 Introduction to Statistics April 4, 2017 1 Statistics of Counting Often an experiment yields a result that can be classified according to a set of discrete events, giving rise to an integer
E. Santovetti lesson 4 Maximum likelihood Interval estimation
 E. Santovetti lesson 4 Maximum likelihood Interval estimation 1 Extended Maximum Likelihood Sometimes the number of total events measurements of the experiment n is not fixed, but, for example, is a Poisson
Sample Spaces, Random Variables
 Sample Spaces, Random Variables Moulinath Banerjee University of Michigan August 3, 22 Probabilities In talking about probabilities, the fundamental object is Ω, the sample space. (elements) in Ω are denoted
SYSM 6303: Quantitative Introduction to Risk and Uncertainty in Business Lecture 4: Fitting Data to Distributions
 SYSM 6303: Quantitative Introduction to Risk and Uncertainty in Business Lecture 4: Fitting Data to Distributions M. Vidyasagar Cecil & Ida Green Chair The University of Texas at Dallas Email: M.Vidyasagar@utdallas.edu
Lecture 2. G. Cowan Lectures on Statistical Data Analysis Lecture 2 page 1
 Lecture 2 1 Probability (90 min.) Definition, Bayes theorem, probability densities and their properties, catalogue of pdfs, Monte Carlo 2 Statistical tests (90 min.) general concepts, test statistics,
Practice Problems Section Problems
 Practice Problems Section 4-4-3 4-4 4-5 4-6 4-7 4-8 4-10 Supplemental Problems 4-1 to 4-9 4-13, 14, 15, 17, 19, 0 4-3, 34, 36, 38 4-47, 49, 5, 54, 55 4-59, 60, 63 4-66, 68, 69, 70, 74 4-79, 81, 84 4-85,
Parametric Inference Maximum Likelihood Inference Exponential Families Expectation Maximization (EM) Bayesian Inference Statistical Decison Theory
 Bayesian Inference Statistical Decison Theory") Statistical Inference Parametric Inference Maximum Likelihood Inference Exponential Families Expectation Maximization (EM) Bayesian Inference Statistical Decison Theory IP, José Bioucas Dias, IST, 2007
Statistical Inference Parametric Inference Maximum Likelihood Inference Exponential Families Expectation Maximization (EM) Bayesian Inference Statistical Decison Theory IP, José Bioucas Dias, IST, 2007
CME 106: Review Probability theory
 : Probability theory Sven Schmit April 3, 2015 1 Overview In the first half of the course, we covered topics from probability theory. The difference between statistics and probability theory is the following:
This does not cover everything on the final. Look at the posted practice problems for other topics.
 Class 7: Review Problems for Final Exam 8.5 Spring 7 This does not cover everything on the final. Look at the posted practice problems for other topics. To save time in class: set up, but do not carry
Statistics and data analyses
 Statistics and data analyses Designing experiments Measuring time Instrumental quality Precision Standard deviation depends on Number of measurements Detection quality Systematics and methology σ tot =
32. STATISTICS. 32. Statistics 1
 32. STATISTICS 32. Statistics 1 Revised September 2009 by G. Cowan (RHUL). This chapter gives an overview of statistical methods used in high-energy physics. In statistics, we are interested in using a
Lectures on Statistics. William G. Faris
 Lectures on Statistics William G. Faris December 1, 2003 ii Contents 1 Expectation 1 1.1 Random variables and expectation................. 1 1.2 The sample mean........................... 3 1.3 The sample
Multiple Random Variables
 Multiple Random Variables This Version: July 30, 2015 Multiple Random Variables 2 Now we consider models with more than one r.v. These are called multivariate models For instance: height and weight An
Statistics notes. A clear statistical framework formulates the logic of what we are doing and why. It allows us to make precise statements.
 Statistics notes Introductory comments These notes provide a summary or cheat sheet covering some basic statistical recipes and methods. These will be discussed in more detail in the lectures! What is
MAS223 Statistical Inference and Modelling Exercises
 MAS223 Statistical Inference and Modelling Exercises The exercises are grouped into sections, corresponding to chapters of the lecture notes Within each section exercises are divided into warm-up questions,
Mathematical statistics
 October 4 th, 2018 Lecture 12: Information Where are we? Week 1 Week 2 Week 4 Week 7 Week 10 Week 14 Probability reviews Chapter 6: Statistics and Sampling Distributions Chapter 7: Point Estimation Chapter
Math 416 Lecture 2 DEFINITION. Here are the multivariate versions: X, Y, Z iff P(X = x, Y = y, Z =z) = p(x, y, z) of X, Y, Z iff for all sets A, B, C,
 = p(x, y, z) of X, Y, Z iff for all sets A, B, C,") Math 416 Lecture 2 DEFINITION. Here are the multivariate versions: PMF case: p(x, y, z) is the joint Probability Mass Function of X, Y, Z iff P(X = x, Y = y, Z =z) = p(x, y, z) PDF case: f(x, y, z) is
Math 416 Lecture 2 DEFINITION. Here are the multivariate versions: PMF case: p(x, y, z) is the joint Probability Mass Function of X, Y, Z iff P(X = x, Y = y, Z =z) = p(x, y, z) PDF case: f(x, y, z) is
Summary of basic probability theory Math 218, Mathematical Statistics D Joyce, Spring 2016
 8. For any two events E and F, P (E) = P (E F ) + P (E F c ). Summary of basic probability theory Math 218, Mathematical Statistics D Joyce, Spring 2016 Sample space. A sample space consists of a underlying
p(z)
") Chapter Statistics. Introduction This lecture is a quick review of basic statistical concepts; probabilities, mean, variance, covariance, correlation, linear regression, probability density functions and
Chapter Statistics. Introduction This lecture is a quick review of basic statistical concepts; probabilities, mean, variance, covariance, correlation, linear regression, probability density functions and