FLOOD/FLASH FLOOD. Lightning. Tornado
|
|
|
- Sophie Rice
- 5 years ago
- Views:
Transcription


1 2004 Annual Summaries National Oceanic and Atmospheric Administration National Environmental Satellite Data Information Service National Climatic Data Center FLOOD/FLASH FLOOD Lightning Tornado Hurricane
2 2004 Annual Summaries Flood/Flash Flood Lightning Tornado Hurricane All summaries are compiled from information contained in the Storm Data Publication. Sources include the Storm Data Publication, the National Weather Service's Office Climate, Water and Weather Services. Edited by: William Angel - Meteorologist, Editor-Storm Data, NCDC, Asheville, NC. Compiled and Prepared by: Stuart Hinson, Meteorologist and Rhonda Herndon Assistant Editors-Storm Data, NCDC, Asheville, NC. With help from: Brent MacAloney, Meteorologist, National Weather Service, Silver Spring, MD. Melody Magnus, Webmaster, Office of Services, National Weather Service, Silver Spring, MD. Published by: National Climatic Data Center Federal Building 151 Patton Avenue Asheville, NC (828)
3 Summary of Natural Hazard Statistics for 2004 in the United States This National Weather Service (NWS) report summarizes fatalities, injuries and damages caused by severe weather in The NWS Office of Climate, Water and Weather Services and the National Climatic Data Center compiled this Summary of U.S. Natural Hazard Statistics from Storm Data, a report comprising statistics from NWS forecast offices in the 50 states, Puerto Rico, Guam, and the Virgin Islands. Summary of 2004 Weather Events, Fatalities, Injuries, and Damage Costs LAST UPDATED : 7/13/2005 Weather Event Fatalities Injuries Amount of Property Damage (M) Convection Lightning $ 26.1 Tornado Tstm Wind Hail Amount of Crop Damage (M) $ $ Total Prop/Crop Damage (M) Extreme Temperatures Cold 27 2 Heat Flood Flash Flood River Flood Small Stream/Urban Flood } 82 } ,168.7 Marine Coastal Storm Tsunami 0 0 Rip Current Tropical Cyclones Tropical Storm/Hurricane , ,569.1 Winter Winter Storm Ice Avalanche Other Drought Dust Storm Dust Devil Rain Fog High Wind Waterspout Fire Weather Mud Slide Volcanic Ash Miscellaneous , , TOTALS $25,346.4M $1,452.1M $26,798.5M 3
4 Summary of 2004 Natural Hazard Statistics In 2004, there were 369 weather-related fatalities, a significant decrease from 438 in 2003 and even more notable drop from 542 in The 2004 fatality number is well below the 10-year average ( ) of 521. The biggest weather threat to life in 2004 was flooding. In 2004, flooding took the most lives, claiming 82 weather related victims, down from 86 in The next biggest killers in 2004 were tornadoes with 35 fatalities and tropical storms/ hurricanes with 34 fatalities, followed by rip currents and lighting with 32 deaths each. For the second year in a row, extreme heat, typically the biggest killer, ranked as one of least dangerous hazards, claiming only 6 lives. Weather-related injuries dropped in 2004 to 2,428 from 2,924 in Hurricanes replaced tornadoes as the major source of injuries in 2004 with 840. Tornadoes caused 396 injuries (down from 1,087 in 2003), lightning, 280 and thunderstorm winds, 244. Of the 367 weather-related fatalities, males again accounted for about twice as many deaths as females. As in the past, males were affected more by weather in all categories. September was the deadliest month with 72 fatalities, most of which were from a series of strong hurricanes that pounded the southeastern coastal states. As to be expected, in 2004, Florida was hardest hit by weather, losing 61 citizens to hurricanes, rip currents and other hazards. Weather claimed 28 lives in Illinois, 25 in Texas and 22 in North Carolina. Severe weather caused $25.3 billion in property damages in 2004, up from $11.4 billion in 2003 and $5.7 billion in Hurricanes replaced wildfires as the most damaging weather in 2004 with an estimated $18.9 billion in claims. Coming in a distant second was high wind which caused $3.3 billion in losses and flooding, which registered about $1.7 billion. Crop damages for 2004 totaled $1.45 billion. Hurricanes were responsible for $667.3 million in losses. Floods destroyed $340.5 million in crops. Florida took the dubious honor of highest weather related property and crop damages totaling $19.3 billion in losses, mostly due to intense wind and rain from three major hurricanes, Frances, Ivan and Jeanne. 4
5 2004 Summary of all Natural Hazards 2004 SUMMARY OF FATALITIES FOR ALL HAZARDS BY AGE AND GENDER FEMALE MALE UNKNOWN TOTAL PERCENT 0 TO TO TO TO TO TO TO TO TO TO UNKNOWN TOTAL PERCENT (* Due to rounding total does not equal 100%) 100* MONTHLY WEATHER RELATED FATALITIES Fatalities Jan Feb Mar Apr May Jun Jul Aug Sep Oct Nov Dec Month _ 5
6 2004 Summary of Hazardous Weather Fatalities, Injuries, and Damage Costs Listed by State Property State Fatalities Injuries Damage (M) Crop Damage (M) Total Damage (M) AK AL , ,627.8 AR AZ CA CO CT DC 0 0 DE FL , ,165.5 GA GU HI IA ID IL IN KS KY LA MA MD ME MI MN MO MS MT NC ND NE NH NJ NM NV NY OH OK OR PA PR RI SC SD TN TX UT VA VI VT WA WI WV WY TOTAL $25,296.3 M $1,452.6 M $26,748.9 M NOTE: Amounts may be slightly different than those indicated on front page due to those events not occurring in within a state boundary 6
7 2004 Lightning Fatalities In 2004, there were 32 lightning fatalities, 11 less than the 2003 total of 43. The 2004 number falls significantly below the 10-year average of 49 fatalities. For the 6th consecutive year, Florida was hardest hit with 5 fatalities; Georgia also lost 5 citizens to lightning; Texas and Colorado each lost 3 lives to lightning. As per previous year, the most dangerous place to be in 2004 was in the open, with 13 deaths (41%); under a tree, 6 (19%). In 2004, as in 2003, almost four times as many men, 26, (81%) as woman. 6, (19%) were killed by lightning. The age range accounted for 53% of the fatalities with 17 deaths. Lightning most severely affects younger ages that are active outside. STATE 2004 LIGHTNING FATALITIES BY STATE AND LOCATION BF BO CA EQ GF IW OT OU TE UT AL AR CA CO FL GA IN LA MS NC NY OH RI SC TN TX VA VT TOTAL TOTAL PERCENT * (* Due to rounding total does not equal 100%) 2004 LIGHTNING FATALITIES BY AGE AND GENDER FEMALE MALE UNKNOWN TOTAL PERCENT 0 TO TO TO TO TO TO TO TO TO TO UNKNOWN LEGEND BF - Ball Field BO - Boat CA - Camping EQ - Nr Hvy Equipment GF - Golf IW - In Water OT - Other/Unknown OU - Outside Open TE - At Telephone UT - Under Tree TOTAL PERCENT
8 2004 Tornado Fatalities During 2004, tornadoes in the United States caused 35 deaths. This number of deaths is down 19 from the 2003 total of 54 and down significantly from the 10-year average of 57. Tornado deaths declined in the last 8 years and remain below the 30-year average of 65 per year. In a departure from previous years when mobile homes were the most dangerous place to be, 43% of deaths occurred in permanent homes, 29% in businesses and 23% in mobile homes in Fatalities were fairly even between the sexes with slightly more males victims, 18, than female, 17. Victims spanned the age ranges from fairly evenly. STATE 2004 TORNADO FATALITIES BY STATE AND LOCATION BU LS MH OT OU PH SC VE AL FL GA IL IN LA MO MS NC NE SC TX WI TOTAL TOTAL PERCENT * (* Due to rounding total does not equal 100%) 2004 TORNADO FATALITIES BY AGE AND GENDER FEMALE MALE UNKNOWN TOTAL PERCENT 0 TO TO TO TO TO TO TO TO TO TO UNKNOWN BU LS MH OT OU PH SC VE LEGEND - Business - Long-Span Roof - Mobile Home - Other/Unknown - Outside Open - Permanent Home - School - Vehicle TOTAL PERCENT (* Due to rounding total does not equal 100%) 99 * 8
9 2004 Flash Flood / River Flood Related Fatalities In 2004, flooding (flash floods, river floods, and urban/small stream floods) was again the most hazardous weather, causing 82 fatalities, down from 86 in This total is just below the 10-year average of 84 deaths. Of the 82 fatalities, 45 victims were in vehicles and 25 were directly in water. Texas suffered the most losses, 14. Virginia counted 11 flooding deaths. Flash floods caused 58 deaths and river floods claimed 24, with no deaths attributed to small stream or urban flooding. The 0- to 9 and 20- to 29-age groups suffered the most losses with 14 fatalities each. Of the victims, 50 were male and 30 were female. Two victims not identified. This hardest hit age groups were children aged 0-9 and adults The statistics for children is not typical and highlights the need for continued public awareness of flooding dangers FLASH FLOOD / RIVER FLOOD FATALITIES BY STATE AND LOCATION STATE BO BU CA IW MH OT PH VE TOTAL AL AR AZ CA FL GA GU IA IN KY MN MO MS NC NE NY OH OK PA PR TN TX VA WI WV TOTAL PERCENT * (* Due to rounding total does not equal 100%) 2004 FLASH FLOOD / RIVER FLOOD FATALITIES BY AGE AND GENDER FEMALE MALE UNKNOWN TOTAL PERCENT 0 TO TO TO TO TO TO TO TO TO TO UNKNOWN BO BU CA IW MH OT PH VE LEGEND - Boat - Business - Camping - In Water - Mobile Home - Other/Unknown - Permanent Home - Vehicle TOTAL PERCENT
10 2004 Flash Flood / River Flood Related Fatalities (Continued) 2004 FLASH FLOOD / RIVER FLOOD FATALITIES BY STATE STATE FLASH FLOOD RIVER FLOOD TOTAL AL AR AZ CA FL GA GU IA IN KY MN MO MS NC NE NY OH OK PA PR TN TX VA WI WV TOTAL PERCENT FLASH FLOOD / RIVER FLOOD FATALITIES BY GENDER FLASH FLOOD RIVER FLOOD TOTAL PERCENT FEMALE MALE UNKNOWN TOTAL PERCENT
11 2004 Winter Weather Related Fatalities In 2004, there were 28 winter weather deaths, matching This number is down from the 10-year average of 44. Pennsylvania logged the highest death toll with 6, followed closely by Virginia with 5. The most hazardous place to be in the winter of 2004 was in a vehicle, which accounted for 20 (71%) of the winter weather victims, followed by outside with 6 (21%). Unlike 2003 when seniors were the hardest hit age group, in 2004 victims were more likely to be in the age range, which counted 14 deaths. There were again no ice related deaths in 2003 but avalanches accounted for 12 fatalities, up from 9 in STATE 2004 WINTER STORM FATALITIES BY STATE AND LOCATION LS MH OT OU PH VE AK CA CO ID IL IN KS MD MT NE PA SC VA VT TOTAL PERCENT TOTAL 2004 WINTER STORM FATALITIES BY AGE AND GENDER FEMALE MALE UNKNOWN TOTAL PERCENT 0 TO TO TO TO TO TO TO TO TO TO UNKNOWN TOTAL * PERCENT (* Due to rounding total does not equal 100%) LEGEND LS - Long-Span Roof MH- Mobile Home OT - Other/Unknown OU - Outside Open PH - Permanent Home VE - Vehicle 11
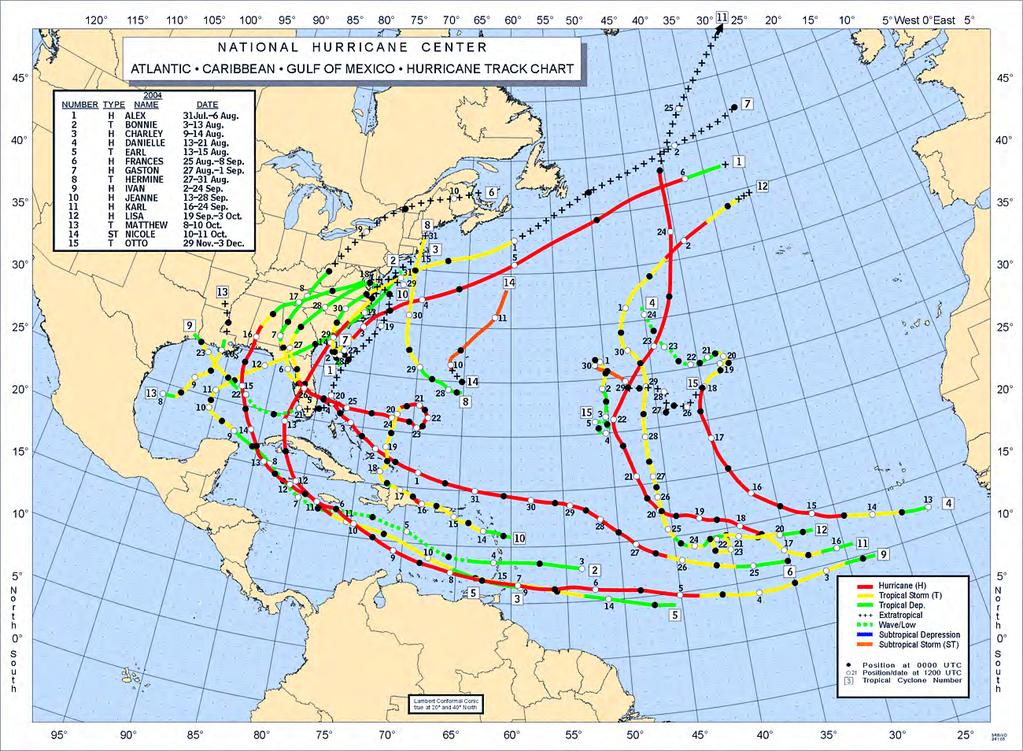
12 2004 Tropical Cyclone Fatalities The 2004 Atlantic Basin tropical cyclone season was active and extremely destructive with 16 named storms. This number is down from 2003 with 21 named storms; however 2003 did not bring as many highly destructive storms. Of the 16 tropical cyclones, 9 had wind speed measuring hurricane force, compared to 7 in Males were hurricane victims almost twice as often (65%) 22 as women with (35%) 12 of deaths in Unlike most years when the most dangerous place to be in a tropical cyclone was outside, this year those who did not evacuate their homes were most severely hit with 38 deaths, followed by 18 outside and 15 in vehicles. For the second year, the Pacific Basin logged 16 named storms, 6 Hurricanes and 10 Tropical Storms. In August and September, Hurricanes Charley, Frances, Ivan and Jeanne made landfall in Florida traveled up through the Southeast to Virginia and Maryland claiming 34 lives and accumulating an estimated $18.9 billion in damages TROPICAL CYCLONE FATALITIES BY STATE AND LOCATION STATE BO BU IW LS MH OT OU PH SC VE TOTAL FL MS PR TOTAL PERCENT * (* Due to rounding total does not equal 100%) 2004 TROPICAL CYCLONE FATALITIES BY AGE AND GENDER FEMALE MALE UNKNOWN TOTAL PERCENT 0 TO TO TO TO TO TO TO TO TO TO UNKNOWN BO BU IW LS MH OT OU PH SC VE LEGEND - Boat - Business - In Water - Long-Span Roof - Mobile Home - Other/Unknown - Outside Open - Permanent Home - School - Vehicle TOTAL PERCENT (* Due to rounding total does not equal 100%) 102* 12
13 2004 Wind Related Fatalities Wind related fatalities totaled 48 in 2004; down 5 from the 2003 total of 43. Once again, the most dangerous place to be in 2004 during a thunderstorm or wind event was in a vehicle; this category accounted for 44% (21) fatalities. High winds claimed 26 victims while thunderstorm winds accounted for 22 lives. Arkansas and Florida each recorded the most wind related deaths at 6 each. Males edged out females as the most frequent victims of wind with 56% to 43%. The hardest hit age ranges were and with 15 losses each. STATE 2004 HIGH WIND AND THUNDERSTORM WIND FATALITIES BY STATE AND LOCATION BO CA LS MH OT OU PH SC AL AZ CA CO DE FL HI IL KS MA MD MI MO MS NC NJ NY OH OK PA SC TN VT WA WI WV TOTAL PERCENT VE TOTAL 2004 HIGH WIND AND THUNDERSTORM WIND FATALITIES BY AGE AND GENDER FEMALE MALE UNKNOWN TOTAL PERCENT 0 TO TO TO TO TO TO TO TO TO TO UNKNOWN BO CA LS MH OT OU PH SC LEGEND - Boat - Camping - Long-Span Roof - Mobile Home - Other/Unknown - Outside Open - Permanent Home - School VE - Vehicle TOTAL PERCENT (* Due to rounding total does not equal 100%) 99* 11
14 2004 Wind Related Fatalities (Continued) 2004 HIGH WIND AND THUNDERSTORM WIND FATALITIES BY STATE STATE TSTM WIND HIGH WIND TOTAL AL AZ CA CO DE FL HI IL KS MA MD MI MO MS NC NJ NY OH OK PA SC TN VT WA WI WV TOTAL PERCENT HIGH WIND AND THUNDERSTORM WIND FATALITIES BY GENDER TSTM WIND HIGH WIND TOTAL PERCENT FEMALE MALE UNKNOWN TOTAL PERCENT
15 2004 Heat Related Fatalities In 2004, only 6 lives were lost to excessive heat, down dramatically from 36 in 2002 and even more dramatically from the 10-year average for heat related fatalities: 237. In 2004, 3 fatalities occurred in permanent homes, 2 outside and 1 in a vehicle. Texas was hardest hit with 3 deaths, followed by Missouri, Tennessee and Pennsylvania with 1 each. In a divergence from past years, losses were even between those and senior aged Seniors typically are the hardest hit by extreme heat. Deaths were split evenly between men and women. STATE 2004 HEAT RELATED FATALITIES BY STATE AND LOCATION BF CA GF MH OT OU PH MO PA TN TX TOTAL PERCENT VE TOTAL 2004 HEAT RELATED FATALITIES BY AGE AND GENDER FEMALE MALE UNKNOWN TOTAL PERCENT 0 TO TO TO TO TO TO TO TO TO TO UNKNOWN TOTAL PERCENT BF CA GF MH OT OU PH VE LEGEND - Ball Field - Camping - Golf - Mobile Home - Other/Unknown - Outside Open - Permanent Home - Vehicle 15
16 2004 Cold Related Fatalities In 2004, 27 people died from hypothermia, compared to 20 in This total is still below the 10-year average for cold related fatalities: 27. Illinois took the dubious honor of most deaths, with 17. Pennsylvania was a distant second at 4. Of those deaths 27 deaths, 16 (59%) occurred outside and 10 (37%) in a permanent home. Unlike past years, the death toll was much heavier for males, 63% males to 37% female. In 2003, the split was event between males and females. Once again seniors were the hardest hit group, with 26 deaths in the age group. STATE 2004 COLD RELATED FATALITIES BY STATE AND LOCATION IW MH OT OU PH VE IL MS NE NJ NY OR PA TX TOTAL PERCENT TOTAL 2004 COLD RELATED FATALITIES BY AGE AND GENDER FEMALE MALE UNKNOWN TOTAL PERCENT 0 TO TO TO TO TO TO TO TO TO TO UNKNOWN LEGEND IW - In Water MH - Mobile Home OT - Other/Unknown OU - Outside Open PH - Permanent Home VE - Vehicle TOTAL PERCENT
17 TOTAL LIGHTNING BY STATE AND NATION FOR YEAR 2004 STATE JAN FEB MAR APR MAY JUN JUL AUG SEP OCT NOV DEC ANN ALABAMA ALASKA ARIZONA ARKANSAS CALIFORNIA COLORADO CONNECTICUT DELAWARE DISTRICT OF COLUMBIA FLORIDA GEORGIA HAWAII IDAHO ILLINOIS INDIANA IOWA KANSAS KENTUCKY LOUISIANA MAINE MARYLAND MASSACHUSETTS MICHIGAN MINNESOTA MISSISSIPPI MISSOURI MONTANA NEBRASKA NEVADA NEW HAMPSHIRE NEW JERSEY NEW MEXICO NEW YORK NORTH CAROLINA NORTH DAKOTA OHIO OKLAHOMA OREGON PENNSYLVANIA PUERTO RICO RHODE ISLAND SOUTH CAROLINA SOUTH DAKOTA TENNESSEE TEXAS UTAH VERMONT VIRGINIA WASHINGTON WEST VIRGINIA WISCONSIN WYOMING TOTAL: UNITED STATES
18 TOTAL LIGHTNING INJURIES BY STATE AND NATION FOR YEAR 2004 STATE JAN FEB MAR APR MAY JUN JUL AUG SEP OCT NOV DEC ANN ALABAMA ALASKA ARIZONA ARKANSAS CALIFORNIA COLORADO CONNECTICUT DELAWARE DISTRICT OF COLUMBIA FLORIDA GEORGIA HAWAII IDAHO ILLINOIS INDIANA IOWA KANSAS KENTUCKY LOUISIANA MAINE MARYLAND MASSACHUSETTS MICHIGAN MINNESOTA MISSISSIPPI MISSOURI MONTANA NEBRASKA NEVADA NEW HAMPSHIRE NEW JERSEY NEW MEXICO NEW YORK NORTH CAROLINA NORTH DAKOTA OHIO OKLAHOMA OREGON PENNSYLVANIA PUERTO RICO RHODE ISLAND SOUTH CAROLINA SOUTH DAKOTA TENNESSEE TEXAS UTAH VERMONT VIRGINIA WASHINGTON WEST VIRGINIA WISCONSIN WYOMING TOTAL: UNITED STATES
19 TOTAL LIGHTNING BY STATE AND NATION FOR PEROID STATE JAN FEB MAR APR MAY JUN JUL AUG SEP OCT NOV DEC ANN ALABAMA ALASKA ARIZONA ARKANSAS CALIFORNIA COLORADO CONNECTICUT DELAWARE DISTRICT OF COLUMBIA FLORIDA GEORGIA HAWAII IDAHO ILLINOIS INDIANA IOWA KANSAS KENTUCKY LOUISIANA MAINE MARYLAND MASSACHUSETTS MICHIGAN MINNESOTA MISSISSIPPI MISSOURI MONTANA NEBRASKA NEVADA NEW HAMPSHIRE NEW JERSEY NEW MEXICO NEW YORK NORTH CAROLINA NORTH DAKOTA OHIO OKLAHOMA OREGON PENNSYLVANIA PUERTO RICO RHODE ISLAND SOUTH CAROLINA SOUTH DAKOTA TENNESSEE TEXAS UTAH VERMONT VIRGINIA WASHINGTON WEST VIRGINIA WISCONSIN WYOMING TOTAL: UNITED STATES
20 TOTAL LIGHTNING INJURIES BY STATE AND NATION FOR PEROID STATE JAN FEB MAR APR MAY JUN JUL AUG SEP OCT NOV DEC ANN ALABAMA ALASKA ARIZONA ARKANSAS CALIFORNIA COLORADO CONNECTICUT DELAWARE DISTRICT OF COLUMBIA FLORIDA GEORGIA HAWAII IDAHO ILLINOIS INDIANA IOWA KANSAS KENTUCKY LOUISIANA MAINE MARYLAND MASSACHUSETTS MICHIGAN MINNESOTA MISSISSIPPI MISSOURI MONTANA NEBRASKA NEVADA NEW HAMPSHIRE NEW JERSEY NEW MEXICO NEW YORK NORTH CAROLINA NORTH DAKOTA OHIO OKLAHOMA OREGON PENNSYLVANIA PUERTO RICO RHODE ISLAND SOUTH CAROLINA SOUTH DAKOTA TENNESSEE TEXAS UTAH VERMONT VIRGINIA WASHINGTON WEST VIRGINIA WISCONSIN WYOMING TOTAL: UNITED STATES
21 NATIONAL TOTAL LIGHTNING BY YEAR FOR PERIOD YEAR JAN FEB MAR APR MAY JUN JUL AUG SEP OCT NOV DEC ANN * TOTAL MEAN * ON DECEMBER 8, 1963 THE CRASH OF A JETLINER KILLING 81 PEOPLE NEAR ELKIN, MARYLAND, WAS ATTRIBUTED TO LIGHTNING BY THE CIVIL AERONAUTICS BOARD INVESTIGATORS. 21
22 NATIONAL TOTAL LIGHTNING INJURIES BY YEAR FOR PERIOD YEAR JAN FEB MAR APR MAY JUN JUL AUG SEP OCT NOV DEC ANN TOTAL MEAN
23 LIGHTNING BY STATE, RANK, AND LOCATION OF OCCURRENCE RANK OPEN FIELDS, BALL PARKS AND OPEN SPACES UNDER TREES BOATING, FISHING AND WATER RELATED NEAR TRACTORS HEAVY ROAD EQUIPMENT GOLF COURSES AT TELEPHONES VARIOUS OTHER AND UNKNOWN LOCATIONS OPEN FIELDS, BALL PARKS AND OPEN SPACES UNDER TREES BOATING, FISHING AND WATER RELATED NEAR TRACTORS HEAVY ROAD EQUIPMENT GOLF COURSES AT TELEPHONES VARIOUS OTHER AND UNKNOWN LOCATIONS STATE ALABAMA ALASKA ARIZONA ARKANSAS CALIFORNIA COLORADO CONNECTICUT DELAWARE DIST OF COLUMBIA FLORIDA GEORGIA HAWAII IDAHO ILLINOIS INDIANA IOWA KANSAS KENTUCKY LOUISIANA MAINE MARYLAND MASSACHUSETTS MICHIGAN MINNESOTA MISSISSIPPI MISSOURI MONTANA NEBRASKA NEVADA NEW HAMPSHIRE NEW JERSEY NEW MEXICO NEW YORK NORTH CAROLINA NORTH DAKOTA * ON DECEMBER 8, 1963 THE CRASH OF A JETLINER KILLING 81 PEOPLE NEAR ELKIN, MARYLAND, WAS ATTRIBUTED TO LIGHTNING BY THE CIVIL AERONAUTICS BOARD INVESTIGATORS. 23
24 LIGHTNING BY STATE, RANK, AND LOCATION OF OCCURRENCE RANK OPEN FIELDS, BALL PARKS AND OPEN SPACES UNDER TREES BOATING, FISHING AND WATER RELATED NEAR TRACTORS HEAVY ROAD EQUIPMENT GOLF COURSES AT TELEPHONES VARIOUS OTHER AND UNKNOWN LOCATIONS OPEN FIELDS, BALL PARKS AND OPEN SPACES UNDER TREES BOATING, FISHING AND WATER RELATED NEAR TRACTORS HEAVY ROAD EQUIPMENT GOLF COURSES AT TELEPHONES VARIOUS OTHER AND UNKNOWN LOCATIONS STATE OHIO OKLAHOMA OREGON PENNSYLVANIA PUERTO RICO RHODE ISLAND SOUTH CAROLINA SOUTH DAKOTA TENNESSEE TEXAS UTAH VERMONT VIRGINIA WASHINGTON WEST VIRGINIA WISCONSIN WYOMING UNITED STATES
25 LIGHTNING INJURIES BY STATE, RANK, AND LOCATION OF OCCURRENCE RANK OPEN FIELDS, BALL PARKS AND OPEN SPACES UNDER TREES BOATING, FISHING AND WATER RELATED NEAR TRACTORS HEAVY ROAD EQUIPMENT GOLF COURSES AT TELEPHONES VARIOUS OTHER AND UNKNOWN LOCATIONS OPEN FIELDS, BALL PARKS AND OPEN SPACES UNDER TREES BOATING, FISHING AND WATER RELATED NEAR TRACTORS HEAVY ROAD EQUIPMENT GOLF COURSES AT TELEPHONES VARIOUS OTHER AND UNKNOWN LOCATIONS STATE ALABAMA ALASKA ARIZONA ARKANSAS CALIFORNIA COLORADO CONNECTICUT DELAWARE DIST OF COLUMBIA FLORIDA GEORGIA HAWAII IDAHO ILLINOIS INDIANA IOWA KANSAS KENTUCKY LOUISIANA MAINE MARYLAND MASSACHUSETTS MICHIGAN MINNESOTA MISSISSIPPI MISSOURI MONTANA NEBRASKA NEVADA NEW HAMPSHIRE NEW JERSEY NEW MEXICO NEW YORK NORTH CAROLINA NORTH DAKOTA
26 LIGHTNING INJURIES BY STATE, RANK, AND LOCATION OF OCCURRENCE RANK OPEN FIELDS, BALL PARKS AND OPEN SPACES UNDER TREES BOATING, FISHING AND WATER RELATED NEAR TRACTORS HEAVY ROAD EQUIPMENT GOLF COURSES AT TELEPHONES VARIOUS OTHER AND UNKNOWN LOCATIONS OPEN FIELDS, BALL PARKS AND OPEN SPACES UNDER TREES BOATING, FISHING AND WATER RELATED NEAR TRACTORS HEAVY ROAD EQUIPMENT GOLF COURSES AT TELEPHONES VARIOUS OTHER AND UNKNOWN LOCATIONS STATE OHIO OKLAHOMA OREGON PENNSYLVANIA PUERTO RICO RHODE ISLAND SOUTH CAROLINA SOUTH DAKOTA TENNESSEE TEXAS UTAH VERMONT VIRGINIA WASHINGTON WEST VIRGINIA WISCONSIN WYOMING UNITED STATES
27 TORNADO SUMMARY BY STATE AND NATION, 2004 LOCATION JAN FEB MAR APR MAY JUN JUL AUG SEP OCT NOV DEC ANN ALABAMA INJURIES ALASKA ARIZONA ARKANSAS INJURIES CALIFORNIA COLORADO INJURIES DELAWARE FLORIDA INJURIES GEORGIA INJURIES GUAM HAWAII IDAHO ILLINOIS INJURIES INDIANA INJURIES * CORRECTED FOR BOUNDARY-CROSSING TORNADOES & TORNADO FOR COUNTRY AS A WHOLE Page 1 27
28 TORNADO SUMMARY BY STATE AND NATION, 2004 LOCATION JAN FEB MAR APR MAY JUN JUL AUG SEP OCT NOV DEC ANN IOWA INJURIES KANSAS INJURIES KENTUCKY INJURIES LOUISIANA INJURIES MAINE MARYLAND MASSACHUSETTS MICHIGAN MINNESOTA MISSISSIPPI INJURIES MISSOURI INJURIES MONTANA NEBRASKA INJURIES NEVADA * CORRECTED FOR BOUNDARY-CROSSING TORNADOES & TORNADO FOR COUNTRY AS A WHOLE Page 2 28
29 TORNADO SUMMARY BY STATE AND NATION, 2004 LOCATION JAN FEB MAR APR MAY JUN JUL AUG SEP OCT NOV DEC ANN NEW HAMPSHIRE NEW JERSEY INJURIES NEW MEXICO NEW YORK NORTH CAROLINA INJURIES NORTH DAKOTA OHIO INJURIES OKLAHOMA OREGON PENNSYLVANIA SOUTH CAROLINA INJURIES SOUTH DAKOTA TENNESSEE INJURIES TEXAS INJURIES * CORRECTED FOR BOUNDARY-CROSSING TORNADOES & TORNADO FOR COUNTRY AS A WHOLE Page 3 29
30 TORNADO SUMMARY BY STATE AND NATION, 2004 LOCATION JAN FEB MAR APR MAY JUN JUL AUG SEP OCT NOV DEC ANN VIRGINIA INJURIES WASHINGTON WEST VIRGINIA INJURIES WISCONSIN INJURIES WYOMING UNITED STATES * 271* 126* * 78* 153* 27* 1819* INJURIES * CORRECTED FOR BOUNDARY-CROSSING TORNADOES & TORNADO FOR COUNTRY AS A WHOLE Page 4 30
31 NATIONS SUMMARY OF TORNADOS, TORNADO AND BY MONTH AND ANNUAL, JANUARY FEBRUARY MARCH APRIL MAY JUNE JULY AUGUST SEPTEMBER OCTOBER NOVEMBER DECEMBER ANNUAL YEAR
32 NATIONS SUMMARY OF TORNADOS, TORNADO AND BY MONTH AND ANNUAL, JANUARY FEBRUARY MARCH APRIL MAY JUNE JULY AUGUST SEPTEMBER OCTOBER NOVEMBER DECEMBER ANNUAL YEAR POR MEAN
33 TORNADOES, TORNADO AND BY STATE AND NATION STATE TORNADOES TOTAL AVERAGE GREATEST YEAR LEAST YEAR PER 10,000 # Sq.Mi. TOTAL AVERAGE TOTAL AVERAGE ALABAMA ALASKA ARIZONA ARKANSAS CALIFORNIA COLORADO CONNECTICUT DELAWARE DISTRICT OF COLUMBIA FLORIDA GEORGIA HAWAII IDAHO ILLINOIS INDIANA IOWA KANSAS KENTUCKY LOUISIANA MAINE MARYLAND MASSACHUSETTS MICHIGAN MINNESOTA MISSISSIPPI MISSOURI MONTANA NEBRASKA NEVADA NEW HAMPSHIRE NEW JERSEY NEW MEXICO NEW YORK NORTH CAROLINA NORTH DAKOTA OHIO OKLAHOMA OREGON PENNSYLVANIA PUERTO RICO RHODE ISLAND SOUTH CAROLINA SOUTH DAKOTA TENNESSEE TEXAS UTAH VERMONT VIRGINIA VIRGIN ISLANDS WASHINGTON WEST VIRGINIA WISCONSIN WYOMING PACIFIC ISLANDS UNITED STATES 47438* & PER # 10,000 Sq.Mi. + ALSO IN EARLIER YEAR(S). * CORRECTED FOR BOUNDARY-CROSSING TORNADOES. & TORNADOES FOR COUNTRY AS A WHOLE. # MEAN ANNUAL TORNADOES PER 10,000 SQUARE MILES. ' OF PER 10,000 SQUARE MILES. 33
34 NATIONAL TORNADOES, TORNADO, AND RESULTING LOSSES BY YEARS, YEAR TORNADOES TORNADO TOTAL MOST IN SINGLE TORNADO TOTAL PROPERTY LOSSES $ CATEGORY 5 PROPERTY LOSS FREQUENCY * CATEGORY 6 CATEGORY 7 AND OVER NOTE:-THE ABOVE ESTIMATED LOSSES ARE BASED ON VALUES AT TIME OF OCCURRENCE. MEAN WAS DERIVED FROM DATA FOR PERIOD $ STORM DAMAGES IN CATEGORIES: 5. $50,000 TO $500, $500,000 TO $5 MILLION 7. $5 MILLION TO $50 MILLION 8. $50 MILLION TO $500 MILLION 9. $500 MILLION AND OVER * OF TIMES PROPERTY LOSSES REPORTED IN STORM DATA IN CATEGORIESS 5, 6, 7 AND OVER. 34


35 NATIONAL TORNADOES, TORNADO, AND RESULTING LOSSES BY YEARS, YEAR TORNADOES TORNADO TOTAL MOST IN SINGLE TORNADO TOTAL PROPERTY LOSSES $ CATEGORY 5 PROPERTY LOSS FREQUENCY * CATEGORY 6 CATEGORY 7 AND OVER MEAN NOTE:-THE ABOVE ESTIMATED LOSSES ARE BASED ON VALUES AT TIME OF OCCURRENCE. MEAN WAS DERIVED FROM DATA FOR PERIOD $ STORM DAMAGES IN CATEGORIES: 5. $50,000 TO $500, $500,000 TO $5 MILLION 7. $5 MILLION TO $50 MILLION 8. $50 MILLION TO $500 MILLION 9. $500 MILLION AND OVER * OF TIMES PROPERTY LOSSES REPORTED IN STORM DATA IN CATEGORIESS 5, 6, 7 AND OVER. 35
36
Summary of Natural Hazard Statistics for 2008 in the United States
 Summary of Natural Hazard Statistics for 2008 in the United States This National Weather Service (NWS) report summarizes fatalities, injuries and damages caused by severe weather in 2008. The NWS Office
What Lies Beneath: A Sub- National Look at Okun s Law for the United States.
 What Lies Beneath: A Sub- National Look at Okun s Law for the United States. Nathalie Gonzalez Prieto International Monetary Fund Global Labor Markets Workshop Paris, September 1-2, 2016 What the paper
Parametric Test. Multiple Linear Regression Spatial Application I: State Homicide Rates Equations taken from Zar, 1984.
 Multiple Linear Regression Spatial Application I: State Homicide Rates Equations taken from Zar, 984. y ˆ = a + b x + b 2 x 2K + b n x n where n is the number of variables Example: In an earlier bivariate
SUPPLEMENTAL NUTRITION ASSISTANCE PROGRAM QUALITY CONTROL ANNUAL REPORT FISCAL YEAR 2008
 SUPPLEMENTAL NUTRITION ASSISTANCE PROGRAM QUALITY CONTROL ANNUAL REPORT FISCAL YEAR 2008 U.S. DEPARTMENT OF AGRICULTURE FOOD AND NUTRITION SERVICE PROGRAM ACCOUNTABILITY AND ADMINISTRATION DIVISION QUALITY
Meteorology 110. Lab 1. Geography and Map Skills
 Meteorology 110 Name Lab 1 Geography and Map Skills 1. Geography Weather involves maps. There s no getting around it. You must know where places are so when they are mentioned in the course it won t be
Correction to Spatial and temporal distributions of U.S. winds and wind power at 80 m derived from measurements
 JOURNAL OF GEOPHYSICAL RESEARCH, VOL. 109,, doi:10.1029/2004jd005099, 2004 Correction to Spatial and temporal distributions of U.S. winds and wind power at 80 m derived from measurements Cristina L. Archer
New Educators Campaign Weekly Report
 Campaign Weekly Report Conversations and 9/24/2017 Leader Forms Emails Collected Text Opt-ins Digital Journey 14,661 5,289 4,458 7,124 317 13,699 1,871 2,124 Pro 13,924 5,175 4,345 6,726 294 13,086 1,767
Hourly Precipitation Data Documentation (text and csv version) February 2016
 February 2016") I. Description Hourly Precipitation Data Documentation (text and csv version) February 2016 Hourly Precipitation Data (labeled Precipitation Hourly in Climate Data Online system) is a database that gives
I. Description Hourly Precipitation Data Documentation (text and csv version) February 2016 Hourly Precipitation Data (labeled Precipitation Hourly in Climate Data Online system) is a database that gives
extreme weather, climate & preparedness in the american mind
 extreme weather, climate & preparedness in the american mind Extreme Weather, Climate & Preparedness In the American Mind Interview dates: March 12, 2012 March 30, 2012. Interviews: 1,008 Adults (18+)
Cooperative Program Allocation Budget Receipts Southern Baptist Convention Executive Committee October 2017
 Cooperative Program Allocation Budget Receipts October 2017 Cooperative Program Allocation Budget Current Current $ Change % Change Month Month from from Contribution Sources 2017-2018 2016-2017 Prior
Cooperative Program Allocation Budget Receipts Southern Baptist Convention Executive Committee October 2018
 Cooperative Program Allocation Budget Receipts October 2018 Cooperative Program Allocation Budget Current Current $ Change % Change Month Month from from Contribution Sources 2018-2019 2017-2018 Prior
Cooperative Program Allocation Budget Receipts Southern Baptist Convention Executive Committee May 2018
 Cooperative Program Allocation Budget Receipts May 2018 Cooperative Program Allocation Budget Current Current $ Change % Change Month Month from from Contribution Sources 2017-2018 2016-2017 Prior Year
Swine Enteric Coronavirus Disease (SECD) Situation Report June 30, 2016
 Situation Report June 30, 2016") Animal and Plant Health Inspection Service Veterinary Services Swine Enteric Coronavirus Disease (SECD) Situation Report June 30, 2016 Information current as of 12:00 pm MDT, 06/29/2016 This report provides
Animal and Plant Health Inspection Service Veterinary Services Swine Enteric Coronavirus Disease (SECD) Situation Report June 30, 2016 Information current as of 12:00 pm MDT, 06/29/2016 This report provides
Monthly Long Range Weather Commentary Issued: APRIL 18, 2017 Steven A. Root, CCM, Chief Analytics Officer, Sr. VP,
 Monthly Long Range Weather Commentary Issued: APRIL 18, 2017 Steven A. Root, CCM, Chief Analytics Officer, Sr. VP, sroot@weatherbank.com MARCH 2017 Climate Highlights The Month in Review The average contiguous
Additional VEX Worlds 2019 Spot Allocations
 Overview VEX Worlds 2019 Spot s Qualifying spots for the VEX Robotics World Championship are calculated twice per year. On the following table, the number in the column is based on the number of teams
MINERALS THROUGH GEOGRAPHY
 MINERALS THROUGH GEOGRAPHY INTRODUCTION Minerals are related to rock type, not political definition of place. So, the minerals are to be found in a variety of locations that doesn t depend on population
Monthly Long Range Weather Commentary Issued: SEPTEMBER 19, 2016 Steven A. Root, CCM, Chief Analytics Officer, Sr. VP,
 Monthly Long Range Weather Commentary Issued: SEPTEMBER 19, 2016 Steven A. Root, CCM, Chief Analytics Officer, Sr. VP, sroot@weatherbank.com SEPTEMBER 2016 Climate Highlights The Month in Review The contiguous
Standard Indicator That s the Latitude! Students will use latitude and longitude to locate places in Indiana and other parts of the world.
 Standard Indicator 4.3.1 That s the Latitude! Purpose Students will use latitude and longitude to locate places in Indiana and other parts of the world. Materials For the teacher: graph paper, globe showing
(Specification B) (JUN H01) (JaN11GEOG101) General Certificate of Education Secondary Education Advanced Higher TierSubsidiary Examination
 (JUN H01) (JaN11GEOG101) General Certificate of Education Secondary Education Advanced Higher TierSubsidiary Examination") Centre Number Surname Candidate Number For Examiner s Use Other Names Candidate Signature Examiner s Initials Geography (Specification B) Unit 1 General Certificate of Education Secondary Education Advanced
Centre Number Surname Candidate Number For Examiner s Use Other Names Candidate Signature Examiner s Initials Geography (Specification B) Unit 1 General Certificate of Education Secondary Education Advanced
Monthly Long Range Weather Commentary Issued: NOVEMBER 16, 2015 Steven A. Root, CCM, Chief Analytics Officer, Sr. VP, sales
 Monthly Long Range Weather Commentary Issued: NOVEMBER 16, 2015 Steven A. Root, CCM, Chief Analytics Officer, Sr. VP, sales sroot@weatherbank.com OCTOBER 2015 Climate Highlights The Month in Review The
Intercity Bus Stop Analysis
 by Karalyn Clouser, Research Associate and David Kack, Director of the Small Urban and Rural Livability Center Western Transportation Institute College of Engineering Montana State University Report prepared
Swine Enteric Coronavirus Disease (SECD) Situation Report Sept 17, 2015
 Situation Report Sept 17, 2015") Animal and Plant Health Inspection Service Veterinary Services Swine Enteric Coronavirus Disease (SECD) Situation Report Sept 17, 2015 Information current as of 12:00 pm MDT, 09/16/2015 This report provides
Animal and Plant Health Inspection Service Veterinary Services Swine Enteric Coronavirus Disease (SECD) Situation Report Sept 17, 2015 Information current as of 12:00 pm MDT, 09/16/2015 This report provides
Jakarta International School 6 th Grade Formative Assessment Graphing and Statistics -Black
 Jakarta International School 6 th Grade Formative Assessment Graphing and Statistics -Black Name: Date: Score : 42 Data collection, presentation and application Frequency tables. (Answer question 1 on
, District of Columbia
 State Capitals These are the State Seals of each state. Fill in the blank with the name of each states capital city. (Hint: You may find it helpful to do the word search first to refresh your memory.),
Challenge 1: Learning About the Physical Geography of Canada and the United States
 60ºN S T U D E N T H A N D O U T Challenge 1: Learning About the Physical Geography of Canada and the United States 170ºE 10ºW 180º 20ºW 60ºN 30ºW 1 40ºW 160ºW 50ºW 150ºW 60ºW 140ºW N W S E 0 500 1,000
Abortion Facilities Target College Students
 Target College Students By Kristan Hawkins Executive Director, Students for Life America Ashleigh Weaver Researcher Abstract In the Fall 2011, Life Dynamics released a study entitled, Racial Targeting
1.2 TRACKING AND EVALUATING U.S. BILLION DOLLAR WEATHER DISASTERS,
 1.2 TRACKING AND EVALUATING U.S. BILLION DOLLAR WEATHER DISASTERS, 1980-2005 Neal Lott * and Tom Ross * NOAA National Climatic Data Center, Asheville, North Carolina ABSTRACT About ten years ago, NOAA
QF (Build 1010) Widget Publishing, Inc Page: 1 Batch: 98 Test Mode VAC Publisher's Statement 03/15/16, 10:20:02 Circulation by Issue
 Widget Publishing, Inc Page: 1 Batch: 98 Test Mode VAC Publisher's Statement 03/15/16, 10:20:02 Circulation by Issue") QF 1.100 (Build 1010) Widget Publishing, Inc Page: 1 Circulation by Issue Qualified Non-Paid Circulation Qualified Paid Circulation Individual Assoc. Total Assoc. Total Total Requester Group Qualified
QF 1.100 (Build 1010) Widget Publishing, Inc Page: 1 Circulation by Issue Qualified Non-Paid Circulation Qualified Paid Circulation Individual Assoc. Total Assoc. Total Total Requester Group Qualified
Preview: Making a Mental Map of the Region
 Preview: Making a Mental Map of the Region Draw an outline map of Canada and the United States on the next page or on a separate sheet of paper. Add a compass rose to your map, showing where north, south,
A. Geography Students know the location of places, geographic features, and patterns of the environment.
 Learning Targets Elementary Social Studies Grade 5 2014-2015 A. Geography Students know the location of places, geographic features, and patterns of the environment. A.5.1. A.5.2. A.5.3. A.5.4. Label North
Office of Special Education Projects State Contacts List - Part B and Part C
 Office of Special Education Projects State Contacts List - Part B and Part C Source: http://www.ed.gov/policy/speced/guid/idea/monitor/state-contactlist.html Alabama Customer Specialist: Jill Harris 202-245-7372
Annual Performance Report: State Assessment Data
 Annual Performance Report: 2005-2006 State Assessment Data Summary Prepared by: Martha Thurlow, Jason Altman, Damien Cormier, and Ross Moen National Center on Educational Outcomes (NCEO) April, 2008 The
RELATIONSHIPS BETWEEN THE AMERICAN BROWN BEAR POPULATION AND THE BIGFOOT PHENOMENON
 RELATIONSHIPS BETWEEN THE AMERICAN BROWN BEAR POPULATION AND THE BIGFOOT PHENOMENON ETHAN A. BLIGHT Blight Investigations, Gainesville, FL ABSTRACT Misidentification of the American brown bear (Ursus arctos,
Analyzing Severe Weather Data
 Chapter Weather Patterns and Severe Storms Investigation A Analyzing Severe Weather Data Introduction Tornadoes are violent windstorms associated with severe thunderstorms. Meteorologists carefully monitor
National Wildland Significant Fire Potential Outlook
 National Wildland Significant Fire Potential Outlook National Interagency Fire Center Predictive Services Issued: April 1, 2008 Next Issue: May 1, 2008 Wildland Fire Outlook April 2008 through July 2008
Osteopathic Medical Colleges
 Osteopathic Medical Colleges Matriculants by U.S. States and Territories Entering Class 0 Prepared by the Research Department American Association of Colleges of Osteopathic Medicine Copyright 0, AAM All
Chapter. Organizing and Summarizing Data. Copyright 2013, 2010 and 2007 Pearson Education, Inc.
 Chapter 2 Organizing and Summarizing Data Section 2.1 Organizing Qualitative Data Objectives 1. Organize Qualitative Data in Tables 2. Construct Bar Graphs 3. Construct Pie Charts When data is collected
Printable Activity book
 Printable Activity book 16 Pages of Activities Printable Activity Book Print it Take it Keep them busy Print them out Laminate them or Put them in page protectors Put them in a binder Bring along a dry
Tornado Hazard Risk Analysis: A Report for Rutherford County Emergency Management Agency
 Tornado Hazard Risk Analysis: A Report for Rutherford County Emergency Management Agency by Middle Tennessee State University Faculty Lisa Bloomer, Curtis Church, James Henry, Ahmad Khansari, Tom Nolan,
Nursing Facilities' Life Safety Standard Survey Results Quarterly Reference Tables
 Nursing Facilities' Life Safety Standard Survey Results Quarterly Reference Tables Table of Contents Table 1: Summary of Life Safety Survey Results by State Table 2: Ten Most Frequently Cited Life Safety
Swine Enteric Coronavirus Disease (SECD) Situation Report Mar 5, 2015
 Situation Report Mar 5, 2015") Animal and Plant Health Inspection Service Veterinary Services Swine Enteric Coronavirus Disease (SECD) Situation Report Mar 5, 2015 Information current as of 12:00 pm MDT, 03/04/2015 This report provides
Animal and Plant Health Inspection Service Veterinary Services Swine Enteric Coronavirus Disease (SECD) Situation Report Mar 5, 2015 Information current as of 12:00 pm MDT, 03/04/2015 This report provides
A Preliminary Severe Winter Storms Climatology for Missouri from
 A Preliminary Severe Winter Storms Climatology for Missouri from 1960-2010 K.L. Crandall and P.S Market University of Missouri Department of Soil, Environmental and Atmospheric Sciences Introduction The
JAN/FEB MAR/APR MAY/JUN
 QF 1.100 (Build 1010) Widget Publishing, Inc Page: 1 Circulation Breakdown by Issue Qualified Non-Paid Qualified Paid Previous This Previous This Total Total issue Removals Additions issue issue Removals
Crop Progress. Corn Mature Selected States [These 18 States planted 92% of the 2017 corn acreage]
![Crop Progress. Corn Mature Selected States [These 18 States planted 92% of the 2017 corn acreage]](/thumbs/89/98128758.jpg "Crop Progress. Corn Mature Selected States [These 18 States planted 92% of the 2017 corn acreage]") Crop Progress ISSN: 00 Released October, 0, by the National Agricultural Statistics Service (NASS), Agricultural Statistics Board, United s Department of Agriculture (USDA). Corn Mature Selected s [These
Crop Progress ISSN: 00 Released October, 0, by the National Agricultural Statistics Service (NASS), Agricultural Statistics Board, United s Department of Agriculture (USDA). Corn Mature Selected s [These
Crop / Weather Update
 Crop / Weather Update Corn Crop Condition Percent of Acreage Rated Good or Excellent 85 80 75 70 65 60 55 50 45 As of September 9, USDA rates the crop at 68% good to excellent. The rating is up one point
Monthly Long Range Weather Commentary Issued: SEPTEMBER 19, 2015 Steven A. Root, CCM, Chief Analytics Officer, Sr. VP, sales
 Monthly Long Range Weather Commentary Issued: SEPTEMBER 19, 2015 Steven A. Root, CCM, Chief Analytics Officer, Sr. VP, sales sroot@weatherbank.com AUGUST 2015 Climate Highlights The Month in Review The
Daily Operations Briefing December 25, 2012 As of 6:30 a.m. EST
 Daily Operations Briefing December 25, 2012 As of 6:30 a.m. EST 1 Significant Activity: Dec 24-25 Significant Events: Possible Severe thunderstorms - Gulf Coast Sandy/Nor easter recovery Significant Weather:
High School World History Cycle 2 Week 2 Lifework
 Name: Advisory: Period: High School World History Cycle 2 Week 2 Lifework This packet is due Monday, November 7 Complete and turn in on Friday for 10 points of EXTRA CREDIT! Lifework Assignment Complete
MINERALS THROUGH GEOGRAPHY. General Standard. Grade level K , resources, and environmen t
 Minerals through Geography 1 STANDARDS MINERALS THROUGH GEOGRAPHY See summary of National Science Education s. Original: http://books.nap.edu/readingroom/books/nses/ Concept General Specific General Specific
2005 Mortgage Broker Regulation Matrix
 2005 Mortgage Broker Regulation Matrix Notes on individual states follow the table REG EXEMPTIONS LIC-EDU LIC-EXP LIC-EXAM LIC-CONT-EDU NET WORTH BOND MAN-LIC MAN-EDU MAN-EXP MAN-EXAM Alabama 1 0 2 0 0
Online Appendix: Can Easing Concealed Carry Deter Crime?
 Online Appendix: Can Easing Concealed Carry Deter Crime? David Fortunato University of California, Merced dfortunato@ucmerced.edu Regulations included in institutional context measure As noted in the main
LABORATORY REPORT. If you have any questions concerning this report, please do not hesitate to call us at (800) or (574)
 or (574)") LABORATORY REPORT If you have any questions concerning this report, please do not hesitate to call us at (800) 332-4345 or (574) 233-4777. This report may not be reproduced, except in full, without written
LABORATORY REPORT If you have any questions concerning this report, please do not hesitate to call us at (800) 332-4345 or (574) 233-4777. This report may not be reproduced, except in full, without written
Insurance Department Resources Report Volume 1
 2014 Insurance Department Resources Report Volume 1 201 Insurance Department Resources Report Volume One 201 The NAIC is the authoritative source for insurance industry information. Our expert solutions
Multivariate Statistics
 Multivariate Statistics Chapter 3: Principal Component Analysis Pedro Galeano Departamento de Estadística Universidad Carlos III de Madrid pedro.galeano@uc3m.es Course 2017/2018 Master in Mathematical
LABORATORY REPORT. If you have any questions concerning this report, please do not hesitate to call us at (800) or (574)
 or (574)") LABORATORY REPORT If you have any questions concerning this report, please do not hesitate to call us at (800) 332-4345 or (574) 233-4777. This report may not be reproduced, except in full, without written
LABORATORY REPORT If you have any questions concerning this report, please do not hesitate to call us at (800) 332-4345 or (574) 233-4777. This report may not be reproduced, except in full, without written
US/Global Natural Catastrophe Update
 US/Global Natural Catastrophe Update NAIC's CIPR Symposium on Implications of Increasing Catastrophe Volatility on Insurers Carl Hedde, SVP, Head of Risk Accumulation Munich Reinsurance America, Inc. Source:
Saturday, June 9, :30 a.m. EDT
 Saturday, June 9, 2018 8:30 a.m. EDT Significant Activity June 8-9 Significant Events: None Tropical Activity: Atlantic No tropical cyclones expected next 48 hours Eastern Pacific Hurricane Aletta; Disturbance
Multivariate Statistics
 Multivariate Statistics Chapter 4: Factor analysis Pedro Galeano Departamento de Estadística Universidad Carlos III de Madrid pedro.galeano@uc3m.es Course 2017/2018 Master in Mathematical Engineering Pedro
Monthly Long Range Weather Commentary Issued: February 15, 2015 Steven A. Root, CCM, President/CEO
 Monthly Long Range Weather Commentary Issued: February 15, 2015 Steven A. Root, CCM, President/CEO sroot@weatherbank.com JANUARY 2015 Climate Highlights The Month in Review During January, the average
Extreme Rainfall in the Southeast U.S.
 Extreme Rainfall in the Southeast U.S. David F. Zierden Florida State Climatologist Center for Ocean Atmospheric Prediction Studies The Florida State University March 7, 2016 Causes of Extreme Rainfall
Monthly Long Range Weather Commentary Issued: May 15, 2014 Steven A. Root, CCM, President/CEO
 Monthly Long Range Weather Commentary Issued: May 15, 2014 Steven A. Root, CCM, President/CEO sroot@weatherbank.com APRIL 2014 REVIEW Climate Highlights The Month in Review The average temperature for
North American Geography. Lesson 2: My Country tis of Thee
 North American Geography Lesson 2: My Country tis of Thee Unit Overview: As students work through the activities in this unit they will be introduced to the United States in general, different regions
Alpine Funds 2017 Tax Guide
 Alpine s 2017 Guide Alpine Dynamic Dividend ADVDX 1/30/17 1/31/17 1/31/17 0.020000000 0.019248130 0.000000000 0.00000000 0.019248130 0.013842273 0.000000000 0.000000000 0.000751870 0.000000000 0.00 0.00
Grand Total Baccalaureate Post-Baccalaureate Masters Doctorate Professional Post-Professional
 s by Location of Permanent Home Address and Degree Level Louisiana Acadia 19 13 0 3 0 3 0 0 0 Allen 5 5 0 0 0 0 0 0 0 Ascension 307 269 2 28 1 6 0 1 0 Assumption 14 12 0 1 0 1 0 0 0 Avoyelles 6 4 0 1 0
Alpine Funds 2016 Tax Guide
 Alpine s 2016 Guide Alpine Dynamic Dividend ADVDX 01/28/2016 01/29/2016 01/29/2016 0.020000000 0.017621842 0.000000000 0.00000000 0.017621842 0.013359130 0.000000000 0.000000000 0.002378158 0.000000000
Daily Operations Briefing. Tuesday, June 27, :30 a.m. EDT
 Daily Operations Briefing Tuesday, June 27, 2017 8:30 a.m. EDT Significant Activity June 26-27 Significant Events: None Tropical Activity: Atlantic Disturbance 1: Low (near 0%) Eastern Pacific Hurricane
Multivariate Statistics
 Multivariate Statistics Chapter 6: Cluster Analysis Pedro Galeano Departamento de Estadística Universidad Carlos III de Madrid pedro.galeano@uc3m.es Course 2017/2018 Master in Mathematical Engineering
C Further Concepts in Statistics
 Appendix C.1 Representing Data and Linear Modeling C1 C Further Concepts in Statistics C.1 Representing Data and Linear Modeling Use stem-and-leaf plots to organize and compare sets of data. Use histograms
Lecture 26 Section 8.4. Mon, Oct 13, 2008
 Lecture 26 Section 8.4 Hampden-Sydney College Mon, Oct 13, 2008 Outline 1 2 3 4 Exercise 8.12, page 528. Suppose that 60% of all students at a large university access course information using the Internet.
Outline. Administrivia and Introduction Course Structure Syllabus Introduction to Data Mining
 Outline Administrivia and Introduction Course Structure Syllabus Introduction to Data Mining Dimensionality Reduction Introduction Principal Components Analysis Singular Value Decomposition Multidimensional
U.S. Outlook For October and Winter Thursday, September 19, 2013
 About This report coincides with today s release of the monthly temperature and precipitation outlooks for the U.S. from the Climate Prediction Center (CPC). U.S. CPC October and Winter Outlook The CPC
2006 Supplemental Tax Information for JennisonDryden and Strategic Partners Funds
 2006 Supplemental Information for JennisonDryden and Strategic Partners s We have compiled the following information to help you prepare your 2006 federal and state tax returns: Percentage of income from
Daily Operations Briefing Friday, November 29, :30 a.m. EST
 Daily Operations Briefing Friday, November 29, 2013 8:30 a.m. EST 1 Significant Activity: Nov 27 29 Significant Events: Winter Storm Eastern US (Final) Tropical Activity: Atlantic Area 1 (Low chance/10%)
Severe Weather: Tornadoes and Hurricanes
 Severe Weather: Tornadoes and Hurricanes Tornadoes Grab Toto!! TORNADOES Are a low pressure storm that usually forms over land in an average year, 800 tornadoes are reported in the U.S. a tornado is defined
OUT-OF-STATE 965 SUBTOTAL OUT-OF-STATE U.S. TERRITORIES FOREIGN COUNTRIES UNKNOWN GRAND TOTAL
 Report ID: USSR8072-V3 Page No. 1 Jurisdiction: ON-CAMPUS IL Southern Illinois University - Carb 1 0 0 0 Black Hawk College Quad-Cities 0 0 1 0 John A Logan College 1 0 0 0 Rend Lake College 1 0 0 0 Aurora
National Wildland Significant Fire Potential Outlook
 National Wildland Significant Fire Potential Outlook National Interagency Fire Center Predictive Services Issued: September, 2007 Wildland Fire Outlook September through December 2007 Significant fire
Daily Operations Briefing Wednesday, March 1, :30 a.m. EST
 Daily Operations Briefing Wednesday, March 1, 2017 8:30 a.m. EST Significant Activity Feb 28-Mar 1 Significant Events: Severe Weather Midwest to East Coast Significant Weather: Severe Thunderstorms Lower
Club Convergence and Clustering of U.S. State-Level CO 2 Emissions
 Methodological Club Convergence and Clustering of U.S. State-Level CO 2 Emissions J. Wesley Burnett Division of Resource Management West Virginia University Wednesday, August 31, 2013 Outline Motivation
Champaign-Urbana 2001 Annual Weather Summary
 Champaign-Urbana 2001 Annual Weather Summary ILLINOIS STATE WATER SURVEY 2204 Griffith Dr. Champaign, IL 61820 wxobsrvr@sws.uiuc.edu Maria Peters, Weather Observer January: After a cold and snowy December,
Sample Statistics 5021 First Midterm Examination with solutions
 THE UNIVERSITY OF MINNESOTA Statistics 5021 February 12, 2003 Sample First Midterm Examination (with solutions) 1. Baseball pitcher Nolan Ryan played in 20 games or more in the 24 seasons from 1968 through
National Organization of Life and Health Insurance Guaranty Associations
 National Organization of and Health Insurance Guaranty Associations November 21, 2005 Dear Chief Executive Officer: Consistent with prior years, NOLHGA is providing the enclosed data regarding insolvency
(Specification B) (JUN F01) (JaN11GEOG101) General Certificate of Education Secondary Education. Physical and Human Geography.
 (JUN F01) (JaN11GEOG101) General Certificate of Education Secondary Education. Physical and Human Geography.") Centre Number Surname Other Names Candidate Signature Candidate Number For Examiner s Use Examiner s Initials Geography (Specification B) Unit 1 General Certificate of Education Secondary Education Advanced
Centre Number Surname Other Names Candidate Signature Candidate Number For Examiner s Use Examiner s Initials Geography (Specification B) Unit 1 General Certificate of Education Secondary Education Advanced
Daily Operations Briefing Wednesday, November 6, :30 a.m. EST
 Daily Operations Briefing Wednesday, November 6, 2013 8:30 a.m. EST 1 Significant Activity: Nov 5 6 Significant Events: None Tropical Activity: Atlantic/Eastern Pacific No tropical cyclone activity expected
Daily Operations Briefing Tuesday, November 5, :30 a.m. EST
 Daily Operations Briefing Tuesday, November 5, 2013 8:30 a.m. EST 1 Significant Activity: Nov 4 5 Significant Events: None Tropical Activity: Atlantic No tropical cyclone activity expected next 48 hours
Analysis of the USDA Annual Report (2015) of Animal Usage by Research Facility. July 4th, 2017
 of Animal Usage by Research Facility. July 4th, 2017") Analysis of the USDA Annual Report (2015) of Animal Usage by Research Facility July 4th, 2017 Author's information: Jorge Sigler, Catherine Perry, Amanda Gray, James Videle For inquiries contact James
Analysis of the USDA Annual Report (2015) of Animal Usage by Research Facility July 4th, 2017 Author's information: Jorge Sigler, Catherine Perry, Amanda Gray, James Videle For inquiries contact James
BlackRock Core Bond Trust (BHK) BlackRock Enhanced International Dividend Trust (BGY) 2 BlackRock Defined Opportunity Credit Trust (BHL) 3
 BlackRock Enhanced International Dividend Trust (BGY) 2 BlackRock Defined Opportunity Credit Trust (BHL) 3") MUNICIPAL FUNDS Arizona (MZA) California Municipal Income Trust (BFZ) California Municipal 08 Term Trust (BJZ) California Quality (MCA) California Quality (MUC) California (MYC) Florida Municipal 00 Term
MUNICIPAL FUNDS Arizona (MZA) California Municipal Income Trust (BFZ) California Municipal 08 Term Trust (BJZ) California Quality (MCA) California Quality (MUC) California (MYC) Florida Municipal 00 Term
Daily Disaster Update Sunday, September 04, 2016
 Daily Disaster Update Information distributed to Disaster Notifications should be shared outside of the American Red Cross for business and mission critical purposes only please be wise when sharing information
SEPTEMBER 2013 REVIEW
 Monthly Long Range Weather Commentary Issued: October 21, 2013 Steven A. Root, CCM, President/CEO sroot@weatherbank.com SEPTEMBER 2013 REVIEW Climate Highlights The Month in Review The average temperature
What Is the Weather Like in Different Regions of the United States?
 Learning Set 1 What Is Weather, and How Is It Measured and Described? 1.3 Explore What Is the Weather Like in Different Regions of the United States? trends: patterns or tendencies you can see over a broad
Forecasting the 2012 Presidential Election from History and the Polls
 Forecasting the 2012 Presidential Election from History and the Polls Drew Linzer Assistant Professor Emory University Department of Political Science Visiting Assistant Professor, 2012-13 Stanford University
Earl E. ~rabhl/ This report is preliminary and has not been reviewed for conformity with U.S. Geological Survey editoral standards GEOLOGICAL SURVEY
 UNITED STATES DEPARTMENT OF THE INTERIOR GEOLOGICAL SURVEY Minimum landslide damage in the United States, 1973-1983 by Earl E. ~rabhl/ Open-File Report 84-486 This report is preliminary and has not been
Grand Total Baccalaureate Post-Baccalaureate Masters Doctorate Professional Post-Professional
 s by Location of Permanent Home Address and Degree Level Louisiana Acadia 26 19 0 6 1 0 0 0 0 Allen 7 7 0 0 0 0 0 0 0 Ascension 275 241 3 23 1 6 0 1 0 Assumption 13 12 0 1 0 0 0 0 0 Avoyelles 15 11 0 3
Daily Operations Briefing Friday, November 15, :30 a.m. EST
 Daily Operations Briefing Friday, November 15, 2013 8:30 a.m. EST 1 Significant Activity: Nov 14 15 Significant Events: Super Typhoon Haiyan (Final) Tropical Activity: Atlantic Pacific Tropical cyclone
Multivariate Analysis
 Multivariate Analysis Chapter 5: Cluster analysis Pedro Galeano Departamento de Estadística Universidad Carlos III de Madrid pedro.galeano@uc3m.es Course 2015/2016 Master in Business Administration and
Location Option Details. 1. Florida
 1. Florida Florida has the smallest number of earthquaes in the United States. Florida is the U.S. location where hurricanes are most frequent. Of the six deadliest hurricanes to hit the continental U.S.,
If you have any questions concerning this report, please feel free to contact me. REPORT OF LABORATORY ANALYSIS
 #=CL# LI USE: FR - JILL LAVOIE LI OBJECT ID: August 22, 2014 Jill Lavoie Merrimack Village District - UCMR3 2 Greens Pond Road Merrimack, NH 03054 RE: Dear Jill Lavoie: Enclosed are the analytical results
Daily Operations Briefing Wednesday, October 16, :30 a.m. EDT
 Daily Operations Briefing Wednesday, October 16, 2013 8:30 a.m. EDT 1 Significant Activity: Oct 15 16 Significant Events: None Tropical Activity: Atlantic Area 1 (10%) Eastern Pacific Tropical Depression
Use your text to define the following term. Use the terms to label the figure below. Define the following term.
 Mapping Our World Section. and Longitude Skim Section of your text. Write three questions that come to mind from reading the headings and the illustration captions.. Responses may include questions about
Chapter 3: Weather Fronts & Storms
 Chapter 3: Weather Fronts & Storms An AIR MASS is a large body of air that has similar characteristics (temperature, humidity) throughout. Air masses can be massively large. Air masses are classified by
Monthly Long Range Weather Commentary Issued: APRIL 25, 2016 Steven A. Root, CCM, Chief Analytics Officer, Sr. VP, sales
 Monthly Long Range Weather Commentary Issued: APRIL 25, 2016 Steven A. Root, CCM, Chief Analytics Officer, Sr. VP, sales sroot@weatherbank.com MARCH 2016 Climate Highlights The Month in Review The March