Expectation Maximization Mixture Models HMMs
|
|
|
- Hortense Shelton
- 5 years ago
- Views:
Transcription
1 Machine Learning for Signal rocessing Expectation Maximization Mixture Models HMMs Class Sep
2 Learning Distributions for Data roblem: Given a collection of examples from some data, estimate its distribution Basic ideas of Maximum Lielihood and MA estimation can be found in Aarti/aris slides ointed to in a previous class Solution: Assign a model to the distribution Learn parameters of model from data Models can be arbitrarily complex Mixture densities, Hierarchical models. Learning must be done using Expectation Maximization Following slides: An intuitive explanation using a simple example of multinomials 2
3 A Thought Experiment A person shoots a loaded dice repeatedly You observe the series of outcomes You can form a good idea of how the dice is loaded Figure out what the probabilities of the various numbers are for dice number = countnumber/sumrolls This is a maximum lielihood estimate Estimate that maes the observed sequence of numbers most probable 3
4 The Multinomial Distribution A probability distribution over a discrete collection of items is a Multinomial i l : belongs to a discrete set E.g. the roll of dice : in 1,2,3,4,5,6 Or the toss of a coin : in head, tails 4

5 Maximum Lielihood Estimation n 2 n 4 n 1 n 5 n n3 6 p p 6 p 3 1 p p 4 p 2 p 2 p5 p 1 p 3 p4 p 5 p 6 Basic principle: Assign a form to the distribution E.g. a multinomial Or a Gaussian Find the distribution that best fits the histogram of the data 5
6 Defining Best Fit The data are generated by draws from the distribution I.e. the generating process draws from the distribution Assumption: The distribution tion has a high probability of generating the observed data Not necessarily true Select the distribution that has the highest probability bilit of generating the data Should assign lower probability to less frequent observations and vice versa 6
7 Maximum Lielihood Estimation: Multinomial robability of generating n 1, n 2, n 3, n 4, n 5, n 6 n, n, n, n, n, n Const n p i i i Find p 1,p 2,p 3,p 4,p 5,p 6 so that the above is maximized Alternately maximize log n1, n2, n3, n4, n5, n6 log Const n i logp i i Log is a monotonic function argmax x fx = argmax x logfx Solving for the probabilities gives us i Requires constrained optimization to ensure probabilities sum to 1 p j ni n j EVENTUALLY ITS JUST COUNTING! 7


8 Segue: Gaussians 0.5 exp 2 1, ; 1 N T d arameters of a Gaussian: Mean, Covariance, 11755/ Sep
9 Maximum Lielihood: Gaussian Given a collection of observations 1, 2,, estimate mean and covariance 1 T 1 1, 2,... exp 0.5 i i d i 2 T 1 log,,... C 0.5 log i 1 2 i i Maximizing w.r.t and gives us 1 1 T ITS STILL i i i N N i i JUST COUNTING! 9
10 Laplacian x b x L x exp 1 ; arameters: Mean, scale b b > 0 b b b x L x exp 2, ; 11755/ Sep
11 Maximum Lielihood: Laplacian Given a collection of observations x 1, x 2,, estimate mean and scale b x i x, x,... C N log b log 1 2 i b Maximizing w.r.t and b gives us 1 N 1 x x i N i b i i 11


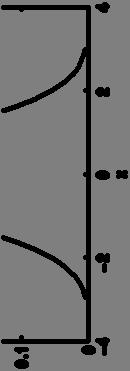
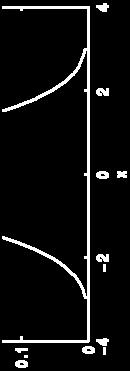
12 Dirichlet from wiipedia K=3. K Clocwise from top left: α=6, 2, 2, 3, 7, 5, 6, 2, 6, 2, 3, 4 arameters are s log of the density as we change α from α=0.3, 0.3, 0.3 to 2.0, 2.0, 2.0, eeping all the individual αi's equal to each other. Determine mode and curvature Defined only of probability vectors D ; = [x 1 x 2.. x K ], i x i = 1, x i >= 0 for all i i i i i 12 i x i 1 i
13 Maximum Lielihood: Dirichlet Given a collection of observations 1, 2,, estimate 1, 2,... i 1 log j i N log i N log i j i i i log, No closed form solution for s. Needs gradient ascent Several distributions have this property: p the ML estimate of their parameters have no closed form solution 13
14 Continuing the Thought Experiment Two persons shoot loaded dice repeatedly The dice are differently loaded for the two of them We observe the series of outcomes for both persons How to determine the probability distributions of the two dice? 14
15 Estimating robabilities Observation: The sequence of numbers from the two dice As indicated by the colors, we now who rolled what number
16 Estimating robabilities Observation: The sequence of numbers from the two dice As indicated by the colors, we now who rolled what number Segregation: Separate the blue observations from the red Collection of blue numbers Collection of red numbers 16
17 Estimating robabilities Observation: The sequence of numbers from the two dice As indicated by the colors, we now who rolled what number Segregation: Separate the blue observations from the red From each set compute probabilities for each of the possible outcomes number no.of times number was rolled total number of observed rolls
18 A Thought Experiment Now imagine that you cannot observe the dice yourself Instead there is a caller who randomly calls out the outcomes 40% of the time he calls out the number from the left shooter, and 60% of the time, the one from the right and you now this At any time, you do not now which h of the two he is calling out How do you determine the probability distributions for the two dice? 18
19 A Thought Experiment How do you now determine the probability distributions for the two sets of dice.. If you do not even now what fraction of time the blue numbers are called, and what fraction are red? 19
20 A Mixture Multinomial The caller will call out a number in any given callout IF He selects RED, and the Red die rolls the number OR He selects BLUE and the Blue die rolls the number = Red Red +Blue Blue E.g. 6 = Red6 Red + Blue6 Blue A distribution that combines or mixes multiple multinomials is a mixture multinomial Z Z Z Mixture weights Component multinomials 20
21 Mixture Distributions Mixture Gaussian Z Z Z N ;, Z Z z z Mixture weights Component distributions Mixture of Gaussians and Laplacians Z N ; z, z Z L i; z, bz, Z Mixture distributions mix several component distributions Component distributions may be of varied type Mixing weights must sum to 1.0 Component distributions integrate to 1.0 Mixture distribution integrates to 1.0 Z i i 21
22 Maximum Lielihood Estimation For our problem: Z = color of dice n1, n2, n3, n4, n5, n6 Const Z Z Z n Const Maximum lielihood solution: Maximize log n1, n2, n3, n4, n5, n6 log Const Z Z Z n log Z Z Z No closed form solution summation inside log! In general ML estimates for mixtures do not have a closed form USE EM! 22 n
23 Expectation Maximization It is possible to estimate all parameters in this setup using the Expectation Maximization or EM algorithm First described in a landmar paper by Dempster, Laird and Rubin Maximum Lielihood Estimation from incomplete data, via the EM Algorithm, Journal of the Royal Statistical Society, Series B, 1977 Much wor on the algorithm since then The principles behind the algorithm existed for several years prior to the landmar paper, however. 23
24 Expectation Maximization Iterative solution Get some initial estimates for all parameters Dice shooter example: This includes probability distributions for dice AND the probability with which the caller selects the dice Two steps that are iterated: Expectation Step: Estimate statistically, the values of unseen variables Maximization Step: Using the estimated values of the unseen variables as truth, estimates of the model parameters 24
25 EM: The auxiliary function EM iteratively optimizes the following auxiliary function Q, = Z Z, logz, Z are the unseen variables Assuming Z is discrete may not be are the parameter estimates from the previous iteration are the estimates to be obtained in the current iteration 25
26 Expectation Maximization as counting Instance from blue dice Instance from red dice Dice unnown Collection of blue Collection of red Collection of blue Collection of red numbers numbers numbers numbers Collection of blue Collection of red numbers numbers Hidden variable: Z Dice: The identity of the dice whose number has been called out If we new Z for every observation, we could estimate all terms By adding the observation to the right bin Unfortunately, we do not now Z it is hidden from us! Solution: FRAGMENT THE OBSERVATION 26
27 Fragmenting the Observation EM is an iterative algorithm At each time there is a current estimate of parameters The size of the fragments is proportional to the a posteriori probability of the component distributions The a posteriori probabilities of the various values of Z are computed using Bayes rule: Z Z Z C Z Z Every dice gets a fragment of size dice number 27
28 Expectation Maximization Hypothetical Dice Shooter Example: We obtain an initial estimate for the probability distribution of the two sets of dice somehow: blu ue We obtain an initial estimate for the probability with which the caller calls out the two shooters somehow red Z 28
29 Expectation Maximization Hypothetical Dice Shooter Example: Initial estimate: t blue = red = blue = 0.1, for 4 red = 0.05 Caller has just called out 4 osterior probability of colors: red 4 C 4 Z red Z red C C0.025 blue 4 C 4 Z blue Z blue C C0.05 Normalizing : red ; blue
30 Expectation Maximization
31 Expectation Maximization Every observed roll of the dice contributes to both Red and Blue
32 Expectation Maximization Every observed roll of the dice contributes to both Red and Blue
33 Expectation Maximization Every observed roll of the dice contributes to both Red and Blue , ,
34 Expectation Maximization Every observed roll of the dice contributes to both Red and Blue , , 6 0.2, , , , 34
35 Expectation Maximization Every observed roll of the dice contributes to both Red and Blue , , , , , , , , , , , , , , 6 0.8, , , , , , , , , , , , , , , , , 6 0.2, , ,
36 Expectation Maximization Every observed roll of the dice contributes to both Red and Blue Total count for Red is the sum of all the posterior probabilities in the red column 7.31 Total count for Blue is the sum of all the posterior probabilities in the blue column Note: = 18 = the total number of instances Called red blue
37 Expectation Maximization Total count for Red : 7.31 Red: Total count for 1: 1.71 Called red blue
38 Expectation Maximization Total count for Red : 7.31 Red: Total count for 1: 1.71 Total count for 2: 0.56 Called red blue
39 Expectation Maximization Total count for Red : 7.31 Red: Total count for 1: 1.71 Total count for 2: 0.56 Total count for 3: 0.66 Called red blue
40 Expectation Maximization Total count for Red : 7.31 Red: Total count for 1: 1.71 Total count for 2: 0.56 Total count for 3: 0.66 Called red blue Total count for 4:
41 Expectation Maximization Total count for Red : 7.31 Red: Total count for 1: 1.71 Total count for 2: 0.56 Total count for 3: 0.66 Total count for 4: 1.32 Total count for 5: 0.66 Called red blue
42 Expectation Maximization Total count for Red : 7.31 Red: Total count for 1: 1.71 Total count for 2: 0.56 Total count for 3: 0.66 Total count for 4: 1.32 Total count for 5: 0.66 Total count for 6: 2.4 Called red blue
43 Expectation Maximization Total count for Red : 7.31 Red: Updated probability of Red dice: Called red blue Total count for 1: 1.71 Total count for 2: 0.56 Total count for 3: 0.66 Total count for 4: 1.32 Total count for 5: 0.66 Total count for 6: Red = 1.71/7.31 = Red = 0.56/7.31 = Red = 0.66/7.31 = Red = 1.32/7.31 = Red = 0.66/7.31 = Red = 2.40/7.31 =
44 Expectation Maximization Total count for Blue : Blue: Total count for 1: 1.29 Called red blue
45 Expectation Maximization Total count for Blue : Blue: Total count for 1: 1.29 Total count for 2: 3.44 Called red blue
46 Expectation Maximization Total count for Blue : Blue: Total count for 1: 1.29 Total count for 2: 3.44 Total count for 3: 1.34 Called red blue
47 Expectation Maximization Total count for Blue : Blue: Total count for 1: 1.29 Total count for 2: 3.44 Total count for 3: 1.34 Called red blue Total count for 4:
48 Expectation Maximization Total count for Blue : Blue: Total count for 1: 1.29 Total count for 2: 3.44 Total count for 3: 1.34 Total count for 4: 2.68 Total count for 5: 1.34 Called red blue
49 Expectation Maximization Total count for Blue : Blue: Total count for 1: 1.29 Total count for 2: 3.44 Total count for 3: 1.34 Total count for 4: 2.68 Total count for 5: 1.34 Total count for 6: 0.6 Called red blue
50 Expectation Maximization Total count for Blue : Blue: Total count for 1: 1.29 Total count for 2: 3.44 Total count for 3: 1.34 Total count for 4: 2.68 Total count for 5: 1.34 Total count for 6: 0.6 Called red blue Updated probability of Blue dice: 1 Blue = 1.29/11.69 = Blue = 0.56/11.69 = Blue = 0.66/11.69 = Blue = 1.32/11.69 = Blue = 0.66/11.69 = Blue = 2.40/11.69 =
51 Expectation Maximization Total count for Red : 7.31 Total count for Blue : Total instances = 18 Note = 18 We also revise our estimate for the probability that the caller calls out Red or Blue i.e the fraction of times that t he calls Red and the fraction of times he calls Blue Called red blue Z=Red = 7.31/18 = 0.41 Z=Blue = 10.69/18 =
52 The updated values robability of Red dice: Called red blue 1 Red = 1.71/7.31 = Red = 0.56/7.31 = Red = 0.66/7.31 = Red = 1.32/7.31 = Red = 0.66/7.31 = Red = 2.40/7.31 = robability of Blue dice: Blue = 1.29/11.69 = Blue = 0.56/11.69 = Blue = 0.66/11.69 = Blue = 1.32/11.69 = Blue = 0.66/11.69 = Blue = 2.40/11.69 = Z=Red = 7.31/18 = 0.41 Z=Blue = 10.69/18 = 0.59 THE UDATED VALUES CAN BE USED TO REEAT THE ROCESS. ESTIMATION IS AN ITERATIVE ROCESS 52
53 The Dice Shooter Example Initialize Z, Z 2. Estimate Z for each Z, for each called out number Associate with each value of Z, with weight Z 3. Re-estimate Z for every value of and Z 4. Re-estimate estimate Z 5. If not converged, return to 2 53
54 In Squiggles Given a sequence of observations O 1, O 2,.. N is the number of observations of number N is the number of observations of number Initialize Z, Z for dice Z and numbers Iterate: Iterate: For each number : ' ' Z Z Z Z Z Update: ' Z O O Z N Z N O Z Z Z that such ' Z N Z N Z 11755/18797 O Z N O Z ' Z Z N 21 Sep
55 Solutions may not be unique The EM algorithm will give us one of many solutions, all equally valid! The probability of 6 being called out: 6 6 red 6 blue r b Assigns r as the probability of 6 for the red die Assigns b as the probability of 6 for the blue die The following too is a valid solution [FI] 0. anything r b 0 Assigns 1.0 as the a priori probability of the red die Assigns 0.0 as the probability of the blue die The solution is NOT unique 55

56 A More Complex Model T d N 0.5 exp 2, ; 1 Gaussian mixtures are often good models for d 2 the distribution of multivariate data roblem: Estimating the parameters, given a collection of data 11755/ Sep
57 Gaussian Mixtures: Generating model N ;, The caller now has two Gaussians At each draw he randomly selects a Gaussian, by the mixture weight distribution He then draws an observation from that t Gaussian Much lie the dice problem only the outcomes are now real numbers and can be anything 57
58 Estimating GMM with complete information Observation: A collection of numbers drawn from a mixture of 2 Gaussians As indicated by the colors, we now which Gaussian generated what number Segregation: Separate the blue observations from the red From each set compute parameters for that t Gaussian red 1 N red ired i red 1 N red i red i red ired T red N N red 58
59 Fragmenting the observation Gaussian unnown Collection of blue Collection of red numbers numbers The identity of the Gaussian is not nown! Solution: Fragment the observation Fragment size proportional to a posteriori probability ' ' ' ' N ;, ' N ;, ' ' 59
60 Expectation Maximization Initialize, and for both Gaussians Important how we do this Typical solution: Initialize means randomly, as the global covariance of the data and uniformly Compute fragment sizes for each Gaussian, for each observation Number red blue N ;, ' N ;, ' ' ' 60
61 Expectation Maximization Each observation contributes only as much as its fragment size to each statistic Meanred = 6.1* * * * * * * *0.05 / = / 4.08 = 4.18 Varred = * * * * Number red blue * * * *0.05 / red
62 EM for Gaussian Mixtures 1. Initialize, and for all Gaussians 2 For each observation compute a posteriori 2. For each observation compute a posteriori probabilities for all Gaussian ; N ' ' ', ; ', ; N N 3. Update mixture weights, means and variances for all Gaussians 2 N 4. If not converged, return to 2 21 Sep /18797


63 EM estimation of Gaussian Mixtures An Example Histogram of 4000 instances of a randomly generated data Individual parameters of a two-gaussian mixture estimated by EM Two-Gaussian mixture estimated by EM 63
64 Expectation Maximization The same principle can be extended to mixtures of other distributions. E.g. Mixture of Laplacians: Laplacian parameters become x x x x x x x b x x x 1 1 In a mixture of Gaussians and Laplacians, Gaussians use the x x Gaussian update rules, Laplacians use the Laplacian rule 11755/ Sep
65 Expectation Maximization The EM algorithm is used whenever proper statistical analysis of a phenomenon requires the nowledge of a hidden or missing variable or a set of hidden/missing variables The hidden variable is often called a latent variable Some examples: Estimating mixtures of distributions Only data are observed. The individual distributions and mixing proportions must both be learnt. Estimating the distribution of data, when some attributes are missing Estimating the dynamics of a system, based only on observations that may be a complex function of system state 65
66 Solve this problem: Caller rolls a dice and flips a coin He calls out the number rolled if the coin shows head Otherwise he calls the number+1 Determine pheads and pnumber for the dice from a collection of ouputs Caller rolls two dice He calls out the sum Determine dice from a collection of ouputs 66
67 The dice and the coin Heads or tail? 4 Heads count 4 3 Tails count Unnown: Whether it was head or tails 67
68 The two dice 4 3,1, 1,3 2,2 Unnown: How to partition the number Count blue 3 += 3,1 4 Count blue 2 += 2,2 4 Count blue 1 += 1,3 4 68
69 Fragmentation can be hierarchical Z Z, Z 1 2 Z 1 Z 2 Z 3 Z 4 E.g. mixture of mixtures Fragments are further fragmented.. Wor this out 69
70 More later Will see a couple of other instances of the use of fem Wor out HMM training Assume state output distributions are multinomials Assume they are Gaussian Assume Gaussian mixtures 70
Machine Learning for Signal Processing Expectation Maximization Mixture Models. Bhiksha Raj 27 Oct /
 Machine Learning for Signal rocessing Expectation Maximization Mixture Models Bhiksha Raj 27 Oct 2016 11755/18797 1 Learning Distributions for Data roblem: Given a collection of examples from some data,
Introduction to Machine Learning. Maximum Likelihood and Bayesian Inference. Lecturers: Eran Halperin, Lior Wolf
 1 Introduction to Machine Learning Maximum Likelihood and Bayesian Inference Lecturers: Eran Halperin, Lior Wolf 2014-15 We know that X ~ B(n,p), but we do not know p. We get a random sample from X, a
Review of probabilities
 CS 1675 Introduction to Machine Learning Lecture 5 Density estimation Milos Hauskrecht milos@pitt.edu 5329 Sennott Square Review of probabilities 1 robability theory Studies and describes random processes
Expectation Maximization Mixture Models HMMs
 -755 Machne Learnng for Sgnal Processng Mture Models HMMs Class 9. 2 Sep 200 Learnng Dstrbutons for Data Problem: Gven a collecton of eamples from some data, estmate ts dstrbuton Basc deas of Mamum Lelhood
Lecture 4: Probabilistic Learning. Estimation Theory. Classification with Probability Distributions
 DD2431 Autumn, 2014 1 2 3 Classification with Probability Distributions Estimation Theory Classification in the last lecture we assumed we new: P(y) Prior P(x y) Lielihood x2 x features y {ω 1,..., ω K
Machine Learning. Gaussian Mixture Models. Zhiyao Duan & Bryan Pardo, Machine Learning: EECS 349 Fall
 Machine Learning Gaussian Mixture Models Zhiyao Duan & Bryan Pardo, Machine Learning: EECS 349 Fall 2012 1 The Generative Model POV We think of the data as being generated from some process. We assume
Latent Variable Models and EM algorithm
 Latent Variable Models and EM algorithm SC4/SM4 Data Mining and Machine Learning, Hilary Term 2017 Dino Sejdinovic 3.1 Clustering and Mixture Modelling K-means and hierarchical clustering are non-probabilistic
Introduction to Machine Learning. Maximum Likelihood and Bayesian Inference. Lecturers: Eran Halperin, Yishay Mansour, Lior Wolf
 1 Introduction to Machine Learning Maximum Likelihood and Bayesian Inference Lecturers: Eran Halperin, Yishay Mansour, Lior Wolf 2013-14 We know that X ~ B(n,p), but we do not know p. We get a random sample
PATTERN RECOGNITION AND MACHINE LEARNING CHAPTER 2: PROBABILITY DISTRIBUTIONS
 PATTERN RECOGNITION AND MACHINE LEARNING CHAPTER 2: PROBABILITY DISTRIBUTIONS Parametric Distributions Basic building blocks: Need to determine given Representation: or? Recall Curve Fitting Binary Variables
Language as a Stochastic Process
 CS769 Spring 2010 Advanced Natural Language Processing Language as a Stochastic Process Lecturer: Xiaojin Zhu jerryzhu@cs.wisc.edu 1 Basic Statistics for NLP Pick an arbitrary letter x at random from any
Bayesian Models in Machine Learning
 Bayesian Models in Machine Learning Lukáš Burget Escuela de Ciencias Informáticas 2017 Buenos Aires, July 24-29 2017 Frequentist vs. Bayesian Frequentist point of view: Probability is the frequency of
Bayesian Learning (II)
") Universität Potsdam Institut für Informatik Lehrstuhl Maschinelles Lernen Bayesian Learning (II) Niels Landwehr Overview Probabilities, expected values, variance Basic concepts of Bayesian learning MAP
Universität Potsdam Institut für Informatik Lehrstuhl Maschinelles Lernen Bayesian Learning (II) Niels Landwehr Overview Probabilities, expected values, variance Basic concepts of Bayesian learning MAP
A Brief Review of Probability, Bayesian Statistics, and Information Theory
 A Brief Review of Probability, Bayesian Statistics, and Information Theory Brendan Frey Electrical and Computer Engineering University of Toronto frey@psi.toronto.edu http://www.psi.toronto.edu A system
Parametric Unsupervised Learning Expectation Maximization (EM) Lecture 20.a
 Lecture 20.a") Parametric Unsupervised Learning Expectation Maximization (EM) Lecture 20.a Some slides are due to Christopher Bishop Limitations of K-means Hard assignments of data points to clusters small shift of a
Parametric Unsupervised Learning Expectation Maximization (EM) Lecture 20.a Some slides are due to Christopher Bishop Limitations of K-means Hard assignments of data points to clusters small shift of a
6.867 Machine Learning
 6.867 Machine Learning Problem set 1 Due Thursday, September 19, in class What and how to turn in? Turn in short written answers to the questions explicitly stated, and when requested to explain or prove.
MAT Mathematics in Today's World
 MAT 1000 Mathematics in Today's World Last Time We discussed the four rules that govern probabilities: 1. Probabilities are numbers between 0 and 1 2. The probability an event does not occur is 1 minus
Performance Comparison of K-Means and Expectation Maximization with Gaussian Mixture Models for Clustering EE6540 Final Project
 Performance Comparison of K-Means and Expectation Maximization with Gaussian Mixture Models for Clustering EE6540 Final Project Devin Cornell & Sushruth Sastry May 2015 1 Abstract In this article, we explore
6.867 Machine Learning
 6.867 Machine Learning Problem set 1 Solutions Thursday, September 19 What and how to turn in? Turn in short written answers to the questions explicitly stated, and when requested to explain or prove.
Maximum Likelihood (ML), Expectation Maximization (EM) Pieter Abbeel UC Berkeley EECS
, Expectation Maximization (EM) Pieter Abbeel UC Berkeley EECS") Maximum Likelihood (ML), Expectation Maximization (EM) Pieter Abbeel UC Berkeley EECS Many slides adapted from Thrun, Burgard and Fox, Probabilistic Robotics Outline Maximum likelihood (ML) Priors, and
Maximum Likelihood (ML), Expectation Maximization (EM) Pieter Abbeel UC Berkeley EECS Many slides adapted from Thrun, Burgard and Fox, Probabilistic Robotics Outline Maximum likelihood (ML) Priors, and
10-701/15-781, Machine Learning: Homework 4
 10-701/15-781, Machine Learning: Homewor 4 Aarti Singh Carnegie Mellon University ˆ The assignment is due at 10:30 am beginning of class on Mon, Nov 15, 2010. ˆ Separate you answers into five parts, one
Expectation Maximisation (EM) CS 486/686: Introduction to Artificial Intelligence University of Waterloo
 CS 486/686: Introduction to Artificial Intelligence University of Waterloo") Expectation Maximisation (EM) CS 486/686: Introduction to Artificial Intelligence University of Waterloo 1 Incomplete Data So far we have seen problems where - Values of all attributes are known - Learning
Expectation Maximisation (EM) CS 486/686: Introduction to Artificial Intelligence University of Waterloo 1 Incomplete Data So far we have seen problems where - Values of all attributes are known - Learning
1 EM algorithm: updating the mixing proportions {π k } ik are the posterior probabilities at the qth iteration of EM.
 Université du Sud Toulon - Var Master Informatique Probabilistic Learning and Data Analysis TD: Model-based clustering by Faicel CHAMROUKHI Solution The aim of this practical wor is to show how the Classification
Estimating Gaussian Mixture Densities with EM A Tutorial
 Estimating Gaussian Mixture Densities with EM A Tutorial Carlo Tomasi Due University Expectation Maximization (EM) [4, 3, 6] is a numerical algorithm for the maximization of functions of several variables
Gaussian Mixture Models
 Gaussian Mixture Models Pradeep Ravikumar Co-instructor: Manuela Veloso Machine Learning 10-701 Some slides courtesy of Eric Xing, Carlos Guestrin (One) bad case for K- means Clusters may overlap Some
Machine Learning for Data Science (CS4786) Lecture 12
 Lecture 12") Machine Learning for Data Science (CS4786) Lecture 12 Gaussian Mixture Models Course Webpage : http://www.cs.cornell.edu/courses/cs4786/2016fa/ Back to K-means Single link is sensitive to outliners We
Machine Learning for Data Science (CS4786) Lecture 12 Gaussian Mixture Models Course Webpage : http://www.cs.cornell.edu/courses/cs4786/2016fa/ Back to K-means Single link is sensitive to outliners We
Mixture Models & EM. Nicholas Ruozzi University of Texas at Dallas. based on the slides of Vibhav Gogate
 Mixture Models & EM icholas Ruozzi University of Texas at Dallas based on the slides of Vibhav Gogate Previously We looed at -means and hierarchical clustering as mechanisms for unsupervised learning -means
Machine Learning for Signal Processing Bayes Classification and Regression
 Machine Learning for Signal Processing Bayes Classification and Regression Instructor: Bhiksha Raj 11755/18797 1 Recap: KNN A very effective and simple way of performing classification Simple model: For
Mixture Models & EM. Nicholas Ruozzi University of Texas at Dallas. based on the slides of Vibhav Gogate
 Mixture Models & EM icholas Ruozzi University of Texas at Dallas based on the slides of Vibhav Gogate Previously We looed at -means and hierarchical clustering as mechanisms for unsupervised learning -means
Gaussian Mixture Models, Expectation Maximization
 Gaussian Mixture Models, Expectation Maximization Instructor: Jessica Wu Harvey Mudd College The instructor gratefully acknowledges Andrew Ng (Stanford), Andrew Moore (CMU), Eric Eaton (UPenn), David Kauchak
Probabilistic modeling. The slides are closely adapted from Subhransu Maji s slides
 Probabilistic modeling The slides are closely adapted from Subhransu Maji s slides Overview So far the models and algorithms you have learned about are relatively disconnected Probabilistic modeling framework
Latent Dirichlet Allocation (LDA)
") Latent Dirichlet Allocation (LDA) D. Blei, A. Ng, and M. Jordan. Journal of Machine Learning Research, 3:993-1022, January 2003. Following slides borrowed ant then heavily modified from: Jonathan Huang
Latent Dirichlet Allocation (LDA) D. Blei, A. Ng, and M. Jordan. Journal of Machine Learning Research, 3:993-1022, January 2003. Following slides borrowed ant then heavily modified from: Jonathan Huang
Machine Learning for Signal Processing Bayes Classification
 Machine Learning for Signal Processing Bayes Classification Class 16. 24 Oct 2017 Instructor: Bhiksha Raj - Abelino Jimenez 11755/18797 1 Recap: KNN A very effective and simple way of performing classification
{ p if x = 1 1 p if x = 0
 Discrete random variables Probability mass function Given a discrete random variable X taking values in X = {v 1,..., v m }, its probability mass function P : X [0, 1] is defined as: P (v i ) = Pr[X =
Statistical Pattern Recognition
 Statistical Pattern Recognition Expectation Maximization (EM) and Mixture Models Hamid R. Rabiee Jafar Muhammadi, Mohammad J. Hosseini Spring 2014 http://ce.sharif.edu/courses/92-93/2/ce725-2 Agenda Expectation-maximization
Weighted Finite-State Transducers in Computational Biology
 Weighted Finite-State Transducers in Computational Biology Mehryar Mohri Courant Institute of Mathematical Sciences mohri@cims.nyu.edu Joint work with Corinna Cortes (Google Research). 1 This Tutorial
Naïve Bayes Introduction to Machine Learning. Matt Gormley Lecture 3 September 14, Readings: Mitchell Ch Murphy Ch.
 School of Computer Science 10-701 Introduction to Machine Learning aïve Bayes Readings: Mitchell Ch. 6.1 6.10 Murphy Ch. 3 Matt Gormley Lecture 3 September 14, 2016 1 Homewor 1: due 9/26/16 Project Proposal:
Clustering by Mixture Models. General background on clustering Example method: k-means Mixture model based clustering Model estimation
 Clustering by Mixture Models General bacground on clustering Example method: -means Mixture model based clustering Model estimation 1 Clustering A basic tool in data mining/pattern recognition: Divide
Naïve Bayes classification
 Naïve Bayes classification 1 Probability theory Random variable: a variable whose possible values are numerical outcomes of a random phenomenon. Examples: A person s height, the outcome of a coin toss
Clustering K-means. Clustering images. Machine Learning CSE546 Carlos Guestrin University of Washington. November 4, 2014.
 Clustering K-means Machine Learning CSE546 Carlos Guestrin University of Washington November 4, 2014 1 Clustering images Set of Images [Goldberger et al.] 2 1 K-means Randomly initialize k centers µ (0)
Probability theory basics
 Probability theory basics Michael Franke Basics of probability theory: axiomatic definition, interpretation, joint distributions, marginalization, conditional probability & Bayes rule. Random variables:
Clustering with k-means and Gaussian mixture distributions
 Clustering with k-means and Gaussian mixture distributions Machine Learning and Object Recognition 2017-2018 Jakob Verbeek Clustering Finding a group structure in the data Data in one cluster similar to
Lecture 10. Announcement. Mixture Models II. Topics of This Lecture. This Lecture: Advanced Machine Learning. Recap: GMMs as Latent Variable Models
 Advanced Machine Learning Lecture 10 Mixture Models II 30.11.2015 Bastian Leibe RWTH Aachen http://www.vision.rwth-aachen.de/ Announcement Exercise sheet 2 online Sampling Rejection Sampling Importance
But if z is conditioned on, we need to model it:
 Partially Unobserved Variables Lecture 8: Unsupervised Learning & EM Algorithm Sam Roweis October 28, 2003 Certain variables q in our models may be unobserved, either at training time or at test time or
Clustering with k-means and Gaussian mixture distributions
 Clustering with k-means and Gaussian mixture distributions Machine Learning and Category Representation 2014-2015 Jakob Verbeek, ovember 21, 2014 Course website: http://lear.inrialpes.fr/~verbeek/mlcr.14.15
Bayesian Methods for Machine Learning
 Bayesian Methods for Machine Learning CS 584: Big Data Analytics Material adapted from Radford Neal s tutorial (http://ftp.cs.utoronto.ca/pub/radford/bayes-tut.pdf), Zoubin Ghahramni (http://hunch.net/~coms-4771/zoubin_ghahramani_bayesian_learning.pdf),
ECE521 week 3: 23/26 January 2017
 ECE521 week 3: 23/26 January 2017 Outline Probabilistic interpretation of linear regression - Maximum likelihood estimation (MLE) - Maximum a posteriori (MAP) estimation Bias-variance trade-off Linear
A Gentle Tutorial of the EM Algorithm and its Application to Parameter Estimation for Gaussian Mixture and Hidden Markov Models
 A Gentle Tutorial of the EM Algorithm and its Application to Parameter Estimation for Gaussian Mixture and Hidden Markov Models Jeff A. Bilmes (bilmes@cs.berkeley.edu) International Computer Science Institute
Machine Learning Lecture Notes
 Machine Learning Lecture Notes Predrag Radivojac January 25, 205 Basic Principles of Parameter Estimation In probabilistic modeling, we are typically presented with a set of observations and the objective
COMS 4721: Machine Learning for Data Science Lecture 16, 3/28/2017
 COMS 4721: Machine Learning for Data Science Lecture 16, 3/28/2017 Prof. John Paisley Department of Electrical Engineering & Data Science Institute Columbia University SOFT CLUSTERING VS HARD CLUSTERING
Naïve Bayes classification. p ij 11/15/16. Probability theory. Probability theory. Probability theory. X P (X = x i )=1 i. Marginal Probability
=1 i. Marginal Probability") Probability theory Naïve Bayes classification Random variable: a variable whose possible values are numerical outcomes of a random phenomenon. s: A person s height, the outcome of a coin toss Distinguish
Probability theory Naïve Bayes classification Random variable: a variable whose possible values are numerical outcomes of a random phenomenon. s: A person s height, the outcome of a coin toss Distinguish
Expectation-Maximization (EM) algorithm
 algorithm") I529: Machine Learning in Bioinformatics (Spring 2017) Expectation-Maximization (EM) algorithm Yuzhen Ye School of Informatics and Computing Indiana University, Bloomington Spring 2017 Contents Introduce
I529: Machine Learning in Bioinformatics (Spring 2017) Expectation-Maximization (EM) algorithm Yuzhen Ye School of Informatics and Computing Indiana University, Bloomington Spring 2017 Contents Introduce
Lecture 4: Probabilistic Learning
 DD2431 Autumn, 2015 1 Maximum Likelihood Methods Maximum A Posteriori Methods Bayesian methods 2 Classification vs Clustering Heuristic Example: K-means Expectation Maximization 3 Maximum Likelihood Methods
Outline. Binomial, Multinomial, Normal, Beta, Dirichlet. Posterior mean, MAP, credible interval, posterior distribution
 Outline A short review on Bayesian analysis. Binomial, Multinomial, Normal, Beta, Dirichlet Posterior mean, MAP, credible interval, posterior distribution Gibbs sampling Revisit the Gaussian mixture model
Brief Introduction of Machine Learning Techniques for Content Analysis
 1 Brief Introduction of Machine Learning Techniques for Content Analysis Wei-Ta Chu 2008/11/20 Outline 2 Overview Gaussian Mixture Model (GMM) Hidden Markov Model (HMM) Support Vector Machine (SVM) Overview
Mixtures of Gaussians. Sargur Srihari
 Mixtures of Gaussians Sargur srihari@cedar.buffalo.edu 1 9. Mixture Models and EM 0. Mixture Models Overview 1. K-Means Clustering 2. Mixtures of Gaussians 3. An Alternative View of EM 4. The EM Algorithm
MACHINE LEARNING INTRODUCTION: STRING CLASSIFICATION
 MACHINE LEARNING INTRODUCTION: STRING CLASSIFICATION THOMAS MAILUND Machine learning means different things to different people, and there is no general agreed upon core set of algorithms that must be
Study Notes on the Latent Dirichlet Allocation
 Study Notes on the Latent Dirichlet Allocation Xugang Ye 1. Model Framework A word is an element of dictionary {1,,}. A document is represented by a sequence of words: =(,, ), {1,,}. A corpus is a collection
CS Lecture 18. Expectation Maximization
 CS 6347 Lecture 18 Expectation Maximization Unobserved Variables Latent or hidden variables in the model are never observed We may or may not be interested in their values, but their existence is crucial
Speech Recognition Lecture 8: Expectation-Maximization Algorithm, Hidden Markov Models.
 Speech Recognition Lecture 8: Expectation-Maximization Algorithm, Hidden Markov Models. Mehryar Mohri Courant Institute and Google Research mohri@cims.nyu.com This Lecture Expectation-Maximization (EM)
Bayesian Learning. HT2015: SC4 Statistical Data Mining and Machine Learning. Maximum Likelihood Principle. The Bayesian Learning Framework
 HT5: SC4 Statistical Data Mining and Machine Learning Dino Sejdinovic Department of Statistics Oxford http://www.stats.ox.ac.uk/~sejdinov/sdmml.html Maximum Likelihood Principle A generative model for
Discrete Mathematics and Probability Theory Spring 2016 Rao and Walrand Note 14
 CS 70 Discrete Mathematics and Probability Theory Spring 2016 Rao and Walrand Note 14 Introduction One of the key properties of coin flips is independence: if you flip a fair coin ten times and get ten
CSCI-567: Machine Learning (Spring 2019)
") CSCI-567: Machine Learning (Spring 2019) Prof. Victor Adamchik U of Southern California Mar. 19, 2019 March 19, 2019 1 / 43 Administration March 19, 2019 2 / 43 Administration TA3 is due this week March
CSCI-567: Machine Learning (Spring 2019) Prof. Victor Adamchik U of Southern California Mar. 19, 2019 March 19, 2019 1 / 43 Administration March 19, 2019 2 / 43 Administration TA3 is due this week March
BAYESIAN DECISION THEORY
 Last updated: September 17, 2012 BAYESIAN DECISION THEORY Problems 2 The following problems from the textbook are relevant: 2.1 2.9, 2.11, 2.17 For this week, please at least solve Problem 2.3. We will
Algorithmisches Lernen/Machine Learning
 Algorithmisches Lernen/Machine Learning Part 1: Stefan Wermter Introduction Connectionist Learning (e.g. Neural Networks) Decision-Trees, Genetic Algorithms Part 2: Norman Hendrich Support-Vector Machines
Linear Models for Regression CS534
 Linear Models for Regression CS534 Example Regression Problems Predict housing price based on House size, lot size, Location, # of rooms Predict stock price based on Price history of the past month Predict
Chapter 3: Maximum-Likelihood & Bayesian Parameter Estimation (part 1)
") HW 1 due today Parameter Estimation Biometrics CSE 190 Lecture 7 Today s lecture was on the blackboard. These slides are an alternative presentation of the material. CSE190, Winter10 CSE190, Winter10 Chapter
HW 1 due today Parameter Estimation Biometrics CSE 190 Lecture 7 Today s lecture was on the blackboard. These slides are an alternative presentation of the material. CSE190, Winter10 CSE190, Winter10 Chapter
MIXTURE MODELS AND EM
 Last updated: November 6, 212 MIXTURE MODELS AND EM Credits 2 Some of these slides were sourced and/or modified from: Christopher Bishop, Microsoft UK Simon Prince, University College London Sergios Theodoridis,
Intermediate Math Circles November 8, 2017 Probability II
 Intersection of Events and Independence Consider two groups of pairs of events Intermediate Math Circles November 8, 017 Probability II Group 1 (Dependent Events) A = {a sales associate has training} B
Probability Theory for Machine Learning. Chris Cremer September 2015
 Probability Theory for Machine Learning Chris Cremer September 2015 Outline Motivation Probability Definitions and Rules Probability Distributions MLE for Gaussian Parameter Estimation MLE and Least Squares
Series 6, May 14th, 2018 (EM Algorithm and Semi-Supervised Learning)
") Exercises Introduction to Machine Learning SS 2018 Series 6, May 14th, 2018 (EM Algorithm and Semi-Supervised Learning) LAS Group, Institute for Machine Learning Dept of Computer Science, ETH Zürich Prof
Exercises Introduction to Machine Learning SS 2018 Series 6, May 14th, 2018 (EM Algorithm and Semi-Supervised Learning) LAS Group, Institute for Machine Learning Dept of Computer Science, ETH Zürich Prof
Latent Variable View of EM. Sargur Srihari
 Latent Variable View of EM Sargur srihari@cedar.buffalo.edu 1 Examples of latent variables 1. Mixture Model Joint distribution is p(x,z) We don t have values for z 2. Hidden Markov Model A single time
Lecture 8: Graphical models for Text
 Lecture 8: Graphical models for Text 4F13: Machine Learning Joaquin Quiñonero-Candela and Carl Edward Rasmussen Department of Engineering University of Cambridge http://mlg.eng.cam.ac.uk/teaching/4f13/
Fundamentals. CS 281A: Statistical Learning Theory. Yangqing Jia. August, Based on tutorial slides by Lester Mackey and Ariel Kleiner
 Fundamentals CS 281A: Statistical Learning Theory Yangqing Jia Based on tutorial slides by Lester Mackey and Ariel Kleiner August, 2011 Outline 1 Probability 2 Statistics 3 Linear Algebra 4 Optimization
CS229 Machine Learning Project: Allocating funds to the right people
 CS229 Machine Learning Project: Allocating funds to the right people Introduction Dugalic, Adem adugalic@stanford.edu Nguyen, Tram tram@stanford.edu Our project is motivated by a common issue in developing
Introduction to Probability for Graphical Models
 Introduction to Probability for Grahical Models CSC 4 Kaustav Kundu Thursday January 4, 06 *Most slides based on Kevin Swersky s slides, Inmar Givoni s slides, Danny Tarlow s slides, Jaser Snoek s slides,
Clustering and Gaussian Mixture Models
 Clustering and Gaussian Mixture Models Piyush Rai IIT Kanpur Probabilistic Machine Learning (CS772A) Jan 25, 2016 Probabilistic Machine Learning (CS772A) Clustering and Gaussian Mixture Models 1 Recap
CSC321 Lecture 18: Learning Probabilistic Models
 CSC321 Lecture 18: Learning Probabilistic Models Roger Grosse Roger Grosse CSC321 Lecture 18: Learning Probabilistic Models 1 / 25 Overview So far in this course: mainly supervised learning Language modeling
Chapter 08: Direct Maximum Likelihood/MAP Estimation and Incomplete Data Problems
 LEARNING AND INFERENCE IN GRAPHICAL MODELS Chapter 08: Direct Maximum Likelihood/MAP Estimation and Incomplete Data Problems Dr. Martin Lauer University of Freiburg Machine Learning Lab Karlsruhe Institute
Bayesian Approach 2. CSC412 Probabilistic Learning & Reasoning
 CSC412 Probabilistic Learning & Reasoning Lecture 12: Bayesian Parameter Estimation February 27, 2006 Sam Roweis Bayesian Approach 2 The Bayesian programme (after Rev. Thomas Bayes) treats all unnown quantities
Week 3: The EM algorithm
 Week 3: The EM algorithm Maneesh Sahani maneesh@gatsby.ucl.ac.uk Gatsby Computational Neuroscience Unit University College London Term 1, Autumn 2005 Mixtures of Gaussians Data: Y = {y 1... y N } Latent
A brief review of basics of probabilities
 brief review of basics of probabilities Milos Hauskrecht milos@pitt.edu 5329 Sennott Square robability theory Studies and describes random processes and their outcomes Random processes may result in multiple
Discrete Mathematics and Probability Theory Fall 2015 Lecture 21
 CS 70 Discrete Mathematics and Probability Theory Fall 205 Lecture 2 Inference In this note we revisit the problem of inference: Given some data or observations from the world, what can we infer about
Expectation Maximization (EM)
") Expectation Maximization (EM) The EM algorithm is used to train models involving latent variables using training data in which the latent variables are not observed (unlabeled data). This is to be contrasted
Expectation Maximization (EM) The EM algorithm is used to train models involving latent variables using training data in which the latent variables are not observed (unlabeled data). This is to be contrasted
Universität Potsdam Institut für Informatik Lehrstuhl Maschinelles Lernen. Bayesian Learning. Tobias Scheffer, Niels Landwehr
 Universität Potsdam Institut für Informatik Lehrstuhl Maschinelles Lernen Bayesian Learning Tobias Scheffer, Niels Landwehr Remember: Normal Distribution Distribution over x. Density function with parameters
Mixture Models and EM
 Mixture Models and EM Goal: Introduction to probabilistic mixture models and the expectationmaximization (EM) algorithm. Motivation: simultaneous fitting of multiple model instances unsupervised clustering
Pattern Recognition. Parameter Estimation of Probability Density Functions
 Pattern Recognition Parameter Estimation of Probability Density Functions Classification Problem (Review) The classification problem is to assign an arbitrary feature vector x F to one of c classes. The
Hidden Markov Models Part 2: Algorithms
 Hidden Markov Models Part 2: Algorithms CSE 6363 Machine Learning Vassilis Athitsos Computer Science and Engineering Department University of Texas at Arlington 1 Hidden Markov Model An HMM consists of:
COMP90051 Statistical Machine Learning
 COMP90051 Statistical Machine Learning Semester 2, 2017 Lecturer: Trevor Cohn 2. Statistical Schools Adapted from slides by Ben Rubinstein Statistical Schools of Thought Remainder of lecture is to provide
Clustering K-means. Machine Learning CSE546. Sham Kakade University of Washington. November 15, Review: PCA Start: unsupervised learning
 Clustering K-means Machine Learning CSE546 Sham Kakade University of Washington November 15, 2016 1 Announcements: Project Milestones due date passed. HW3 due on Monday It ll be collaborative HW2 grades
The Expectation-Maximization Algorithm
 The Expectation-Maximization Algorithm Francisco S. Melo In these notes, we provide a brief overview of the formal aspects concerning -means, EM and their relation. We closely follow the presentation in
Topic Models. Charles Elkan November 20, 2008
 Topic Models Charles Elan elan@cs.ucsd.edu November 20, 2008 Suppose that we have a collection of documents, and we want to find an organization for these, i.e. we want to do unsupervised learning. One
Notes on Machine Learning for and
 Notes on Machine Learning for 16.410 and 16.413 (Notes adapted from Tom Mitchell and Andrew Moore.) Choosing Hypotheses Generally want the most probable hypothesis given the training data Maximum a posteriori
Expectation Maximization
 Expectation Maximization Aaron C. Courville Université de Montréal Note: Material for the slides is taken directly from a presentation prepared by Christopher M. Bishop Learning in DAGs Two things could
Likelihood, MLE & EM for Gaussian Mixture Clustering. Nick Duffield Texas A&M University
 Likelihood, MLE & EM for Gaussian Mixture Clustering Nick Duffield Texas A&M University Probability vs. Likelihood Probability: predict unknown outcomes based on known parameters: P(x q) Likelihood: estimate
Statistical learning. Chapter 20, Sections 1 4 1
 Statistical learning Chapter 20, Sections 1 4 Chapter 20, Sections 1 4 1 Outline Bayesian learning Maximum a posteriori and maximum likelihood learning Bayes net learning ML parameter learning with complete
The Expectation Maximization or EM algorithm
 The Expectation Maximization or EM algorithm Carl Edward Rasmussen November 15th, 2017 Carl Edward Rasmussen The EM algorithm November 15th, 2017 1 / 11 Contents notation, objective the lower bound functional,
Lecture 10: Probability distributions TUESDAY, FEBRUARY 19, 2019
 Lecture 10: Probability distributions DANIEL WELLER TUESDAY, FEBRUARY 19, 2019 Agenda What is probability? (again) Describing probabilities (distributions) Understanding probabilities (expectation) Partial
Pattern Recognition and Machine Learning. Bishop Chapter 2: Probability Distributions
 Pattern Recognition and Machine Learning Chapter 2: Probability Distributions Cécile Amblard Alex Kläser Jakob Verbeek October 11, 27 Probability Distributions: General Density Estimation: given a finite
Probability Background
 CS76 Spring 0 Advanced Machine Learning robability Background Lecturer: Xiaojin Zhu jerryzhu@cs.wisc.edu robability Meure A sample space Ω is the set of all possible outcomes. Elements ω Ω are called sample
STA 414/2104: Machine Learning
 STA 414/2104: Machine Learning Russ Salakhutdinov Department of Computer Science! Department of Statistics! rsalakhu@cs.toronto.edu! http://www.cs.toronto.edu/~rsalakhu/ Lecture 9 Sequential Data So far