Effect of Aluminum Nano-Particles on Microrelief and Dielectric Properties of PE+TlInSe2 Composite Materials
|
|
|
- Janice Robinson
- 5 years ago
- Views:
Transcription

. http://creativecommons.org/licenses/by/4.")
1 Open Journal of Inorganic Non-Metallic Materials, 2015, 5, Published Online January 2015 in SciRes. Effect of Aluminum Nano-Particles on Microrelief and Dielectric Properties of PE+TlInSe2 Composite Materials E. M. Gojayev *, Kh. R. Ahmadova, S. I. Safarova, G. S. Djafarova, Sh. M. Mextiyeva Azerbaijan Technical University, Baku, Azerbaijan * geldar-04@mail.ru Received 21 October 2014; revised 20 November 2014; accepted 19 December 2014 Copyright 2015 by authors and Scientific Research Publishing Inc. This work is licensed under the Creative Commons Attribution International License (CC BY). Abstract The paper presents the results of studies surface microrelief, frequency-temperature characteristics of the imaginary part of the dielectric permittivity and dielectric loss of PE+TlInSe 2 composite materials in 25 C C temperature and 25 Hz - 1 MHz frequency range before and after application of the aluminum nano-particles with a size of 50 nm. The change in the amount of semiconductor filler TlInSe2 and aluminum nano-particles changes the state of the surface and the frequency-temperature characteristics of composite materials PE+xvol.%TlInSe 2<Al>, which allows to obtain composites with the desired dielectric permittivity and dielectric loss. Keywords Surface Microrelief, Aluminum Nano-Particles, Dielectric Permeability, Tangent of the Angle Dielectric Loss 1. Introduction Study of the dielectric properties of polymers over a wide temperature and frequency ranges is one of the most effective ways to establish the characteristics of their structure. However, the response of the polymer system to the action of the electric field of a certain frequency is not equivalent to the mechanical response. Therefore, the method of dielectric loss can be used to identify softening of polymers. The maximum of dielectric loss may differ quite significantly from the temperature of the structural vitrification, as well as the frequency (at a given temperature corresponding to the maximum) may be different from the frequency of the mechanical vitrification. That mismatch of relaxation transitions corresponding to electrical or mechanical effects on the temperature or * Corresponding author. How to cite this paper: Gojayev, E.M., Ahmadova, Kh.R., Safarova, S.I., Djafarova, G.S. and Mextiyeva, Sh.M. (2015) Effect of Aluminum Nano-Particles on Microrelief and Dielectric Properties of PE+TlInSe 2 Composite Materials. Open Journal of Inorganic Non-Metallic Materials, 5,
2 frequency scale provides additional information about the levels of structural organization of the polymers. Taking the above mentioned into consideration, this article studied the surface microrelief using atomic force microscope and the temperature and frequency dependences of PE+TlInSe 2 and PE+TlInSe 2 compositions with aluminum nano-particles. 2. Techniques of Experiment In scanning, the probe microscope study of surface microrelief and its local properties is carried out with the help of specially prepared probes in the form of needles. The dimension of the working part of such probes is about 10 nm. The typical distance between the probe and the sample surface in probe microscopes is equal nm. Operation of the probe microscopes based on different types of interaction of the probe with the surface [1]. The process of scanning of the surface in scanning probe microscope is similar to the motion of the electron beam across the screen in the TV cathode-ray tube. Probe moves along the line first in the forward direction and then in the opposite one, then moves to the next line. The movement of the probe is carried out using a scanner in small steps under the effect of saw-tooth voltage, generated by digital to analog converters. Registration of the information about surface is carried out, as a rule, on direct pass under two conditions: in the process of scanning probe must touch points on the surface and in each case only one of its points. And if the scanning probe cannot reach some areas of the surface (e.g., when the samples have the highest portions of the relief), the relief only partially is restored. And the greater the number of points touching the probe, the more reliable is possible to reconstruct the surface. The test samples were prepared as follows: a polymer powder is mixed with a powder of a semiconductor material TlİnSe2 and aluminum nano-particles. After that, the mixture placed between aluminum foil sheets is compressed into 100-μm-thick films at the melting temperature of the polymer matrix and a press sure of 15 MPa. The prepared samples with the foil are quenched in water, and the foil is removed. The obtained samples are useful for studying the properties of electrets. Research conducted at the facility described in [2]. Composites with additives investigated x = 0, 1, 3, 5, 7, 10 wt% and y = 3; 5; 7; 10 wt%. To calculate the dielectric permittivity of the sample thickness and diameter of the upper electrode (for determining an area) is measured automatically using calipers. For this purpose, the sample is placed between two flat electrodes of circular shape. Capacitance and dielectric loss tangent are measured at the same time [3]. The dielectric permittivity of the compositions is calculated from the measured capacitance values, the thickness of the sample and the area of the electrodes. The dielectric permittivity ε is calculated according to the formula Cd ε =, ε S where C measured electrical capacitance of the sample, F; ε 0 = F/m; d diameter of the sample, m; S area of the sample, m 2. Dielectric loss tangent tgδ is measured directly. Thus, for each of the selected dielectrics must be measured capacitance and dielectric loss tangent corresponding to 1 Hz frequency. The sample is mounted between two electrodes in the measuring cell. Then it is heated in a cell (the heater is mounted in the cover) with a constant rate of 2 K/min. The sample temperature is recorded using a thermocouple and the dielectric losses with the help of the measuring bridge LCK E7-8 heating at a constant rate achieved by three-lat-system. 3. Results and Discussion As a result, we have obtained planar surface image for PE+xvol.%TlInSe 2 composites of size nm (Figure 1 and Figure 1), respectively. From Figure 1, Figure 1, which shows 3D (threedimensional) images of the same sections it is seen that the surface relief (topography) of the compositions varies with the volume amount of the filling nano-particles [4]-[6]. Analysis of AFM images histograms (Figure 2 and Figure 2) shows that the uniformity of the surface varies up to 25 nm. It is seen that in the boundary layer of the compositions yet is observed some rough edges. Rather, they are connected with the fact that the destruction of the binding forces leaves on the surface not individual atoms but their groups-clusters. This is also evidenced from Fourier spectrum obtained by AFM method 0 12


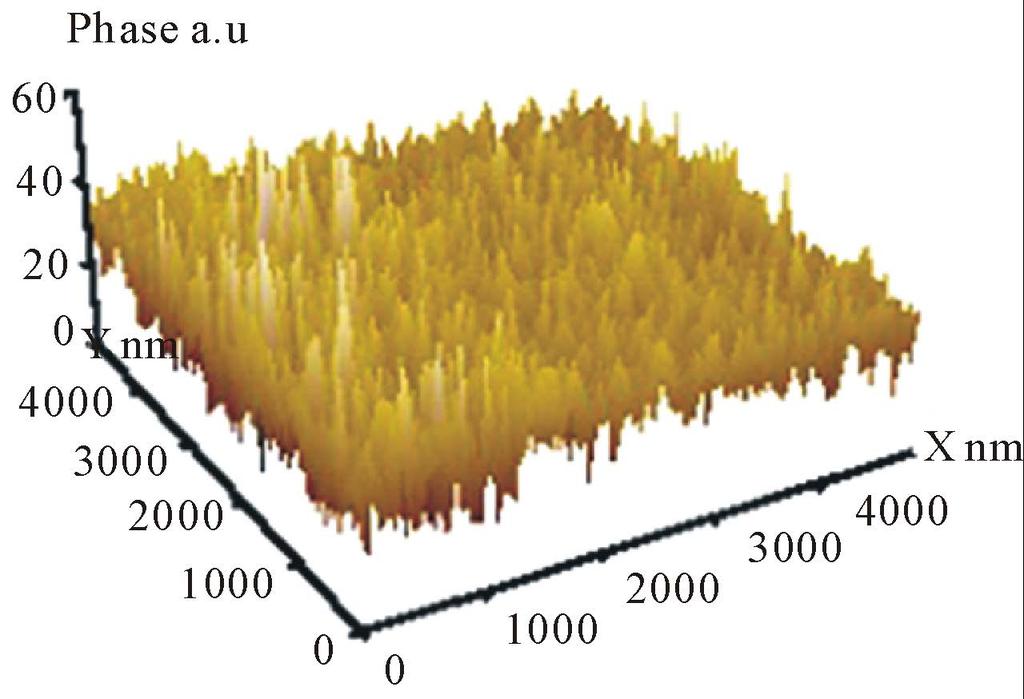
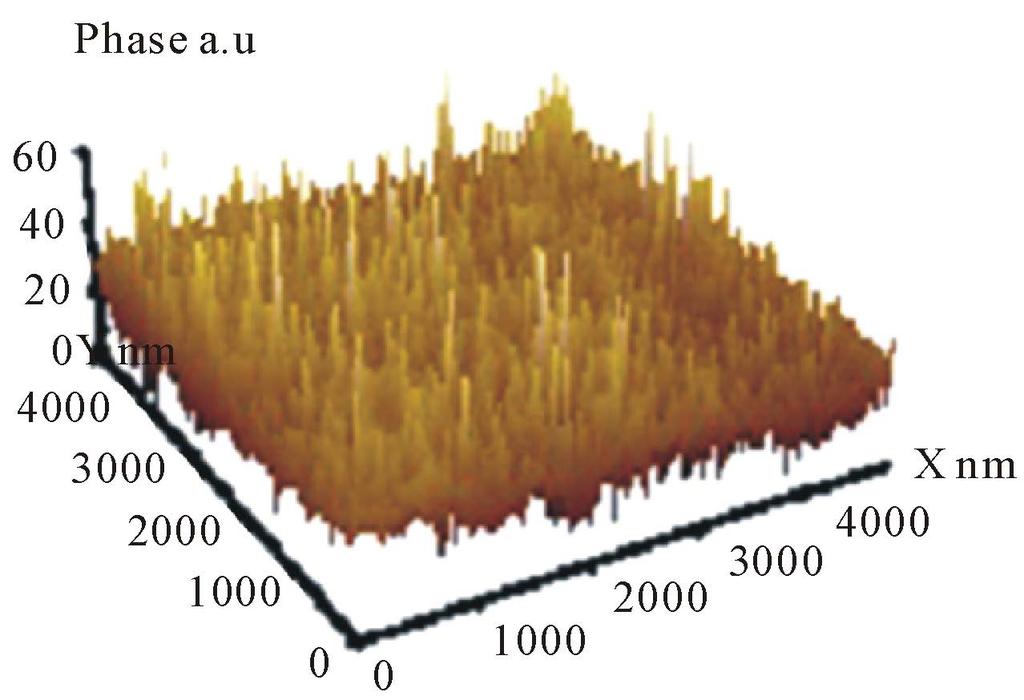
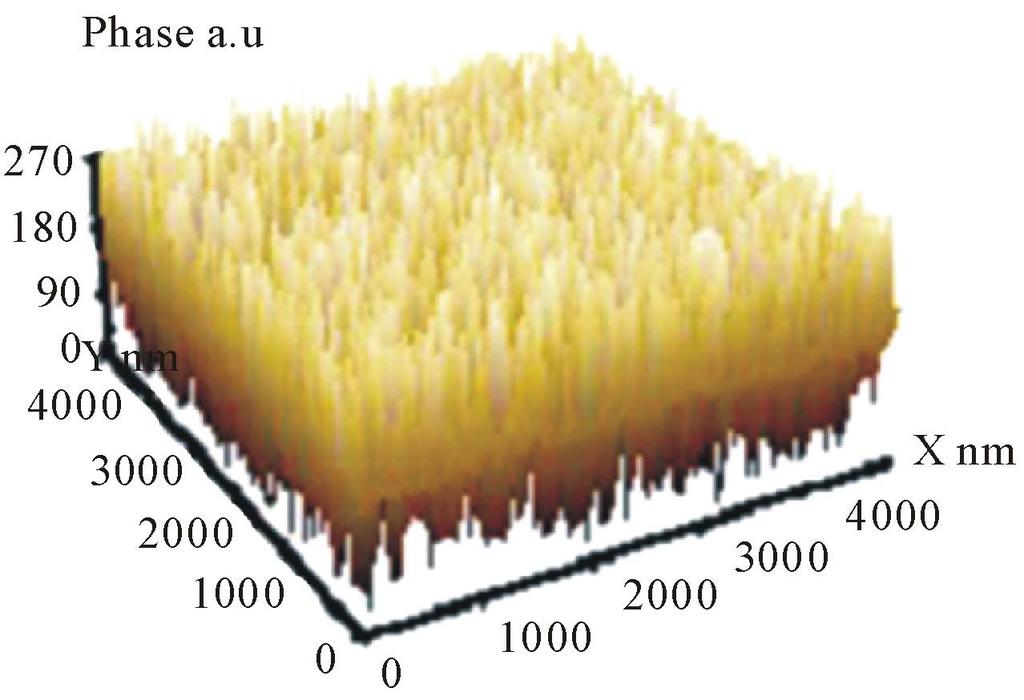
3 PE+3vl.%TlInSe 2 PE+5vol.%TlInSe 2 PE+3vol.%TlInSe 2+7vl.%Al PE+5vol.%TlInSe 2+5vl.%Al PE+3vl.%TlInSe 2 PE+5vol.%TlInSe 2 PE+3vol.%TlInSe 2+7vl.%Al Figure 1. Planar and 3D images of the surface of composites. PE+5vol.%TlInSe 2+5vl.%Al 13
.")


4 PE+3vl.%TlInSe 2 PE+5vol.%TlInSe 2 PE+3vol.%TlInSe 2+7vl.%Al Figure 2. Surface histogram composites. PE+5vol.%TlInSe 2+5vl.%Al (Figure 3 and Figure 3). The concentration of the spectrum in the center of the image shows that the surface particles have approximately the same dimensions, i.e. are commensurable. Results of the study of frequency-temperature dependences of the imaginary part of the dielectric permittivity and dielectric loss tangent of the compositions PE+xvol.%TlInSe 2 (1 x 10) are shown in Figures 4-7. Figure 4 shows the dependence of the imaginary part of the dielectric permittivity with temperature in the range of 20 C C for composites PE+xvol.%TlInSe 2 (1 x 10). As follows from Figure 4, the imaginary part of the dielectric permittivity increases with temperature in 14
 is not significantly different.")
 shows that at low additive content imaginary part of the dielectric permittivity remains substantially constant.")


5 PE+3vl.%TlInSe 2 PE+5vol.%TlInSe 2 PE+3vol.%TlInSe 2+7vl.%Al Figure 3. Fourier spectrum of the surface of the composites. PE+5vol.%TlInSe 2+5vl.%Al PE+xvol.%TlInSe 2 composite materials with an increase in the additive from 1 to 5 vol.%. In general, for investigated composites the variation ε''(t) is not significantly different. However, for the composite PE+5vol.% TlInSe 2 at a temperature 600 C a mild maximum is revealed. Dependence ε''(t) shows that at low additive content imaginary part of the dielectric permittivity remains substantially constant. And when the amount of additives in TlInSe 2 increases up to 5 vol.%, increase in ε''(t) and the further reduction with increasing of the temperature occurs. Changes in the imaginary part of the dielectric permittivity with temperature for this composite are substantially different. Firstly, at 25 C, imaginary part of the dielectric permittivity increases by three times. İn 60 C C temperature range, relatively moderate reduction occurs. Further, from 100 C to 125 C sharp decrease in the imaginary part of the dielectric constant takes place. In this temperature range, the imaginary part of the dielectric permittivity reduces by 3.5 times. Subsequently up to 150 C moderate decrease of ε'' occurs. 15
6 Results of the study of the temperature dependence of the dielectric loss tangent of composite materials PE+xvol.%TlInSe 2 (1 x 10) are shown in Figure 4. As can be seen from Figure 4, a change of tgδ with temperature for composites with x = 1; 3 in the temperature range investigated does not practically occur. For PE+5vol.%TlInSe 2 composite tgδ at low temperatures is relatively high, but with increasing temperature decreases to a stable value (0.0076). For the composite with x = 10 in 250 C C temperature range a slight increase in tgδ, in the range of 100 C C sharp decrease from to , and further a slight decrease occurs. We investigated the frequency and temperature dependence of composite materials PE+xvol.%TlInSe 2 <Al> with aluminum nano-particles. The results are shown in Figure 5 and Figure 5. As can be seen from Figure 5, in the investigated temperature range of 250 C C the imaginary part of the dielectric permittivity increases with increasing content of additives TlInSe 2. But a change in the nature of overall identical for the three composites, where (x = 3, 5, 7), respectively with the addition of the aluminum nano-particles in an amount of y = 7; 5; 3. Similarly occur changes of ε''(t) for the composite PE+10vol.%TlInSe 2 +10vl.%Al. However, note that in the entire temperature range ε''(t) in magnitude greater than in other composites. In the temperature range of 850 C C is observed a significant increase, and further moderate decrease in ε''(t). We investigated the frequency dependence of the imaginary part of the dielectric permittivity and dielectric loss tangent of composites in the frequency range 25 Hz - 1 MHz. As can be seen from Figure 6, change of the imaginary part of the dielectric permittivity against the frequency for composites with x = 3; 5; 10 are of the same nature. Is typical of all three composites in the range of 100 khz - 1 MHz relatively high decrease, slow decrease up to 1 khz, and then an inversion of the imaginary parts of the permittivity occurs. At 200 Hz a deep minimum is observed and further an increase of the imaginary part of the permittivity occurs. Nature of the change of the imaginary part of the dielectric permittivity of the composite with the addition of x = 1 vol.% before detecting an inversion has identical character. However, at frequencies of 500 Hz, 100 Hz deep minima, and between them at 200 Hz pronounced peak is observed. The dielectric loss tangent for the above mentioned composites with the addition of TlInSe 2 have been investigated. As can be seen from Figure 6, a plot tgδ(ν) is identical with the character of ε''(ν). For composites with x = 3; 5; 10 is revealed a single deep minimum at a frequency of 200 Hz and a sign inversion of tgδ at the frequency of 1 khz; for the composite with x = 1 also a sign inversion for tgδ at the same frequency, deep minima at frequencies of 100 and 500 Hz and clear maximum at a frequency of 200 Hz is detected. Results of the study of the imaginary part of the dielectric permittivity and dielectric loss of composites PE+xvol.%TlInSe 2 <Al> with aluminum nano-particles are shown in Figure 7 and Figure 7. Figure 4. Temperature dependence of the imaginary part of dielectric permittivity and tgδ composite materials PE+xvol.%TlInSe 2, where 1) PE+1vol.%TlInSe 2, 2) PE+3vol.%TlInSe 2, 3) PE+5vol.%TlInSe 2, 4) PE+10vol.%TlInSe 2. 16
7 Figure 5. Temperature dependence of the imaginary part of dielectric permittivity and tgδ composite materials PE+xvol.%TlInSe 2 <Al>, where 1) PE+3vol.%TlInSe 2 +7vl.%Al, 2) PE+5vol.%TlInSe 2 +5vl.%Al, 3) PE+7vol.%TlInSe 2 + 3vl.%Al, 4) PE+10vol.%TlInSe 2 +10vl.%Al. Figure 6. The frequency dependence of the imaginary part of dielectric permittivity and tgδ for composite materials PE+xvol.%TlInSe 2, where 1) PE+1vol.%TlInSe 2, 2) PE+10vol.%TlInSe 2, 3) PE+5vol.%TlInSe 2, 4) PE+3vol.%TlInSe 2. Figure 7. Frequency dependence of the imaginary part of dielectric permittivity and tgδ composite materials PE+xvol.%TlInSe 2 <Al>, where 1) PE+5vol.%TlInSe 2 +5%Al, 2) PE+3vol.%TlInSe 2 +7%Al, 3) PE+7vol.%TlInSe 2 +3%Al, 4) PE+10vol.%TlInSe 2 10%Al. 17
8 As can be seen from Figure 7, for these composite materials at high frequencies there is a slight change in ε''. Inversion of the sign occurs at a frequency of 1 khz, a deep minimum at a frequency of 500 Hz and a pronounced maximum at a frequency of 200 Hz. Figure 7 shows the results of a study of dielectric loss of composites with aluminum nano-particles depending on the frequency. Studies were carried out in the same frequency range. The results shown in Figure 7 imply that at the frequency of 800 Hz inversion of tgδ sign and at a frequency of 500 Hz deep minima, and at 200 Hz bright maximum is observed. In general, the change in the imaginary part of the dielectric permittivity and dielectric loss frequency change occurs in a similar manner. In a further increase in TlInSe 2 filler content to 10 vol% in the range 25 C C ε'' value increases for 6 times. In the range 100 C C ε'' decreases approximately four times and thereafter remains unchanged. For the investigated composites regular increase of ε'' with increasing filler content is observed. Also the frequency dependence of ε'' has been investigated. The studies were conducted in the frequency range of 25 Hz - 1 MHz. Results of the study are shown in Figure 4. As follows from figure, character of changes for ε'' depending on the frequency is the same for compositions with x = 3; 5 and 10. With an increase in frequency from 25 Hz to 200 Hz is revealed the deep minima, in the range of 200 Hz - 1 khz sharp increase ε''. Further increase in frequency up to 1 MHz leads to increase in ε''. ε''(ν) for PE+1vol.% composite significantly different. At frequencies of 100 Hz and 500 Hz are observed deep minima, and between them at a frequency of 200 Hz bright maximum. In the frequency range of 500 Hz - 1 MHz character of change of ε'' is not different from other composites. Analysis of the experimental results of the temperature dependence of dielectric permittivity of PE+xvol.% TlInSe 2 and PE+xvol.%TlInSe 2 <Al> composites shows that in general, variation ε''(t) in these materials are same. However, with increasing amounts of filler (Figure 4) increasing ε'' values is observed. This behavior of the dielectric permittivity of the composite with semiconductor filler is largely determined by the Maxwell- Wagner polarization. The surface energy of the composite structure components becomes unstable and TlInSe 2 particles form clusters, the surface of which is less than the sum of the surface of their constituent particles. Increasing the number of clusters with increasing bulk filler content is accompanied by decrease in the dielectric layer between the particles. It leads to increase in electric capacity and accordingly ε''. In the composites obtained with the addition of aluminum nano-particles with size of 50 nm, the character of the dielectric permittivity variation does not change. However, with increasing of Al content in the composite the value of ε'' decreases throughout the temperature range studied. This is probably due to the fact that the aluminum nano-particles occupy vacancies-defects on the surface of the composites. This promotes the change in the electric resistance and the imaginary part of the dielectric permittivity. Using aluminum nano-particles allows obtaining composites having the desired dielectric permittivity and dielectric loss. Analysis of the frequency dependence of the dielectric permittivity and dielectric loss of PE+xvol.%TlInSe 2 composites and the same composite with aluminum nano-particles show that ε'' and tgδ significantly reduced. At introduction in the composites aluminum nano-particles isolated clusters is formed alongside with the semiconductor particles. Aluminum nano-particles conductive clusters randomly distributed in the PE matrix. Increasing Al content in the composite leads to an increase in the number of nano-particles per cross section of the composite, which is equivalent to the proportion of Al in the total thickness of the composite sample. Closed each other through-thickness sample clusters can be considered as active resistance connected between the electrodes. Since they have high compared with PE+ xvol.%tlinse 2 composites conductivity, it can be assumed that the resistance of the composite will be mainly determined by contacts between Al nano-particles. At the boundaries of clusters in the alternating electric field an accumulation and redistribution of free charges occurs, which changes the initial internal electric field. It is known that at low frequencies, internal electric fields are distributed accordingly conductivity and high frequencies respectively the dielectric permittivity. Therefore, the decrease ε'' and tgδ with increasing content of aluminum nano-particles can be explained by the appearance of a relatively strong internal field in semiconductors and nano-clusters. 4. Conclusion In conclusion, we study the materials at high frequencies and reveal that, the imaginary part of the permittivity is negative. In these frequencies, electronic and ionic polarization is in the main role. These materials have found 18
9 application in the creation of new electronic devices. References [1] Mironov, V. (2004) Fundamentals of the Scanning Probe Microscopy. Technosphere, Moscow, [2] Gojaev, E.M., Maharramov, A.M., Zeynalov, S.H.A., Osmanova, S.S. and Allakhyarov, E.A. (2010) Crown Electrets Based on High Density Polyethylene Composites with Semiconductor Filler TlGaSe 2. Electronic Materials Processing, No. 6, 266. [3] Zhigaeva, I.A. and Nikolaev, V.E. (2012) Study Based on Fluoropolymer Coronoelectrets-32L by Thermally Stimulated Relaxation of the Surface Potential. Education and Science Minister Modern Trends in Chemistry and Technology of Polymeric Materials. International Conference Abstracts St.-Petersburg, [4] Mamedov, G.A., Godzhaev, E.M. and Magerramov, A.M. (2011) Study of Surface Topography by Atomic Force and Dielectric Properties of Compositions of High-Density Polyethylene with an Additive TlGaSe 2. Electronic Materials Processing, 47, [5] Gojayev, E.M., Safarova, S.S., Kafarova, D.M. Gulmammadov, K.D. and Ahmedova, J.R. (2013) Study of Surface Microrelief and Dielectric Properties of the Compositions of PP+TlIn 0, 98Ce 0, 02Se 2. Electronic Materials Processing, 49, [6] Godzhaev, E.M., Magerramov, A.M., Zeinalov, Sh.A., Osmanova, S.S. and Allakhyarov, E.A. (2011) Coronoelectrets Based on Composites of High Density Polyethylene with T l GaSe 2 Semi-Conductor Filler. Surface Engineering and Applied Electrochemistry, 46,


10
Temperature-Frequency Characteristics of Dielectric Properties of Compositions LDPE + xvol%bi2te3
 Open Journal of Organic Polymer Materials, 2016, 6, 25-29 Published Online January 2016 in SciRes. http://www.scirp.org/journal/ojopm http://dx.doi.org/10.4236/ojopm.2016.61003 Temperature-Frequency Characteristics
The Effect of γ-radiations on Dielectric Properties of Composite Materials PE + x vol% TlGaSe2
 Open Journal of Inorganic Non-Metallic Materials, 2015, 5, 51-55 Published Online October 2015 in SciRes. http://www.scirp.org/journal/ojinm http://dx.doi.org/10.4236/ojinm.2015.54006 The Effect of γ-radiations
The effect of an inorganic filler on the properties of high-density polyethylene
 Plasticheskie Massy, No. 4, 2012, pp. 10 13 The effect of an inorganic filler on the properties of high-density polyethylene M.M. Kuliev and R.S. Ismaiilova Institute of Radiation Problems, Azerbaidzhan
STRUCTURE AND DIELECTRIC PROPERTIES OF NANOCOMPOSITES ON THE BASIS OF POLYETHYLENE WITH Fe 3 O 4 NANOPARTICLES
 Digest Journal of Nanomaterials and Biostructures Vol. 8, No. 4, October - December 13, p. 1447-1454 STRUCTURE AND DIELECTRIC PROPERTIES OF NANOCOMPOSITES ON THE BASIS OF POLYETHYLENE WITH Fe 3 O 4 NANOPARTICLES
STRUCTURE AND DIELECTRIC PROPERTIES OF NANOCOMPOSITES ON THE BASIS OF HIGH-DENSITY POLYETHYLENE AND LEAD SULFIDE
 Chalcogenide Letters Vol. 11, No. 4, April 2014, p. 175-180 STRUCTURE AND DIELECTRIC PROPERTIES OF NANOCOMPOSITES ON THE BASIS OF HIGH-DENSITY POLYETHYLENE AND LEAD SULFIDE A. M. MAHARRAMOV *, M. A. RAMAZANOV,
Variable capacitor energy harvesting based on polymer dielectric and composite electrode
 2.8.215 Variable capacitor energy harvesting based on polymer dielectric and composite electrode Robert Hahn 1*, Yuja Yang 1, Uwe Maaß 1, Leopold Georgi 2, Jörg Bauer 1, and K.- D. Lang 2 1 Fraunhofer
Supporting Information
 Electronic Supplementary Material (ESI) for Materials Horizons. This journal is The Royal Society of Chemistry 2017 Supporting Information Organic Liquid-Crystal Devices Based on Ionic Conductors Can Hui
INFLUENCE OF PREPARATION TECHNOLOGY - CRYSTALLISATION TEMPERATURE-TIME REGIME ON SUPRAMOLECULAR STRUCTURE AND PROPERTIES OF PP/Ag 2 S NANOCOMPOSITES
 Journal of Optoelectronic and Biomedical Materials Vol. 10, No. 2, April June 2018, p. 37-42 INFLUENCE OF PREPARATION TECHNOLOGY - CRYSTALLISATION TEMPERATURE-TIME REGIME ON SUPRAMOLECULAR STRUCTURE AND
The Use of Phase Portraits for the Study of the Generation-Recombination Processes in Semiconductor
 Journal of Modern Physics, 215, 6, 1921-1926 Published Onli October 215 in SciRes. http://www.scirp.org/journal/jmp http://dx.doi.org/1.4236/jmp.215.613197 The Use of Phase Portraits for the Study of the
Influence of Some Preparation Conditions on Debye s Relaxation Time and Related Properties of (Pb, La)TiO 3 Ceramics
TiO 3 Ceramics") Egypt. J. Solids, Vol. (30), No. (1), (2007) 47 Influence of Some Preparation Conditions on Debye s Relaxation Time and Related Properties of (Pb, La)TiO 3 Ceramics M. K. Gergs Physics Department, Faculty
Egypt. J. Solids, Vol. (30), No. (1), (2007) 47 Influence of Some Preparation Conditions on Debye s Relaxation Time and Related Properties of (Pb, La)TiO 3 Ceramics M. K. Gergs Physics Department, Faculty
EVALUATION OF A.C. CONDUCTIVITY FOR LEAD SILICATE GLASS FROM DIELECTRIC MEASUREMENTS
 Journal of Electron Devices, Vol. 12, 2012, pp. 750-755 JED [ISSN: 1682-3427 ] EVALUATION OF A.C. CONDUCTIVITY FOR LEAD SILICATE GLASS FROM DIELECTRIC MEASUREMENTS D.K. Mahde, B.T.Chiad, Ghuson H.Mohamed
Imaging Methods: Scanning Force Microscopy (SFM / AFM)
") Imaging Methods: Scanning Force Microscopy (SFM / AFM) The atomic force microscope (AFM) probes the surface of a sample with a sharp tip, a couple of microns long and often less than 100 Å in diameter.
Imaging Methods: Scanning Force Microscopy (SFM / AFM) The atomic force microscope (AFM) probes the surface of a sample with a sharp tip, a couple of microns long and often less than 100 Å in diameter.
Study of Transport and Electrical Properties of PEO: PVP: NaClO 2 Based Polymer Electrolyte
 Study of Transport and Electrical Properties of PEO: PVP: NaClO 2 Based P.A.FARTODE 1 S.S.YAWALE 2 3 1 Research Student, G.V.I.S.H., Amravati. Maharashtra 2 Director, Govt.Vidarbha Institute of science
Supporting Information
 Electronic Supplementary Material (ESI) for ChemComm. This journal is The Royal Society of Chemistry 2014 Supporting Information High-k Polymer/Graphene Oxide Dielectrics for Low-Voltage Flexible Nonvolatile
White Paper: Transparent High Dielectric Nanocomposite
 Zhiyun (Gene) Chen, Ph.D., Vice President of Engineering Pixelligent Technologies 64 Beckley Street, Baltimore, Maryland 2224 Email: zchen@pixelligent.com February 205 Abstract High dielectric constant
Journal of Optoelectronics and Biomedical Materials Vol. 9, No.1, January - March 2017 p. 1-7
 Journal of Optoelectronics and Biomedical Materials Vol. 9, No.1, January - March 2017 p. 1-7 INFLUENCE TEMPERATURE TIME MODE OF CRYSTALLIZATION ON THE STRUCTURE AND PROPERTIES OF NANOCOMPOSITES BASED
Crystalline Surfaces for Laser Metrology
 Crystalline Surfaces for Laser Metrology A.V. Latyshev, Institute of Semiconductor Physics SB RAS, Novosibirsk, Russia Abstract: The number of methodological recommendations has been pronounced to describe
A STRUCTURE AND DIELECTRIC PROPERTIES OF POLYMER NANOCOMPOSITES ON THE BASE OF ISOTACTIC POLYPROPYLENE AND LEAD SULPHIDE NANOPARTICLES
 Chalcogenide Letters Vol. 13, No. 1, January 2016, p. 35-40 A STRUCTURE AND DIELECTRIC PROPERTIES OF POLYMER NANOCOMPOSITES ON THE BASE OF ISOTACTIC POLYPROPYLENE AND LEAD SULPHIDE NANOPARTICLES A.M.MAHARRAMOV,
Carbonized Electrospun Nanofiber Sheets for Thermophones
 Supporting Information Carbonized Electrospun Nanofiber Sheets for Thermophones Ali E. Aliev 1 *, Sahila Perananthan 2, John P. Ferraris 1,2 1 A. G. MacDiarmid NanoTech Institute, University of Texas at
INCREASING INFORMATIVITY OF THE THERMALLY STIMULATED DEPOLARIZATION METHOD
 INCREASING INFORMATIVITY OF THE THERMALLY STIMULATED DEPOLARIZATION METHOD S. N. Fedosov, A. E. Sergeeva and T. A. Revenyuk Department of Physics, Odessa National Academy of Food Technologies, Odessa,
Role of phase interactions in formation of photoluminescent and dielectric properties of polymeric nanocomposites PP + CdS
 Role of phase interactions in formation of photoluminescent and dielectric properties of polymeric nanocomposites PP + CdS A.M. Маgerramov, М. А. Rаmаzanov, F.V. Gadjiyeva Baku State University, AZ 1148,
Ferroelectrics investigation
 Ferroelectrics investigation. Introduction A dielectric is understood as a material where the electric field induces an electric momentum. Let s consider a vacuum capacitor made of two planar metallic
Dielectric Properties of Composite Films Made from Tin(IV) Oxide and Magnesium Oxide
 Oxide and Magnesium Oxide") OUSL Journal (2014) Vol 7, (pp67-75) Dielectric Properties of Composite Films Made from Tin(IV) Oxide and Magnesium Oxide C. N. Nupearachchi* and V. P. S. Perera Department of Physics, The Open University
OUSL Journal (2014) Vol 7, (pp67-75) Dielectric Properties of Composite Films Made from Tin(IV) Oxide and Magnesium Oxide C. N. Nupearachchi* and V. P. S. Perera Department of Physics, The Open University
AM11: Diagnostics for Measuring and Modelling Dispersion in Nanoparticulate Reinforced Polymers. Polymers: Multiscale Properties.
 AM11: Diagnostics for Measuring and Modelling Dispersion in Nanoparticulate Reinforced Polymers Polymers: Multiscale Properties 8 November 2007 Aims Provide diagnostic tools for quantitative measurement
THERMAL AND MECHANICAL PROPERTIES OF POLYMER-BASED NANOCOMPOSITES OF ISOTACTIC POLYPROPYLENE AND TITANIUM NANOPARTICLES
 Digest Journal of Nanomaterials and Biostructures Vol. 11, No. 2, April - June 2016, p. 365-372 THERMAL AND MECHANICAL PROPERTIES OF POLYMER-BASED NANOCOMPOSITES OF ISOTACTIC POLYPROPYLENE AND TITANIUM
Stepwise Solution Important Instructions to examiners:
 (ISO/IEC - 700-005 Certified) SUMMER 05 EXAMINATION Subject Code: 70 Model Answer (Applied Science- Physics) Page No: 0/6 Que. No. Sub. Que. Important Instructions to examiners: ) The answers should be
TECHNICAL NOTE. ε0 : Dielectric constant in vacuum (= F/m) ALUMINUM ELECTROLYTIC CAPACITORS. 1 General Description of Aluminum Electrolytic
 ALUMINUM ELECTROLYTIC CAPACITORS. 1 General Description of Aluminum Electrolytic") POLYMER HYBRID General Description of Aluminum Electrolytic Capacitors - The Principle of Capacitor The principle of capacitor can be presented by the principle drawing as in Fig.-. When a voltage is applied
POLYMER HYBRID General Description of Aluminum Electrolytic Capacitors - The Principle of Capacitor The principle of capacitor can be presented by the principle drawing as in Fig.-. When a voltage is applied
Chapter 12. Nanometrology. Oxford University Press All rights reserved.
 Chapter 12 Nanometrology Introduction Nanometrology is the science of measurement at the nanoscale level. Figure illustrates where nanoscale stands in relation to a meter and sub divisions of meter. Nanometrology
Magnetodielectrical Polymer Compositional Materials
 Tr. J. of Physics 23 (1999), 511 515. c TÜBİTAK Magnetodielectrical Polymer Compositional Materials Sh. V. MAMEDOV, Y. LENGER, S. BOLCAL, V.A. ALEKPEROV Yıldız Technical University, Department of Physics,
nano-ta: Nano Thermal Analysis
 nano-ta: Nano Thermal Analysis Application Note #1 Failure Analysis - Identification of Particles in a Polymer Film Author: David Grandy Ph.D. Introduction Nano-TA is a local thermal analysis technique
Homework 2: Forces on Charged Particles
 Homework 2: Forces on Charged Particles 1. In the arrangement shown below, 2 C of positive charge is moved from plate S, which is at a potential of 250 V, to plate T, which is at a potential of 750 V.
INVESTIGATION OF TEMPERATURE DEPENDENCES OF ELECTROMECHANICAL PROPERTIES OF PLZT CERAMICS
 Molecular and Quantum Acoustics vol. 28 (2007) 47 INVESTIGATION OF TEMPERATURE DEPENDENCES OF ELECTROMECHANICAL PROPERTIES OF PLZT CERAMICS M. CZERWIEC, R. ZACHARIASZ and J. ILCZUK Department of Material
Supplementary Information for. Effect of Ag nanoparticle concentration on the electrical and
 Supplementary Information for Effect of Ag nanoparticle concentration on the electrical and ferroelectric properties of Ag/P(VDF-TrFE) composite films Haemin Paik 1,2, Yoon-Young Choi 3, Seungbum Hong
Piezoelectric Resonators ME 2082
 Piezoelectric Resonators ME 2082 Introduction K T : relative dielectric constant of the material ε o : relative permittivity of free space (8.854*10-12 F/m) h: distance between electrodes (m - material
MME 467: Ceramics for Advanced Applications
 MME 467: Ceramics for Advanced Applications Lecture 26 Dielectric Properties of Ceramic Materials 2 1. Barsoum, Fundamental Ceramics, McGraw-Hill, 2000, pp.513 543 2. Richerson, Modern Ceramic Engineering,
Electrochemistry of Semiconductors
 Electrochemistry of Semiconductors Adrian W. Bott, Ph.D. Bioanalytical Systems, Inc. 2701 Kent Avenue West Lafayette, IN 47906-1382 This article is an introduction to the electrochemical properties of
(name) Electrochemical Energy Systems, Spring 2014, M. Z. Bazant. Final Exam
 Electrochemical Energy Systems, Spring 2014, M. Z. Bazant. Final Exam") 10.626 Electrochemical Energy Systems, Spring 2014, M. Z. Bazant Final Exam Instructions. This is a three-hour closed book exam. You are allowed to have five doublesided pages of personal notes during
10.626 Electrochemical Energy Systems, Spring 2014, M. Z. Bazant Final Exam Instructions. This is a three-hour closed book exam. You are allowed to have five doublesided pages of personal notes during
Supporting information
 Electronic Supplementary Material (ESI) for Journal of Materials Chemistry A. This journal is The Royal Society of Chemistry 2017 Supporting information Colossal permittivity with ultralow dielectric loss
Chapter 10. Nanometrology. Oxford University Press All rights reserved.
 Chapter 10 Nanometrology Oxford University Press 2013. All rights reserved. 1 Introduction Nanometrology is the science of measurement at the nanoscale level. Figure illustrates where nanoscale stands
Active elastomer components based on dielectric elastomers
 Gummi Fasern Kunststoffe, 68, No. 6, 2015, pp. 412 415 Active elastomer components based on dielectric elastomers W. Kaal and S. Herold Fraunhofer Institute for Structural Durability and System Reliability
PREPARATION AND STRUCTURE OF NANOCOMPOSITES BASED ON ZINC SULFIDE IN POLYVINYLCHLORIDE
 Journal of Non - Oxide Glasses Vol. 10, No. 1, January - March 2018, p. 1-6 PREPARATION AND STRUCTURE OF NANOCOMPOSITES BASED ON ZINC SULFIDE IN POLYVINYLCHLORIDE M. A. RAMAZANOV a*, Y. BABAYEV b a Baku
DEPARTMENT OF ELECTRICAL ENGINEERING DIT UNIVERSITY HIGH VOLTAGE ENGINEERING
 UNIT 1: BREAKDOWN IN SOLIDS 1.) Introduction: The solid dielectric materials are used in all kinds of electrical apparatus and devices to insulate current carrying part from another when they operate at
Colour Images from Compound Semiconductor Radiation Detectors Chapter 3. Alan Owens
 Colour Images from Compound Semiconductor Radiation Detectors Chapter 3 Alan Owens Figure 3.2: Left: a diamond disk saw. Right: a wire saw used for cutting ingots into slices prior to detector preparation.
Laser Interferometric Displacement Measurements of Multi-Layer Actuators and PZT Ceramics
 Ferroelectrics, 320:161 169, 2005 Copyright Taylor & Francis Inc. ISSN: 0015-0193 print / 1563-5112 online DOI: 10.1080/00150190590967026 Laser Interferometric Displacement Measurements of Multi-Layer
Chapter 4 Influences of Compositional, Structural and Environmental Factors on. Soil EM Properties
 Chapter 4 Influences of Compositional, Structural and Environmental Factors on Soil EM Properties 4. 1 Introduction The measured soil electromagnetic properties can be affected by a large number of factors
AC impedance and dielectric spectroscopic studies of Mg 2+ ion conducting PVA PEG blended polymer electrolytes
 Bull. Mater. Sci., Vol. 34, No. 5, August 211, pp. 163 167. c Indian Academy of Sciences. AC impedance and dielectric spectroscopic studies of Mg 2+ ion conducting PVA PEG blended polymer electrolytes
Fouling of reverse osmosis membranes using electrical impedance spectroscopy: Measurements and simulations
 Desalination 236 (2009) 187 193 Fouling of reverse osmosis membranes using electrical impedance spectroscopy: Measurements and simulations J.M. Kavanagh*, S. Hussain, T.C. Chilcott, H.G.L. Coster School
Low Energy Generation of the "Strange" Radiation. Ivoilov N.G. Kazan State University, physical dept.,
 Low Energy Generation of the "Strange" Radiation Ivoilov N.G. Kazan State University, physical dept., e-mail: ivoilov@rambler.ru In the first time the term 'strange' radiation was used in paper of L. Uroutzkoev
CVD-3 SIO-HU SiO 2 Process
 CVD-3 SIO-HU SiO 2 Process Top Electrode, C Bottom Electrode, C Pump to Base Time (s) SiH 4 Flow Standard SIO-HU Process N 2 O Flow N 2 HF (watts) LF (watts) Pressure (mtorr Deposition Time min:s.s Pump
Chapter 13. Capacitors
 Chapter 13 Capacitors Objectives Describe the basic structure and characteristics of a capacitor Discuss various types of capacitors Analyze series capacitors Analyze parallel capacitors Analyze capacitive
This document is downloaded from DR-NTU, Nanyang Technological University Library, Singapore.
 This document is downloaded from DR-NTU, Nanyang Technological University Library, Singapore. Title Dielectric relaxation in AC powder electroluminescent devices Author(s) Citation Zhang, Shuai; Su, Haibin;
High Frequency Dielectric Strength Tests
 High Frequency Dielectric Strength Tests Insulation tests at high frequency (HF) need to be done with great care. The mechanism of breakdown is different to normal mains frequency dielectric strength tests
ANALYSIS OF DIELECTRIC, MODULUS, ELECTRO CHEMICAL STABILITY OF PVP ABSA POLYMER ELECTROLYTE SYSTEMS
 Int. J. Chem. Sci.: 14(1), 216, 477-481 ISSN 972-768X www.sadgurupublications.com ANALYSIS OF DIELECTRIC, MODULUS, ELECTRO CHEMICAL STABILITY OF PVP ABSA POLYMER ELECTROLYTE SYSTEMS R. S. DIANA SANGEETHA
Polarization. D =e i E=k i e o E =e o E+ P
 Dielectrics Polarization a perfect insulator or a dielectric is the material with no free charge carriers. if an electric field, E, is applied to the insulator no charge flow. However in the presence of
Characterization of MEMS Devices
 MEMS: Characterization Characterization of MEMS Devices Prasanna S. Gandhi Assistant Professor, Department of Mechanical Engineering, Indian Institute of Technology, Bombay, Recap Fabrication of MEMS Conventional
Instrumentation and Operation
 Instrumentation and Operation 1 STM Instrumentation COMPONENTS sharp metal tip scanning system and control electronics feedback electronics (keeps tunneling current constant) image processing system data
Properties of waves. Question. Ch 22, : Waves & interference. Question. Phase difference & interference
 Exam Tue. Sep. 9, 5:30-7 pm, 45 Birge Covers.5-7,, 3.-4, 3.7, 4.-5, 6 + lecture, lab, discussion, HW Chap.5-7, Waves, interference, and diffraction Chap 3 Reflection, refraction, and image formation Chap
Supplemental material: Transient thermal characterization of suspended monolayer MoS 2
 Supplemental material: Transient thermal characterization of suspended monolayer MoS Robin J. Dolleman,, David Lloyd, Martin Lee, J. Scott Bunch,, Herre S. J. van der Zant, and Peter G. Steeneken, Kavli
METROLOGY AND STANDARDIZATION FOR NANOTECHNOLOGIES
 MEROLOGY AND SANDARDIZAION FOR NANOECHNOLOGIES P.A.odua Center for Surface and Vacuum Research (CSVR), Moscow, Moscow Institute of Physics and echnology (MIP) E-mail: fgupnicpv@mail.ru Key words: nanotechnology,
Properties of Materials
 Tao Deng, dengtao@sjtu.edu.cn 1 1896 1920 1987 2006 Properties of Materials Chapter 3 Electrical Properties of Materials Tao Deng 3.1.4.4 The superconducting tunneling effect (Josephson effect) Tao Deng,
Effect of La-ions on Debye s Relaxation Time and Activation Energy of (Pb 1-1.5x La x )TiO 3 Ceramics
TiO 3 Ceramics") Egypt. J. Solids, Vol. (29), No. (2), (2006) 371 Effect of La-ions on Debye s Relaxation Time and Activation Energy of (Pb 1-1.5x La x )TiO 3 Ceramics M.K.Gergs Physics Department, Faculty of Science (Qena),
Egypt. J. Solids, Vol. (29), No. (2), (2006) 371 Effect of La-ions on Debye s Relaxation Time and Activation Energy of (Pb 1-1.5x La x )TiO 3 Ceramics M.K.Gergs Physics Department, Faculty of Science (Qena),
Recommended Testing Method of Aluminum Electrolytic Capacitor
 Recommended Testing Method of Aluminum Electrolytic Capacitor Aluminum Electrolytic Capacitor (for LED Products) I. Endurance ) Testing device: Ripple power tester, Thermostatic drier, LCR digital electric
tip of a current tip and the sample. Components: 3. Coarse sample-to-tip isolation system, and
 SCANNING TUNNELING MICROSCOPE Brief history: Heinrich Rohrer and Gerd K. Binnig, scientists at IBM's Zurich Research Laboratory in Switzerland, are awarded the 1986 Nobel Prize in physicss for their work
(a) (b) Supplementary Figure 1. (a) (b) (a) Supplementary Figure 2. (a) (b) (c) (d) (e)
 (b) Supplementary Figure 1. (a) (b) (a) Supplementary Figure 2. (a) (b) (c) (d) (e)") (a) (b) Supplementary Figure 1. (a) An AFM image of the device after the formation of the contact electrodes and the top gate dielectric Al 2 O 3. (b) A line scan performed along the white dashed line
(a) (b) Supplementary Figure 1. (a) An AFM image of the device after the formation of the contact electrodes and the top gate dielectric Al 2 O 3. (b) A line scan performed along the white dashed line
Visualization of Traveling Vortices in the Boundary Layer on a Rotating Disk under Orbital Motion
 Open Journal of Fluid Dynamics, 2015, 5, 17-25 Published Online March 2015 in SciRes. http://www.scirp.org/journal/ojfd http://dx.doi.org/10.4236/ojfd.2015.51003 Visualization of Traveling Vortices in
Dopant Concentration Measurements by Scanning Force Microscopy
 73.40L Scanning Microsc. Microanal. Microstruct. 551 Classification Physics Abstracts - - 61.16P 73.00 Dopant Concentration Measurements by Scanning Force Microscopy via p-n Junctions Stray Fields Jacopo
UNIVERSITY OF CAMBRIDGE INTERNATIONAL EXAMINATIONS General Certificate of Education Advanced Level
 www.xtremepapers.com UNIVERSITY OF CAMBRIDGE INTERNATIONAL EXAMINATIONS General Certificate of Education Advanced Level *9061759643* PHYSICS 9702/41 Paper 4 A2 Structured Questions October/November 2012
Chapter 6 ELECTRICAL CONDUCTIVITY ANALYSIS
 Chapter 6 ELECTRICAL CONDUCTIVITY ANALYSIS CHAPTER-6 6.1 Introduction The suitability and potentiality of a material for device applications can be determined from the frequency and temperature response
Studies on dielectric properties of a conducting polymer nanocomposite system
 Indian Journal of Engineering & Materials Sciences Vol. 15, August 2008, pp. 347-351 Studies on dielectric properties of a conducting polymer nanocomposite system Saumya R Mohapatra, Awalendra K Thakur*
Physical Properties and Structure of Solids
 49 Physical Properties and Structure of Solids INTRODUCTION: Depending on whether the kind of bonding in a pure substance is primarily ionic, covalent or metallic in character, a substance may be described
Effects of plasma treatment on the precipitation of fluorine-doped silicon oxide
 ARTICLE IN PRESS Journal of Physics and Chemistry of Solids 69 (2008) 555 560 www.elsevier.com/locate/jpcs Effects of plasma treatment on the precipitation of fluorine-doped silicon oxide Jun Wu a,, Ying-Lang
Warsaw University of Technology Electrical Department. Laboratory of Materials Technology KWNiAE
 Warsaw University of Technology Electrical Department Laboratory of Materials Technology KWNiAE Practice 8 Determining The Resistivity of the Electroinsulating Materials 1. Behavior of the dielectric in
Inductive behavior of electrolytes in AC conductance measurements
 Chemical Physics Letters 402 (2005) 274 278 www.elsevier.com/locate/cplett Inductive behavior of electrolytes in AC conductance measurements Adela Bardos a,b, Richard N. Zare a, *, Karin Markides b a Department
Lecture PowerPoints. Chapter 17 Physics: Principles with Applications, 7 th edition Giancoli
 Lecture PowerPoints Chapter 17 Physics: Principles with Applications, 7 th edition Giancoli This work is protected by United States copyright laws and is provided solely for the use of instructors in teaching
 Capacitors and Inductors Resistor: a passive element which dissipates energy only Two important passive linear circuit elements: 1) Capacitor 2) Inductor Introduction Capacitor and inductor can store energy
Outline of College Physics OpenStax Book
 Outline of College Physics OpenStax Book Taken from the online version of the book Dec. 27, 2017 18. Electric Charge and Electric Field 18.1. Static Electricity and Charge: Conservation of Charge Define
Scanning Tunneling Microscopy
 Scanning Tunneling Microscopy Scanning Direction References: Classical Tunneling Quantum Mechanics Tunneling current Tunneling current I t I t (V/d)exp(-Aφ 1/2 d) A = 1.025 (ev) -1/2 Å -1 I t = 10 pa~10na
Technology Brief 9: Capacitive Sensors
 218 TEHNOLOGY BRIEF 9: APAITIVE SENSORS Technology Brief 9: apacitive Sensors To sense is to respond to a stimulus. (See Tech Brief 7 on resistive sensors.) A capacitor can function as a sensor if the
SUPPORTING INFORMATION. Promoting Dual Electronic and Ionic Transport in PEDOT by Embedding Carbon Nanotubes for Large Thermoelectric Responses
 SUPPORTING INFORMATION Promoting Dual Electronic and Ionic Transport in PEDOT by Embedding Carbon Nanotubes for Large Thermoelectric Responses Kyungwho Choi, 1,2+ Suk Lae Kim, 1+ Su-in Yi, 1 Jui-Hung Hsu,
Nanotechnology Fabrication Methods.
 Nanotechnology Fabrication Methods. 10 / 05 / 2016 1 Summary: 1.Introduction to Nanotechnology:...3 2.Nanotechnology Fabrication Methods:...5 2.1.Top-down Methods:...7 2.2.Bottom-up Methods:...16 3.Conclusions:...19
Electrochemical methods : Fundamentals and Applications
 Electrochemical methods : Fundamentals and Applications Lecture Note 7 May 19, 2014 Kwang Kim Yonsei University kbkim@yonsei.ac.kr 39 8 7 34 53 Y O N Se I 88.91 16.00 14.01 78.96 126.9 Electrochemical
Secondary Ion Mass Spectroscopy (SIMS)
") Secondary Ion Mass Spectroscopy (SIMS) Analyzing Inorganic Solids * = under special conditions ** = semiconductors only + = limited number of elements or groups Analyzing Organic Solids * = under special
Secondary Ion Mass Spectroscopy (SIMS) Analyzing Inorganic Solids * = under special conditions ** = semiconductors only + = limited number of elements or groups Analyzing Organic Solids * = under special
Transducers. ME 3251 Thermal Fluid Systems
 Transducers ME 3251 Thermal Fluid Systems 1 Transducers Transform values of physical variables into equivalent electrical signals Converts a signal from one form to another form 2 Types of Transducers
EIS of Organic Coatings and Paints
 EIS of Organic Coatings and Paints Introduction All My Impedance Spectra Look the Same! "I m an experienced polymer chemist. I m trying to use Electrochemical Impedance Spectroscopy (EIS) to predict the
Inverse Correlations between Daily Average Energy of Global 0.01 to 1 M Earthquakes and Solar Flux Units: Possible Source of Coupling
 International Journal of Geosciences, 2014, 5, 1503-1508 Published Online November 2014 in SciRes. http://www.scirp.org/journal/ijg http://dx.doi.org/10.4236/ijg.2014.512122 Inverse Correlations between
EDDY CURRENT TESTING
 EDDY CURRENT TESTING Introduction Eddy current inspection is a method that use the principal of electromagnetism as the basis for conducting examinations. Eddy Current NDT is a technique that can test
Supplementary Figure 1 shows overall fabrication process and detailed illustrations are given
 Supplementary Figure 1. Pressure sensor fabrication schematics. Supplementary Figure 1 shows overall fabrication process and detailed illustrations are given in Methods section. (a) Firstly, the sacrificial
Experiment FT1: Measurement of Dielectric Constant
 Experiment FT1: Measurement of Dielectric Constant Name: ID: 1. Objective: (i) To measure the dielectric constant of paper and plastic film. (ii) To examine the energy storage capacity of a practical capacitor.
DIELECTRIC PROPERTIES OF POROUS ROCKS WITH AN APPLICATION TO SEA ICE BY LARS BACKSTROM
 DIELECTRIC PROPERTIES OF POROUS ROCKS WITH AN APPLICATION TO SEA ICE BY LARS BACKSTROM PRESENTATION GIVEN AS PARTIAL FULLFILLMENT OF THE REQUIREMENTS FOR THE CLASS GEOS 692 - FALL 2006 Contents of presentation
Electricity. Revision Notes. R.D.Pilkington
 Electricity Revision Notes R.D.Pilkington DIRECT CURRENTS Introduction Current: Rate of charge flow, I = dq/dt Units: amps Potential and potential difference: work done to move unit +ve charge from point
THE PROPERTIES OF THIN FILM DIELECTRIC LAYERS PREPARED BY SPUTTERING
 THE PROPERTIES OF THIN FILM DIELECTRIC LAYERS PREPARED BY SPUTTERING Ivana BESHAJOVÁ PELIKÁNOVÁ a, Libor VALENTA a a KATEDRA ELEKTROTECHNOLOGIE, ČVUT FEL, Technická 2, 166 27 Praha 6, Česká republika,
Transmission Electron Microscopy
 L. Reimer H. Kohl Transmission Electron Microscopy Physics of Image Formation Fifth Edition el Springer Contents 1 Introduction... 1 1.1 Transmission Electron Microscopy... 1 1.1.1 Conventional Transmission
Basic Laboratory. Materials Science and Engineering. Atomic Force Microscopy (AFM)
") Basic Laboratory Materials Science and Engineering Atomic Force Microscopy (AFM) M108 Stand: 20.10.2015 Aim: Presentation of an application of the AFM for studying surface morphology. Inhalt 1.Introduction...
Basic Laboratory Materials Science and Engineering Atomic Force Microscopy (AFM) M108 Stand: 20.10.2015 Aim: Presentation of an application of the AFM for studying surface morphology. Inhalt 1.Introduction...
Capacitive Sensors for Measuring Complex Permittivity of Planar and Cylindrical Test-pieces
 Capacitive Sensors for Measuring Complex Permittivity of Planar and Cylindrical Test-pieces Nicola Bowler and Tianming Chen Center for NDE Iowa State University Online Graduate Certificate in NDE 13 or
Modelling a Resonant Near Field Scanning Microwave Microscope (RNSMM) Probe
 Probe") Modelling a Resonant Near Field Scanning Microwave Microscope (RNSMM) Probe Nadia Smith, Kevin Lees, Andrew Gregory, Robert Clarke NPL, National Physical Laboratory, UK 18 th September 2014 EMINDA Electromagnetic
Modelling a Resonant Near Field Scanning Microwave Microscope (RNSMM) Probe Nadia Smith, Kevin Lees, Andrew Gregory, Robert Clarke NPL, National Physical Laboratory, UK 18 th September 2014 EMINDA Electromagnetic
EE 527 MICROFABRICATION. Lecture 5 Tai-Chang Chen University of Washington
 EE 527 MICROFABRICATION Lecture 5 Tai-Chang Chen University of Washington MICROSCOPY AND VISUALIZATION Electron microscope, transmission electron microscope Resolution: atomic imaging Use: lattice spacing.
Higher Physics. Electricity. Summary Notes. Monitoring and measuring a.c. Current, potential difference, power and resistance
 Higher Physics Electricity Summary Notes Monitoring and measuring a.c. Current, potential difference, power and resistance Electrical sources and internal resistance Capacitors Conductors, semiconductors
PHYSICS PAPER 1 (THEORY)
") PHYSICS PAPER 1 (THEORY) (Three hours) (Candidates are allowed additional 15 minutes for only reading the paper. They must NOT start writing during this time.) ---------------------------------------------------------------------------------------------------------------------
PHYSICS PAPER 1 (THEORY) (Three hours) (Candidates are allowed additional 15 minutes for only reading the paper. They must NOT start writing during this time.) ---------------------------------------------------------------------------------------------------------------------
CVD-3 LFSIN SiN x Process
 CVD-3 LFSIN SiN x Process Top Electrode, C Bottom Electrode, C Pump to Base Time (s) SiH 4 Flow Standard LFSIN Process NH 3 Flow N 2 HF (watts) LF (watts) Pressure (mtorr Deposition Time min:s.s Pump to
ELECTROMAGNETIC MODELING OF THREE DIMENSIONAL INTEGRATED CIRCUITS MENTOR GRAPHICS
 ELECTROMAGNETIC MODELING OF THREE DIMENSIONAL INTEGRATED CIRCUITS MENTOR GRAPHICS H I G H S P E E D D E S I G N W H I T E P A P E R w w w. m e n t o r. c o m / p c b INTRODUCTION Three Dimensional Integrated