Use and evaluation of low cost sensors for the monitoring of NO 2 and O 3 in ambient air
|
|
|
- Posy Phillips
- 5 years ago
- Views:
Transcription


1 Use and evaluation of low cost sensors for the monitoring of NO 2 and O 3 in ambient air Michel Gerboles, Pascual Ballesta and Laurent Spinelle European Commission, Joint Research Centre, I Ispra (VA)
2 Fixed/indicative measurements: definition fixed measurements measurements taken at fixed sites, to determine the levels in accordance with the relevant Data Quality Objectives (DQO); indicative measurements measurements which meet DQOs that are less strict than those required for fixed measurements; They are use to monitor Limit Values during an Averaging Time (for ozone 60 ppb mean of 8 hourly values) European DIRECTIVE 2008/50/EC on ambient air quality and cleaner air for Europe, art. 2 2
3 Data Quality Objectives (DQO) of the European Air Quality Directive O 3 SO 2, NO 2 /NO/ NOx, CO Benzene DQO: Uncertainty for indicative measurements DQO: Uncertainty for reference measurements 30 % 25 % 30 % 15 % 15 % 25 % 3
4 Indicative methods: what for? Fixed measurements are mandatory in zones and agglomerations where the upper assessment thresholds are exceeded, otherwise indicative methods can be used. The use of indicative measurements allows for reduction of 50 % of the required minimum number of fixed sampling points. European DIRECTIVE 2008/50/EC on ambient air quality and cleaner air for Europe, art. 6 4
5 Field of application: limit value, averaging time and Data Quality Objective Type of station/zone: e.g. O 3 rural background air composition (test gas and interferents) 1 Response time 2 Pre-calibration 3.1 Short term drift 3.2 Long term drift Averaging time Calibration function to eliminate bias at central point Max time between tests, limit of detection, repeatability Correction of drift - periodicity of re-calibration 4 Interference testing: gas compounds, meteo (T, RH,P, wind...), hysteresis... laboratory design of experiments (significant parameters ) No Lab. Model equation lab. uncertainty U(lab) 5.1 Lab. experiments U(lab) < DQO? Yes 5.2 Field tests - U(field) No Lab. Model correct in field? 6 Additional information: cold, warm and hot start... No U(Field) <U(lab) Yes Yes The sensor is accepted as an indicative method No U(field)<DQO 5
6 Tests Comments on test gas level or interferent Temperature, ºC Relative humidity, % 1 Response Time 0 to 80 % of full scale (FS) - 80% of FS to 0 2 Pre-calibration At least 3 levels of test gas (limit value LV) 3-1 Repeatability 0 and 80 % of FS, 3 repetitions every averaging time 3-2 Short term drift 3-3 Long term drift 24 September , 50 % and 80 % of LV, 3 repetitions per day for 3 consecutive days 0, 50 % and 80 % of LV, repeated every 2 weeks during 3 months 4-1 Air matrix Zero air, laboratory air and ambient air at 0 and LV 4-2 Gas interference Test selected interferences at 0 and mean level in ambient air, test gas at 0 and LV of test gas 4-3 Temperature At LV From mean-10 C to mean+10 C by steps of 5 C 4-4 Humidity At LV 4-5 Hysteresis Increasing-decreasing-increasing cycles of the test gas levels used for pre-calibration From mean-20% to mean +20% by steps of 10% 4-6 Pressure overpressure 10 mbar and under pressure 5 mbar 4-7 Power supply effect At LV test under 210, 220 and 230 V 4-8 Wind velocity from 1 to 5 m/s (needed?) 5-1 Lab experiments (model) 5-2 Field experiments 6 Cold start, warm start, hot start 0, LV, AT for each significant parameter: temperature and humidity (3 levels) and interference (2 levels) At an automatic station equipped with reference method of measurements -10 C, mean, mean -10 C, if found significant -20%, mean, mean + 20 %, if found significant At LV 6
7 On-site measurements 24 September

8 On-site measurements Inlet sampling line Sensors Meteorological mast


 4")


9 Manufacturer Model Type OUnitec 3 Sensors s.r.l IT O 3 Sens 3000 Resistive Ingenieros Assessores SP NanoENvi mote and MicroSAD datalogger, with Oz-47 sensor Resistive αsense - UK O 3 sensors (O3B4) 4 electrodes Citytech G Sensoric 4-20 ma Transmitter Board with O3E1 sensor 3 electrodes Citytech G Sensoric 4-20 ma Transmitter Board with O3E1F sensor 3 electrodes CairPol F CairClip O3 3 electrodes e2v CH MiCS-2610 sensor and OMC2 datalogger, Resistive e2v CH MiCS Oz-47 sensor and OMC3 datalogger Resistive IMN2P FR Prototype WO3 sensor with MICS-EK1 Sensor Evaluation Kit Resistive FIS - J SP-61 sensor and evaluation test board Resistive
10 NO 2 Sensors Manufacturer Unitec s.r.l IT Sens 3000 Ingenieros Assessores SP αsense UK Citytech G Model NanoENvi mote and MicroSAD datalogger, unidentified sensor probably e2v-mics sensor NO 2 sensors (B4 series) Sensoric 4-20 ma Transmitter Board with 3E50 sensor Citytech UK A3OZ EnviroceL (NO2 and O3) MIKES FI InRim IT Prototype graphene sensors Prototype graphene sensors
11 1 - Response time Rise Time (n=3) Fall Time (n=3) Average Time Response time per type Chamber UV analyser (substracted) Unitec, Sens3000 (n =2) 47 ' 75 ' 61 ' e2v, MICS-2610 (n =2) 1 ' 12 ' 6 ' FIS, SP-61(n =2) 57 ' 54 ' 56 ' Ingenieros Assessores, NanoEnvi (n =1) 8 ' 14 ' 11 ' 31 ' e2v, OMC3 (n=2) e2v, OMC2 (n=2) e2v, MICS_Oz47 (n =7) 19' 27' 23' IMN2P, WO3 (n =2) 8' 16' 12' 12 ' Sensoric, O3E1F + Test Panel (n =1) 1' 2' 2' Sensoric, O3E mA Board (n =2) 4 ' 5 ' 4 ' αsense B4 (n =2) 1 ' 2 ' 2 ' 3 ' CairclipO3NO2 (n=1) 3 ' 3 ' 3 ' Sensors Average response Time 15' 21 ' 18 '
12 Tests Comments on test gas level or interferent Temperature, ºC Rela6ve humidity, % 1 Response Time 0 to 80 % of full scale (FS) - 80% of FS to 0 2 Pre-calibration At least 3 levels of test gas (limit value LV) 3-1 Repeatability 0 and 80 % of FS, 3 repetitions every averaging time Short term drift Long term drift 0, 50 % and 80 % of LV, 3 repetitions per day for 3 consecutive days 0, 50 % and 80 % of LV, repeated every 2 weeks during 3 months 4-1 Air matrix Zero air, laboratory air and ambient air at 0 and LV 4-2 Gas interference Test selected interferences at 0 and mean level in ambient air, test gas at 0 and LV of test gas 4-3 Temperature At LV From mean-10 C to mean+10 C by steps of 5 C 4-4 Humidity At LV 4-5 Hysteresis Increasing-decreasing-increasing cycles of the test gas levels used for pre-calibration From mean-20% to mean +20% by steps of 10% 4-6 Pressure overpressure 10 mbar and under pressure 5 mbar 4-7 Power supply effect At LV test under 210, 220 and 230 V 4-8 Wind velocity from 1 to 5 m/s (needed?) 0, LV, AT for each significant parameter: temperature -10 C, mean, mean -20%, mean, mean Lab experiments and humidity (3 levels) and interference (2 levels) -10 C, if found significant %, if found significant At an automatic station equipped with reference 5-2 Field experiments method of measurements 3 months Cold start, warm 6 At LV start, hot start
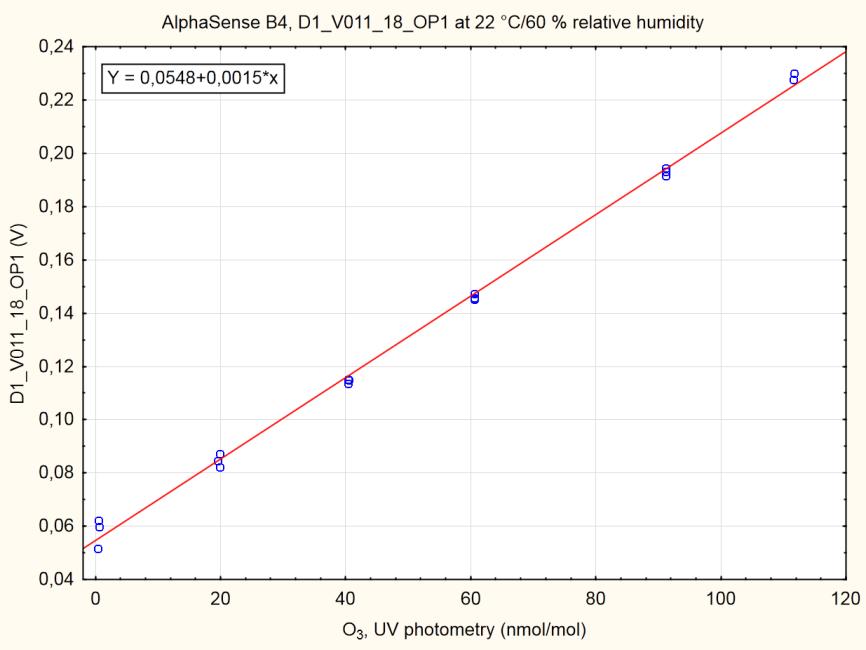
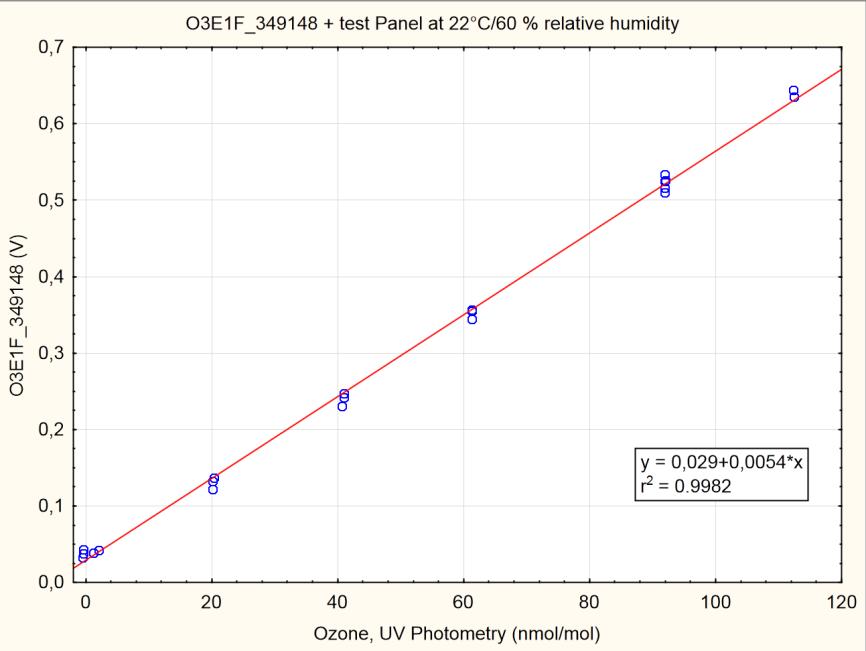
13 2 - Pre-calibration
14 Tests Comments on test gas level or interferents Temperature, ºC Relative humidity, % 1 Response Time 0 to 80 % of full scale (FS) - 80% of FS to 0 2 Pre-calibration At least 3 levels of test gas (limit value LV) 3-1 Repeatability 3-2 Short term drift 3-3 Long term drift 0 and 80 % of FS, 3 repetitions every averaging time 0, 50 % and 80 % of LV, 3 repetitions per day for 3 consecutive days 0, 50 % and 80 % of LV, repeated every 2 weeks during 3 months 4-1 Air matrix Zero air, laboratory air and ambient air at 0 and LV 4-2 Gas interference Test selected interferences at 0 and mean level in ambient air, test gas at 0 and LV of test gas 4-3 Temperature At LV From mean-10 C to mean+10 C by steps of 5 C 4-4 Humidity At LV 4-5 Hysteresis Increasing-decreasing-increasing cycles of the test gas levels used for pre-calibration From mean-20% to mean +20% by steps of 10% 4-6 Pressure overpressure 10 mbar and under pressure 5 mbar 4-7 Power supply effect At LV test under 210, 220 and 230 V 4-8 Wind velocity from 1 to 5 m/s (needed?) Lab experiments 0, LV, AT for each significant parameter: temperature -10 C, mean, mean -20%, mean, mean (model) and humidity (3 levels) and interference (2 levels) -10 C, if found significant %, if found significant At an automatic station equipped with reference 5-2 Field experiments method of measurements Cold start, warm 6 At LV
 0 NA (n=13) 91.7 93 ± 0.")
15 3.1 - Repeatability (hourly values) O3 ppb CairClipO3 ppb (n=9) 0 NA (n=13) ± 0.5
16 Tests Comments on test gas level or interferents Temperature, ºC Relative humidity, % 1 Response Time 0 to 80 % of full scale (FS) - 80% of FS to 0 2 Pre-calibration At least 3 levels of test gas (limit value LV) 3-1 Repeatability 0 and 90 % of LV, 3 repetitions every averaging time 3-2 Short term drift 3-3 Long term drift 0, 50 % and 80 % of FS, 3 repetitions per day for 3 consecutive days 0, 50 % and 80 % of LV, repeated every 2 weeks during 3 months 4-1 Air matrix Zero air, laboratory air and ambient air at 0 and LV 4-2 Gas interference Test selected interferences at 0 and mean level in ambient air, test gas at 0 and LV of test gas 4-3 Temperature At LV From mean-10 C to mean+10 C by steps of 5 C 4-4 Humidity At LV 4-5 Hysteresis Increasing-decreasing-increasing cycles of the test gas levels used for pre-calibration From mean-20% to mean +20% by steps of 10% 4-6 Pressure overpressure 10 mbar and under pressure 5 mbar 4-7 Power supply effect At LV test under 210, 220 and 230 V 4-8 Wind velocity from 1 to 5 m/s (needed?) Lab experiments 0, LV, AT for each significant parameter: temperature -10 C, mean, mean -20%, mean, mean (model) and humidity (3 levels) and interference (2 levels) -10 C, if found significant %, if found significant At an automatic station equipped with reference 5-2 Field experiments method of measurements Cold start, warm 6 At LV start, hot start
17 3.2 - Short term stability 1 day drift at 0, 60 and 90 ppb Diff. at 0 ppb (n~19) Diff. at 60 ppb % (n~8) Diff. at 90 ppb (n~6) Res 1 (n =2) % % Res 2 (n =2) Res 3 (n =2) % % Res 4 (n =2) % % Res 5 (n=2) Res 6 (n=2) Res 7 (n =1) % % Res 8 (n =2) % % Chem 1 (n =1) % % Chem 2 (n =2) Malfunc@on Malfunc@on Malfunc@on Chem 3 (n = 2) % % Chem 4 (n=1) 3.4 ± ± ± 0.7
18 Tests Comments on test gas level or interferents Temperature, ºC Relative humidity, % 1 Response Time 0 to 80 % of full scale (FS) - 80% of FS to 0 2 Pre-calibration At least 3 levels of test gas (limit value LV) 3-1 Repeatability 0 and 90 % of LV, 3 repetitions every averaging time 3-2 Short term drift 3-3 Long term drift 0, 50 % and 80 % of LV, 3 repetitions per day for 3 consecutive days 0, 50 % and 80 % of FS, repeated every 2 weeks during 3 months 4-1 Air matrix Zero air, laboratory air and ambient air at 0 and LV 4-2 Gas interference Test selected interferences at 0 and mean level in ambient air, test gas at 0 and LV of test gas 4-3 Temperature At LV From mean-10 C to mean+10 C by steps of 5 C 4-4 Humidity At LV 4-5 Hysteresis Increasing-decreasing-increasing cycles of the test gas levels used for pre-calibration From mean-20% to mean +20% by steps of 10% 4-6 Pressure overpressure 10 mbar and under pressure 5 mbar 4-7 Power supply effect At LV test under 210, 220 and 230 V 4-8 Wind velocity from 1 to 5 m/s (needed?) Lab experiments 0, LV, AT for each significant parameter: temperature -10 C, mean, mean -20%, mean, mean (model) and humidity (3 levels) and interference (2 levels) -10 C, if found significant %, if found significant At an automatic station equipped with reference 5-2 Field experiments method of measurements Cold start, warm 6 At LV start, hot start
19 a) Long term stability, 150 days Scatterplot of V011_21 (V) Ozone, UV Photometry = 0 nmol/mol: y = E-5*x; r 2 = Ozone, UV Photometry = 60 nmol/mol: y = E-5*x; r 2 = Ozone, UV Photometry = 90 nmol/mol: y = E-6*x; r 2 = V011_ Number of Day
20 Tests Comments on test gas level or interferents Temperature, ºC Relative humidity, % 1 Response Time 0 to 80 % of full scale (FS) - 80% of FS to 0 2 Pre-calibration At least 3 levels of test gas (limit value LV) 3-1 Repeatability 0 and 90 % of LV, 3 repetitions every averaging time 3-2 Short term drift 3-3 Long term drift 0, 50 % and 80 % of LV, 3 repetitions per day for 3 consecutive days 0, 50 % and 80 % of FS, repeated every 2 weeks during 3 months 4-1 Air matrix Zero air, laboratory air and ambient air at 0 and LV 4-2 Gas interference Test selected interferences at 0 and mean level in ambient air, test gas at 0 and LV of test gas 4-3 Temperature At LV From mean-10 C to mean+10 C by steps of 5 C 4-4 Humidity At LV 4-5 Hysteresis Increasing-decreasing-increasing cycles of the test gas levels used for pre-calibration From mean-20% to mean +20% by steps of 10% 4-6 Pressure overpressure 10 mbar and under pressure 5 mbar 4-7 Power supply effect At LV test under 210, 220 and 230 V 4-8 Wind velocity from 1 to 5 m/s (needed?) Lab experiments 0, LV, AT for each significant parameter: temperature -10 C, mean, mean -20%, mean, mean (model) and humidity (3 levels) and interference (2 levels) -10 C, if found significant %, if found significant At an automatic station equipped with reference 5-2 Field experiments method of measurements Cold start, warm 6 At LV
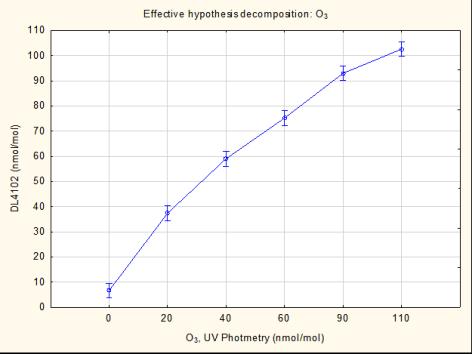
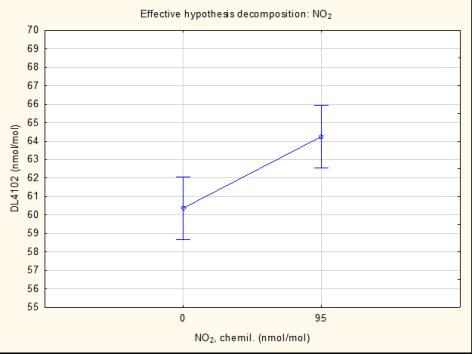
21 4.2 - Gaseous interference O 3 sensors Sensors/ NO 2 NO CO CO 2 NH 3 Interference, ppb Purified air ± 85 O3, ppb RH (%) T (ºC) 60 % 22 ºC 60 % 22 ºC 60 % 22 ºC 60 % 22 ºC 60 % 22 ºC Res 1 (n =2) 14.1 % % 9.8 % -6.2 % 6.0 % Res 2 (n =2) -3.3 % % -0.1 % -0.3 % Res 3 (n =2) 14.5 % -10 % 13.4 % 5.0 % 18 % Res 4 (n =2) 12.6 % -1.6 % -8.9 % 1.0 % 3.5 % Res 5 (n=2) Res 6 (n=2) Res 7 (n =1) Res 8 (n =2) 1.2 % -0.8 % 0.1 % -0.2 % -1.9 % Chem 1 (n =1) 89.3 % 1.3 % -0.9 % 0.2 % 1.2 % Chem 2 (n =2) Chem 3 (n = 2) 33.7 % -7.7 % -1.2 % -0.4 % 0.1 % Chem 4 (n=1) % -1.5 % -2.4 % 0.4 % 2.3 %
22 Tests Comments on test gas level or interferents Temperature, ºC Relative humidity, % 1 Response Time 0 to 80 % of full scale (FS) - 80% of FS to 0 2 Pre-calibration At least 3 levels of test gas (limit value LV) 3-1 Repeatability 0 and 80 % of FS, 3 repetitions every averaging time 3-2 Short term drift 3-3 Long term drift 0, 50 % and 80 % of LV, 3 repetitions per day for 3 consecutive days 0, 50 % and 80 % of LV, repeated every 2 weeks during 3 months 4-1 Air matrix Zero air, laboratory air and ambient air at 0 and LV 4-2 Gas interference Test selected interferences at 0 and mean level in ambient air, test gas at 0 and LV of test gas 4-3 Temperature At LV From mean-10 C to mean +10 C by steps of 5 C 4-4 Humidity At LV From mean-20% to mean +20% by steps of 10% 4-5 Hysteresis Increasing-decreasing-increasing cycles of the test gas levels used for pre-calibration 4-6 Pressure overpressure 10 mbar and under pressure 5 mbar 4-7 Power supply effect At LV test under 210, 220 and 230 V 4-8 Wind velocity from 1 to 5 m/s (needed?) Lab experiments 0, LV, AT for each significant parameter: temperature 5-1 (model) and humidity (3 levels) and interference (2 levels) At an automatic station equipped with reference 5-2 Field experiments -10 C, mean, mean -10 C, if found significant -20%, mean, mean + 20 %, if found significant
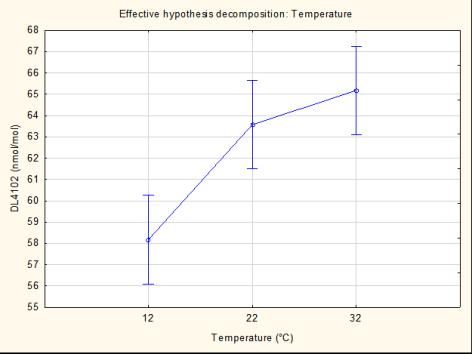
23 4.3 Temperature
24 Tests Comments on test gas level or interferents Temperature, ºC Relative humidity, % 1 Response Time 0 to 80 % of full scale (FS) - 80% of FS to 0 2 Pre-calibration At least 3 levels of test gas (limit value LV) 3-1 Repeatability 0 and 80 % of FS, 3 repetitions every averaging time 3-2 Short term drift 3-3 Long term drift 0, 50 % and 80 % of LV, 3 repetitions per day for 3 consecutive days 0, 50 % and 80 % of LV, repeated every 2 weeks during 3 months 4-1 Air matrix Zero air, laboratory air and ambient air at 0 and LV 4-2 Gas interference Test selected interferences at 0 and mean level in ambient air, test gas at 0 and LV of test gas 4-3 Temperature At LV From mean-10 C to mean+10 C by steps of 5 C 4-4 Humidity At LV From mean-20% to mean +20% by steps of 10% 4-5 Hysteresis Increasing-decreasing-increasing cycles of the levels used for pre-calibration 4-6 Pressure overpressure 10 mbar and under pressure 5 mbar 4-7 Power supply effect At LV test under 210, 220 and 230 V 4-8 Wind velocity from 1 to 5 m/s (needed?) Lab experiments 0, LV, AT for each significant parameter: temperature 5-1 (model) and humidity (3 levels) and interference (2 levels) At an automatic station equipped with reference 5-2 Field experiments method of measurements -10 C, mean, mean -10 C, if found significant -20%, mean, mean + 20 %, if found significant
25 4.5 - Hysteresis
26 Tests Comments on test gas level or interferents Temperature, ºC Relative humidity, % 1 Response Time 0 to 80 % of full scale (FS) - 80% of FS to 0 2 Pre-calibration At least 3 levels of test gas (limit value LV) 3-1 Repeatability 0 and 80 % of FS, 3 repetitions every averaging time 3-2 Short term drift 3-3 Long term drift 0, 50 % and 80 % of LV, 3 repetitions per day for 3 consecutive days 0, 50 % and 80 % of LV, repeated every 2 weeks during 3 months 4-1 Air matrix Zero air, laboratory air and ambient air at 0 and LV 4-2 Gas interference Test selected interferences at 0 and mean level in ambient air, test gas at 0 and LV of test gas 4-3 Temperature At LV From mean-10 C to mean+10 C by steps of 5 C 4-4 Humidity At LV 4-5 Hysteresis Increasing-decreasing-increasing cycles of the test gas levels used for pre-calibration From mean-20% to mean +20% by steps of 10% 4-6 Pressure overpressure 10 mbar and under pressure 5 mbar 4-7 Power supply effect At LV test under 210, 220 and 230 V 4-8 Wind velocity from 1 to 5 m/s (needed?) 5-1 Lab experiments 5-2 Field experiments Cold start, warm At least 3 gas test levels for each significant parameter: temp. and humidity (3 levels) and interference (2 levels) At an automatic station equipped with reference method of measurements -10 C, mean, mean -20%, mean, mean C, if found significant 20 %, if found significant
27 5.1 - Experimental design O 3, ppb NO 2, ppb Temp. Rel. Hum. Total levels 2 levels 3 levels 3 levels 108 trials
28 5.1 - Experimental design
29 Tests Comments on test gas level or interferents Temperature, ºC Relative humidity, % 1 Response Time 0 to 80 % of full scale (FS) - 80% of FS to 0 2 Pre-calibration At least 3 levels of test gas (limit value LV) 3-1 Repeatability 0 and 80 % of FS, 3 repetitions every averaging time 3-2 Short term drift 3-3 Long term drift 0, 50 % and 80 % of LV, 3 repetitions per day for 3 consecutive days 0, 50 % and 80 % of LV, repeated every 2 weeks during 3 months 4-1 Air matrix Zero air, laboratory air and ambient air at 0 and LV 4-2 Gas interference Test selected interferences at 0 and mean level in ambient air, test gas at 0 and LV of test gas 4-3 Temperature At LV From mean-10 C to mean+10 C by steps of 5 C 4-4 Humidity At LV 4-5 Hysteresis Increasing-decreasing-increasing cycles of the test gas levels used for pre-calibration From mean-20% to mean +20% by steps of 10% 4-6 Pressure overpressure 10 mbar and under pressure 5 mbar 4-7 Power supply effect At LV test under 210, 220 and 230 V 4-8 Wind velocity from 1 to 5 m/s (needed?) Lab experiments (model) Field experiments Cold start, warm start, hot start 0, LV, AT for each significant parameter: temperature and humidity (3 levels) and interference (2 levels) At an automatic station equipped with reference method of measurements -10 C, mean, mean -10 C, if found significant -20%, mean, mean + 20 %, if found significant At LV
30 5.2 Field tests, hourly values
31 5.2 Uncertainty and DQO Ø U = 2 (s² lof + s² bias s r,uv ² ) < DQO = 30 % U, ppb, Hourly values, validation datas 60 ppb 26 % 90 ppb 19 % 120 ppb 17 %
Protocol of evaluation and calibration of low-cost gas sensors for the monitoring of air pollution. L. Spinelle, M. Aleixandre and M.
 Protocol of evaluation and calibration of low-cost gas sensors for the monitoring of air pollution L. Spinelle, M. Aleixandre and M. Gerboles 0 1 3 Report EUR 611 EN European Commission Joint Research
Field evaluation of NanoEnvi microsensors for O 3 monitoring. M. Gerboles, I. Fumagalli, F. Lagler and S. Yatkin
 Field evaluation of NanoEnvi microsensors for O 3 monitoring M. Gerboles, I. Fumagalli, F. Lagler and S. Yatkin EUR 25156 EN - 2011 The mission of the JRC-IES is to provide scientific-technical support
Operation and Maintenance of Networking of CAAQM stations at Bangalore and Chennai.
 2014-15 CENTRAL POLLUTION NTROL BOARD ZONAL OFFICE (SOUTH), BENGALURU 560079 Project II-.Scientific & Technical Activities and R & D Operation and Maintenance of Networking of CAAQM stations at Bangalore
Seasonal prediction of extreme events
 Seasonal prediction of extreme events C. Prodhomme, F. Doblas-Reyes MedCOF training, 29 October 2015, Madrid Climate Forecasting Unit Outline: Why focusing on extreme events? Extremeness metric Soil influence
Monthly Report: Chevron Richmond Community Air Monitoring Program. Report Number: RCAMP_MO_11 Date: February RCAMP_MO_11 Page 1 of 26
 Monthly Report: Chevron Richmond Community Air Monitoring Program Report Number: RCAMP_MO_11 Date: February 2014 RCAMP_MO_11 Page 1 of 26 Table of Contents Table of Contents... 2 Executive Summary... 4
CCA Session in WG Source Apportionment
 Cross-Cutting Activity on Spatial Representativeness CCA Session in WG Source Apportionment Oliver Kracht European Commission Joint Research Centre I 106 Ispra (VA) www.jrc.ec.europa.eu FAIRMODE Technical
Station Maintenance and Calibration Report ABRAHAM LINCOLN BIRTHPLACE NATIONAL HISTORIC SITE March 13, 2007
 Station Maintenance and Calibration Report ABRAHAM LINCOLN BIRTHPLACE NATIONAL HISTORIC SITE March 13, 2007 National Park Service Gaseous Pollutant Monitoring Program Prepared by Air Resource Specialists,
Monthly Report: Chevron Richmond Community Air Monitoring Program. Report Number: RCAMP_MO_5 Date: August RCAMP_MO_5 Page 1 of 26
 Monthly Report: Chevron Richmond Community Air Monitoring Program Report Number: RCAMP_MO_5 Date: August 2013 RCAMP_MO_5 Page 1 of 26 Table of Contents Table of Contents... 2 Executive Summary... 4 1 Report
CERTIFICATE OF ACCREDITATION
 CERTIFICATE OF ACCREDITATION ANSI-ASQ National Accreditation Board 500 Montgomery Street, Suite 625, Alexandria, VA 22314, 877-344-3044 This is to certify that Hards Laboratories cc, t/a Technology Solutions
MAINTENANCE AND CALIBRATION REPORT NATIONAL PARK SERVICE GASEOUS POLLUTANT MONITORING NETWORK BADLANDS NATIONAL PARK MAY 10, 2006
 MAINTENANCE AND CALIBRATION REPORT NATIONAL PARK SERVICE GASEOUS POLLUTANT MONITORING NETWORK BADLANDS NATIONAL PARK MAY 10, 2006 prepared for John Ray NATIONAL PARK SERVICE Research and Monitoring Branch
Quality Assurance of Automated Measuring Systems: practical implementation of pren 14181:2001. Results of field experience at two Italian plants.
 Quality Assurance of Automated Measuring Systems: practical implementation of pren 14181:2001. Results of field experience at two Italian plants. Cipriano D. (1), Ferrari A. (2), Negri A. (1) (1) CESI
APPENDIX 3.6-A Support Information for Newcastle, Wyoming Meteorological Monitoring Site
 APPENDIX 3.6-A Support Information for Newcastle, Wyoming Meteorological Monitoring Site September 2012 3.6-A-i Appendix 3.6-A This page intentionally left blank September 2012 Appendix 3.6-A APPENDIX
Standard Practices for Air Speed Calibration Testing
 Standard Practices for Air Speed Calibration Testing Rachael V. Coquilla Bryza Wind Lab, Fairfield, California Air speed calibration is a test process where the output from a wind measuring instrument
A calibration facility for automatic weather stations
 METEOROLOGICAL APPLICATIONS Meteorol. Appl. 22: 842 846 (2015) Published online 16 November 2015 in Wiley Online Library (wileyonlinelibrary.com) DOI: 10.1002/met.1514 A calibration facility for automatic
Questions, Myths and Misconceptions about Using Photoionization Detectors
 Questions, Myths and Misconceptions about Using Photoionization Detectors Solvent, fuel and other VOC vapours are pervasively common in many workplace environments. Increased awareness of the toxicity
Review of Anemometer Calibration Standards
 Review of Anemometer Calibration Standards Rachael V. Coquilla rvcoquilla@otechwind.com Otech Engineering, Inc., Davis, CA Anemometer calibration defines a relationship between the measured signals from
An account of our efforts towards air quality monitoring in epitaxial graphene on SiC
 European Network on New Sensing Technologies for Air Pollution Control and Environmental Sustainability - EuNetAir COST Action TD1105 2 nd International Workshop EuNetAir on New Sensing Technologies for
WEATHER STATION FOR SOLAR FARM MONITORING
 WEATHER STATION FOR SOLAR FARM MONITORING SOLAR FARM MONITORING SYSTEM: Measures global, horizontal, & background irradiance. Measures wind speed, wind direction, ambient temperature, and relative humidity.
Assessing The Thermal Performance of Building Enclosure Materials Using A Medium-Size Hot Box Chamber Summer Meeting Torkan Fazli
 Assessing The Thermal Performance of Building Enclosure Materials Using A Medium-Size Hot Box Chamber 2014 Summer Meeting Torkan Fazli Introduction The building construction industry consumes significant
Concept Learning through General-to-Specific Ordering
 0. Concept Learning through General-to-Specific Ordering Based on Machine Learning, T. Mitchell, McGRAW Hill, 1997, ch. 2 Acknowledgement: The present slides are an adaptation of slides drawn by T. Mitchell
Weather Stations. Evaluation copy. 9. Post live weather data on the school s web site for students, faculty and community.
 Weather Stations Computer P6 Collecting and analyzing weather data can be an important part of your Earth Science curriculum. It might even be an ongoing part of your entire course. A variety of activities
Maximum Performance From Dry-Well Thermometer Calibrators. Mark Finch Product Manager EMEA Fluke Calibration
 Common Problems in Achieving Maximum Performance From Dry-Well Thermometer Calibrators Mark Finch Product Manager EMEA Fluke Calibration mark.finch@fluke.com Dry-well Thermal Uncertainties Temperature
Performance of Radar Wind Profilers, Radiosondes, and Surface Flux Stations at the Southern Great Plains (SGP) Cloud and Radiation Testbed (CART) Site
 Cloud and Radiation Testbed (CART) Site") Performance of Radar Wind Profilers, Radiosondes, and Surface Flux Stations at the Southern Great Plains (SGP) Cloud and Radiation Testbed (CART) Site R. L. Coulter, B. M. Lesht, M. L. Wesely, D. R. Cook,
Performance of Radar Wind Profilers, Radiosondes, and Surface Flux Stations at the Southern Great Plains (SGP) Cloud and Radiation Testbed (CART) Site R. L. Coulter, B. M. Lesht, M. L. Wesely, D. R. Cook,
Evaluation of Vaisala HMP45D Humidity Probes
 Instrument Test Report: 661 Evaluation of Vaisala HMP45D Humidity Probes J.Gorman Regional Instrument Centre 2 nd Jan 2002 Authorisation Bruce Forgan SRLR Regional Instrument Centre Distribution STNM STIE
TÜV RHEINLAND ENERGY GMBH ADDENDUM
 TÜV RHEINLAND ENERGY GMBH ADDENDUM Addendum to TÜV test report no. 936/21207522/A dated 23 March 2009 on performance testing of the SWAM 5a Dual Channel Monitor, SWAM 5a Monitor and SWAM 5a Dual Channel
Legacy Calibration of the Automatic Weather Station Model 2 of the United States Antarctic Program
 Legacy Calibration of the Automatic Weather Station Model 2 of the United States Antarctic Program G. A. Weidner 2, J. E. Thom 1, and M. A. Lazzara 1 1 Antarctic Meteorological Research Center Space Science
THE EFFECT OF PHOTOCATALYTIC BUILDING MATERIALS IN URBAN DEPOLLUTION
 THE EFFECT OF PHOTOCATALYTIC BUILDING MATERIALS IN URBAN DEPOLLUTION Th. Maggos, D. Kotzias, J.G Bartzis, N. Moussiopoulos Photocatalysis provides a very promising solution for pollutants removal compared
INSTALLATION OF PORTABLE O3 MONITORING STATION NATIONAL PARK SERVICE AMBIENT AIR QUALITY AND METEOROLOGY MONITORING NETWORK
 INSTALLATION OF PORTABLE O3 MONITORING STATION TIOL PARK SERVICE AMBIENT AIR QUALITY AND METEOROLOGY MONITORING NETWORK ASSATEAGUE ISLAND TIOL SEASHORE APRIL 24, 2006 prepared for John Ray TIOL PARK SERVICE
473 Dew Point Hygrometer
 High Performance Chilled Mirror Hygrometer With Cable Mounted Measuring Heads Highly precise chilled mirror dew point technology Cable mounted dew point and temperature measurement Aspirated and direct
DeFelsko PosiTector Dew Point Meter with Anemometer (DPMA)
") Management Procedure 2562 Revision: A Date Issued: March 24, 2017 Date Revised: Calibration Procedure DeFelsko PosiTector Dew Point Meter with Anemometer (DPMA) Table of Contents 1. Introduction and UUC
Management Procedure 2562 Revision: A Date Issued: March 24, 2017 Date Revised: Calibration Procedure DeFelsko PosiTector Dew Point Meter with Anemometer (DPMA) Table of Contents 1. Introduction and UUC
AMBIENT AIR MONITORING MONTHLY DATA REPORT
 MAXXAM ANALYTICS #1 2080 39 Ave. NE, Calgary, AB T2E 6P7 maxxam.ca Toll Free 800-386-7247 Fax 403-219-3673 AMBIENT AIR MONITORING MONTHLY DATA REPORT PEACE RIVER AREA MONITORING PROGRAM COMMITTEE RENO
M. Mielke et al. C5816
 Atmos. Chem. Phys. Discuss., 14, C5816 C5827, 2014 www.atmos-chem-phys-discuss.net/14/c5816/2014/ Author(s) 2014. This work is distributed under the Creative Commons Attribute 3.0 License. Atmospheric
WP3: In-situ chemical, physical and optical properties of aerosols. WP4: Trace gases networking: Volatile organic carbon and nitrogen oxides
 WP3: In-situ chemical, physical and optical properties of aerosols WP4: Trace gases networking: Volatile organic carbon and nitrogen oxides WP3: In-situ chemical, physical and optical properties of aerosols
PTA-427 BAROMETRIC PRESSURE TRANSDUCER OPERATOR S MANUAL
 PTA-427 BAROMETRIC PRESSURE TRANSDUCER OPERATOR S MANUAL REVISION: 4/95 COPYRIGHT 1991, 1995 CAMPBELL SCIENTIFIC, INC. WARRANTY AND ASSISTANCE The PTA-427 Barometric Pressure Transducer is warranted by
New Methodologies for Instrument Set point and Loop Uncertainty Calculations
 New Methodologies for Instrument Set point and Loop Uncertainty Calculations NuPIC 01 mposium for Nuclear Power Plant Instrumentation and Control) 0.11.01 Manik Singh (Instrumentation and control Engg.
UV3000. Accurate, precise, and portable ambient gas point analyzer
 UV3000 Accurate, precise, and portable ambient gas point analyzer The Cerex UV3000 is a multifunction analyzer designed to detect part per billion (ppb) to percent level concentrations of multiple gases
ASSESSMENT OF DIFFERENT WATER STRESS INDICATORS BASED ON EUMETSAT LSA SAF PRODUCTS FOR DROUGHT MONITORING IN EUROPE
 ASSESSMENT OF DIFFERENT WATER STRESS INDICATORS BASED ON EUMETSAT LSA SAF PRODUCTS FOR DROUGHT MONITORING IN EUROPE G. Sepulcre Canto, A. Singleton, J. Vogt European Commission, DG Joint Research Centre,
GRUAN Station Report for Ny-Ålesund
 WMO/IOC/UNEP/ICSU GLOBAL CLIMATE OBSERVING SYSTEM (GCOS) 8th GRUAN Implementation- Coordination Meeting (ICM-8) Boulder, USA 25 April 29 April 2016 Doc. 7.11 (05.IV.2016) Session 7 GRUAN Station Report
Non-Acoustical Inputs
 CHAPTER 18 Non-Acoustical Inputs This chapter discusses the use of external transducers and devices to provide non-acoustical data to the Model 831. Included are the following: 831-INT 831-INT Interface
NO X AT CAPE VERDE (CVO) Chris Reed, Katie Read, Luis Mendes, James Lee, Lucy Carpenter
 Chris Reed, Katie Read, Luis Mendes, James Lee, Lucy Carpenter") NO X AT CAPE VERDE (CVO) Chris Reed, Katie Read, Luis Mendes, James Lee, Lucy Carpenter The Cape Verde Atmospheric Observatory (CVO) Observatory established in 2006 as global GAW station. Only GAW global
NO X AT CAPE VERDE (CVO) Chris Reed, Katie Read, Luis Mendes, James Lee, Lucy Carpenter The Cape Verde Atmospheric Observatory (CVO) Observatory established in 2006 as global GAW station. Only GAW global
ISEmax CAM40/CAS40. Technical Information
 Technical Information Online measurement of nutrient parameters Ion-selective electrode system for the continuous measurement of ammonium and nitrate Application The ion-selective electrode system works
Monthly probabilistic drought forecasting using the ECMWF Ensemble system
 Monthly probabilistic drought forecasting using the ECMWF Ensemble system Christophe Lavaysse(1) J. Vogt(1), F. Pappenberger(2) and P. Barbosa(1) (1) European Commission (JRC-IES), Ispra Italy (2) ECMWF,
EAS 535 Laboratory Exercise Weather Station Setup and Verification
 EAS 535 Laboratory Exercise Weather Station Setup and Verification Lab Objectives: In this lab exercise, you are going to examine and describe the error characteristics of several instruments, all purportedly
Application and verification of ECMWF products 2012
 Application and verification of ECMWF products 2012 Instituto Português do Mar e da Atmosfera, I.P. (IPMA) 1. Summary of major highlights ECMWF products are used as the main source of data for operational
e-newsletter n 6 August 31 st, 2018 New calibration facility developed at PTB for relative humidity, associated to dtdlas transfer standard
 e-newsletter n 6 August 31 st, 2018 New calibration facility developed at PTB for relative humidity, associated to dtdlas transfer standard PTB has developed a test facility to characterize humidity sensors
_02 / 2 February 2015
 Test report: 936/21211350/B of 7 October 2011 Initial certification: 12 February 2010 renewal (previous certificate 0000025927_01 of 16 March 2012 valid until 11 February 2015) Date of expiry: 11 February
WeatherHawk Weather Station Protocol
 WeatherHawk Weather Station Protocol Purpose To log atmosphere data using a WeatherHawk TM weather station Overview A weather station is setup to measure and record atmospheric measurements at 15 minute
Specifications for a Reference Radiosonde for the GCOS Reference. Upper-Air Network (GRUAN)
") Specifications for a Reference Radiosonde for the GCOS Reference Upper-Air Network (GRUAN) By the Working Group on Atmospheric Reference Observations (WG-ARO) Final Version, October 2008 1. Introduction
Specifications for a Reference Radiosonde for the GCOS Reference Upper-Air Network (GRUAN) By the Working Group on Atmospheric Reference Observations (WG-ARO) Final Version, October 2008 1. Introduction
Twice-Annual Station Maintenance and Calibration Report BIG BEND NATIONAL PARK February 1, 2012
 Twice-Annual Station Maintenance and Calibration Report BIG BEND NATIONAL PARK February 1, 212 National Park Service Gaseous Pollutant Monitoring Program Prepared by Air Resource Specialists, Inc. under
Mobile Meteorological Measurements during the 2015 Toronto Games
 Mobile Meteorological Measurements during the 2015 Toronto Games PanAm/ParaPanAm Legacy Workshop January 12, 2017 Timothy Wiechers & James Voogt Overview A total of 23 vehicle traverses were completed
Components of uncertainty in measurements by means of AWS
 Components of uncertainty in measurements by means of AWS G. Coppa, F. Sanna, C. Musacchio, A. Merlone INRiM Istituto Nazionale di Ricerca Metrologica Outline Metrology and Meteorology Uncertainty in temperature
Calibration of Paroscientific Model 205 Pressure Sensor for use at Heard Island.
 INSTRUMENT TEST REPORT NUMBER 67 Calibration of Paroscientific Model 05 Pressure Sensor for use at Heard Island. Kent Gregory & Paul Huysing Physics Laboratory, OEB 15 July, 1994 Authorisation Jane Warne
Calibration of Temperature Block Calibrators
 European Association of National Metrology Institutes Calibration of Temperature Block Calibrators EURAMET cg-13 Version 2.0 (03/2011) Previously EA-10/13 Calibration Guide EURAMET cg-13 Version 2.0 (03/2011)
THM80X Series Feature Application. Temperature & Humidity / Flow Measuring Specialist
 THM80X Series Feature Application IP67 protection degree, rugged aluminum case, fit in variety harsh environment Capable of temperature compensation Linear adjustment temperature & humidity by computer,
CALIOPE EU: Air Quality
 CALIOPE EU: Air Quality CALIOPE EU air quality forecast application User Guide caliope@bsc.es Version 30/09/2015 TABLE OF CONTENTS 1. Description... 1 2. Installation... 1 3. User Guide... 2 3.1 Air quality
CONTENT 2. ORGANIZATION 3. SERVICES. instruments. (3)Activities of RIC Tsukuba
Activities of RIC Tsukuba") 1 CONTENT 1. INTRODUCTION 2. ORGANIZATION 3. SERVICES (1)Quality assurance of meteorological instruments (2)Research and development (3)Activities of RIC Tsukuba 2 Meteorological Instruments Center (MIC)
1 CONTENT 1. INTRODUCTION 2. ORGANIZATION 3. SERVICES (1)Quality assurance of meteorological instruments (2)Research and development (3)Activities of RIC Tsukuba 2 Meteorological Instruments Center (MIC)
A sensitivity and uncertainty analysis. Ministry of the Walloon Region Agricultural Research Centre
 Development of an agrometeorological model integrating leaf wetness duration estimation and weather radar data to assess the risk of head blight infection in wheat A sensitivity and uncertainty analysis
Applications of Meteorological Tower Data at Kennedy Space Center
 1st AIAA Atmospheric and Space Environments Conference 22-25 June 2009, San Antonio, Texas AIAA 2009-3533 Applications of Meteorological Tower Data at Kennedy Space Center Karen M. Altino 1 NASA/Marshall
Conceptual Model for Ozone in the Austin-Round Rock Metropolitan Statistical Area
 CAPCOG FY14-15 PGA FY14-1 Deliverable 5.1.2 Amendment 1 Conceptual Model for Ozone in the Austin-Round Rock Metropolitan Statistical Area Prepared by the Capital Area Council of Governments October 8,
1 INTRODUCTION 2 DESCRIPTION OF THE MODELS. In 1989, two models were able to make smog forecasts; the MPA-model and
 The national smog warning system in The Netherlands; a combination of measuring and modelling H. Noordijk Laboratory of Air Research, National Institute of Public Health and Environmental Protection (WFM;,
2 April 2004 Copenhagen, Denmark
 Seminar: Sampling, Real-time Monitoring and Conditioning of Air Samples for Determination of Particle Mass R&P Technology Roadmap PM Measurement Issues FDMS System 2 April 2004 Copenhagen, Denmark Michael
VOC measurements in ambient air using Selected Ion Flow Tube Mass Spectrometry-automation and calibration considerations
 VOC measurements in ambient air using Selected Ion Flow Tube Mass Spectrometry-automation and calibration considerations Environmental Chemistry group, water Science Forum and the Separation Science Group
PORTABLE MULTIFUCTION DATA-LOGGER INSTRUMENT DO 9847
 MF-2 DO 9847 PORTABLE MULTIFUCTION DATA-LOGGER INSTRUMENT DO 9847 DO9847 is a multifunctional handheld board instrument and datalogger. It is provided with a 128x64 pixel (56x38 mm) graphic display and
The Challenge of. Guy Brasseur
 The Challenge of Monitoring and Predicting Chemical Weather Guy Brasseur Introduction: What is Chemical Weather? What is Chemical Weather? Local, regional, and global distributions of important trace gases
Uncertainty in Ammonia Flux Measurement Systems
 Uncertainty in Ammonia Flux Measurement Systems Cale Boriack Sergio Capareda, Ronald Lacey, Atilla Mutlu, Saqib Mukhtar, Bryan Shaw, Calvin Parnell, Jr. Biological and Agricultural Engineering Department
MASTERING VOC DETECTION FOR BETTER INDOOR AIR QUALITY
 European Network on New Sensing Technologies for Air Pollution Control and Environmental Sustainability - EuNetAir COST Action TD1105 WGs and MC Meeting at ISTANBUL, 3-5 December 2014 Action Start date:
Comparison of V and 10 V DC Voltage References
 Comparison of 1.018 V and 10 V DC Voltage References Technical protocol for BIPM.EM-K11.a and.b comparisons 1. Introduction The Mutual Recognition Arrangement among National Metrology Institutes (NMIs)
Real Time On-Site Odor and VOC Emission Measurements Using a znose
 Real Time On-Site Odor and VOC Emission Measurements Using a znose Edward J. Staples, Electronic Sensor Technology, EST@ESTCAL.COM Remediation Site Description Remediation of contaminated soil from where
International Pyrheliometer Comparison IPC-XII
 t h The 12 t h International Pyrheliometer Comparison IPC-XII 29. September 2016, TECO-2016, Madrid Wolfgang Finsterle Physikalisch-Meteorologisches Observatorium Davos World Radiation Center Outline What
5. AN INTRODUCTION TO BUILDING PHYSICS
 5. AN INTRODUCTION TO BUILDING PHYSICS P. Wouters, S. Martin ABSTRACT This chapter places the System Identification Competition in a broader context of evaluating the thermal performances of building components.
Using sensor data and inversion techniques to systematically reduce dispersion model error
 Using sensor data and inversion techniques to systematically reduce dispersion model error D. J. Carruthers 1, A. L. Stidworthy 1, D. Clarke 2, K.J. Dicks 3, R. L. Jones 4,I. Leslie 5, O. A. M. Popoola
Regional Production, Quarterly report on the daily analyses and forecasts activities, and verification of the CHIMERE performances
 ECMWF COPERNICUS REPORT Copernicus Atmosphere Monitoring Service Regional Production, Quarterly report on the daily analyses and forecasts activities, and verification of the CHIMERE performances September
473 Dew Point Hygrometer
 gh Performance Chilled Hygrometer With Cable Mounted Measuring Heads ghly precise chilled mirror dew point technology Cable mounted dew point and temperature measurement Aspirated and direct insertion
WMO number: Internal Station number: same as WMO number, historic AWOS documents refer to the station as A19. Current Station Location
 Basic Climatological Station Metadata Current Status (draft in word by gjh, 28.01.09, DGCA to complete all areas highlighted in yellow color) Metadata compiled: 2009 Station: Kuwait City WMO number: 40581
MICHELL TECHNOLOGIES FOR MOISTURE. Calibration. General Principles & Theory, Equipment Considerations
 Calibration General Principles & Theory, Equipment Considerations Metrological Principles Accurate but not Precise Calibration A A+ Correction = Precise but not Accurate Correction B Ref Std (Radio Link
HCL Series Miniature compensated low pressure sensors
 FEATURES 0... 5 to 0... 5, differential or gage Calibrated and temperature compensated Matched pressure volumes Miniature SMT and SIL housings RoHS compliant SPECIFICATIONS Maximum ratings EQUIVALENT CIRCUIT
Practical Use of Metal Oxide Semiconductor Gas Sensors for Measuring Nitrogen Dioxide and Ozone in Urban Environments
 sensors Article Practical Use of Metal Oxide Semiconductor Gas Sensors for Measuring Nitrogen Dioxide and Ozone in Urban Environments Philip J. D. Peterson 1, Amrita Aujla 1, Kirsty H. Grant 1, Alex G.
AMBIENT AIR MONITORING MONTHLY DATA REPORT
 MAXXAM ANALYTICS #1 2080 39 Ave. NE, Calgary, AB T2E 6P7 maxxam.ca Toll Free 800-386-7247 Fax 403-219-3673 AMBIENT AIR MONITORING MONTHLY DATA REPORT PEACE RIVER AREA MONITORING PROGRAM COMMITTEE THREE
McArthur River Mining Borroloola Caravan and Devils Spring Stations
 Borroloola Caravan and Devils Spring Ambient Air Quality Monitoring Validated Report 1 st July 2016 31 st July 2016 Report No.: DAT10991 Report issue date: 25 th August 2016 Maintenance contract: MC1100,
HD32.2 WBGT Index HD32.3 WBGT-PMV. [ GB ] - WBGT index. - PMV index and PPD
![HD32.2 WBGT Index HD32.3 WBGT-PMV. [ GB ] - WBGT index. - PMV index and PPD](/thumbs/86/93979631.jpg "HD32.2 WBGT Index HD32.3 WBGT-PMV. [ GB ] - WBGT index. - PMV index and PPD") HD32.2 WBGT Index HD32.3 WBGT-PMV [ GB ] - WBGT index. - PMV index and PPD [ GB ] [ GB ] Description HD32.2 WBGT Index is an instrument made by Delta Ohm srl for the analysis of WBGT index (Wet Bulb Glob
HD32.2 WBGT Index HD32.3 WBGT-PMV [ GB ] - WBGT index. - PMV index and PPD [ GB ] [ GB ] Description HD32.2 WBGT Index is an instrument made by Delta Ohm srl for the analysis of WBGT index (Wet Bulb Glob
The AWS based operational urban network in Milano: achievements and open questions.
 The AWS based operational urban network in Milano: achievements and open questions. Frustaci Giuseppe, Curci Savino, Pilati Samantha, Lavecchia Cristina, Paganelli Chiara Fondazione Osservatorio Meteorologico
Uncertainties associated with the use of a sound level meter
 NPL REPORT DQL-AC 002 Uncertainties associated with the use of a sound level meter Richard Payne April 2004 April 2004 ABSTRACT Uncertainties associated with the use of a sound level meter Richard Payne
Comparative analysis of data collected by installed automated meteorological stations and manual data in Central Asia.
 Comparative analysis of data collected by installed automated meteorological stations and manual data in Central Asia. Merkushkin Aleksandr Uzhydromet 71 K. Makhsumov str., 100052 Tashkent, Uzbekistan
Overview of the Thunderbird Micronet
 Fall 2004 Dr. Petra Klein Sean Arms Overview of the Thunderbird Micronet Introduction The Lake Thunderbird Micronet is a micrometeorological measurement network intended to obtain data on fine-scale spatial
Application and verification of the ECMWF products Report 2007
 Application and verification of the ECMWF products Report 2007 National Meteorological Administration Romania 1. Summary of major highlights The medium range forecast activity within the National Meteorological
PURCHASE OF LAB EQUIPMENTS FOR CHEMISTRY [Kindly enclose a signed copy of this document along with the TENDER Document]
![PURCHASE OF LAB EQUIPMENTS FOR CHEMISTRY [Kindly enclose a signed copy of this document along with the TENDER Document]](/thumbs/95/126290014.jpg "PURCHASE OF LAB EQUIPMENTS FOR CHEMISTRY [Kindly enclose a signed copy of this document along with the TENDER Document]") T.K.M. COLLEGE OF ARTS & SCIENCE KOLLAM, Kerala 6900, INDIA www.tkmcas.ac.in Tender No 20/FIST/ ITEMS PURCHASE OF LAB EQUIPMENTS FOR CHEMISTRY [Kindly enclose a signed copy of this document along with
T.K.M. COLLEGE OF ARTS & SCIENCE KOLLAM, Kerala 6900, INDIA www.tkmcas.ac.in Tender No 20/FIST/ ITEMS PURCHASE OF LAB EQUIPMENTS FOR CHEMISTRY [Kindly enclose a signed copy of this document along with
Meteorological QA/QC
 Meteorological QA/QC Howard Schmidt, MS, MBA US EPA Region 3 Air Protection Division Air Monitoring Quality Assurance Workshop June 26, 2014 Overview Current state of R3 agency met monitoring Why? Where?
Alphasense Ltd. Compliance Statements and Certificates. Contents. The Restriction of the Use of Certain Hazardous Substances (RoHS)...
...") Alphasense Ltd Compliance Statements and Certificates Contents The Restriction of the Use of Certain Hazardous Substances (RoHS)... 2 Waste Electrical and Electronic Equipment (WEEE)... 3 Registration,
Alphasense Ltd Compliance Statements and Certificates Contents The Restriction of the Use of Certain Hazardous Substances (RoHS)... 2 Waste Electrical and Electronic Equipment (WEEE)... 3 Registration,
Overview. TC Thermometry Graham Machin. Introduction to TC-T Annual meeting Selected comparisons TC-T training for future thermal metrologists
 TC Thermometry Graham Machin Euramet GA 2 June 2015 Overview Introduction to TC-T Annual meeting Selected comparisons TC-T training for future thermal metrologists Workshops COOMET TC-T links EMPIR project
Electronic Station Data Definitions
 Electronic Station Data Definitions CODE DATE TIME Station Code Date and time of OBS TYPE Observation Type ST - "Standard Observations" collected at 0600 and 1800, RAW - hourly s collected every hour,
Verification of the meteorological observations on the EPN stations
 Institute of Geodesy and Geoinformatics Wroclaw University of Environmental and Life Sciences Verification of the meteorological observations on the EPN stations Jarosław aw Bosy Witold Rohm bosy@kgf.ar.wroc.pl;
Collective Awareness Platform for Tropospheric Ozone Pollution
 Collective Awareness Platform for Tropospheric Ozone Pollution Work package WP2 Deliverable number D2.3 Deliverable title Software tool for Ozone Concentration Estimation Development Deliverable type R
PMF2000 Series DESCRIPTION FEATURES APPLICATIONS MAXIMUM RATINGS MASS AIR FLOW SENSOR
 DESCRIPTION PMF2000 features Posifa s third-generation thermal flow die, benefiting from the latest innovations in microfabrication. The sensor die uses a pair of thermopiles to detect changes in temperature
Regional Production, Quarterly report on the daily analyses and forecasts activities, and verification of the EURAD-IM performances
 ECMWF COPERNICUS REPORT Copernicus Atmosphere Monitoring Service Regional Production, Quarterly report on the daily analyses and forecasts activities, and verification of the EURAD-IM performances March
STATUS OF THE WIGOS DEMONSTRATION PROJECTS
 STATUS OF THE WIGOS DEMONSTRATION PROJECTS Demonstration Project Morocco Strengthening Moroccan RIC Capacities (Submitted by Rabia Merrouchi, National Meteorological Service of Morocco (DMN)) February
Comparison between air temperature measured inside a conventional large wood shelter and by means of present day screens
 Comparison between air temperature measured inside a conventional large wood shelter and by means of present day screens Franco Stravisi, Stefano Cirilli (University of Trieste, Department of Mathematics
HERU Modbus. Reference Modbus addresses for HERU (Gen 3)
") HERU Modbus Reference Modbus addresses for HERU 62-250 (Gen 3) Modbus Registers HERU v0.7.xls Coil status (1bit) RW 5.6.2016 Coil status Discrete Output (1bit) R/W Modbus Register Name Description Application
HERU Modbus Reference Modbus addresses for HERU 62-250 (Gen 3) Modbus Registers HERU v0.7.xls Coil status (1bit) RW 5.6.2016 Coil status Discrete Output (1bit) R/W Modbus Register Name Description Application
Automated Stability Testing Delivering Rapid Product Development
 Automated Stability Testing Delivering Rapid Product Development Dr Andy Brookes, AstraZeneca APS PharmSci 2-4 th September 2013 With thanks to: Pam Harrison, Helen Porter, Faye Turner, Arun Kamath The
Regional Production, Quarterly report on the daily analyses and forecasts activities, and verification of the MATCH performances
 ECMWF COPERNICUS REPORT Copernicus Atmosphere Monitoring Service Regional Production, Quarterly report on the daily analyses and forecasts activities, and verification of the MATCH performances September
Instrument types and performance characteristics
 2 Instrument types and performance characteristics 2.1 Review of instrument types Instruments can be subdivided into separate classes according to several criteria. These subclassifications are useful