Lecture 2: Supervised vs. unsupervised learning, bias-variance tradeoff
|
|
|
- Marian Robinson
- 5 years ago
- Views:
Transcription
1 Lecture 2: Supervised vs. unsupervised learning, bias-variance tradeff Reading: Chapter 2 STATS 202: Data mining and analysis September 27, / 20
2 Supervised vs. unsupervised learning In unsupervised learning we seek t understand the relatinships between variables in a data matrix: Samples r bservatins Variables r factrs 2 / 20
3 Supervised vs. unsupervised learning In unsupervised learning we seek t understand the relatinships between variables in a data matrix: Samples r bservatins Variables r factrs Quantitative variables, eg. weight, height, number f children,... 2 / 20
4 Supervised vs. unsupervised learning In unsupervised learning we seek t understand the relatinships between variables in a data matrix: Samples r bservatins Variables r factrs Qualitative variables, eg. cllege majr, prfessin, gender,... 2 / 20
5 Supervised vs. unsupervised learning In unsupervised learning we seek t understand the relatinships between variables in a data matrix: Our gal is t: Find meaningful relatinships between the variables. Crrelatin analysis. Find lw-dimensinal representatins f the data which make it easy t visualize the variables. PCA, ICA, ismap, lcally linear embeddings, etc. Find meaningful grupings f the data. Clustering. 3 / 20
6 Supervised vs. unsupervised learning In supervised learning, there are input variables, and utput variables: Samples Input variables Output variable Variables r factrs 4 / 20
7 Supervised vs. unsupervised learning In supervised learning, there are input variables, and utput variables: Samples Input variables Output variable If quantitative, we say this is a regressin prblem Variables r factrs 4 / 20
8 Supervised vs. unsupervised learning In supervised learning, there are input variables, and utput variables: Samples Input variables Output variable If qualitative (categrical), we say this is a classificatin prblem Variables r factrs 4 / 20
9 Supervised vs. unsupervised learning In supervised learning, there are input variables, and utput variables: If X is the vectr f inputs fr a particular sample. The utput variable is mdeled by: Y = f(x) + ε }{{} Randm errr The functin f captures the systematic relatinship between X and Y. f is fixed and unknwn. ɛ represents the unpredictable "nise" in the prblem. Our gal is t learn the functin f, using a set f training samples. 5 / 20
10 Supervised vs. unsupervised learning Mtivatins: Y = f(x) + ε }{{} Randm errr Predictin: Useful when the input variable is readily available, but the utput variable is nt. Example: Predict stck prices next mnth using data frm last year. Inference: A mdel fr f can help us understand the structure f the data which variables influence the utput, and which dn t? What is the relatinship between each variable and the utput, e.g. linear, nn-linear? Example: What is the influence f genetic variatins n the incidence f heart disease. 6 / 20
11 Parametric and nnparametric methds: Mst supervised learning methds fall int ne f tw classes: Parametric methds: We assume that f takes a specific frm. Fr example, a linear frm: f(x) = X 1 β X p β p with parameters β 1,..., β p. Using the training data, we try t fit the parameters. Nn-parametric methds: We dn t make any assumptins n the frm f f, but we restrict hw wiggly r rugh the functin can be. 7 / 20
12 Incme Incme Parametric vs. nnparametric predictin Years f Educatin Senirity Years f Educatin Senirity Figures 2.4 and 2.5 Parametric methds have a limit f fit quality. Nn-parametric methds keep imprving as we add mre data t fit. Parametric methds are ften simpler t interpret. 8 / 20
13 Predictin errr Training data: (x 1, y 1 ), (x 2, y 2 )... (x n, y n ) Predicted functin: ˆf, which is based n these data. What is a gd chice fr ˆf? Our gal in supervised learning is t minimize the predictin errr: Fr a new datapint (x 0, y 0 ) (nt used in training) we want the squared errr (y 0 ˆf(x 0 )) 2 t be small. Given many test data {(x i, y i ); i = 1,..., m} which were nt used t fit the mdel, a cmmn measure f quality f ˆf is the test mean squared errr (MSE): MSE test ( ˆf) = 1 m m (y i ˆf(x i)) 2. i=1 9 / 20
14 Predictin errr What if we dn t have any test data? It is tempting t use instead the training MSE: MSE training ( ˆf) = 1 n n (y i ˆf(x i )) 2. i=1 The main challenge f statistical learning is that a lw training MSE des nt imply a lw test MSE. 10 / 20
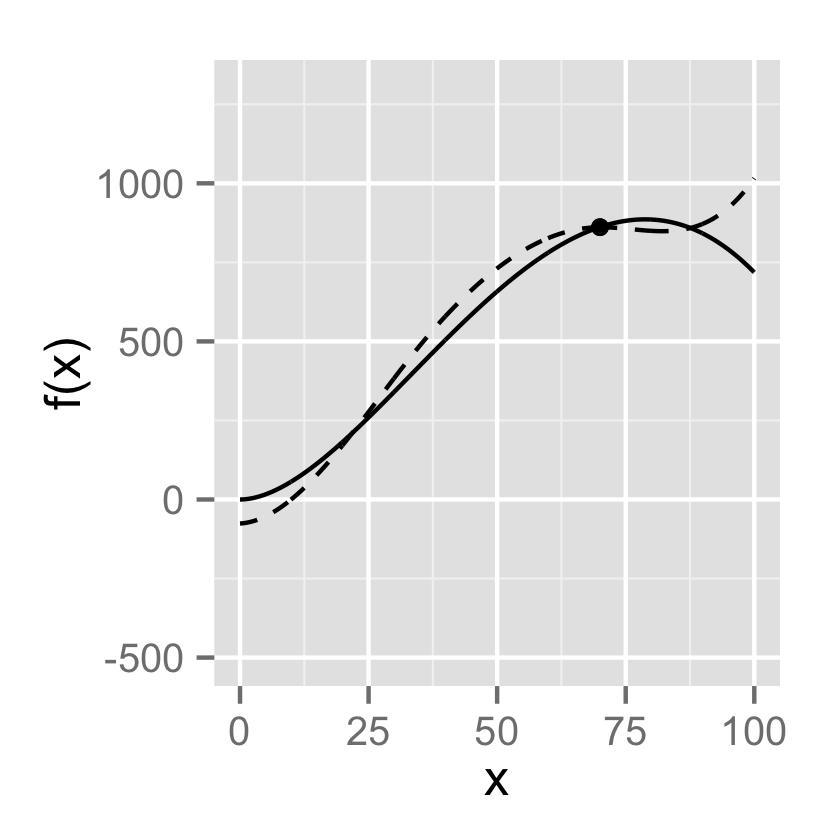
15 Figure 2.9. Y Mean Squared Errr X Flexibility The circles are simulated data frm the black curve. In this artificial example, we knw what f is. 11 / 20
16 Figure 2.9. Y Mean Squared Errr X Flexibility Three estimates ˆf are shwn: 1. Linear regressin. 2. Splines (very smth). 3. Splines (quite rugh). 11 / 20
17 Figure 2.9. Y Mean Squared Errr X Flexibility Red line: Test MSE. Gray line: Training MSE. 11 / 20
18 Figure 2.10 Y Mean Squared Errr X Flexibility The functin f is nw almst linear. 12 / 20
19 Figure 2.11 Y Mean Squared Errr X Flexibility When the nise ε has small variance, the third methd des well. 13 / 20
20 The bias variance decmpsitin Let x 0 be a fixed test pint, y 0 = f(x 0 ) + ε 0, and ˆf be estimated frm n training samples (x 1, y 1 )... (x n, y n ). Let E dente the expectatin ver y 0 and the training data. Then, the expected test MSE at x 0 can be decmpsed: E(y 0 ˆf(x 0 )) 2 = Var( ˆf(x 0 )) + [Bias( ˆf(x 0 ))] 2 + Var(ε 0 ). 14 / 20
21 The bias variance decmpsitin Let x 0 be a fixed test pint, y 0 = f(x 0 ) + ε 0, and ˆf be estimated frm n training samples (x 1, y 1 )... (x n, y n ). Let E dente the expectatin ver y 0 and the training data. Then, the expected test MSE at x 0 can be decmpsed: E(y 0 ˆf(x 0 )) 2 = Var( ˆf(x 0 )) + [Bias( ˆf(x 0 ))] 2 + Var(ε 0 ). Irreducible errr 14 / 20
22 The bias variance decmpsitin Let x 0 be a fixed test pint, y 0 = f(x 0 ) + ε 0, and ˆf be estimated frm n training samples (x 1, y 1 )... (x n, y n ). Let E dente the expectatin ver y 0 and the training data. Then, the expected test MSE at x 0 can be decmpsed: E(y 0 ˆf(x 0 )) 2 = Var( ˆf(x 0 )) + [Bias( ˆf(x 0 ))] 2 + Var(ε 0 ). The variance f the estimate f Y : E[ ˆf(x 0 ) E( ˆf(x 0 ))] 2 This measures hw much the estimate f ˆf at x 0 changes when we sample new training data. 14 / 20
23 The bias variance decmpsitin Let x 0 be a fixed test pint, y 0 = f(x 0 ) + ε 0, and ˆf be estimated frm n training samples (x 1, y 1 )... (x n, y n ). Let E dente the expectatin ver y 0 and the training data. Then, the expected test MSE at x 0 can be decmpsed: E(y 0 ˆf(x 0 )) 2 = Var( ˆf(x 0 )) + [Bias( ˆf(x 0 ))] 2 + Var(ε 0 ). The squared bias f the estimate f Y : [E( ˆf(x 0 )) f(x 0 )] 2 This measures the deviatin f the average predictin ˆf(x 0 ) frm the truth f(x 0 ). 14 / 20
24 15 / 20
25 15 / 20
26 15 / 20
27 Implicatins f bias variance decmpsitin E(y 0 ˆf(x 0 )) 2 = Var( ˆf(x 0 )) + [Bias( ˆf(x 0 ))] 2 + Var(ε). The expected MSE is never smaller than the irreducible errr. Bth small bias and small variance are needed fr small expected MSE. Easy t find zer variance prcedure with high bias (predict a cnstant value) and very lw bias prcedure with high variance (chse ˆf passing thrugh every training pint). In practice, best expected MSE achieved by incurring sme bias t decrease variance and vice-versa: this is the bias-variance trade-ff. Rule f thumb: Mre flexible methds Higher variance and Lwer Bias. Example: Linear fit may nt change substantially with training data but has high bias if f is very nn-linear. 16 / 20
28 Squiggly f, high nise Linear f, high nise Squiggly f, lw nise MSE Bias Var Flexibility Flexibility Flexibility Figure / 20
29 Classificatin prblems In a classificatin setting, the utput takes values in a discrete set. Fr example, if we are predicting the brand f a car based n a number f variables, the functin f takes values in the set {Frd, Tyta, Mercedes-Benz,... }. We adpt sme additinal ntatin: P (X, Y ) : jint distributin f (X, Y ), P (Y X) : cnditinal distributin f Y given X, ŷ i : predictin fr x i. 18 / 20
30 Lss functin fr classificatin There are many ways t measure the errr f a classificatin predictin. One f the mst cmmn is the 0-1 lss: 1(y 0 ŷ 0 ) As with squared errr, we can cmpute average test preditin errr (called test errr rate under 0-1 lss) using previusly unseen test data {(x i, y i ); i = 1,..., m}: 1 m m 1(y i ŷ i) i=1 Similarly, we can cmpute the (usually ptimistic) training errr rate 1 n 1(y i ŷ i ) n i=1 19 / 20
31 Bayes classifier X1 X2 Figure 2.13 In practice, we never knw the jint prbability P. Hwever, we can assume that it exists. The Bayes classifier assigns: ŷ i = argmax j P (Y = j X = x i ) It can be shwn that this is the best classifier under the 0-1 lss. 20 / 20
Lecture 2: Supervised vs. unsupervised learning, bias-variance tradeoff
 Lecture 2: Supervised vs. unsupervised learning, bias-variance tradeff Reading: Chapter 2 STATS 202: Data mining and analysis September 27, 2017 1 / 20 Supervised vs. unsupervised learning In unsupervised
What is Statistical Learning?
 What is Statistical Learning? Sales 5 10 15 20 25 Sales 5 10 15 20 25 Sales 5 10 15 20 25 0 50 100 200 300 TV 0 10 20 30 40 50 Radi 0 20 40 60 80 100 Newspaper Shwn are Sales vs TV, Radi and Newspaper,
Simple Linear Regression (single variable)
") Simple Linear Regressin (single variable) Intrductin t Machine Learning Marek Petrik January 31, 2017 Sme f the figures in this presentatin are taken frm An Intrductin t Statistical Learning, with applicatins
Simple Linear Regressin (single variable) Intrductin t Machine Learning Marek Petrik January 31, 2017 Sme f the figures in this presentatin are taken frm An Intrductin t Statistical Learning, with applicatins
Lecture 3: Principal Components Analysis (PCA)
") Lecture 3: Principal Cmpnents Analysis (PCA) Reading: Sectins 6.3.1, 10.1, 10.2, 10.4 STATS 202: Data mining and analysis Jnathan Taylr, 9/28 Slide credits: Sergi Bacallad 1 / 24 The bias variance decmpsitin
Lecture 3: Principal Cmpnents Analysis (PCA) Reading: Sectins 6.3.1, 10.1, 10.2, 10.4 STATS 202: Data mining and analysis Jnathan Taylr, 9/28 Slide credits: Sergi Bacallad 1 / 24 The bias variance decmpsitin
Part 3 Introduction to statistical classification techniques
 Part 3 Intrductin t statistical classificatin techniques Machine Learning, Part 3, March 07 Fabi Rli Preamble ØIn Part we have seen that if we knw: Psterir prbabilities P(ω i / ) Or the equivalent terms
k-nearest Neighbor How to choose k Average of k points more reliable when: Large k: noise in attributes +o o noise in class labels
 Mtivating Example Memry-Based Learning Instance-Based Learning K-earest eighbr Inductive Assumptin Similar inputs map t similar utputs If nt true => learning is impssible If true => learning reduces t
Resampling Methods. Cross-validation, Bootstrapping. Marek Petrik 2/21/2017
 Resampling Methds Crss-validatin, Btstrapping Marek Petrik 2/21/2017 Sme f the figures in this presentatin are taken frm An Intrductin t Statistical Learning, with applicatins in R (Springer, 2013) with
Comparing Several Means: ANOVA. Group Means and Grand Mean
 STAT 511 ANOVA and Regressin 1 Cmparing Several Means: ANOVA Slide 1 Blue Lake snap beans were grwn in 12 pen-tp chambers which are subject t 4 treatments 3 each with O 3 and SO 2 present/absent. The ttal
Pattern Recognition 2014 Support Vector Machines
 Pattern Recgnitin 2014 Supprt Vectr Machines Ad Feelders Universiteit Utrecht Ad Feelders ( Universiteit Utrecht ) Pattern Recgnitin 1 / 55 Overview 1 Separable Case 2 Kernel Functins 3 Allwing Errrs (Sft
Bootstrap Method > # Purpose: understand how bootstrap method works > obs=c(11.96, 5.03, 67.40, 16.07, 31.50, 7.73, 11.10, 22.38) > n=length(obs) >
 > n=length(obs) >") Btstrap Methd > # Purpse: understand hw btstrap methd wrks > bs=c(11.96, 5.03, 67.40, 16.07, 31.50, 7.73, 11.10, 22.38) > n=length(bs) > mean(bs) [1] 21.64625 > # estimate f lambda > lambda = 1/mean(bs);
Btstrap Methd > # Purpse: understand hw btstrap methd wrks > bs=c(11.96, 5.03, 67.40, 16.07, 31.50, 7.73, 11.10, 22.38) > n=length(bs) > mean(bs) [1] 21.64625 > # estimate f lambda > lambda = 1/mean(bs);
4th Indian Institute of Astrophysics - PennState Astrostatistics School July, 2013 Vainu Bappu Observatory, Kavalur. Correlation and Regression
 4th Indian Institute f Astrphysics - PennState Astrstatistics Schl July, 2013 Vainu Bappu Observatry, Kavalur Crrelatin and Regressin Rahul Ry Indian Statistical Institute, Delhi. Crrelatin Cnsider a tw
Statistical Learning. 2.1 What Is Statistical Learning?
 2 Statistical Learning 2.1 What Is Statistical Learning? In rder t mtivate ur study f statistical learning, we begin with a simple example. Suppse that we are statistical cnsultants hired by a client t
Chapter 3: Cluster Analysis
 Chapter 3: Cluster Analysis } 3.1 Basic Cncepts f Clustering 3.1.1 Cluster Analysis 3.1. Clustering Categries } 3. Partitining Methds 3..1 The principle 3.. K-Means Methd 3..3 K-Medids Methd 3..4 CLARA
Distributions, spatial statistics and a Bayesian perspective
 Distributins, spatial statistics and a Bayesian perspective Dug Nychka Natinal Center fr Atmspheric Research Distributins and densities Cnditinal distributins and Bayes Thm Bivariate nrmal Spatial statistics
Internal vs. external validity. External validity. This section is based on Stock and Watson s Chapter 9.
 Sectin 7 Mdel Assessment This sectin is based n Stck and Watsn s Chapter 9. Internal vs. external validity Internal validity refers t whether the analysis is valid fr the ppulatin and sample being studied.
COMP 551 Applied Machine Learning Lecture 4: Linear classification
 COMP 551 Applied Machine Learning Lecture 4: Linear classificatin Instructr: Jelle Pineau (jpineau@cs.mcgill.ca) Class web page: www.cs.mcgill.ca/~jpineau/cmp551 Unless therwise nted, all material psted
x 1 Outline IAML: Logistic Regression Decision Boundaries Example Data
 Outline IAML: Lgistic Regressin Charles Suttn and Victr Lavrenk Schl f Infrmatics Semester Lgistic functin Lgistic regressin Learning lgistic regressin Optimizatin The pwer f nn-linear basis functins Least-squares
IAML: Support Vector Machines
 1 / 22 IAML: Supprt Vectr Machines Charles Suttn and Victr Lavrenk Schl f Infrmatics Semester 1 2 / 22 Outline Separating hyperplane with maimum margin Nn-separable training data Epanding the input int
Resampling Methods. Chapter 5. Chapter 5 1 / 52
 Resampling Methds Chapter 5 Chapter 5 1 / 52 1 51 Validatin set apprach 2 52 Crss validatin 3 53 Btstrap Chapter 5 2 / 52 Abut Resampling An imprtant statistical tl Pretending the data as ppulatin and
CS 109 Lecture 23 May 18th, 2016
 CS 109 Lecture 23 May 18th, 2016 New Datasets Heart Ancestry Netflix Our Path Parameter Estimatin Machine Learning: Frmally Many different frms f Machine Learning We fcus n the prblem f predictin Want
T Algorithmic methods for data mining. Slide set 6: dimensionality reduction
 T-61.5060 Algrithmic methds fr data mining Slide set 6: dimensinality reductin reading assignment LRU bk: 11.1 11.3 PCA tutrial in mycurses (ptinal) ptinal: An Elementary Prf f a Therem f Jhnsn and Lindenstrauss,
Tree Structured Classifier
 Tree Structured Classifier Reference: Classificatin and Regressin Trees by L. Breiman, J. H. Friedman, R. A. Olshen, and C. J. Stne, Chapman & Hall, 98. A Medical Eample (CART): Predict high risk patients
COMP 551 Applied Machine Learning Lecture 11: Support Vector Machines
 COMP 551 Applied Machine Learning Lecture 11: Supprt Vectr Machines Instructr: (jpineau@cs.mcgill.ca) Class web page: www.cs.mcgill.ca/~jpineau/cmp551 Unless therwise nted, all material psted fr this curse
COMP 551 Applied Machine Learning Lecture 5: Generative models for linear classification
 COMP 551 Applied Machine Learning Lecture 5: Generative mdels fr linear classificatin Instructr: Herke van Hf (herke.vanhf@mail.mcgill.ca) Slides mstly by: Jelle Pineau Class web page: www.cs.mcgill.ca/~hvanh2/cmp551
CAUSAL INFERENCE. Technical Track Session I. Phillippe Leite. The World Bank
 CAUSAL INFERENCE Technical Track Sessin I Phillippe Leite The Wrld Bank These slides were develped by Christel Vermeersch and mdified by Phillippe Leite fr the purpse f this wrkshp Plicy questins are causal
The general linear model and Statistical Parametric Mapping I: Introduction to the GLM
 The general linear mdel and Statistical Parametric Mapping I: Intrductin t the GLM Alexa Mrcm and Stefan Kiebel, Rik Hensn, Andrew Hlmes & J-B J Pline Overview Intrductin Essential cncepts Mdelling Design
Midwest Big Data Summer School: Machine Learning I: Introduction. Kris De Brabanter
 Midwest Big Data Summer Schl: Machine Learning I: Intrductin Kris De Brabanter kbrabant@iastate.edu Iwa State University Department f Statistics Department f Cmputer Science June 24, 2016 1/24 Outline
Smoothing, penalized least squares and splines
 Smthing, penalized least squares and splines Duglas Nychka, www.image.ucar.edu/~nychka Lcally weighted averages Penalized least squares smthers Prperties f smthers Splines and Reprducing Kernels The interplatin
CHAPTER 24: INFERENCE IN REGRESSION. Chapter 24: Make inferences about the population from which the sample data came.
 MATH 1342 Ch. 24 April 25 and 27, 2013 Page 1 f 5 CHAPTER 24: INFERENCE IN REGRESSION Chapters 4 and 5: Relatinships between tw quantitative variables. Be able t Make a graph (scatterplt) Summarize the
In SMV I. IAML: Support Vector Machines II. This Time. The SVM optimization problem. We saw:
 In SMV I IAML: Supprt Vectr Machines II Nigel Gddard Schl f Infrmatics Semester 1 We sa: Ma margin trick Gemetry f the margin and h t cmpute it Finding the ma margin hyperplane using a cnstrained ptimizatin
NUMBERS, MATHEMATICS AND EQUATIONS
 AUSTRALIAN CURRICULUM PHYSICS GETTING STARTED WITH PHYSICS NUMBERS, MATHEMATICS AND EQUATIONS An integral part t the understanding f ur physical wrld is the use f mathematical mdels which can be used t
the results to larger systems due to prop'erties of the projection algorithm. First, the number of hidden nodes must
 M.E. Aggune, M.J. Dambrg, M.A. El-Sharkawi, R.J. Marks II and L.E. Atlas, "Dynamic and static security assessment f pwer systems using artificial neural netwrks", Prceedings f the NSF Wrkshp n Applicatins
Bayesian nonparametric modeling approaches for quantile regression
 Bayesian nnparametric mdeling appraches fr quantile regressin Athanasis Kttas Department f Applied Mathematics and Statistics University f Califrnia, Santa Cruz Department f Statistics Athens University
The blessing of dimensionality for kernel methods
 fr kernel methds Building classifiers in high dimensinal space Pierre Dupnt Pierre.Dupnt@ucluvain.be Classifiers define decisin surfaces in sme feature space where the data is either initially represented
CN700 Additive Models and Trees Chapter 9: Hastie et al. (2001)
") CN700 Additive Mdels and Trees Chapter 9: Hastie et al. (2001) Madhusudana Shashanka Department f Cgnitive and Neural Systems Bstn University CN700 - Additive Mdels and Trees March 02, 2004 p.1/34 Overview
CN700 Additive Mdels and Trees Chapter 9: Hastie et al. (2001) Madhusudana Shashanka Department f Cgnitive and Neural Systems Bstn University CN700 - Additive Mdels and Trees March 02, 2004 p.1/34 Overview
Lecture 10, Principal Component Analysis
 Principal Cmpnent Analysis Lecture 10, Principal Cmpnent Analysis Ha Helen Zhang Fall 2017 Ha Helen Zhang Lecture 10, Principal Cmpnent Analysis 1 / 16 Principal Cmpnent Analysis Lecture 10, Principal
3.4 Shrinkage Methods Prostate Cancer Data Example (Continued) Ridge Regression
 Ridge Regression") 3.3.4 Prstate Cancer Data Example (Cntinued) 3.4 Shrinkage Methds 61 Table 3.3 shws the cefficients frm a number f different selectin and shrinkage methds. They are best-subset selectin using an all-subsets
3.3.4 Prstate Cancer Data Example (Cntinued) 3.4 Shrinkage Methds 61 Table 3.3 shws the cefficients frm a number f different selectin and shrinkage methds. They are best-subset selectin using an all-subsets
Least Squares Optimal Filtering with Multirate Observations
 Prc. 36th Asilmar Cnf. n Signals, Systems, and Cmputers, Pacific Grve, CA, Nvember 2002 Least Squares Optimal Filtering with Multirate Observatins Charles W. herrien and Anthny H. Hawes Department f Electrical
NAME: Prof. Ruiz. 1. [5 points] What is the difference between simple random sampling and stratified random sampling?
![NAME: Prof. Ruiz. 1. [5 points] What is the difference between simple random sampling and stratified random sampling?](/thumbs/86/94020496.jpg "NAME: Prof. Ruiz. 1. [5 points] What is the difference between simple random sampling and stratified random sampling?") CS4445 ata Mining and Kwledge iscery in atabases. B Term 2014 Exam 1 Nember 24, 2014 Prf. Carlina Ruiz epartment f Cmputer Science Wrcester Plytechnic Institute NAME: Prf. Ruiz Prblem I: Prblem II: Prblem
CS4445 ata Mining and Kwledge iscery in atabases. B Term 2014 Exam 1 Nember 24, 2014 Prf. Carlina Ruiz epartment f Cmputer Science Wrcester Plytechnic Institute NAME: Prf. Ruiz Prblem I: Prblem II: Prblem
Lecture 8: Multiclass Classification (I)
") Bayes Rule fr Multiclass Prblems Traditinal Methds fr Multiclass Prblems Linear Regressin Mdels Lecture 8: Multiclass Classificatin (I) Ha Helen Zhang Fall 07 Ha Helen Zhang Lecture 8: Multiclass Classificatin
Bayes Rule fr Multiclass Prblems Traditinal Methds fr Multiclass Prblems Linear Regressin Mdels Lecture 8: Multiclass Classificatin (I) Ha Helen Zhang Fall 07 Ha Helen Zhang Lecture 8: Multiclass Classificatin
AP Statistics Practice Test Unit Three Exploring Relationships Between Variables. Name Period Date
 AP Statistics Practice Test Unit Three Explring Relatinships Between Variables Name Perid Date True r False: 1. Crrelatin and regressin require explanatry and respnse variables. 1. 2. Every least squares
COMP9444 Neural Networks and Deep Learning 3. Backpropagation
 COMP9444 Neural Netwrks and Deep Learning 3. Backprpagatin Tetbk, Sectins 4.3, 5.2, 6.5.2 COMP9444 17s2 Backprpagatin 1 Outline Supervised Learning Ockham s Razr (5.2) Multi-Layer Netwrks Gradient Descent
Stats Classification Ji Zhu, Michigan Statistics 1. Classification. Ji Zhu 445C West Hall
 Stats 415 - Classificatin Ji Zhu, Michigan Statistics 1 Classificatin Ji Zhu 445C West Hall 734-936-2577 jizhu@umich.edu Stats 415 - Classificatin Ji Zhu, Michigan Statistics 2 Examples f Classificatin
Modelling of Clock Behaviour. Don Percival. Applied Physics Laboratory University of Washington Seattle, Washington, USA
 Mdelling f Clck Behaviur Dn Percival Applied Physics Labratry University f Washingtn Seattle, Washingtn, USA verheads and paper fr talk available at http://faculty.washingtn.edu/dbp/talks.html 1 Overview
Data Mining: Concepts and Techniques. Classification and Prediction. Chapter February 8, 2007 CSE-4412: Data Mining 1
 Data Mining: Cncepts and Techniques Classificatin and Predictin Chapter 6.4-6 February 8, 2007 CSE-4412: Data Mining 1 Chapter 6 Classificatin and Predictin 1. What is classificatin? What is predictin?
Overview of Supervised Learning
 2 Overview f Supervised Learning 2.1 Intrductin The first three examples described in Chapter 1 have several cmpnents in cmmn. Fr each there is a set f variables that might be dented as inputs, which are
Churn Prediction using Dynamic RFM-Augmented node2vec
 Churn Predictin using Dynamic RFM-Augmented nde2vec Sandra Mitrvić, Jchen de Weerdt, Bart Baesens & Wilfried Lemahieu Department f Decisin Sciences and Infrmatin Management, KU Leuven 18 September 2017,
Particle Size Distributions from SANS Data Using the Maximum Entropy Method. By J. A. POTTON, G. J. DANIELL AND B. D. RAINFORD
 3 J. Appl. Cryst. (1988). 21,3-8 Particle Size Distributins frm SANS Data Using the Maximum Entrpy Methd By J. A. PTTN, G. J. DANIELL AND B. D. RAINFRD Physics Department, The University, Suthamptn S9
Multiple Source Multiple. using Network Coding
 Multiple Surce Multiple Destinatin Tplgy Inference using Netwrk Cding Pegah Sattari EECS, UC Irvine Jint wrk with Athina Markpulu, at UCI, Christina Fraguli, at EPFL, Lausanne Outline Netwrk Tmgraphy Gal,
A Matrix Representation of Panel Data
 web Extensin 6 Appendix 6.A A Matrix Representatin f Panel Data Panel data mdels cme in tw brad varieties, distinct intercept DGPs and errr cmpnent DGPs. his appendix presents matrix algebra representatins
Admin. MDP Search Trees. Optimal Quantities. Reinforcement Learning
 Admin Reinfrcement Learning Cntent adapted frm Berkeley CS188 MDP Search Trees Each MDP state prjects an expectimax-like search tree Optimal Quantities The value (utility) f a state s: V*(s) = expected
COMP 551 Applied Machine Learning Lecture 9: Support Vector Machines (cont d)
") COMP 551 Applied Machine Learning Lecture 9: Supprt Vectr Machines (cnt d) Instructr: Herke van Hf (herke.vanhf@mail.mcgill.ca) Slides mstly by: Class web page: www.cs.mcgill.ca/~hvanh2/cmp551 Unless therwise
COMP 551 Applied Machine Learning Lecture 9: Supprt Vectr Machines (cnt d) Instructr: Herke van Hf (herke.vanhf@mail.mcgill.ca) Slides mstly by: Class web page: www.cs.mcgill.ca/~hvanh2/cmp551 Unless therwise
SUPPLEMENTARY MATERIAL GaGa: a simple and flexible hierarchical model for microarray data analysis
 SUPPLEMENTARY MATERIAL GaGa: a simple and flexible hierarchical mdel fr micrarray data analysis David Rssell Department f Bistatistics M.D. Andersn Cancer Center, Hustn, TX 77030, USA rsselldavid@gmail.cm
Determining the Accuracy of Modal Parameter Estimation Methods
 Determining the Accuracy f Mdal Parameter Estimatin Methds by Michael Lee Ph.D., P.E. & Mar Richardsn Ph.D. Structural Measurement Systems Milpitas, CA Abstract The mst cmmn type f mdal testing system
Introduction to Regression
 Intrductin t Regressin Administrivia Hmewrk 6 psted later tnight. Due Friday after Break. 2 Statistical Mdeling Thus far we ve talked abut Descriptive Statistics: This is the way my sample is Inferential
Logistic Regression. and Maximum Likelihood. Marek Petrik. Feb
 Lgistic Regressin and Maximum Likelihd Marek Petrik Feb 09 2017 S Far in ML Regressin vs Classificatin Linear regressin Bias-variance decmpsitin Practical methds fr linear regressin Simple Linear Regressin
Performance Bounds for Detect and Avoid Signal Sensing
 Perfrmance unds fr Detect and Avid Signal Sensing Sam Reisenfeld Real-ime Infrmatin etwrks, University f echnlgy, Sydney, radway, SW 007, Australia samr@uts.edu.au Abstract Detect and Avid (DAA) is a Cgnitive
A Scalable Recurrent Neural Network Framework for Model-free
 A Scalable Recurrent Neural Netwrk Framewrk fr Mdel-free POMDPs April 3, 2007 Zhenzhen Liu, Itamar Elhanany Machine Intelligence Lab Department f Electrical and Cmputer Engineering The University f Tennessee
Versatility of Singular Value Decomposition (SVD) January 7, 2015
 January 7, 2015") Versatility f Singular Value Decmpsitin (SVD) January 7, 2015 Assumptin : Data = Real Data + Nise Each Data Pint is a clumn f the n d Data Matrix A. Assumptin : Data = Real Data + Nise Each Data Pint is
Versatility f Singular Value Decmpsitin (SVD) January 7, 2015 Assumptin : Data = Real Data + Nise Each Data Pint is a clumn f the n d Data Matrix A. Assumptin : Data = Real Data + Nise Each Data Pint is
INSTRUMENTAL VARIABLES
 INSTRUMENTAL VARIABLES Technical Track Sessin IV Sergi Urzua University f Maryland Instrumental Variables and IE Tw main uses f IV in impact evaluatin: 1. Crrect fr difference between assignment f treatment
Formal Uncertainty Assessment in Aquarius Salinity Retrieval Algorithm
 Frmal Uncertainty Assessment in Aquarius Salinity Retrieval Algrithm T. Meissner Aquarius Cal/Val Meeting Santa Rsa March 31/April 1, 2015 Outline 1. Backgrund/Philsphy 2. Develping an Algrithm fr Assessing
The Kullback-Leibler Kernel as a Framework for Discriminant and Localized Representations for Visual Recognition
 The Kullback-Leibler Kernel as a Framewrk fr Discriminant and Lcalized Representatins fr Visual Recgnitin Nun Vascncels Purdy H Pedr Mren ECE Department University f Califrnia, San Dieg HP Labs Cambridge
Biplots in Practice MICHAEL GREENACRE. Professor of Statistics at the Pompeu Fabra University. Chapter 13 Offprint
 Biplts in Practice MICHAEL GREENACRE Prfessr f Statistics at the Pmpeu Fabra University Chapter 13 Offprint CASE STUDY BIOMEDICINE Cmparing Cancer Types Accrding t Gene Epressin Arrays First published:
Localized Model Selection for Regression
 Lcalized Mdel Selectin fr Regressin Yuhng Yang Schl f Statistics University f Minnesta Church Street S.E. Minneaplis, MN 5555 May 7, 007 Abstract Research n mdel/prcedure selectin has fcused n selecting
MATCHING TECHNIQUES. Technical Track Session VI. Emanuela Galasso. The World Bank
 MATCHING TECHNIQUES Technical Track Sessin VI Emanuela Galass The Wrld Bank These slides were develped by Christel Vermeersch and mdified by Emanuela Galass fr the purpse f this wrkshp When can we use
Computational modeling techniques
 Cmputatinal mdeling techniques Lecture 4: Mdel checing fr ODE mdels In Petre Department f IT, Åb Aademi http://www.users.ab.fi/ipetre/cmpmd/ Cntent Stichimetric matrix Calculating the mass cnservatin relatins
Experimental Design Initial GLM Intro. This Time
 Eperimental Design Initial GLM Intr This Time GLM General Linear Mdel Single subject fmri mdeling Single Subject fmri Data Data at ne vel Rest vs. passive wrd listening Is there an effect? Linear in
Data mining/machine learning large data sets. STA 302 or 442 (Applied Statistics) :, 1
 :, 1") Data mining/machine learning large data sets STA 302 r 442 (Applied Statistics) :, 1 Data mining/machine learning large data sets high dimensinal spaces STA 302 r 442 (Applied Statistics) :, 2 Data mining/machine
Data mining/machine learning large data sets STA 302 r 442 (Applied Statistics) :, 1 Data mining/machine learning large data sets high dimensinal spaces STA 302 r 442 (Applied Statistics) :, 2 Data mining/machine
A New Evaluation Measure. J. Joiner and L. Werner. The problems of evaluation and the needed criteria of evaluation
 III-l III. A New Evaluatin Measure J. Jiner and L. Werner Abstract The prblems f evaluatin and the needed criteria f evaluatin measures in the SMART system f infrmatin retrieval are reviewed and discussed.
Math 105: Review for Exam I - Solutions
 1. Let f(x) = 3 + x + 5. Math 105: Review fr Exam I - Slutins (a) What is the natural dmain f f? [ 5, ), which means all reals greater than r equal t 5 (b) What is the range f f? [3, ), which means all
7 TH GRADE MATH STANDARDS
 ALGEBRA STANDARDS Gal 1: Students will use the language f algebra t explre, describe, represent, and analyze number expressins and relatins 7 TH GRADE MATH STANDARDS 7.M.1.1: (Cmprehensin) Select, use,
Elements of Machine Intelligence - I
 ECE-175A Elements f Machine Intelligence - I Ken Kreutz-Delgad Nun Vascncels ECE Department, UCSD Winter 2011 The curse The curse will cver basic, but imprtant, aspects f machine learning and pattern recgnitin
Chapter 15 & 16: Random Forests & Ensemble Learning
 Chapter 15 & 16: Randm Frests & Ensemble Learning DD3364 Nvember 27, 2012 Ty Prblem fr Bsted Tree Bsted Tree Example Estimate this functin with a sum f trees with 9-terminal ndes by minimizing the sum
Application of ILIUM to the estimation of the T eff [Fe/H] pair from BP/RP
![Application of ILIUM to the estimation of the T eff [Fe/H] pair from BP/RP](/thumbs/93/113896405.jpg "Application of ILIUM to the estimation of the T eff [Fe/H] pair from BP/RP") Applicatin f ILIUM t the estimatin f the T eff [Fe/H] pair frm BP/RP prepared by: apprved by: reference: issue: 1 revisin: 1 date: 2009-02-10 status: Issued Cryn A.L. Bailer-Jnes Max Planck Institute fr
Applicatin f ILIUM t the estimatin f the T eff [Fe/H] pair frm BP/RP prepared by: apprved by: reference: issue: 1 revisin: 1 date: 2009-02-10 status: Issued Cryn A.L. Bailer-Jnes Max Planck Institute fr
Kinetic Model Completeness
 5.68J/10.652J Spring 2003 Lecture Ntes Tuesday April 15, 2003 Kinetic Mdel Cmpleteness We say a chemical kinetic mdel is cmplete fr a particular reactin cnditin when it cntains all the species and reactins
LHS Mathematics Department Honors Pre-Calculus Final Exam 2002 Answers
 LHS Mathematics Department Hnrs Pre-alculus Final Eam nswers Part Shrt Prblems The table at the right gives the ppulatin f Massachusetts ver the past several decades Using an epnential mdel, predict the
AP Statistics Notes Unit Two: The Normal Distributions
 AP Statistics Ntes Unit Tw: The Nrmal Distributins Syllabus Objectives: 1.5 The student will summarize distributins f data measuring the psitin using quartiles, percentiles, and standardized scres (z-scres).
Lecture 13: Markov Chain Monte Carlo. Gibbs sampling
 Lecture 13: Markv hain Mnte arl Gibbs sampling Gibbs sampling Markv chains 1 Recall: Apprximate inference using samples Main idea: we generate samples frm ur Bayes net, then cmpute prbabilities using (weighted)
EASTERN ARIZONA COLLEGE Introduction to Statistics
 EASTERN ARIZONA COLLEGE Intrductin t Statistics Curse Design 2014-2015 Curse Infrmatin Divisin Scial Sciences Curse Number PSY 220 Title Intrductin t Statistics Credits 3 Develped by Adam Stinchcmbe Lecture/Lab
Computational modeling techniques
 Cmputatinal mdeling techniques Lecture 2: Mdeling change. In Petre Department f IT, Åb Akademi http://users.ab.fi/ipetre/cmpmd/ Cntent f the lecture Basic paradigm f mdeling change Examples Linear dynamical
, which yields. where z1. and z2
 The Gaussian r Nrmal PDF, Page 1 The Gaussian r Nrmal Prbability Density Functin Authr: Jhn M Cimbala, Penn State University Latest revisin: 11 September 13 The Gaussian r Nrmal Prbability Density Functin
Support-Vector Machines
 Supprt-Vectr Machines Intrductin Supprt vectr machine is a linear machine with sme very nice prperties. Haykin chapter 6. See Alpaydin chapter 13 fr similar cntent. Nte: Part f this lecture drew material
ECEN 4872/5827 Lecture Notes
 ECEN 4872/5827 Lecture Ntes Lecture #5 Objectives fr lecture #5: 1. Analysis f precisin current reference 2. Appraches fr evaluating tlerances 3. Temperature Cefficients evaluatin technique 4. Fundamentals
Reinforcement Learning" CMPSCI 383 Nov 29, 2011!
 Reinfrcement Learning" CMPSCI 383 Nv 29, 2011! 1 Tdayʼs lecture" Review f Chapter 17: Making Cmple Decisins! Sequential decisin prblems! The mtivatin and advantages f reinfrcement learning.! Passive learning!
NOTE ON THE ANALYSIS OF A RANDOMIZED BLOCK DESIGN. Junjiro Ogawa University of North Carolina
 NOTE ON THE ANALYSIS OF A RANDOMIZED BLOCK DESIGN by Junjir Ogawa University f Nrth Carlina This research was supprted by the Office f Naval Research under Cntract N. Nnr-855(06) fr research in prbability
Excessive Social Imbalances and the Performance of Welfare States in the EU. Frank Vandenbroucke, Ron Diris and Gerlinde Verbist
 Excessive Scial Imbalances and the Perfrmance f Welfare States in the EU Frank Vandenbrucke, Rn Diris and Gerlinde Verbist Child pverty in the Eurzne, SILC 2008 35.00 30.00 25.00 20.00 15.00 10.00 5.00.00
Statistics, Numerical Models and Ensembles
 Statistics, Numerical Mdels and Ensembles Duglas Nychka, Reinhard Furrer,, Dan Cley Claudia Tebaldi, Linda Mearns, Jerry Meehl and Richard Smith (UNC). Spatial predictin and data assimilatin Precipitatin
INTRODUCTION TO MACHINE LEARNING FOR MEDICINE
 Fall 2017 INTRODUCTION TO MACHINE LEARNING FOR MEDICINE Carla E. Brdley Prfessr & Dean Cllege f Cmputer and Infrmatin Science Nrtheastern University WHAT IS MACHINE LEARNING/DATA MINING? Figure is frm
Differentiation Applications 1: Related Rates
 Differentiatin Applicatins 1: Related Rates 151 Differentiatin Applicatins 1: Related Rates Mdel 1: Sliding Ladder 10 ladder y 10 ladder 10 ladder A 10 ft ladder is leaning against a wall when the bttm
Optimization Programming Problems For Control And Management Of Bacterial Disease With Two Stage Growth/Spread Among Plants
 Internatinal Jurnal f Engineering Science Inventin ISSN (Online): 9 67, ISSN (Print): 9 676 www.ijesi.rg Vlume 5 Issue 8 ugust 06 PP.0-07 Optimizatin Prgramming Prblems Fr Cntrl nd Management Of Bacterial
STATS216v Introduction to Statistical Learning Stanford University, Summer Practice Final (Solutions) Duration: 3 hours
 Duration: 3 hours") STATS216v Intrductin t Statistical Learning Stanfrd University, Summer 2016 Practice Final (Slutins) Duratin: 3 hurs Instructins: (This is a practice final and will nt be graded.) Remember the university
STATS216v Intrductin t Statistical Learning Stanfrd University, Summer 2016 Practice Final (Slutins) Duratin: 3 hurs Instructins: (This is a practice final and will nt be graded.) Remember the university
Linear Classification
 Linear Classificatin CS 54: Machine Learning Slides adapted frm Lee Cper, Jydeep Ghsh, and Sham Kakade Review: Linear Regressin CS 54 [Spring 07] - H Regressin Given an input vectr x T = (x, x,, xp), we
Study Group Report: Plate-fin Heat Exchangers: AEA Technology
 Study Grup Reprt: Plate-fin Heat Exchangers: AEA Technlgy The prblem under study cncerned the apparent discrepancy between a series f experiments using a plate fin heat exchanger and the classical thery
SAMPLING DYNAMICAL SYSTEMS
 SAMPLING DYNAMICAL SYSTEMS Melvin J. Hinich Applied Research Labratries The University f Texas at Austin Austin, TX 78713-8029, USA (512) 835-3278 (Vice) 835-3259 (Fax) hinich@mail.la.utexas.edu ABSTRACT
Perfrmance f Sensitizing Rules n Shewhart Cntrl Charts with Autcrrelated Data Key Wrds: Autregressive, Mving Average, Runs Tests, Shewhart Cntrl Chart
 Perfrmance f Sensitizing Rules n Shewhart Cntrl Charts with Autcrrelated Data Sandy D. Balkin Dennis K. J. Lin y Pennsylvania State University, University Park, PA 16802 Sandy Balkin is a graduate student
Slide04 (supplemental) Haykin Chapter 4 (both 2nd and 3rd ed): Multi-Layer Perceptrons
 Haykin Chapter 4 (both 2nd and 3rd ed): Multi-Layer Perceptrons") Slide04 supplemental) Haykin Chapter 4 bth 2nd and 3rd ed): Multi-Layer Perceptrns CPSC 636-600 Instructr: Ynsuck Che Heuristic fr Making Backprp Perfrm Better 1. Sequential vs. batch update: fr large
Slide04 supplemental) Haykin Chapter 4 bth 2nd and 3rd ed): Multi-Layer Perceptrns CPSC 636-600 Instructr: Ynsuck Che Heuristic fr Making Backprp Perfrm Better 1. Sequential vs. batch update: fr large
MATCHING TECHNIQUES Technical Track Session VI Céline Ferré The World Bank
 MATCHING TECHNIQUES Technical Track Sessin VI Céline Ferré The Wrld Bank When can we use matching? What if the assignment t the treatment is nt dne randmly r based n an eligibility index, but n the basis
CS:4420 Artificial Intelligence
 CS:4420 Artificial Intelligence Spring 2017 Learning frm Examples Cesare Tinelli The University f Iwa Cpyright 2004 17, Cesare Tinelli and Stuart Russell a a These ntes were riginally develped by Stuart
Figure 1a. A planar mechanism.
 ME 5 - Machine Design I Fall Semester 0 Name f Student Lab Sectin Number EXAM. OPEN BOOK AND CLOSED NOTES. Mnday, September rd, 0 Write n ne side nly f the paper prvided fr yur slutins. Where necessary,
Department of Economics, University of California, Davis Ecn 200C Micro Theory Professor Giacomo Bonanno. Insurance Markets
 Department f Ecnmics, University f alifrnia, Davis Ecn 200 Micr Thery Prfessr Giacm Bnann Insurance Markets nsider an individual wh has an initial wealth f. ith sme prbability p he faces a lss f x (0