Site-specific Identification of Lysine Acetylation Stoichiometries in Mammalian Cells
|
|
|
- Bryce Barry Daniels
- 5 years ago
- Views:
Transcription
1 Supplementary Information Site-specific Identification of Lysine Acetylation Stoichiometries in Mammalian Cells Tong Zhou 1, 2, Ying-hua Chung 1, 2, Jianji Chen 1, Yue Chen 1 1. Department of Biochemistry, Molecular Biology and Biophysics, University of Minnesota at Twin Cities, Minneapolis, MN 55455, USA 2. These authors contributed equally to this work Correspondence: Dr. Yue Chen (YueChen@umn.edu) Supplementary Figure S1-S5 Supplementary Table T1-T2 Supplementary Note 1 S1
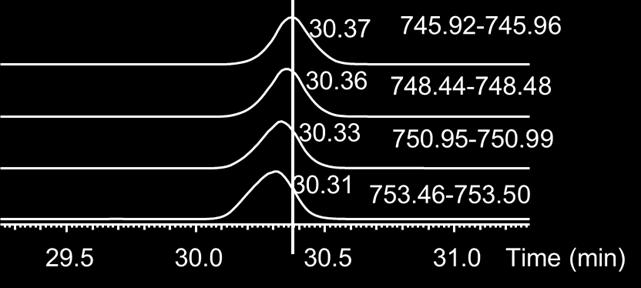
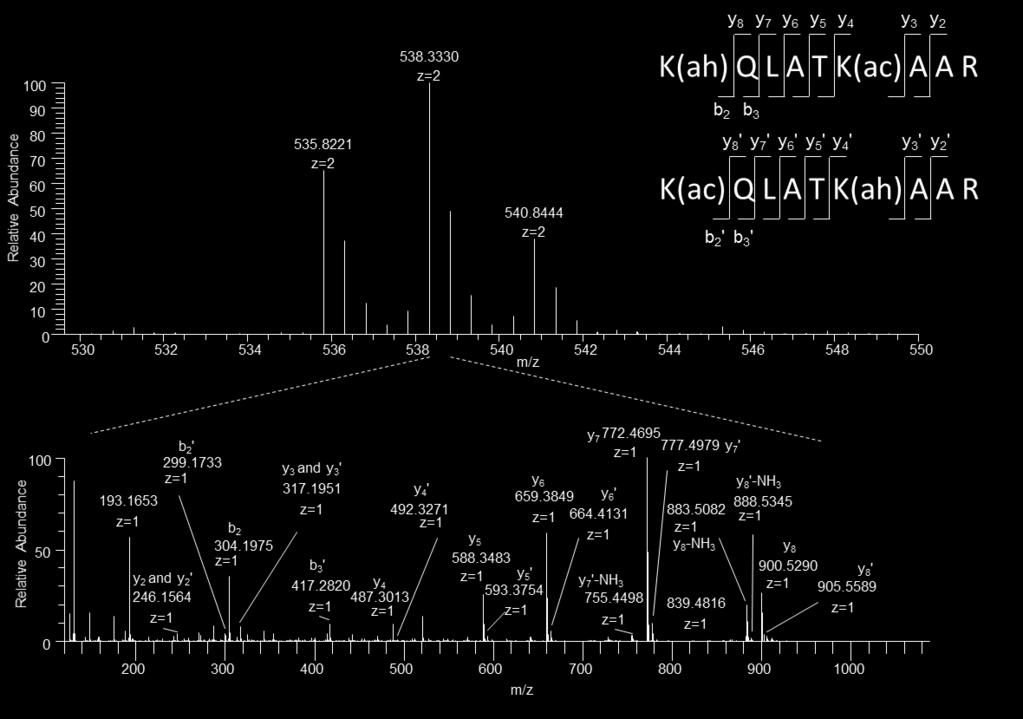
2 Supplementary Figures Figure S1. Ah-NHS synthesis and labeling reactions. (A) Synthesis reactions for Ah-NHS starting from sodium acetate- 13 CD 3. (B) The labeling reactions of Ac-NHS or AcOAc at lysine - NH2 or/and -NH2. Figure S2. Co-eluting profiles of four peptides with different isotope-labeled acetyl groups. Synthetic peptides (structure shown in Figure 4) containing different numbers of light acetyl groups were balanced with heavy acetyl groups. They were mixed and injected into LCMS after desalting. After balancing, peptide 1 has a molecular weight of , peptides 2 and 3 have MW of , peptides 4 and 5 have MW of , peptides 6 and 7 have MW of Figure S3. BSA spike-in validation experiment. In vitro chemical acetylated BSA was mixed at different heavy-to-light ratios to mimic 50%, 10% and 1% stoichiometries and spiked-in with Hela whole cell lysate stoichiometry analysis at a roughly 1:50 ratio (BSA/Hela proteins, w/w). Three BSA peptides were detected and their acetylation stoichiometry were quantified with StoichAnalyzer software. Figure S4. Schematic illustration of false positive peak selection and quantification in acetylation stoichiometry analysis. (A) Precursor ion selection of light acetyl peptides may be interfered with the isotope peaks from other co-eluting species and the stoichiometry analysis data become unreliable. By implementing deconvolution and deisotoping, the software removes these false positive peak selections. (B) The identified heavy acetylated peptides may serve as internal standards for the software to correct the mass error in each spectrum and accurately select corresponding light acetylated peptide peaks. (C) The software applies a filtering step based on database search results to remove incorrectly selected peak pairs resulting from other co-eluting peptides. S2
3 Figure S5. Reproducibility of two biological replicate experiments for untreated HeLa protein stoichiometry analysis. Figure S6. MS and MS/MS spectra of a two-lys containing peptide. Precursor ion spectrum is shown in the upper panel. The annotated fragmentation spectrum of the middle precursor ion containing one heavy and one light acetyl group is shown in the lower panel. Figure S7. Clustering analysis of GO molecular function enrichment for Hela cell proteins identified with acetylation stoichiometries in four quantiles less than 1%, 1%~5%, 5%~20%, more than 20%. Supplementary Tables Table S1. Identification of Lysine acetylation stoichiometries in HeLa cells with no treatment. All lysines in each peptide are designated a site number that is sequentially ordered from the peptide N-terminal to the peptide C-terminal with the lysine closest to peptide N-terminal as K1. Table S2. Identification of Lysine acetylation stoichiometries in HeLa cells treated with sodium butyrate. All lysines in each peptide are designated a site number that is sequentially ordered from the peptide N-terminal to the peptide C-terminal with the lysine closest to peptide N- terminal as K1. Supplementary Note 1. Software usage and the specific description of the mathematical model. S3

4 Figure S1. S4

5 Figure S2. S5

6 Figure S3. S6

7 Figure S4. S7
8 Figure S5. S8

9 Figure S6. S9

10 Figure S7. S10
11 Supplementary Note 1. Software usage and specific description of the mathematical model. a. The usage of StoichAnalyzer software - Operating environment: Linux or Unix operating system with the following software installed Zlib, Perl, C++ compiler - Step by step instructions: 1. Download the latest release file (.tar) from 2. Uncompress the file to a Target Directory. Four directories ( MS1C, MS2C, MS1- perl, MS2-perl ) and a bash script (stoichanalyzer.sh) will be generated. 3. Compile the MS1C program by entering MS1C directory and executing command make. 4. Compile the MS2C program by entering MS2C directory and executing command make. 5. Create a Project Directory in the same Target Directory to store mzxml files and Maxquant search results. 6. Upload mzxml files as well as evidence.txt and msms.txt to the Project Directory. 7. Copy stoichanalyzer.sh to the project directory and execute directly. 8. The outputs are saved as Output-1K.txt, Output-2K.txt, Output-3K.txt and Output-4K.txt. b. Description of the algorithm and mathematical model. This document states the mathematical relation between intensities of fragments, the amounts of each acetyl isotope combinations, and the total stoichiometry of each acetyl site among the precursors of same mass. N-terminal acetyl sites are excluded out here. Only acetyl sites on Lysine are concerned in the following. The cases of peptides containing 2 to 4 acetyl sites are discussed separately. For a peptide containing 2 acetyl sites, the acetyl sites in order from N-terminal to C-terminal are named as α, β. Its three possible MS1 peaks in the acetyl isotope assembly are named as I 1, I 2, I 3 from light to heavy. Here I 1 maps to isotope composition α L β L ; I 2 maps to α L β H and α H β L ; I 3 maps to α H β H. The intensities of the fragments of I 2 formed by breaking precursors between two acetyl sites reveals the ratio of the amounts of α L β H, α H β L. Theoretically it can be expressed in mathematical form: the intensity of b (j) ion light the intensity of b (j) ion heavy the intensity of y (n j)ion heavy amount of α Lβ H r the intensity of y (n j) ion light amount of α H β 1 L where j is equal or larger than the position of site α but smaller than the position of site β. n is the total number of amino acids in the peptide. S11 eq.1
12 The first two fractions in eq.1 are the observances in the spectrum and can be pooled by putting these observances into the linear regression model and the slope of regression line is the ratio, more robust in statistics. The third fraction in the above is the ratio of the amount of each acetyl isotope combination. In other aspect, it can be changed to the stoichiometry of each acetyl site. stoi_α L,I2 stoi_β L,I2 amount of α L β H amount of α L β H + amount of α H β L r r 1 amount of α H β L 1 amount of α L β H + amount of α H β L 1 + r 1 The math forms represent conditional probabilities: in the group of peptides whose isotope composition is 1L1H, or say correspondent to MS1 peak I 2, the probability of finding site α lightisotope acetylated is stoi_α L,I2. Similarly for stoi_ β L,I2. With Bayesian theorem, the total occupancy of each site can be calculated out as: eq.2 stoi_α L,total I 1 + I 2 stoi_α L,I2 I 1 + I 2 + I 3 stoi_β L,total I 1 + I 2 stoi_β L,I2 I 1 + I 2 + I 3 For a peptide containing 3 acetyl sites, besides the lightest and heaviest MS1 peaks, there are another two in the middle: I 2 and I 3. With the intensities of the fragments of I 2 formed by breaking precursors between two acetyl sites, we may get the ratios of the amounts of α L β L γ H, α L β H γ L, α H β L γ L and the ratios of occupancies: α L /α H, β L /β H, γ L /γ H, and δ L /δ H via solving the joint equations (eq.4a & eq.4b) although the relation between the observances and the amount of each acetyl isotope combination turns more complicated than equation 1. the intensity of b (j2) ion light the intensity of b (j2) ion heavy the intensity of y (n j2)ion heavy r the intensity of y (n j2) ion light 1 amount of α Lβ L γ H + amount of α L β H γ L amount of α H β L γ L the intensity of b (j3) ion light the intensity of b (j3) ion heavy the intensity of y (n j3)ion heavy r the intensity of y (n j3) ion light 2 amount of α L β L γ H amount of α L β H γ L + amount of α H β L γ L eq.3 eq.4a & eq.4b S12
13 where j2 is equal or larger than the position of site α but smaller than the position of site β. j3 is equal or larger than the position of site β but smaller than the position of site γ. n is the total number of amino acids in the peptide. Another view on eq.4 is: amount of α L amount of α H r 1 amount of γ L 1 amount of γ H r 2 With simple algebra deduction we get: amount of β L amount of β H amount of α Lβ L γ H + amount of α H β L γ L amount of α L β H γ L r 1r 2 + 2r r 1 r 2 Similar to equation 2, we obtain stoi_α L,I2, stoi_β L,I2 and stoi_γ L,I2 with eq.5. eq.5a & eq.5b eq.5c With the intensities of the fragments of I 3 formed by breaking precursors between two acetyl sites, we may get the ratio of the amounts of α L β H γ H, α H β L γ H, α H β H γ L via solving the joint equations. (eq.6a & eq.6b) the intensity of b (j2) ion light the intensity of b (j2) ion heavy the intensity of y (n j2)ion heavy r the intensity of y (n j2) ion light 1 amount of α L β H γ H amount of α H β L γ H + amount of α H β H γ L the intensity of b (j3) ion light the intensity of b (j3) ion heavy the intensity of y (n j3)ion heavy r the intensity of y (n j3) ion light 2 amount of α Lβ H γ H + amount of α H β L γ H amount of α H β H γ L where j2, j3, and n have the same definition as they have in eq.4 eq.6a & eq.6b The mathematical forms of eq.5a and eq.5b still hold in the case of I 3. However, eq. 5c does not hold here. Instead, we have: amount of β L amount of β H amount of α H β L γ H amount of α L β H γ H + amount of α H β H γ L r 2 r 1 r 1 r 2 + 2r eq.7c S13
14 Similar to equation 2, we obtain stoi_α L,I3, stoi_β L,I3 and stoi_γ L,I3 with eq.7. (or say eq.5a, eq.5b and eq.7c.) With conditional probabilities: stoi_α L,I2, stoi_β L,I2, stoi_γ L,I2, stoi_α L,I3, stoi_β L,I3 and stoi_γ L,I3 and Bayesian theorem, the total occupancy of each site can be calculated out. Here we only list stoi_α L,total as an example. stoi_α L,total I 1 + I 2 stoi_α L,I2 + I 3 stoi_α L,I3 I 1 + I 2 + I 3 + I 4 For a peptide containing 4 acetyl sites, there are three MS1 peaks in the middle: I 2, I 3, and I 4. Considering more complexity in acetyl isotope combination symbols and mathematical forms, we simplify the notations by letting a,b,c,d to represent the amounts of α L β L γ L δ H, α L β L γ H δ L, α L β H γ L δ L, α H β L γ L δ L in the analysis of I 2 respectively; letting a,b,c,d,e,f to represent the amounts of α L β L γ H δ H, α L β H γ L δ H, α L β H γ H δ L, α H β L γ L δ H, α H β L γ H δ L, α H β H γ L δ L in the analysis of I 3 respectively; again a,b,c,d to represent the amounts of α L β H γ H δ H, α H β L γ H δ H, α H β H γ L δ H, α H β H γ H δ L in the analysis of I 4 respectively. In analyzing I 2, similar to equation 4, the ratios are obtained from the regression model of the observances. The ratios also can be expressed in term of the amounts of acetyl isotope combinations as follows. a + b + c d r 1 a + b c + d r 2 a b + c + d r 3 Here we have three known: r 1, r 2, r 3 ; four unknown: a, b, c, d; and three equations in the above. But what we really want to get is the ratios between the unknown instead of unknown themselves. By letting b b/a, c c/a, d d/a and arranging the three equations to make all unknown variables (except a) on the left of the equations, we obtain the three new joint equations in terms of fewer variables. eq.8 eq.9 1 r 1 (b + c ) + d 1 r 1 1 r 2 b + c + d 1 r 2 S14
15 b + c + d 1 r 3 eq.10 Then solve the joint equations by applying Kramer s rule. Similar to equation 5, we have amount of α L a + b + c r amount of α H d 1 amount of β L a + b + d 1 + b + d amount of β H c c amount of γ L a + c + d 1 + c + d amount of γ H b b amount of δ L b + c + d 1 amount of δ H a r 3 eq.11 Similar to equation 2, we obtain stoi_α L,I2, stoi_β L,I2, stoi_γ L,I2 and stoi_δ L,I2 with eq.11. In analyzing I 3, similar to equation 9, the ratios are obtained from the regression model of the observances. The difference is that there are three possible cases (containing 0, 1, 2 heavy isotopes) for b ions formed in breaking precursors between site β and site γ. These three mass levels make two equations. (In I 2 analysis, two mass levels make an equation.) The ratios are expressed in term of the amounts of acetyl isotope combinations as follows. the intensity of b (j2) ion light the intensity of b (j2) ion heavy the intensity of y (n j2)ion heavy a + b + c the intensity of y (n j2) ion light d + e + f r 1 the intensity of b (j3) ion lightest the intensity of b (j3) ion heaviest the intensity of y (n j3)ion heaviest the intensity of y (n j3) ion lightest a f r 2 the intensity of b (j3) ion medium the intensity of b (j3) ion heaviest the intensity of y (n j3)ion medium b + c + d + e r the intensity of y (n j3) ion lighest f 3 the intensity of b (j4) ion light the intensity of b (j4) ion heavy the intensity of y (n j4)ion heavy a + b + d the intensity of y (n j4) ion light c + e + f r 4 eq.12 where j2 is equal or larger than the position of site α but smaller than the position of site β. j3 is equal or larger than the position of site β but smaller than the position of site γ.. j4 is S15
16 equal or larger than the position of site γ but smaller than the position of site δ. n is the total number of amino acids in the peptide. Obviously, with 4 constraints (equations), we cannot specify (determine) the ratios of 6 unknown. In other words, the ratios of the amount of each combination correspondent to I 3 are theoretically insolvable with only MS2 information. However, the ratios of occupancies α L /α H, β L /β H, γ L /γ H, and δ L /δ H may still be solvable. We skip the deduction process here and list the results below. amount of α L a + b + c r amount of α H d 1 amount of β L a + d + e amount of β H b + c + f r 1r 2 + 2r 2 + r 3 r 1 r 1 r 3 r 2 + 2r amount of γ L b + d + f amount of γ H a + c + e (r 3 + 1)(r 4 + 1) (r 2 + r 3 r 4 ) r 2 (r 4 + 1) + (r 2 + r 3 r 4 ) amount of δ L c + e + f amount of δ H a + b + d 1 r 4 Please notice that there are more than one correct math expressions for the above. Then we obtain stoi_α L,I3, stoi_β L,I3, stoi_γ L,I3 and stoi_δ L,I3 from eq.13. eq.13 The analysis of I 4 is similar to the analysis of I 2, the ratios are obtained from the regression model of the observances. The ratios also can be expressed in term of the amounts of acetyl isotope combinations as follows. a b + c + d r 1 a + b c + d r 2 a + b + c d r 3 eq.14 By letting b b/a, c c/a, d d/a and arranging the three equations to make all unknown variables (except a) on the left of the equations, we obtain the three new joint equations in terms of fewer variables. b + c + d 1 r 1 S16
17 1 r 2 b + c + d 1 r 2 1 r 3 (b + c ) + d 1 r 3 eq.15 Then solve the joint equations by applying Kramer s rule. Similar to equation 11, we have amount of α L a amount of α H b + c + d r 1 amount of β L amount of β H amount of γ L amount of γ H amount of δ L amount of δ H b a + c + d c a + b + d d b 1 + c + d c 1 + b + d a + b + c 1 r 3 eq.16 Then we obtain stoi_α L,I4, stoi_β L,I4, stoi_γ L,I4 and stoi_δ L,I4 from eq.16. Finally, with the obtained conditional probabilities and Bayesian theorem, the total occupancy of each site can be calculated out. Here we only list stoi_α L,total as an example. stoi_α L,total I 1 + I 2 stoi_α L,I2 + I 3 stoi_α L,I3 + I 4 stoi_α L,I4 I 1 + I 2 + I 3 + I 4 + I 5 eq.17 S17
SRM assay generation and data analysis in Skyline
 in Skyline Preparation 1. Download the example data from www.srmcourse.ch/eupa.html (3 raw files, 1 csv file, 1 sptxt file). 2. The number formats of your computer have to be set to English (United States).
HOWTO, example workflow and data files. (Version )
") HOWTO, example workflow and data files. (Version 20 09 2017) 1 Introduction: SugarQb is a collection of software tools (Nodes) which enable the automated identification of intact glycopeptides from HCD
HOWTO, example workflow and data files. (Version 20 09 2017) 1 Introduction: SugarQb is a collection of software tools (Nodes) which enable the automated identification of intact glycopeptides from HCD
TUTORIAL EXERCISES WITH ANSWERS
 TUTORIAL EXERCISES WITH ANSWERS Tutorial 1 Settings 1. What is the exact monoisotopic mass difference for peptides carrying a 13 C (and NO additional 15 N) labelled C-terminal lysine residue? a. 6.020129
Overview - MS Proteomics in One Slide. MS masses of peptides. MS/MS fragments of a peptide. Results! Match to sequence database
 Overview - MS Proteomics in One Slide Obtain protein Digest into peptides Acquire spectra in mass spectrometer MS masses of peptides MS/MS fragments of a peptide Results! Match to sequence database 2 But
Tutorial 1: Setting up your Skyline document
 Tutorial 1: Setting up your Skyline document Caution! For using Skyline the number formats of your computer have to be set to English (United States). Open the Control Panel Clock, Language, and Region
Protein Quantitation II: Multiple Reaction Monitoring. Kelly Ruggles New York University
 Protein Quantitation II: Multiple Reaction Monitoring Kelly Ruggles kelly@fenyolab.org New York University Traditional Affinity-based proteomics Use antibodies to quantify proteins Western Blot RPPA Immunohistochemistry
Workshop: SILAC and Alternative Labeling Strategies in Quantitative Proteomics
 Workshop: SILAC and Alternative Labeling Strategies in Quantitative Proteomics SILAC and Stable Isotope Dimethyl-Labeling Approaches in Quantitative Proteomics Ho-Tak Lau, Hyong-Won Suh, Shao-En Ong UW
Supplementary Figure 1
 Supplementary Figure 1 The correlation of n-score cutoff and FDR in both CID-only and CID-ETD fragmentation strategies. A bar diagram of different n-score thresholds applied in the search, plotted against
MassHunter Software Overview
 MassHunter Software Overview 1 Qualitative Analysis Workflows Workflows in Qualitative Analysis allow the user to only see and work with the areas and dialog boxes they need for their specific tasks A
Mass Spectrometry and Proteomics - Lecture 5 - Matthias Trost Newcastle University
 Mass Spectrometry and Proteomics - Lecture 5 - Matthias Trost Newcastle University matthias.trost@ncl.ac.uk Previously Proteomics Sample prep 144 Lecture 5 Quantitation techniques Search Algorithms Proteomics
DIA-Umpire: comprehensive computational framework for data independent acquisition proteomics
 DIA-Umpire: comprehensive computational framework for data independent acquisition proteomics Chih-Chiang Tsou 1,2, Dmitry Avtonomov 2, Brett Larsen 3, Monika Tucholska 3, Hyungwon Choi 4 Anne-Claude Gingras
Protein Quantitation II: Multiple Reaction Monitoring. Kelly Ruggles New York University
 Protein Quantitation II: Multiple Reaction Monitoring Kelly Ruggles kelly@fenyolab.org New York University Traditional Affinity-based proteomics Use antibodies to quantify proteins Western Blot Immunohistochemistry
NPTEL VIDEO COURSE PROTEOMICS PROF. SANJEEVA SRIVASTAVA
 LECTURE-25 Quantitative proteomics: itraq and TMT TRANSCRIPT Welcome to the proteomics course. Today we will talk about quantitative proteomics and discuss about itraq and TMT techniques. The quantitative
Improved 6- Plex TMT Quantification Throughput Using a Linear Ion Trap HCD MS 3 Scan Jane M. Liu, 1,2 * Michael J. Sweredoski, 2 Sonja Hess 2 *
 Improved 6- Plex TMT Quantification Throughput Using a Linear Ion Trap HCD MS 3 Scan Jane M. Liu, 1,2 * Michael J. Sweredoski, 2 Sonja Hess 2 * 1 Department of Chemistry, Pomona College, Claremont, California
Proteome-wide label-free quantification with MaxQuant. Jürgen Cox Max Planck Institute of Biochemistry July 2011
 Proteome-wide label-free quantification with MaxQuant Jürgen Cox Max Planck Institute of Biochemistry July 2011 MaxQuant MaxQuant Feature detection Data acquisition Initial Andromeda search Statistics
HOW TO USE MIKANA. 1. Decompress the zip file MATLAB.zip. This will create the directory MIKANA.
 HOW TO USE MIKANA MIKANA (Method to Infer Kinetics And Network Architecture) is a novel computational method to infer reaction mechanisms and estimate the kinetic parameters of biochemical pathways from
Designed for Accuracy. Innovation with Integrity. High resolution quantitative proteomics LC-MS
 Designed for Accuracy High resolution quantitative proteomics Innovation with Integrity LC-MS Setting New Standards in Accuracy The development of mass spectrometry based proteomics approaches has dramatically
MassHunter TOF/QTOF Users Meeting
 MassHunter TOF/QTOF Users Meeting 1 Qualitative Analysis Workflows Workflows in Qualitative Analysis allow the user to only see and work with the areas and dialog boxes they need for their specific tasks
1. Prepare the MALDI sample plate by spotting an angiotensin standard and the test sample(s).
.") Analysis of a Peptide Sequence from a Proteolytic Digest by MALDI-TOF Post-Source Decay (PSD) and Collision-Induced Dissociation (CID) Standard Operating Procedure Purpose: The following procedure may
Analysis of a Peptide Sequence from a Proteolytic Digest by MALDI-TOF Post-Source Decay (PSD) and Collision-Induced Dissociation (CID) Standard Operating Procedure Purpose: The following procedure may
Quantitation of a target protein in crude samples using targeted peptide quantification by Mass Spectrometry
 Quantitation of a target protein in crude samples using targeted peptide quantification by Mass Spectrometry Jon Hao, Rong Ye, and Mason Tao Poochon Scientific, Frederick, Maryland 21701 Abstract Background:
Tutorial 2: Analysis of DIA data in Skyline
 Tutorial 2: Analysis of DIA data in Skyline In this tutorial we will learn how to use Skyline to perform targeted post-acquisition analysis for peptide and inferred protein detection and quantitation using
Analyst Software. Peptide and Protein Quantitation Tutorial
 This document is provided to customers who have purchased AB Sciex equipment to use in the operation of such AB Sciex equipment. This document is copyright protected and any reproduction of this document
FRAGMENT SCREENING IN LEAD DISCOVERY BY WEAK AFFINITY CHROMATOGRAPHY (WAC )
") FRAGMENT SCREENING IN LEAD DISCOVERY BY WEAK AFFINITY CHROMATOGRAPHY (WAC ) SARomics Biostructures AB & Red Glead Discovery AB Medicon Village, Lund, Sweden Fragment-based lead discovery The basic idea:
FRAGMENT SCREENING IN LEAD DISCOVERY BY WEAK AFFINITY CHROMATOGRAPHY (WAC ) SARomics Biostructures AB & Red Glead Discovery AB Medicon Village, Lund, Sweden Fragment-based lead discovery The basic idea:
Last updated: Copyright
 Last updated: 2012-08-20 Copyright 2004-2012 plabel (v2.4) User s Manual by Bioinformatics Group, Institute of Computing Technology, Chinese Academy of Sciences Tel: 86-10-62601016 Email: zhangkun01@ict.ac.cn,
LysinebasedTrypsinActSite. A computer application for modeling Chymotrypsin
 LysinebasedTrypsinActSite A computer application for modeling Chymotrypsin Version.2 May 2006 LysTAS A computer application for modeling chymotrypsin Version.2 May 2006 Table of Contents Page. Introduction
Nature Methods: doi: /nmeth Supplementary Figure 1. Fragment indexing allows efficient spectra similarity comparisons.
 Supplementary Figure 1 Fragment indexing allows efficient spectra similarity comparisons. The cost and efficiency of spectra similarity calculations can be approximated by the number of fragment comparisons
TOMAHAQ Method Construction
 TOMAHAQ Method Construction Triggered by offset mass accurate-mass high-resolution accurate quantitation (TOMAHAQ) can be performed in the standard method editor of the instrument, without modifications
The Pitfalls of Peaklist Generation Software Performance on Database Searches
 Proceedings of the 56th ASMS Conference on Mass Spectrometry and Allied Topics, Denver, CO, June 1-5, 2008 The Pitfalls of Peaklist Generation Software Performance on Database Searches Aenoch J. Lynn,
Chemical Labeling Strategy for Generation of Internal Standards for Targeted Quantitative Proteomics
 Chemical Labeling Strategy for Generation of Internal Standards for Targeted Quantitative Proteomics mtraq Reagents Triplex Christie Hunter, Brian Williamson, Marjorie Minkoff AB SCIEX, USA The utility
Isotopic-Labeling and Mass Spectrometry-Based Quantitative Proteomics
 Isotopic-Labeling and Mass Spectrometry-Based Quantitative Proteomics Xiao-jun Li, Ph.D. Current address: Homestead Clinical Day 4 October 19, 2006 Protein Quantification LC-MS/MS Data XLink mzxml file
6 x 5 Ways to Ensure Your LC-MS/MS is Healthy
 6 x 5 Ways to Ensure Your LC-MS/MS is Healthy (Also known as - Tracking Performance with the 6 x 5 LC-MS/MS Peptide Reference Mixture) Mike Rosenblatt, Ph.D. Group Leader Mass Spec Reagents 215. We monitor
Supplementary Figure 1. SDS-PAGE analysis of GFP oligomer variants with different linkers. Oligomer mixtures were applied to a PAGE gel containing
 Supplementary Figure 1. SDS-PAGE analysis of GFP oligomer variants with different linkers. Oligomer mixtures were applied to a PAGE gel containing 0.1% SDS without boiling. The gel was analyzed by a fluorescent
Workflow concept. Data goes through the workflow. A Node contains an operation An edge represents data flow The results are brought together in tables
 PROTEOME DISCOVERER Workflow concept Data goes through the workflow Spectra Peptides Quantitation A Node contains an operation An edge represents data flow The results are brought together in tables Protein
SILAC and TMT. IDeA National Resource for Proteomics Workshop for Graduate Students and Post-docs Renny Lan 5/18/2017
 SILAC and TMT IDeA National Resource for Proteomics Workshop for Graduate Students and Post-docs Renny Lan 5/18/2017 UHPLC peak chosen at 26.47 min LC Mass at 571.36 chosen for MS/MS MS/MS MS This is a
X!TandemPipeline (Myosine Anabolisée) validating, filtering and grouping MSMS identifications
 validating, filtering and grouping MSMS identifications") X!TandemPipeline 3.3.3 (Myosine Anabolisée) validating, filtering and grouping MSMS identifications Olivier Langella and Benoit Valot langella@moulon.inra.fr; valot@moulon.inra.fr PAPPSO - http://pappso.inra.fr/
X!TandemPipeline 3.3.3 (Myosine Anabolisée) validating, filtering and grouping MSMS identifications Olivier Langella and Benoit Valot langella@moulon.inra.fr; valot@moulon.inra.fr PAPPSO - http://pappso.inra.fr/
High-Throughput Protein Quantitation Using Multiple Reaction Monitoring
 High-Throughput Protein Quantitation Using Multiple Reaction Monitoring Application Note Authors Ning Tang, Christine Miller, Joe Roark, Norton Kitagawa and Keith Waddell Agilent Technologies, Inc. Santa
Comprehensive support for quantitation
 Comprehensive support for quantitation One of the major new features in the current release of Mascot is support for quantitation. This is still work in progress. Our goal is to support all of the popular
Identification of proteins by enzyme digestion, mass
 Method for Screening Peptide Fragment Ion Mass Spectra Prior to Database Searching Roger E. Moore, Mary K. Young, and Terry D. Lee Beckman Research Institute of the City of Hope, Duarte, California, USA
1 Introduction. command intended for command prompt
 Guest Lecture, Smith College, CS 334, BioInformatics 21 October 2008 GROMACS, Position Restrained MD, Protein Catalytic Activity Filip Jagodzinski 1 Introduction GROMACS (GROningen MAchine for Chemistry
All Ions MS/MS: Targeted Screening and Quantitation Using Agilent TOF and Q-TOF LC/MS Systems
 All Ions MS/MS: Targeted Screening and Quantitation Using Agilent TOF and Q-TOF LC/MS Systems Technical Overview Introduction All Ions MS/MS is a technique that is available for Agilent high resolution
Applications of Mass Spectrometry for Biotherapeutic Characterization
 Applications of Mass Spectrometry for Biotherapeutic Characterization Case Studies of Disulfide Characterization and Separation free Modes of Analysis Steven L. Cockrill Amgen Colorado Analytical Sciences
A Description of the CPTAC Common Data Analysis Pipeline (CDAP)
") A Description of the CPTAC Common Data Analysis Pipeline (CDAP) v. 01/14/2014 Summary The purpose of this document is to describe the software programs and output files of the Common Data Analysis Pipeline
A Description of the CPTAC Common Data Analysis Pipeline (CDAP) v. 01/14/2014 Summary The purpose of this document is to describe the software programs and output files of the Common Data Analysis Pipeline
Key Words Q Exactive, Accela, MetQuest, Mass Frontier, Drug Discovery
 Metabolite Stability Screening and Hotspot Metabolite Identification by Combining High-Resolution, Accurate-Mass Nonselective and Selective Fragmentation Tim Stratton, Caroline Ding, Yingying Huang, Dan
PC235: 2008 Lecture 5: Quantitation. Arnold Falick
 PC235: 2008 Lecture 5: Quantitation Arnold Falick falickam@berkeley.edu Summary What you will learn from this lecture: There are many methods to perform quantitation using mass spectrometry (any method
The new Water Screening PCDL
 The new Water Screening PCDL Content and integration in suspect and non-target screening Dr. Thomas Glauner Senior LC/MS Applications Scientist EMEA Market Development Team 1 Accurate mass screening and
Spectronaut Pulsar. User Manual
 Spectronaut Pulsar User Manual 1 General Information... 6 1.1 Computer System Requirements... 6 1.2 Scope of Spectronaut Software... 6 1.3 Spectronaut Pulsar... 6 1.4 Spectronaut Release Features... 7
TMHMM2.0 User's guide
 TMHMM2.0 User's guide This program is for prediction of transmembrane helices in proteins. July 2001: TMHMM has been rated best in an independent comparison of programs for prediction of TM helices: S.
SUPPLEMENTARY INFORMATION
 SUPPLEMENTARY INFORMATION Sudhakaran Prabakaran, Robert A. Everley, Isabelle Landrieu, Jean-Michel Wieruszeski, Guy Lippens, Hanno Steen, Jeremy Gunawardena Department of Systems Biology, Harvard Medical
Protocol. Product Use & Liability. Contact us: InfoLine: Order per fax: www:
 Protocol SpikeTides Sets SpikeTides Sets_L heavy SpikeMix SpikeMix_L heavy Peptide Sets for relative quantification of Proteins in Mass Spectrometry Based Assays Contact us: InfoLine: +49-30-6392-7878
Skyline Small Molecule Targets
 Skyline Small Molecule Targets The Skyline Targeted Proteomics Environment provides informative visual displays of the raw mass spectrometer data you import into your Skyline documents. Originally developed
Methods for proteome analysis of obesity (Adipose tissue)
") Methods for proteome analysis of obesity (Adipose tissue) I. Sample preparation and liquid chromatography-tandem mass spectrometric analysis Instruments, softwares, and materials AB SCIEX Triple TOF 5600
Methods for proteome analysis of obesity (Adipose tissue) I. Sample preparation and liquid chromatography-tandem mass spectrometric analysis Instruments, softwares, and materials AB SCIEX Triple TOF 5600
MS-MS Analysis Programs
 MS-MS Analysis Programs Basic Process Genome - Gives AA sequences of proteins Use this to predict spectra Compare data to prediction Determine degree of correctness Make assignment Did we see the protein?
MS-based proteomics to investigate proteins and their modifications
 MS-based proteomics to investigate proteins and their modifications Francis Impens VIB Proteomics Core October th 217 Overview Mass spectrometry-based proteomics: general workflow Identification of protein
Department of Chemistry
 Scanning electron micrographs of silica colloidal crystals on the same size scale for (A) 490 ± 10 nm particles and (B) 145 ± 3 nm particles. Department of Chemistry Published in: Angela R. Soemo; Mary
profileanalysis Innovation with Integrity Quickly pinpointing and identifying potential biomarkers in Proteomics and Metabolomics research
 profileanalysis Quickly pinpointing and identifying potential biomarkers in Proteomics and Metabolomics research Innovation with Integrity Omics Research Biomarker Discovery Made Easy by ProfileAnalysis
Modeling Mass Spectrometry-Based Protein Analysis
 Chapter 8 Jan Eriksson and David Fenyö Abstract The success of mass spectrometry based proteomics depends on efficient methods for data analysis. These methods require a detailed understanding of the information
Let s continue our discussion on the interaction between Fe(III) and 6,7-dihydroxynaphthalene-2- sulfonate.
 and 6,7-dihydroxynaphthalene-2- sulfonate.") Chemistry 5995(133)-8990(013) Bioinorganic Chemistry: The Good, the Bad, and the Potential of Metals Assignment 2- Aqueous Speciation, Magnetism, Redox, UV-Vis Spectroscopy, and Pymol Let s continue our
Chemistry 5995(133)-8990(013) Bioinorganic Chemistry: The Good, the Bad, and the Potential of Metals Assignment 2- Aqueous Speciation, Magnetism, Redox, UV-Vis Spectroscopy, and Pymol Let s continue our
All numbered readings are from Beck and Geoghegan s The art of proof.
 MATH 301. Assigned readings and homework All numbered readings are from Beck and Geoghegan s The art of proof. Reading Jan 30, Feb 1: Chapters 1.1 1.2 Feb 6, 8: Chapters 1.3 2.1 Feb 13, 15: Chapters 2.2
Towards the Prediction of Protein Abundance from Tandem Mass Spectrometry Data
 Towards the Prediction of Protein Abundance from Tandem Mass Spectrometry Data Anthony J Bonner Han Liu Abstract This paper addresses a central problem of Proteomics: estimating the amounts of each of
An Effective Workflow for Impurity Analysis Incorporating High Quality HRAM LCMS & MSMS with Intelligent Automated Data Mining
 An Effective Workflow for Impurity Analysis Incorporating High Quality HRAM LCMS & MSMS with Intelligent Automated Data Mining Dave Weil, Ph.D. and Jim Lau, Ph.D. Typical Method Conditions: 1260 UHPLC
Protein Identification Using Tandem Mass Spectrometry. Nathan Edwards Informatics Research Applied Biosystems
 Protein Identification Using Tandem Mass Spectrometry Nathan Edwards Informatics Research Applied Biosystems Outline Proteomics context Tandem mass spectrometry Peptide fragmentation Peptide identification
CHEM 121: Chemical Biology
 Instructors Prof. Jane M. Liu (HS-212) jliu3@drew.edu x3303 Office Hours Anytime my office door is open CHEM 121: Chemical Biology Class MF 2:30-3:45 pm PRE-REQUISITES: CHEM 117 COURSE OVERVIEW This upper-level
Developing Algorithms for the Determination of Relative Abundances of Peptides from LC/MS Data
 Developing Algorithms for the Determination of Relative Abundances of Peptides from LC/MS Data RIPS Team Jake Marcus (Project Manager) Anne Eaton Melanie Kanter Aru Ray Faculty Mentors Shawn Cokus Matteo
NMR Assignments using NMRView II: Sequential Assignments
 NMR Assignments using NMRView II: Sequential Assignments DO THE FOLLOWING, IF YOU HAVE NOT ALREADY DONE SO: For Mac OS X, you should have a subdirectory nmrview. At UGA this is /Users/bcmb8190/nmrview.
4. GIS Implementation of the TxDOT Hydrology Extensions
 4. GIS Implementation of the TxDOT Hydrology Extensions A Geographic Information System (GIS) is a computer-assisted system for the capture, storage, retrieval, analysis and display of spatial data. It
via Tandem Mass Spectrometry and Propositional Satisfiability De Novo Peptide Sequencing Renato Bruni University of Perugia
 De Novo Peptide Sequencing via Tandem Mass Spectrometry and Propositional Satisfiability Renato Bruni bruni@diei.unipg.it or bruni@dis.uniroma1.it University of Perugia I FIMA International Conference
SPECTRA LIBRARY ASSISTED DE NOVO PEPTIDE SEQUENCING FOR HCD AND ETD SPECTRA PAIRS
 SPECTRA LIBRARY ASSISTED DE NOVO PEPTIDE SEQUENCING FOR HCD AND ETD SPECTRA PAIRS 1 Yan Yan Department of Computer Science University of Western Ontario, Canada OUTLINE Background Tandem mass spectrometry
Background: Imagine it is time for your lunch break, you take your sandwich outside and you sit down to enjoy your lunch with a beautiful view of
 Background: Imagine it is time for your lunch break, you take your sandwich outside and you sit down to enjoy your lunch with a beautiful view of Montana s Rocky Mountains. As you look up, you see what
Self-assembling covalent organic frameworks functionalized. magnetic graphene hydrophilic biocomposite as an ultrasensitive
 Electronic Supplementary Material (ESI) for Nanoscale. This journal is The Royal Society of Chemistry 2017 Electronic Supporting Information for: Self-assembling covalent organic frameworks functionalized
Computational Methods for Mass Spectrometry Proteomics
 Computational Methods for Mass Spectrometry Proteomics Eidhammer, Ingvar ISBN-13: 9780470512975 Table of Contents Preface. Acknowledgements. 1 Protein, Proteome, and Proteomics. 1.1 Primary goals for studying
NIH Center for Macromolecular Modeling and Bioinformatics Developer of VMD and NAMD. Beckman Institute
 NIH Center for Macromolecular Modeling and Bioinformatics Developer of VMD and NAMD 5 faculty members (2 physics, 1 chemistry, 1 biochemistry, 1 computer science); 8 developers; 1 system admin; 15 post
B American Society for Mass Spectrometry, 2017 J. Am. Soc. Mass Spectrom. (2017) 29:866Y878 DOI: /s
 29:866Y878 DOI: /s") B American Society for Mass Spectrometry, 2017 J. Am. Soc. Mass Spectrom. (2017) 29:866Y878 DOI: 10.1007/s13361-017-1852-3 FOCUS: 29 th SANIBEL CONFERENCE, PEPTIDOMICS: BRIDGING THE GAP BETWEEN PROTEOMICS
B American Society for Mass Spectrometry, 2017 J. Am. Soc. Mass Spectrom. (2017) 29:866Y878 DOI: 10.1007/s13361-017-1852-3 FOCUS: 29 th SANIBEL CONFERENCE, PEPTIDOMICS: BRIDGING THE GAP BETWEEN PROTEOMICS
The Theory of HPLC. Quantitative and Qualitative HPLC
 The Theory of HPLC Quantitative and Qualitative HPLC i Wherever you see this symbol, it is important to access the on-line course as there is interactive material that cannot be fully shown in this reference
BCMB/CHEM 8190 Lab Exercise Using Maple for NMR Data Processing and Pulse Sequence Design March 2012
 BCMB/CHEM 8190 Lab Exercise Using Maple for NMR Data Processing and Pulse Sequence Design March 2012 Introduction Maple is a powerful collection of routines to aid in the solution of mathematical problems
Assignment 1 Physics/ECE 176
 Assignment 1 Physics/ECE 176 Made available: Thursday, January 13, 211 Due: Thursday, January 2, 211, by the beginning of class. Overview Before beginning this assignment, please read carefully the part
Protocol. Product Use & Liability. Contact us: InfoLine: Order per fax: www:
 Protocol SpikeTides Set TAA - light SpikeTides Set TAA_L - heavy Peptide Sets for relative quantification of Tumor Associated Antigens (TAAs) in SRM and MRM Assays Contact us: InfoLine: +49-30-6392-7878
Nature Structural and Molecular Biology: doi: /nsmb Supplementary Figure 1
 Supplementary Figure 1 SUMOylation of proteins changes drastically upon heat shock, MG-132 treatment and PR-619 treatment. (a) Schematic overview of all SUMOylation proteins identified to be differentially
Computational Structural Biology and Molecular Simulation. Introduction to VMD Molecular Visualization and Analysis
 Computational Structural Biology and Molecular Simulation Introduction to VMD Molecular Visualization and Analysis Emad Tajkhorshid Department of Biochemistry, Beckman Institute, Center for Computational
Proteomics. November 13, 2007
 Proteomics November 13, 2007 Acknowledgement Slides presented here have been borrowed from presentations by : Dr. Mark A. Knepper (LKEM, NHLBI, NIH) Dr. Nathan Edwards (Center for Bioinformatics and Computational
BA, BSc, and MSc Degree Examinations
 Examination Candidate Number: Desk Number: BA, BSc, and MSc Degree Examinations 2017-8 Department : BIOLOGY Title of Exam: Molecular Biology and Biochemistry Part I Time Allowed: 1 hour and 30 minutes
ProMass Deconvolution User Training. Novatia LLC January, 2013
 ProMass Deconvolution User Training Novatia LLC January, 2013 Overview General info about ProMass Features Basics of how ProMass Deconvolution works Example Spectra Manual Deconvolution with ProMass Deconvolution
Reagents. Affinity Tag (Biotin) Acid Cleavage Site. Figure 1. Cleavable ICAT Reagent Structure.
 Acid Cleavage Site. Figure 1. Cleavable ICAT Reagent Structure.") DATA SHEET Protein Expression Analysis Reagents Background The ultimate goal of proteomics is to identify and quantify proteins that are relevant to a given biological state; and to unearth networks of
DATA SHEET Protein Expression Analysis Reagents Background The ultimate goal of proteomics is to identify and quantify proteins that are relevant to a given biological state; and to unearth networks of
Peptide Targeted Quantification By High Resolution Mass Spectrometry A Paradigm Shift? Zhiqi Hao Thermo Fisher Scientific San Jose, CA
 Peptide Targeted Quantification By High Resolution Mass Spectrometry A Paradigm Shift? Zhiqi Hao Thermo Fisher Scientific San Jose, CA Proteomics is Turning Quantitative Hmmm.. Which ones are my targets?
SUPPLEMENTARY INFORMATION
 Parallel Allostery by camp and PDE Coordinates Activation and Termination Phases in camp Signaling Srinath Krishnamurthy, 1 Nikhil Kumar Tulsian, 1 Arun Chandramohan, 1 and Ganesh S. Anand 1, * 1 Department
Supplementary Materials for R3P-Loc Web-server
 Supplementary Materials for R3P-Loc Web-server Shibiao Wan and Man-Wai Mak email: shibiao.wan@connect.polyu.hk, enmwmak@polyu.edu.hk June 2014 Back to R3P-Loc Server Contents 1 Introduction to R3P-Loc
Chemistry 224 Bioorganic Chemistry Friday, Sept. 29, This Exam is closed book and closed notes. Please show all your work!
 page 1 of 6 hemistry 224 ame Bioorganic hemistry Friday, ept. 29, 2000 Exam 1 100 points This Exam is closed book and closed notes Please show all your work! tereochemistry counts as indicated! eatness
Mass spectrometry has been used a lot in biology since the late 1950 s. However it really came into play in the late 1980 s once methods were
 Mass spectrometry has been used a lot in biology since the late 1950 s. However it really came into play in the late 1980 s once methods were developed to allow the analysis of large intact (bigger than
The Power of LC MALDI: Identification of Proteins by LC MALDI MS/MS Using the Applied Biosystems 4700 Proteomics Analyzer with TOF/TOF Optics
 APPLICATION NOTE TOF MS The Power of LC MALDI: Identification of Proteins by LC MALDI MS/MS Using the Applied Biosystems 4700 Proteomics Analyzer with TOF/TOF Optics Purpose The Applied Biosystems 4700
SUPPLEMENTARY INFORMATION
 5 N 4 8 20 22 24 2 28 4 8 20 22 24 2 28 a b 0 9 8 7 H c (kda) 95 0 57 4 28 2 5.5 Precipitate before NMR expt. Supernatant before NMR expt. Precipitate after hrs NMR expt. Supernatant after hrs NMR expt.
NIH Center for Macromolecular Modeling and Bioinformatics Developer of VMD and NAMD. Beckman Institute
 NIH Center for Macromolecular Modeling and Bioinformatics Developer of VMD and NAMD 5 faculty members (2 physics, 1 chemistry, 1 biochemistry, 1 computer science); 8 developers; 1 system admin; 15 post
CycloBranch. Tutorials
 CycloBranch Tutorials Outline Tutorial 1: Does a peptide have a cycle? Tutorial 2: How to determine a tag? Tutorial 3: How to determine a complete sequence? Tutorial 4: How to determine a branched sequence?
WADA Technical Document TD2015IDCR
 MINIMUM CRITERIA FOR CHROMATOGRAPHIC-MASS SPECTROMETRIC CONFIRMATION OF THE IDENTITY OF ANALYTES FOR DOPING CONTROL PURPOSES. The ability of a method to identify an analyte is a function of the entire
Serine-7 but not serine-5 phosphorylation primes RNA polymerase II CTD for P-TEFb recognition
 Supplementary Information to Serine-7 but not serine-5 phosphorylation primes RNA polymerase II CTD for P-TEFb recognition Nadine Czudnochowski 1,2, *, Christian A. Bösken 1, * & Matthias Geyer 1 1 Max-Planck-Institut
Build_model v User Guide
 Build_model v.2.0.1 User Guide MolTech Build_model User Guide 2008-2011 Molecular Technologies Ltd. www.moltech.ru Please send your comments and suggestions to contact@moltech.ru. Table of Contents Input
Improved Throughput and Reproducibility for Targeted Protein Quantification Using a New High-Performance Triple Quadrupole Mass Spectrometer
 Improved Throughput and Reproducibility for Targeted Protein Quantification Using a New High-Performance Triple Quadrupole Mass Spectrometer Reiko Kiyonami, Mary Blackburn, Andreas FR Hühme: Thermo Fisher
ECEN 651: Microprogrammed Control of Digital Systems Department of Electrical and Computer Engineering Texas A&M University
 ECEN 651: Microprogrammed Control of Digital Systems Department of Electrical and Computer Engineering Texas A&M University Prof. Mi Lu TA: Ehsan Rohani Laboratory Exercise #4 MIPS Assembly and Simulation
DADA17-69-C-9182 ; FEASIBILITY STUDY OF CYTOCHALASIN B ENUCLEATION OF CELLS FINAL REPORT. Richard D. Estensen, M. D. 15 June 1973
 DTIO FILE COPY AD DADA17-69-C-9182 ; FEASIBILITY STUDY OF CYTOCHALASIN B ENUCLEATION OF CELLS FINAL REPORT Richard D. Estensen, M. D. 15 June 1973 i i Supported by II * 11 * U. S. ARMY MEDICAL RESEARCH
Introduction to FBDD Fragment screening methods and library design
 Introduction to FBDD Fragment screening methods and library design Samantha Hughes, PhD Fragments 2013 RSC BMCS Workshop 3 rd March 2013 Copyright 2013 Galapagos NV Why fragment screening methods? Guess
ASEAN GUIDELINES FOR VALIDATION OF ANALYTICAL PROCEDURES
 ASEAN GUIDELINES FOR VALIDATION OF ANALYTICAL PROCEDURES Adopted from ICH Guidelines ICH Q2A: Validation of Analytical Methods: Definitions and Terminology, 27 October 1994. ICH Q2B: Validation of Analytical
Making Sense of Differences in LCMS Data: Integrated Tools
 Making Sense of Differences in LCMS Data: Integrated Tools David A. Weil Agilent Technologies MassHunter Overview Page 1 March 2008 How Clean is our Water?... Page 2 Chemical Residue Analysis.... From