Effective Properties of Randomly Oriented Kenaf Short Fiber Reinforced Epoxy Composite
|
|
|
- Jasper Griffin
- 5 years ago
- Views:
Transcription


1 Utah State University All Graduate Theses and Dissertations Graduate Studies Effective Properties of Randomly Oriented Kenaf Short Fiber Reinforced Epoxy Composite Dayakar Naik L. Utah State University Follow this and additional works at: Part of the Mechanical Engineering Commons Recommended Citation L., Dayakar Naik, "Effective Properties of Randomly Oriented Kenaf Short Fiber Reinforced Epoxy Composite" (2015). All Graduate Theses and Dissertations This Dissertation is brought to you for free and open access by the Graduate Studies at It has been accepted for inclusion in All Graduate Theses and Dissertations by an authorized administrator of For more information, please contact
2 EFFECTIVE PROPERTIES OF RANDOMLY ORIENTED KENAF SHORT FIBER REINFORCED EPOXY COMPOSITE by Dayakar Naik L A dissertation submitted in partial fulfillment of the requirements for the degree of DOCTOR OF PHILOSOPHY in Mechanical Engineering Approved: Dr. Thomas H. Fronk Major Professor Dr. Steven L. Folkman Committee Member Dr. Barton Smith Committee Member Dr. Ling Liu Committee Member Dr. Paul Barr Committee Member Dr. Mark R. McLellan Vice President for Research and Dean of the School of Graduate Studies UTAH STATE UNIVERSITY Logan, Utah 2015
3 ii Copyright c Dayakar Naik L 2015 All Rights Reserved
4 iii Abstract Effective Properties of Randomly Oriented Kenaf Short Fiber Reinforced Epoxy Composite by Dayakar Naik L, Doctor of Philosophy Utah State University, 2015 Major Professor: Dr. Thomas H. Fronk Department: Mechanical and Aerospace Engineering Natural fibers have drawn attention of researchers as an environmentally-friendly alternative to synthetic fibers. Developing natural fiber reinforced bio-composites are a viable alternative to the problems of non-degrading and energy consuming synthetic composites. This study focuses on (i) the application of kenaf fiber as a potential reinforcement and, (ii) determining the tensile properties of the randomly oriented short kenaf fiber composite both experimentally and numerically. Kenaf fiber micro-structure and its Young s modulus with varying gage length (10, 15, 20, and 25.4 mm) were investigated. The variation in tensile strength of kenaf fibers was analyzed using the Weibull probability distribution function. It was observed that the Young s modulus of kenaf fiber increased with increase in gage length. Fabrication of randomly oriented short kenaf fiber using vacuum bagging techniques and hand-lay-up techniques were discussed and the tensile properties of the specimens were obtained experimentally. The tensile modulus of the composite sample at 22% fiber volume fraction was found to be 6.48 GPa and tensile strength varied from 20 to 38 MPa. Numerical models based on the micro mechanics concepts in conjunction with finite element methods were developed for predicting the composite properties. A two-step homogenization procedure was developed to evaluate the elastic constants at the cell wall level and the
5 iv meso-scale level respectively. Von-Mises Fisher probability distribution function was applied to model the random orientation distribution of fibers and obtain equivalent modulus of composite. The predicted equivalent modulus through numerical homogenization was in good agreement with the experimental results. (154 pages)
6 v Public Abstract Effective Properties of Randomly Oriented Kenaf Short Fiber Reinforced Epoxy Composite by Dayakar Naik L, Doctor of Philosophy Utah State University, 2015 Major Professor: Dr. Thomas H. Fronk Department: Mechanical and Aerospace Engineering Natural fibers have drawn attention of researchers as an environmentally-friendly alternative to synthetic fibers. Developing natural fiber reinforced bio-composites are a viable alternative to the problems of non-degrading and energy consuming synthetic composites. This study focuses on (i) the application of kenaf fiber as a potential replacement for glass fibers and (ii) determining the mechanical properties of the randomly oriented short kenaf fiber composite both experimentally and numerically. Kenaf fiber micro-structure and its mechanical properties with varying gage length (10, 15, 20, and 25.4 mm) were investigated. The variation in tensile strength of kenaf fibers was analyzed using a statistical method called Weibull probability distribution function. It was observed that the Young s modulus of kenaf fiber increased with increase in gage length. Fabrication of randomly oriented short kenaf fiber using vacuum bagging techniques and hand-layup techniques were discussed and the tensile properties of the specimens were obtained experimentally. The tensile modulus of the composite sample at 22% fiber volume fraction was found to be 6.48 GPa and the tensile strength varied from 20 to 38 MPa. Simultaneously, a computer program (finite element method) was written to predict the tensile properties of composites
7 using a micro mechanics approach. The predicted equivalent modulus through a computer program (finite element method) was in good agreement with the experimental results. vi
8 To my parents Laxmi and Balaiah, and all my teachers. vii
9 viii Acknowledgments I would like to express my sincere gratitude to my advisor Dr. Thomas H. Fronk for the continuous support of my research work, for his patience, motivation, enthusiasm and immense knowledge. His supervision helped me in all the time of research and writing of this dissertation. I could not have imagined having a better advisor and mentor for my Ph.D. study. Also, I would like to thank the rest of my dissertation committee: Dr. Barton L. Smith, Dr. Steven L. Folkman, Dr. Ling Liu and Dr. Paul Barr, for their encouragement and insightful comments. My appreciation also goes to the staff of the MAE department, Chris Spall, Karen Zobell and Terry Zollinger, who helped during the course of my study. I thank my fellow lab mates Brian Spackman and Manjunath Prasad for all the support during experimentation. Also I thank my friends Naga Sai Ram Mallik, Abdulla Khan, Bhuvanesh Kumar, Arvind Konda and Varun for their continuous support and motivation during tough times. Above all, I thank my parents Laxmi and Balaiah, my brother Jairam and my sister Jyothi for their love, support and understanding during the long years of my education. Dayakar L. Naik
10 ix Contents Page Abstract Public Abstract Acknowledgments List of Tables List of Figures iii v viii xi xiii 1 Introduction Background Kenaf Fiber as Reinforcement for Composites Review of Literature Structure of Dissertation Research Objectives Objectives Research Approach Experimentation Micro-Structure of Kenaf Fiber Influence of Gage Length on Kenaf Fiber s Young s Modulus Materials and Procedure Cross-Sectional Area Measurement Uncertainty in Area Calculation Uncertainty in Young s Modulus Weibull Analysis for Tensile Strength of Kenaf Fiber Results and Discussion Tensile Modulus of Kenaf Fiber Composite Specimen Preparation Experimental Setup Load Cell and Calibration Tensile Testing Results and Discussion Numerical Modeling Introduction Finite Element Formulation Boundary Conditions Effective Properties of Cell Wall Layers in Bast Fiber
11 4.5 Effective Properties of Unidirectional Composite Von-Mises Fisher Probability Distribution Equivalent Properties of Randomly Oriented Short Fiber Composite Observations Summary, Conclusion, and Future Work Summary of Work Performed Summary of Findings and Conclusion Future Work References Appendices A Fiber Cross-Sectional Area B Figures C Finite Element Code C.1 Input File Code C.2 Sorting Surface Code C.3 Sorting Surface Code C.4 Finite Element Code Vita x
12 xi List of Tables Table Page 1.1 Comparison of Natural and E-glass Fiber Properties Volume Fraction of Basic Constituents in a Bast Fiber Tensile Strength and Modulus of Various Bast Fibers from Literature Tensile Modulus of Kenaf Fiber Composites mm mm mm mm Two Parameter Model Three Parameter Weibull Distribution Constants Weibull of Weibull Model Epoxy Matrix Properties Uncertainties Associated with Kenaf Composite Geometry Kenaf Fiber Composite Properties Boundary Conditions Elastic Constants of Constituents [11] Structural Dimensions Volume Fraction of Constituents Mesh Format File Comparison of Elastic Constants in S1 Layer Comparison of Elastic Constants in S2 Layer
13 4.8 Comparison of Elastic Constants in S3 Layer Elastic Constants with Varying Volume Fractions Material Properties of Each Layer in Cell Wall Except S2 (MPa) Elastic Constants(GPa) at Volume Fraction 50/27/ Elastic Constants(GPa) at Volume Fraction 55/24/ Elastic Constants(GPa) at Volume Fraction 60/23/ Elastic Constants(GPa) at Volume Fraction 65/20/ Elastic Constants(GPa) at Volume Fraction 70/17/ Elastic Constants(GPa) of Random Fiber Composite at Volume Fraction 50/27/ A.1 Evaluated Fiber Area Using ImageJ (25.4mm) A.2 Evaluated Fiber Area Using ImageJ (20mm) A.3 Evaluated Fiber Area Using ImageJ (15mm) A.4 Evaluated Fiber Area Using ImageJ (10mm) A.5 Elastic Constants(GPa) of Random Fiber Composite at Volume Fraction 55/24/ A.6 Elastic Constants(GPa) of Random Fiber Composite at Volume Fraction 60/23/ A.7 Elastic Constants(GPa) of Random Fiber Composite at Volume Fraction 65/20/ A.8 Elastic Constants(GPa) of Random Fiber Composite at Volume Fraction 70/17/ xii
14 xiii List of Figures Figure Page 1.1 Various Types of Composites Processing Steps of Natural Fiber Schematic Representation of Bundle of Cell Walls in Bast Fiber Optical Microscopic Image of Kenaf Fibers at 50X Magnification Scanning Electron Microscopic Image of Kenaf Fibers Optical Microscopic Image of Kenaf Fibers Along the Length Fixation of Kenaf Fiber Specimen for Tensile Test on Paperboard Specimen Preparation for Measuring Area of Fiber Calibration Scale at 50X Magnification Kenaf Fiber Stress-Strain Curve Kenaf Fiber Stress-Strain Curve (Contd) Young s Modulus of Kenaf Fiber with Varying Gage Length Weibull Probability Density Function with Varying Shape and Scale Parameters Linear Fit for Two Parameter Weibull Model Linear Fit for Two Parameter Weibull Model with Diameter Dependence Linear Fit for Two Parameter Weibull Model with Diameter Dependence (Contd) Cumulative Distribution Function of Three Parameter Model for Full Data Cumulative Distribution Function of Three Parameter Model for Consistent Data Cumulative Distribution Function of Three Parameter Model for Consistent Data (Contd)
15 xiv 3.14 Average Strength Comparison Mold for Casting Tensile Specimens Epoxy Samples Casting Kenaf Fiber Composite Sample Processing of Kenaf Fiber Composite Plate Using Vacuum Bagging Technique Tensile Test Setup Load Cell Wiring Diagram Load Cell Calibration Calibration Curve Epoxy Tensile Test Kenaf Fiber Composite Tensile Test Stress-Strain Diagram Kenaf Fiber Composite Stress-Strain Diagram Kenaf Fiber Composite (Contd) Schematic Representation of Unit Cell Hexahedral Element Schematic Representation of Boundary Conditions on the Model Basic Constituents in Cell Wall Layer D Unit Cell Geometry Node Numbering of Unit Cell Geometry Quadrant Unit Cell Model Axial Load Case Transverse Load Case Longitudinal Shear Loading Young s Modulus in Axial Direction Young s Modulus in Transverse Direction
16 4.13 Longitudinal Shear Modulus Poisson s Ratio from 3D Model Basic Hexagonal Shaped Cell Schematic Representation of Bundle of Cell Walls Periodic Arrangement of Natural Fiber in a Matrix Unit Cell of Natural Fiber Reinforced Unidirectional Composite Axial Load Case Transverse Load Case Longitudinal Shear Periodic Boundary Conditions for Transverse Shear Transverse Shear Effect of MFA on Axial Modulus Effect of MFA on Macroscopic Elastic Properties Von-Mises Fisher Random Variables Random Fiber Distribution with Varying k Von-Mises PDF with Varying k Coordinate System Equivalent Young s Modulus With Varying Concentration Factor Equivalent Poisson s Ratio With Varying Concentration Factor B.1 Cumulative Distribution Function with Evaluated Parameters B.1 Cumulative Distribution Function with Evaluated Parameters (Contd) B.2 Cumulative Distribution Function of Three Parameter Model for Consistent Data B.2 Cumulative Distribution Function of Three Parameter Model for Consistent Data (Contd) B.3 Block Diagram of Tensile Test xv
17 1 Chapter 1 Introduction 1.1 Background The composite material is processed from a mixture of two or more different materials in certain proportions. Generally speaking, composite comprises a fiber reinforcement embedded in a polymeric matrix. The motivation behind the invention of a composite material comes from the demand of low weight and high strength material for the aerospace industry. The major work in this area was carried out during 1960 s and to date there are several types of composites being developed for various applications [1]. Examples of some synthetic fibers are glass, carbon, boron, aramid and Kevlar. Commercially available polymer matrices include epoxy, polypropylene and polyethylene. Metals and ceramics are also used as matrix materials in composite processing. A wide range of these composite materials have been successfully used for structural applications in the aircraft, space, automotive, marine and infrastructure industries. Generally, for structural applications, composite laminates are processed by stacking lamina with varying fiber orientations to achieve the desired structural behavior. Structural functionality includes high tensile load carrying members; low thermal expansion, thermal barriers etc; and sometimes discontinuous fiber composite as shown in Fig 1.1. The mechanical behavior of such laminates is anisotropic in nature, meaning it depends on the fiber and matrix properties, fiber orientation and volume fraction, the interface bond between fiber and matrix, and processing techniques. The choice of a particular composite processing technique depends on the type of matrix to be used for composite, either thermoset or thermoplastic. Techniques used for thermoset kind matrix include resin transfer molding, vacuum assisted resin transfer molding, compression resin transfer molding, and pultrusion process. Thermoplastic kind matrix includes compression molding, filament winding and
 are processed from petroleum based products and the previously mentioned processing techniques are")
18 injection molding. Application of these techniques depends on the type of structure (flat or complex), rate of production and type of application. 2 Fig. 1.1: Various Types of Composites Most of the existing composite materials (both fibers and polymers) are processed from petroleum based products and the previously mentioned processing techniques are power consuming. Consequently, some concerns associated with the commercially available composites are high energy consumption, non-recyclability, non-renewability and cost. There is a need for developing an alternate composite material or processing technique that is economical, low energy consuming and environmental friendly. In recent years, researchers explored the potential natural fibers (derived from plants and animals) as a replacement for synthetic fibers. An experimental investigation of some natural fibers conducted by S. V. Joshi et al.[2] proved to be capable of replacing E-glass fibers. At this point, before proceeding into details, the following questions must be answered: What is the morphology of natural fibers? Do these fibers have enough benefits to replace existing commercial fibers? How does one process a natural fiber reinforced composite? What are the major advantages and applications of natural fiber composites?
19 3 Natural fibers in this context imply those derived or obtained from plants. These fibers can be obtained from different parts of a plant, including the stem, leaf, root, core and fruit [3]. The fibers obtained from the stem are called bast fibers and those obtained from the leaf, root and fruit are called leaf fibers, root fibers and fruit fibers respectively. Examples of bast fibers are hemp, flax, kenaf, and jute, leaf fibers are abaca, sisal and pineapple, and fruit fibers are cotton, coir and kapok [3]. A summary of worldwide production of various natural fibers was given in [3, 4]. It was observed that the bast fibers are most commonly used, followed by leaf and fruit fibers, proving their abundance in nature. This is why past few years of research have focused on using bast fibers as a replacement for synthetic fibers. The potential of various bast fibers as a composite reinforcement is discussed in the subsequent sections. Once the source for fibers has been chosen, the next step is extracting fibers from the stem (known as retting). Various retting processes currently used in industry include dew-retting, water retting, chemical retting and physical methods [4]. The effect of retting methods on the bast fiber properties was collectively discussed in a review article [4]. Water retting results in good quality fiber but takes 2-3 weeks, whereas chemical retting is done quickly and results in decreased strength of the fibers. The process of retting is followed by decortication, carding and spinning into yarn. The full process of various fiber extractions [5] is shown in Fig 1.2. Table 1.1: Comparison of Natural and E-glass Fiber Properties Properties E-glass Hemp Jute Ramie Coir Sisal Flax Cotton Density (g/cm3) E-modulus (GPa) Specific modulus The potential (specific modulus) of the natural fibers as a reinforcement was studied by Wambua et al. [6] and shown in Table 1.1. Five different fibers; sisal, kenaf, hemp, jute and coir were selected in [6] and a polypropylene matrix based composite was processed. The mechanical properties of these composites were compared to that of E-glass fiber reinforced composites. Specific modulus of natural fiber reinforced and E-glass fiber reinforced composites were reported to be comparable except in the case of coir. Earlier
20 4 research focused on flax, hemp, bamboo and jute fibers due to their abundant availability and extensive use in the textile industry. This study will focus on a similar common fiber source, the kenaf plant. Kenaf fiber secures third place in terms of worldwide production ( ton per year) after jute. In addition to its availability, kenaf belongs to the same family as the jute plant [7] and is likely to share jute s desirable properties. There is a need for research about kenaf fiber properties and its surface characteristics if it is to become a successful reinforcement for composite production. Fig. 1.2: Processing Steps of Natural Fiber Unlike artificial fibers, natural fibers show great variation in their mechanical properties due to: growth conditions, age of the plant, which part of the stem they are extracted from, varying constituent s fraction at the microscopic level, etc. Shinji Ochi [8] reported the variation of kenaf fiber modulus as a function of fiber location on the stem, where fibers obtained from the bottom part of a plant exhibited more tensile strength (about
21 5 20% more). The tensile strength of a fiber determined experimentally at the macroscopic scale is governed by the structure and the chemical composition present at the microscopic scale. Most of the materials available in nature are composite in nature (i.e. the material is a mixture of different chemical constituents). Similarly, bast fibers also consist of constituents namely: cellulose, hemicellulose, lignin, pectin and waxes at the microscopic scale [3]. Fibers obtained from different plants have variation of these constituents and consequently exhibit different properties. The volume fraction of each constituent in different fibers was reported in [3, 4] and is presented here in Table 1.2. The major advantages of developing natural fiber based composites include low cost, low density, recyclability, low pollution, no health hazards and effective utilization of resources [2]. To this point, natural fiber composites can be used for secondary structural application due to their lower tensile strength and mechanical properties compared to that of primary structural applications. Some applications were listed in [10, 11] that includes seat backs, dashboards, door panels, and sports goods. In order to expand the use of natural fiber based composites, further detailed investigations are required with a focus on strength improvement. 1.2 Kenaf Fiber as Reinforcement for Composites Kenaf (Hibiscus Cannabinus) is an annual herbaceous fiber plant from the tropical and subtropical regions of Africa and Asia [12, 13]. It is also found in the parts of Europe and USA. Kenaf plants grow up to 4m in about 3-4 months with a base diameter of 3-5 cm. The cost of kenaf fibers in the year 2000 was $ per ton and 15MJ of energy was consumed to produce 1 kg of kenaf fiber, where glass fibers consumed 54MJ [14]. After processing, the average length of a kenaf fiber available in the market is around 70 mm with the diameter ranging from 10 µm to 80 µm. The potential of kenaf fiber as a reinforcement in composite was reported by various authors [6, 12, 15] in the past by comparing the specific modulus of a composite with that of glass fiber reinforced composite. The tensile modulus of kenaf fiber reinforced polypropylene composite was reported to be the same as that of glass fiber mat reinforced composite [6] at 22% volume fraction. A discussion on
22 6 manufacturing problems of kenaf fiber reinforced composite, due to the limited available length of fiber, was produced by Zampaloni et al. [12]. They concluded that the short fiber and compression molding technique resulted in a composite with 40% weight fraction of fiber and greater specific strength compared to E-glass fiber composite. Most of the research investigations in the past were conducted on composites processed through thermoplastic techniques that required high temperature and pressure during processing. These higher temperatures (160 0 C), resulted in reduced tensile strength [8] which consequently resulted in reduced composite properties. An alternative to thermoplastic processing is thermoset processing, which does not require higher temperatures. It is also a good technique for fabrication of complex structures. Table 1.2: Volume Fraction of Basic Constituents in a Bast Fiber Fiber Cellulose (%) Hemicellulose (%) Lignin (%) Reference [3] Jute [4] [9] Kenaf [3] [4] Hemp [3] [4] Flax [3] [4] The Young s modulus of kenaf fiber varied from source to source [7]. Many factors, such as growth conditions, location on the stem from where the fiber is obtained, varying composition of basic constituents, and defects such as kink bands, can influence the fiber properties. Along with the above mentioned factors, the cross sectional area calculation of the fiber also plays a vital role in determining the Young s modulus. The effective properties of a composite are a function of fiber volume fraction, Young s modulus and its geometry, orientation of fibers, interfacial bonding between fibers and matrix and defects such as voids. Therefore, the behavior of kenaf fibers should be explored in detail. To the authors knowledge, neither has there been significant effort to determine the interfacial properties of kenaf fiber and epoxy matrix, nor to explore the option of short kenaf fiber as reinforcement.
23 7 This study aims at determining Young s modulus of kenaf fiber and its composite (fabricated through hand-lay-up technique) and develop a numerical homogenization model to predict the effective properties of the composite. Objectives are discussed more specifically in the next chapter. 1.3 Review of Literature The organization of this section is as follows: micro-structure of bast fiber, mechanical properties of kenaf fibers and its composites. Micro-structure of any bast fiber consists of a bundle of cell walls together with a middle lamella as an interfacing layer. Cell walls are hollow laminated composite tubes (cross-section) consisting of Primary (P) and Secondary (S1, S2 and S3) layers with varying micro fibril or cellulose orientation in each layer. Volume fraction of basic constituents in kenaf fiber is: cellulose 44% - 72%, hemicellulose 20%-22% and lignin 9%-19% based on values presented in Table 1.2. The schematic representation of cell wall structure of a bast fiber is shown in Figure 1.3. The micro-structure of a kenaf fiber obtained from an optical microscope and a scanning electron microscope is presented in Chapter 3. Fig. 1.3: Schematic Representation of Bundle of Cell Walls in Bast Fiber It is a well-known fact that the effective properties of a composite are governed by the
24 8 Table 1.3: Tensile Strength and Modulus of Various Bast Fibers from Literature Fiber Tensile Strength (MPa) Tensile Modulus (GPa) Reference [7] Jute [7] [7] [13] [7] Kenaf [13] [17] [7] [7] Hemp [7] [7] [13] [17] [7] Flax [7] [7] [13] properties of a fiber, matrix and fiber/matrix interface. Experiments were conducted to calculate kenaf fiber modulus, considering fixed gauge length, loading rate, and the effect of moisture content. The results were collectively reported in several review papers, which are compiled and presented in Table 1.3. A significant variation in tensile strength and modulus values were observed due to varying chemical composition in fibers and uncertainties associated with measurements of fiber dimensions. Measuring a cross-sectional area of a fiber provides a major challenge, which is significant in calculating stress and determining the Young s modulus of a kenaf fiber. Any assumption of a circular, elliptical or other crosssectional shape will produce results with more uncertainty. Obtaining specimen dimensions (gage length) of the fiber to be tested is vital in calculating a reliable Young s modulus. Studies conducted on the sisal fibers [18] showed that there is no effect of gage length on the fiber properties, whereas studies conducted on polymeric fibers [19] showed that gage length plays a major role, with defects increasing with an increase in length. There has been no significant effort made to obtain reliable value of kenaf fiber modulus by considering the rate of loading, standard gage length and appropriate techniques for cross-sectional area
25 9 measurement. Kenaf fibers were mostly reinforced in a PLA/PP polymeric matrix and tensile (Table 1.4), flexural and impact properties were obtained. Tensile modulus of these kinds of composites were already discussed in section 1.2. Not many studies have been conducted on using thermoset polymers, though they provide more wettability, lower cost and are more effective for manufacturing of complex shapes. To attain composites with increased strength, effects of kenaf fiber surface treatments were investigated. 3% maleated anhydride poly-propylene (MAPP) improved the strength by 30% [19] and 3% alkali improved the strength by 20% [20]. Table 1.4: Tensile Modulus of Kenaf Fiber Composites Material Kenaf/PLA Kenaf/PP Tensile Modulus (GPa) 6.3 [14] 20 [8] 8.3 [9] 4.84 [12] 1.2 [16] Most of these results were based on an indirect measurement technique (i.e., composites were fabricated from chemically treated fibers and the strength of the composite was measured). This method does not guarantee the optimum volume fraction of fibers, as the fiber aspect ratio is not known. A single fiber pull out test will result in evaluating fiber/- matrix interfacial strength and fiber aspect ratio, which governs the composite properties. Detailed interfacial studies [21] were conducted on flax and hemp fibers that showed that 9 mm and 13 mm are the critical lengths for complete stress transfer. Little attention has been given to numerical modeling of the composites reinforced with natural fibers. Few models were developed in the past for modeling the behavior of wood and fibers using laminate theory. These are discussed in Chapter 4 in detail. From the literature, it can be concluded that there is a need for fundamental investigations on obtaining appropriate tensile modulus of a kenaf fiber, elastic constants of kenaf fiber reinforced epoxy composite and numerical modeling a natural fiber composite. Dissertation
26 objectives were set based on the conclusions from existing literature and are presented in the next chapter Structure of Dissertation This dissertation is divided into five chapters followed by references at the end. The chapters are as follows: 1. Introduction 2. Research Objectives 3. Experimentation 4. Numerical Modeling 5. Summary, Conclusion, and Future Work The first chapter discussion involves the background of natural fiber composite, a literature review and some conclusions drawn from the past research, based on which the dissertation work was established. Chapter 2 lists the research objectives followed by a section explaining the approach used to accomplish the objectives. Chapter 3 explains the experimental work carried out to determine tensile modulus of kenaf fibers, fabrication technique of kenaf fiber reinforced composite, and concludes with an evaluation of Young s modulus and Poisson s ratio through tensile tests. Chapter 4 provides the 3D finite element micromechanical model of natural fiber composite to predict the homogenized or effective properties of natural fiber composite. Chapter 5 summarizes the research study, findings and conclusions from this work, and proposes further future work.
27 11 Chapter 2 Research Objectives 2.1 Objectives To determine the Young s modulus of a kenaf fiber through tensile test by considering the appropriate fiber cross-sectional area after failure. To determine Young s modulus and Poisson s ratio of a kenaf short fiber reinforced composite. To develop a RVE based model of a randomly oriented kenaf short fiber composite that predicts the approximate effective properties of a composite as a function of fiber volume fraction and its equivalent properties. 2.2 Research Approach Based on the research objectives established in the previous section, the following tasks have been identified and proposed. The tasks can be divided into two main categories: experimentation and numerical modeling. Experimentation To explore the micro-structure of kenaf fiber bundles through optical microscopy and scanning electron microscope examination. This task will help in understanding the structural morphology of the fiber. To find out a novel technique for evaluating the cross-section of kenaf fiber during a tensile test. This plays a major role in evaluating the tensile modulus of kenaf fiber. To investigate the effect of gage length on Young s modulus of kenaf fiber subjected to quasi-static loading. The purpose of this task is to examine the strength-limiting
28 12 defect over a certain length of fiber. With the increase in gage length, there is a possibility of included defect that limits the tensile strength of the fiber. To fabricate the kenaf short fiber epoxy composite by vacuum bagging technique and hand-lay-up technique. This task involves two processing techniques in preparing the tensile test specimens. To perform a tensile test on kenaf fiber reinforced composites and evaluate the Young s modulus and Poisson s ratio. Numerical Modeling To predict the elastic constants of cell wall layers in bast fiber through unit cell modeling of the structure at the microscale. The elastic constants as a function of varying volume fractions of basic constituents in each layer of cell wall will be studied by developing a parametric 3D finite element model. To predict the effective properties of a unidirectional natural fiber composite through unit cell modeling of the structure at the meso-scale. This homogenization model incorporates the elastic constants obtained from the previous step as the cell wall layer properties. Also, the effective properties as a function of micro fibril angle in the S2 layer of cell wall will be investigated. To generate the RVE geometry of randomly oriented short fibers by applying the Von-Mises Fisher probability distribution function. As a final step, applying the orientational averaging technique (Von-Mises Fischer PDF) on the unidirectional composite properties to evaluate the quasi-isotropic properties of a randomly oriented short fiber composite.
29 13 Chapter 3 Experimentation 3.1 Micro-Structure of Kenaf Fiber The micro-structure of a natural fiber consists of a cell wall bundle, as stated in Chapter 1. The shape of a cell wall is polygonal and governs the cross-sectional geometry of a fiber. This section presents the micro-structure of kenaf fibers examined under an optical microscope and scanning electron microscope (SEM). To view the micro-structure under an optical microscope, a polished mounting specimen was prepared with kenaf fibers encased in an epoxy matrix. The cross-section of kenaf fibers obtained at 50X magnification are shown in Figure 3.1. Figure 3.1(a)-3.1(d) reveals the inconsistency in cross-sectional shape and the presence of voids called lumen in the cell wall. The cell walls are seen to be circular or elliptical in the optical microscopic images. A scanning electron microscope (SEM) image of a single kenaf fiber, as shown in Figure 3.2, depicts the delamination of cell walls and kink bands. A single cell wall image shown in Figure 3.2(b) is hollow and rectangular in shape, with dimensions 13 µm X 7 µm X 2 µm. The optical microscopic images obtained along the axial direction of kenaf fibers (as shown in Figure 3.3) displays the defects present in the fiber. The possible defects along the fiber axial direction include varying diameter, fiber damage and delaminated cell walls. These defects combined with fiber anisotropy at micro scale level play an important role in the fiber properties. 3.2 Influence of Gage Length on Kenaf Fiber s Young s Modulus The tensile modulus of artificial fibers (glass, carbon, Kevlar) and natural fibers depends on the test speed and their gage length [23]. When compared with artificial fibers, kenaf fibers display more uncertainty towards the consistent properties. The tensile testing
")


30 14 (a) (b) (c) (d) Fig. 3.1: Optical Microscopic Image of Kenaf Fibers at 50X Magnification (a) Bundle of Cell Walls (b) Cell Wall Fig. 3.2: Scanning Electron Microscopic Image of Kenaf Fibers of kenaf fiber with varied gage length decides the critical length of the kenaf fiber. In other words, the influence of defects is less pronounced towards the tensile modulus at the critical length. This section describes the experimental methodology used to determine the tensile modulus of kenaf fiber and evaluate the associated uncertainties Materials and Procedure The carded kenaf fibers, averaging 70mm in length, were obtained from Bast Fiber LLC. The gage lengths of 10, 15, 20 and, 25.4 mm were chosen to study the influence of gage length on fiber properties. At least ten specimens were tested for each gage length as
 Fiber Damage Fig. 3.")

. The fibers were fixed on the paperboard as per ASTM D3822 standards and shown in Figure 3.")

31 15 (a) Fiber Delamination (b) Reduction in Cross-Sectional Area (c) Diameter Variation Along Length (d) Fiber Damage Fig. 3.3: Optical Microscopic Image of Kenaf Fibers Along the Length per ASTM D3822 standards, Standard Test Method for Tensile Properties of Single Textile Fibers. A paperboard of width (25.4mm) suitable for tensile testing was prepared with varying gage lengths as shown in Figure 3.4(a). The fibers were fixed on the paperboard as per ASTM D3822 standards and shown in Figure 3.4(b). A tensile test was performed on the Instron 5848 micro tensile tester machine maintaining an extension rate of 1 mm/min [24]. Before testing each individual fiber, auto calibration was done and load-extension curve was recorded. The detailed procedure is explained below:
32 16 Procedure 1. A single kenaf fiber (technical fiber) of length 60-70mm was randomly selected from the sample (up to 15 fibers). 2. As the fibers are naturally curved, they were straightened with proper care while being fixed on the paperboard. The fiber fixation on paperboard is shown in Figure 3.4(b). 3. Using forceps, the prepared paper frame in step 2 was carefully mounted on the tensile testing machine and the grips were tightened, followed by cutting the paper frame as shown in Figure 3.4(c). 4. Bluehill software available on the Instron machine was launched and auto calibration was done. Tensile testing speed was set to 1 mm/min to carry out a quasi-static test and the load-extension curve of fibers was recorded. 5. Specimens that failed close to grip or slipped during the test were discarded and the data of at least 10 specimens were recorded. 6. The tested fibers were carefully stapled to the paper, which was later used for evaluating the cross-sectional area of fibers at the break point Cross-Sectional Area Measurement The cross-sectional image of kenaf fiber was acquired using an optical microscope, based on the assumption that cross-section remains the same after failure. The mounted specimen, for observation under an optical microscope, was prepared by following the procedure described below: Procedure 1. Two rectangular hollow boxes (top mold and bottom mold), as shown in Figure 3.5, were prepared using MPPA blocks.
 was fixed on the faces of the bottom block to adhere to the fibers. 3.")

33 17 (a) Paperboard (b) Fiber Fixation (c) Frame Cut Before Applying Load Fig. 3.4: Fixation of Kenaf Fiber Specimen for Tensile Test on Paperboard 2. Double sided tape (blue) was fixed on the faces of the bottom block to adhere to the fibers. 3. Fibers were carefully attached to the tape, so that the break point of the fiber was close to the edge of the block. 4. The upper mold was placed on the bottom block to create a full box and sealed on all sides using duct tape. 5. The mixed epoxy resin was poured into the mold and left for curing. 6. The resulting mounted sample from Step 5 was grinded and polished to prepare the specimen for observation under an optical microscope. Four such mounted specimens were prepared, each corresponding to a particular gage length, and images were acquired at 50X magnification. The acquired images were then analyzed using an ImageJ software to evaluate the cross-sectional area. The process of measurement requires an image of the calibrated scale (stage micrometer), acquired at the

 and the number of pixels occupied by the image.")
34 18 Fig. 3.5: Specimen Preparation for Measuring Area of Fiber same magnification as that of the fiber. In this study, a Nikon stage micrometer with 0-1 mm range was used as a calibration scale, shown in Figure 3.6. The optical microscopic images and the evaluated images from ImageJ software are presented in Appendix Table A.1-A.4 Fig. 3.6: Calibration Scale at 50X Magnification Uncertainty in Area Calculation The linear dimension associated with the image was evaluated as a product of conversion factor (k) and the number of pixels occupied by the image. Mathematically, it is expressed as [25,26], s = kn (3.1) where k is the conversion factor and N is the number of pixels Following Taylor Series Method (TSM) approach [27], the uncertainty associated with the
35 19 image based measurement is expressed as: ( us s ) 2 ( uk ) 2 ( un = + k N ) 2 (3.2) where u s, u k and, u N are the uncertainties associated with the linear dimension, conversion factor and the number of pixels respectively. The uncertainty associated with conversion factor k is given by Equation 3.3 [26] ( uk ) 2 ( um = k m ) 2 ( unl ) 2 + (3.3) Nl where m is the dimension on calibration scale and Nl is the number of pixels obtained for the calibrated length. The uncertainty quantification of each term in Equation 3.3 was done by assuming probability distributions as presented in [26] u Nl = (3.4) u m = 0.5 Least dimension on calibrated scale 3 (3.5) u N = (3.6) The uncertainty of cross-sectional area is then quantified as ( ua A ) 2 = ( un N ) 2 ( uk ) (3.7) k Uncertainty in Young s Modulus The tensile (initial) modulus of kenaf fiber was evaluated using the expression given in ASTM D638 Standard. The stress-strain curve of kenaf fibers obtained for various gage lengths are shown in Figure 3.7 and 3.7. Compliance correction was neglected during calculations, as the cross-sectional dimensions vary from fiber to fiber. Following the step by step procedure explained in [28], the uncertainty associated with the tensile modulus
36 20 was quantified. The slope and standard deviation associated with the load-deformation curve of a fiber was calculated using Equations 3.8 and 3.10, m = n n x i y i n i=1 n x i y i i=1 i=1 ( n n ) 2 (3.8) x 2 i x i i=1 i=1 b = S m = n y i m n i=1 x i i=1 n (1 r 2 ) Sy 2 (n 2) Sx 2 (3.9) (3.10) where S xy = 1 n 1 n xy i i=1 n n y n (3.11) x i i=1 i=1 ( n S x = 1 n x n 1 n i=1 x i=1 ) 2 ( n ) 2 S y = 1 n y i yi 2 n 1 i=1 n i=1 (3.12) (3.13) r = S xy S x S y (3.14) The Young s modulus of a fiber in terms of stiffness is then expressed as Equation 3.15 E = m L A (3.15)
37 and the uncertainty according to TSM approach is given by Equation The Young s modulus with associated uncertainty is shown in Figure ( ue E ) 2 ( um ) 2 ( ul ) 2 ( ua ) 2 = + + (3.16) m L A (a) Gage Length of 25.4 mm (b) Gage Length of 20 mm Fig. 3.7: Kenaf Fiber Stress-Strain Curve
38 22 (c) Gage Length of 15 mm (d) Gage Length of 10 mm Fig. 3.7: Kenaf Fiber Stress-Strain Curve (Contd)
39 23 Table 3.1: 25.4 mm Specimen Stiffness (N/mm) Young s Modulus (GPa) u E Young s Modulus ± GPa Table 3.2: 20 mm Specimen Stiffness (N/mm) Young s Modulus (GPa) u E Young s Modulus ± GPa
40 24 Table 3.3: 15 mm Specimen Stiffness (N/mm) Young s Modulus (GPa) u E Young s Modulus ± 6 GPa Table 3.4: 10 mm Specimen Stiffness (N/mm) Young s Modulus (GPa) u E Young s Modulus ± GPa
41 25 Fig. 3.8: Young s Modulus of Kenaf Fiber with Varying Gage Length Remarks on Young s Modulus 1. The stress-strain curve of kenaf fiber exhibited linear behavior and brittle failure. 2. Based on the weakest links theory, the tensile strength of each fiber is influenced by the defects present along the length of the fiber and voids present in the cross sectional area. More detailed statistical analysis is presented in the next section. 3. The micro fibril orientation at the microscopic scale also plays a major role in the tensile properties of kenaf fiber. 4. The tensile modulus of kenaf fiber as a function of gage length was observed from the experiment. Though the wide variability in Young s modulus was seen in the data presented in Table , an overall observation suggests that the Young s modulus decreased with a decrease in gage length. The mean values of Young s modulus
42 calculated are , , and GPa for gage lengths of 10, 15, 20, and 25.4 mm respectively Weibull Analysis for Tensile Strength of Kenaf Fiber Kenaf fiber exhibited the brittle failure mode under tensile loading, and it was observed that the tensile strength varied among fibers. Such brittle behavior of the fiber is governed by the number of flaws present in the volume of material [29]. Strength characterization of brittle materials is mathematically expressed by a probability distribution function known as Weibull Distribution. This mathematical expression used to explain the probability of failure of a chain with n weakest links, is given as [30] [ (z ) ] β zo φ(z) = 1 exp z s (3.17) where z s and β are scale and shape parameters respectively. Weibull distribution (CDF) Fig. 3.9: Weibull Probability Density Function with Varying Shape and Scale Parameters [31] applied for strength characterization of brittle materials, based on the assumption that
43 27 the strength of a material is directly proportional to volume of flaws V, yields [ ( ) σ m ] P (σ) = 1 exp V σ o (3.18) where P (σ) is the probability of fiber failure below specified stress σ, V is the volume of flaws, m is the Weibull modulus and σ o is the characteristic strength. The higher value of the Weibull modulus m signifies less variation in the tensile strength of a material. When the cross-sectional area is constant, Equation 3.18 can be modified and expressed as Equation The average strength of the material is then evaluated as the expectation of distribution as shown in Equation [ ( ) σ m ] P (σ) = 1 exp L σ o (3.19) ( σ = σ o Γ ) L 1 m (3.20) m Application of the equation 3.19 was observed to be inadequate in characterizing the strength of Nicalon ceramic fibers with varying diameters [32]. Therefore, a three parameter model was proposed by Zhu et al. [31, 32], as shown in Equation 3.21, which takes diameter of fiber into account. The three parameters m, h, σ o were determined from experimental data. ( ) m ] P (σ) = 1 exp [ Ld h σσo (3.21) ( σ = σ o Γ ) L 1 h m d m (3.22) m In recent years, significant efforts have been made by researchers to develop the statistical model for strength characterization of natural fiber [33-37]. A Modified Weibull model was proposed by Xia et al. [38], as given in Equation 3.23, where γ accounts for diameter variation within the fiber. This model predicted the average strength of fiber more accurately than the two and three parameter model. In his study, Anderson [37] applied the Weibull of Weibull (WoW) model to characterize the strength of flax fibers. Weibull
44 of Weibull (WoW) model was developed by Curtin [39], which accounted for incorporating the characteristic strength itself as a Weibull distribution. 28 ( ) m ] P (σ) = 1 exp [ L γ σσo (3.23) σ 2 = σ 1 (L 2 /L 1 ) γ m (3.24) In this section, the procedure for evaluating the parameters associated with each Weibull model is explained. The computed values are presented in Table The cumulative distribution function, corresponding to each model, was plotted against the experimental data to observe the parameter fit. Steps for Two Parameter Model (a) 1. The tensile strength of all the fibers were arranged in ascending order. The P (σ) value corresponding to each tensile strength was estimated as specimens. i N+1, where i=1, 2, 3,..., N 2. The plot of ln( ln(1 P (σ)) ln(v ) vs ln(σ) was obtained for the tensile strength data, and Weibull modulus m, characteristic strength σ o was estimated for the slope and intercept of the curve respectively as shown in Figure (b) ( ) m ] P (σ) = 1 exp [ d h σσo (3.25) 1. Assumption of constant gage length results in Equation 3.25, which implies probability of failure is function of diameter. 2. The value of h m was obtained by plotting ln(σ) vs ln(d) and computing the slope. 3. A trial h value was assumed, and a ln( ln(1 P (σ))) h ln(d) vs ln(σ)plot resulted in a m value, which is the slope of a line. An update h value is evaluated as m times the value obtained in Step 2. This process is continued till the h value converges.
45 29 4. The parameters h, m, σ o were obtained for each gage length by following Steps 2 and 3 and the corresponding plots of probability distribution are shown in Figure Cumulative distribution plots from the evaluated parameters are shown in Appendix Figure B.1 Table 3.5: Two Parameter Model Parameters 10 mm 15 mm 20 mm 25.4 mm h/m h m σ o Fig. 3.10: Linear Fit for Two Parameter Weibull Model
46 30 (a) GL : 25.4 mm (b) GL : 20 mm Fig. 3.11: Linear Fit for Two Parameter Weibull Model with Diameter Dependence
47 31 (c) GL : 15 mm (d) GL : 10 mm Fig. 3.11: Linear Fit for Two Parameter Weibull Model with Diameter Dependence (Contd)
48 32 Steps for Three Parameter Model Based on the average strength, σ = CL α D β, taking a logarithm on both sides ln σ α ln L = ln C β ln D (3.26) ln σ + β ln D = ln C + α ln L (3.27) 1. An assumed value of α is substituted in Equation 3.26 and β is obtained from the plot of ln σ α ln L vs ln D. 2. The obtained value of β is substituted in Equation 3.27 to obtain new α. This iteration is carried out until α and β converge. The cumulative distribution plot for all the data put together is shown in Figure The cumulative distribution plot for consistent data is shown in Appendix Figure B.2 Table 3.6: Three Parameter Weibull Distribution Constants α β h m σ o Full Data Consistent Data Fig. 3.12: Cumulative Distribution Function of Three Parameter Model for Full Data
49 33 Steps for Weibull of Weibull Model 1. The plots of ln( ln(1 P (σ)) ln(v ) vs ln(σ) were obtained for each gage length and Weibull modulus m, characteristic strengths σ o were estimated as the slope and intercept of the line respectively. 2. The plots of ln (-ln (1-P)) vs ln (σ o ) were obtained for each gage length and the parameter ξ and χ were estimated as the slope and intercept of the curve respectively. 3. The parameters γ, α and Σ were evaluated for a batch of fibers using Equations given by Curtin. Σ = α = ρ = ξ ξ 2 + m 2 (3.28) ξm ξ 2 + m 2 (3.29) [ 1 ( m 2 + ξ 2) 0.75 ] χ (3.30) Table 3.7: Weibull of Weibull Model GL ξ σ o α ρ Σ
50 34 (a) GL : 25.4 mm (b) GL : 20 mm Fig. 3.13: Cumulative Distribution Function of Three Parameter Model for Consistent Data
51 35 (c) GL : 15 mm (d) GL : 10 mm Fig. 3.13: Cumulative Distribution Function of Three Parameter Model for Consistent Data (Contd)

52 36 Fig. 3.14: Average Strength Comparison Results and Discussion 1. The fundamental assumption of the Weibull model, that the flaws are directly proportional to the length, was observed to be inverse in this case. The tensile strength was observed to decrease with increasing volume. 2. The Weibull model with diameter dependence corresponds well with individual fiber lengths as observed in Figure B.1 3. Parameters determined for the three parameter Weibull model, given by Equation 3.26 for full tensile strength data of fiber batch, fits well with 10, 15, 20 mm gage lengths, as shown in Figure Tensile strength of fibers with consistent Young s modulus was selected and a three parameter model was fit as shown in Figure B.2. The difference in the fit is due to the varying diameter from fiber to fiber.

53 37 5. Parameters for Weibull of Weibull model (WoW), was observed to fit with the tensile strength data of 25.4 and 20mm gage length, whereas for 15 and 10 mm there was a wide range of discrepancy. This suggests that there is less scatter in data for 10 and 15 mm fibers compared to that of 25.4 and 20mm. 6. Average tensile strength predicted from WoW models are very similar to the experimental data as observed in Figure Tensile Modulus of Kenaf Fiber Composite In this section, the preparation of a tensile specimen and evaluation of tensile modulus is discussed. The tensile modulus and Poisson s ratio of epoxy matrix was evaluated through tensile tests and a similar procedure was carried out on a kenaf composite specimen Specimen Preparation Fig. 3.15: Mold for Casting Tensile Specimens


54 38 Epoxy The epoxy resin PT2050 and hardener B1 were obtained from PTMW industries. Their density is 0.9 g/cc. The resin and hardener were mixed in 100:27 proportion according to the manufacturer s specification. A mold, as shown in Figure 3.15, was designed for casting 10 tensile specimens at a time and, the dimensions of the specimen were selected from ASTMD638 type I. Mixed epoxy was pour into mold and left for curing in oven at 80 o C for 12 hrs. Meniscus formed on top of the epoxy matrix sample was grinded using 320, 600, 1200 grit sand paper, until the specimen was flat. The epoxy samples before and after grinding is shown in Figure (a) Before Grinding (b) After Grinding Fig. 3.16: Epoxy Samples Kenaf Composite The kenaf fibers were chopped to a length of mm and soaked in a 3% Na OH solution for 12 hrs to remove any impurities present on the surface of the fiber. The Na OH solution was then drained and the fibers were oven dried at 80 o C for 8 hrs. The dried kenaf fibers were shredded using carding brushes and mixed with an epoxy matrix such that a 22% fiber volume fraction was maintained. The mixture was then placed in mold as shown in Fig Pressure was applied to the composite mix by tightening the clamps and left for curing at 80 o C for 12 hrs. An attempt was made to cast the composite through vacuum bagging as shown in Fig This process proved problematic, as there was no way of ensuring a flat top surface in the end product.
")
 Kenaf")


55 39 Fig. 3.17: Casting Kenaf Fiber Composite Sample (a) Hand-Lay-up (b) Vacuum Bagging Setup (c) Removal of Resin during Curing (d) Kenaf Composite Plate After Curing Fig. 3.18: Processing of Kenaf Fiber Composite Plate Using Vacuum Bagging Technique Experimental Setup The experimental setup for tensile tests included load cell, strain gage and Vernier calipers as measuring devices to measure force, strain and specimen dimensions respectively.


 attached to the testing machine is an S-shaped bending load cell constructed on the principle of a Wheatstone full bridge.")
56 40 Tests were performed on the Tinius Olsen tensile tester (Figure3.19(a)) available in the material science lab at USU. In general, when tensile tests are performed on this machine force and extension readings are obtained through the Navigation software provided by the manufacturer. In this study, a data acquisition system was designed to acquire force and strain readings (axial and transverse) through a NI 9237 module, as shown in Figure 3.19(c). The NI 9237 module reads the Wheatstone bridge output in terms of voltage and converts to the desired unit such as force and strain. (a) Tinius Olsen Testing Machine Frame (b) Load Cell on Machine Frame (c) DAQ setup Fig. 3.19: Tensile Test Setup Load Cell and Calibration The load cell, shown in Figure 3.19(b) attached to the testing machine is an S-shaped bending load cell constructed on the principle of a Wheatstone full bridge. The output terminal of the load cell is a 15 pin D-sub connector, with only four pins associated with the bridge terminals. The connection details are shown in Figure A calibration curve

) using LabVIEW generated code Figure 3.21(a)-3.21(b).")
57 41 was generated using a bridge (mv/v) module of NI 9237 as explained below. The load cell was built based on the Wheatstone bridge principle. The output is read in millivolts. The change in the voltage of the bridge is proportional to the load applied. A calibration curve was generated for the load cell using the output (millivolts) of bridge for corresponding calibrated loads applied as shown in Figure 3.21(c). This procedure involved obtaining voltage readings for both loading and unloading of calibrated loads (Figure 3.21(d)) using LabVIEW generated code Figure 3.21(a)-3.21(b). A least squares linear regression method was applied to the calibration data and the resulting voltage-force conversion equation was obtained as shown in Figure This equation was needed as input for NIDAQ9237 to convert the bridge output (millivolts) to Newton while performing tensile tests. Fig. 3.20: Load Cell Wiring Diagram
")
 Calibrated")


58 42 (a) Load Cell Block Diagram (b) Bridge Module Dialog Box (c) Calibrated Loads (d) Loading and Unloading Diagram during Calibration Fig. 3.21: Load Cell Calibration
59 43 Fig. 3.22: Calibration Curve Tensile Testing The epoxy samples and kenaf composite samples were prepared as explained in the previous section and strain gages were fixed on the sample as shown in Figure The LabVIEW code is presented in Appendix Figure B.3. The sample was aligned in the loading direction and the grips were fixed tightly enough to prevent slipping. The testing speed was set to 8 mm/min as per ASTM standards and the tensile test was performed until the specimen failed. The specimens that failed during the test are shown in Figure 3.23 and Figure The Young s modulus and Poisson s ratio was calculated using the procedure explained in [28] and presented in Table 3.8. A similar procedure was followed for determining kenaf fiber composite properties and the properties of the material were presented in Table 3.10.


60 44 Fig. 3.23: Epoxy Tensile Test Fig. 3.24: Kenaf Fiber Composite Tensile Test
61 45 Table 3.8: Epoxy Matrix Properties Specimen No. Youngs Modulus, E (GPa) u E Poisons Ratio, ν u ν Table 3.9: Uncertainties Associated with Kenaf Composite Geometry Specimen No. Width (W ) Thickness (T ) u W u T Area(mm 2 ) u A
62 46 Table 3.10: Kenaf Fiber Composite Properties Specimen No. Young s Modulus, E (GPa) u E Poisons Ratio, ν u ν Young s Modulus 6.48 ± GPa Results and Discussion Fig. 3.25: Stress-Strain Diagram Kenaf Fiber Composite
63 47 Fig. 3.25: Stress-Strain Diagram Kenaf Fiber Composite (Contd) 1. Kenaf fiber composite exhibited linear brittle failure with a tensile strength in the range of MPa. These values are comparable to that of the tensile strength of other natural fiber composites published in [40, 41]. 2. The Poisson s ratio varied from specimen to specimen and in the range of 0.28 to A possible reason might be the fiber orientation and inconsistent micro-structure at the point where the strains were measured. 3. The Young s modulus of the composite was observed to be 6.48 pm GPa for 22% volume fraction of kenaf fibers and comparable to that of glass fiber composites, as published in [42]. 4. The lower tensile strength of the composite was attributed to the amount of voids present in the specimen due to insufficient pressure applied while casting specimen.
64 48 Chapter 4 Numerical Modeling 4.1 Introduction This chapter presents the numerical model of a kenaf short fiber reinforced composite in order to predict the effective properties. Finite element method was applied as a computational tool to accomplish this objective. To predict the effective properties of a unidirectional kenaf fiber composite, a two-step numerical homogenization was carried out on a unit cell at the micro- and meso-scales. The following sections of this chapter explain the finite element formulation for the homogenization of a unit cell, Von-Mises Fisher probability distribution and the orientational averaging technique to determine the effective properties of the short fiber composite. The unit cell is defined as the smallest repetitive part of the structure, as shown in Figure 4.1. In the field of composites, it is a very common practice to assume that the fibers are periodically arranged as a reinforcement in a matrix at the micro-scale. This leads to two types of basic unit cell models, square and hexagonal, which have been studied by various researchers [43-46] in the past. The volume fraction of constituents in a unit cell is same as that of a composite. The motivation behind selecting the unit cell was to reduce the computational effort involved in analyzing the whole micro-structure. The appropriate boundary conditions [46] were applied to the unit cell and a stress-strain field was predicted, leading to evaluation of macroscopic (homogenized) properties. The influence of homogeneous and periodic boundary conditions on unit cell was described in [47, 48], which proved that the former is an over-constrained boundary condition. Macroscopic stress (Σ) is defined as the volumetric average of a microscopic stress (σ ij ) field in a body subjected to a uniform macroscopic strain (E). The macroscopic properties of a material can be derived from the analysis of microscopic structure once the
![properties of constituents at the microscopic scale are known. The average stress and strain is mathematically expressed as [49] 49 Σ = 1 V E = 1 V V V σ ij dv (4.1) ɛ ij dv (4.2) Fig. 4.1: Schematic Representation of Unit Cell 4.](/docs-images/80/81992307/images/65-0.jpg "2 Finite Element Formulation The principle of virtual work is applied to derive the general finite element equations, which is defined as [49] Among all admissible configurations of a conservative")
65 properties of constituents at the microscopic scale are known. The average stress and strain is mathematically expressed as [49] 49 Σ = 1 V E = 1 V V V σ ij dv (4.1) ɛ ij dv (4.2) Fig. 4.1: Schematic Representation of Unit Cell 4.2 Finite Element Formulation The principle of virtual work is applied to derive the general finite element equations, which is defined as [49] Among all admissible configurations of a conservative system, those that satisfy the equations of equilibrium make the potential energy stationary with respect to small admissible variations of displacement.
66 50 The minimization of potential energy δπ = δu δw results in δu = δw (4.3) where δu is internal strain energy and δw is external work done given by Equation 4.4 and 4.5 respectively. δu = V δε T σ dv (4.4) δw = S δψs T T ds + V δψ T X dv + δd T P (4.5) where δε, δd, δψ s, δψ vector of virtual strains, virtual nodal displacements, virtual displacement function δu, δv, δw and virtual displacement functions acting over surface P, X, T are vectors of applied nodal loads, body forces and surface tractions. ψ = Nd and ψ s = N s d, ε = Bd and σ = Dε. Substitution of Equation 4.4 and 4.5 in Equation 4.3 results in δd T B T DBdV d = δd T N S T T ds + δd T N T XdV + δd T P (4.6) V S V Neglecting body forces, [K]d = [P ] + [f s ] (4.7) where stiffness matrix [K] = B T DBdV and [P] is load vector V Equivalent nodal loads due to surface forces [f s ] = NS T T ds Lagrange Multipliers to Enforce Constraints The minimization of a potential energy subjected to constraint was solved using the Lagrange multiplier method. Mathematically, the problem was addressed as shown in Equation 4.8, where constraint equation G is added to the potential energy. S L = Π + λg (4.8)
67 where L is the Lagrangian function, Π is potential, λ is Lagrange multiplier and, G = 51 [C]d [Q] is constraint equation. Minimization of Lagrangian with respect to d, i.e. L d = 0 and λ i.e. L λ shown in Equation 4.9. = 0 results in the system of equations put in broad form [49], as K C 0 CT d λ = P Q (4.9) Hexahedral Element A Hexahedral element, also known as 8-noded brick element, is one of the 3D discretized elements frequently used in the finite element analysis of a structure. Each node in this element is associated with three degrees of freedom u, v, w in x, y, z directions respectively as shown in Figure 4.2. Fig. 4.2: Hexahedral Element The associated shape functions for the element, with r i,s i,t i as the values of natural coordinates: N i = 1 8 (1 + rr i)(1 + ss i )(1 + tt i ) (4.10)
68 52 The Jacobian and B matrix were computed as: x,r y,r z,r x,s y,s z,s = N i,r x i N i,r y i N i,r z i N i,s x i N i,s y i N i,s z i (4.11) x,t y,t z,t N i,t x i N i,t y i N i,t z i ε x ε y ε z ε yz ε zx ε xy = [B] {d} = [Γ] [Γ] [Γ] Ni,r u i Ni,s u i Ni,t u i Ni,r v i Ni,s v i Ni,t v i Ni,r w i Ni,s w i Ni,t w i (4.12) where [Γ] is inverse Jacobian matrix. The numerical computation of the stiffness matrix for a single element is written as [K] = B T DB J drdsdt (4.13) Average stress in numerical form is written as Σ = No of Elem k=1 σ k ij V (4.14) Average strain in numerical form is written as E = No of Elem k=1 ɛ k ij V (4.15) Algorithm:

69 1. Input: Nodal Coordinates, Element Connectivity, Material Properties, and Boundary Conditions from text file Compute stiffness matrix of each element. 3. Assembling stiffness matrix of whole structure. 4. Partitioning of stiffness matrix into known and unknown degrees of freedom. 5. Solving system of equations using UMFPACK algorithm in SCILAB. 6. Recovery of displacements, strains and stress. 7. Computing average stress and strain of the unit cell. 4.3 Boundary Conditions In order to obtain the macroscopic properties of the cell wall layer and unidirectional fiber composite, the unit cell was subjected to four load cases: axial, transverse, longitudinal shear and transverse shear, as the material is transversely isotropic. For axial and transverse loading, a quarter model was selected due to its symmetry, as shown in Figure 4.3(a). Transverse shear was simulated by applying periodic boundary conditions to the 2D model as shown in Figure 4.3(b). The boundary conditions applied to the unit cell as explained in [46] are described in Table 4.1. (a) Quadrant Model (b) 2D Transverse Shear Fig. 4.3: Schematic Representation of Boundary Conditions on the Model
70 54 Table 4.1: Boundary Conditions Load Case U x U y U z Axial Transverse U x (0, y, z) = 0 U y (x, 0, z) = 0 U z (x, y, 0) = 0 U x (a, y, z) = U y (x, b, z) = δ U z (x, y, c) = δ U x (0, y, z) = 0 U y (x, 0, z) = 0 U z (x, y, 0) = 0 U x (a, y, z) = δ U y (x, b, z) = U z (x, y, c) = δ U x (0, y, z) = U x (2a, y, z) U y (0, y, z) = U y (2a, y, z) U z (0, y, z) = U z (2a, y, z) Longitudinal Shear U x (x, 0, z) = 0 U y (x, 0, z) = 0 U z (x, 0, z) = 0 U x (x, 2b, z) = For longitudinal shear, the face at y=0 is fixed and the displacement Ux, Uy, Uz on the faces x=0 and x=a are kept same. To obtain shear modulus, a constant displacement is applied on the face y=a in the x-direction (shear loading). [Uy, Uz] on L = [Uy, Uz] on R; [Uy, Uz] on T = [Uy, Uz] on B are the periodic boundary conditions in the case of transverse shear as shown in Figure 4.3(b), where L, R, T and B stand for left, right, top and bottom surfaces respectively and the periodic boundary conditions are applied to all the nodes on these surfaces. To simulate transverse shear, a displacement of delta y is applied at (a, h). 4.4 Effective Properties of Cell Wall Layers in Bast Fiber At the mesoscopic scale, all the bast fibers possess a bundle of laminated tube-like structures (Figure 3.2(b)) called cell walls. Each cell wall is made of Primary, Secondary S1, S2 and S3 layers and mechanical properties of each constituent in these layers are given in Table 4.2. The thickness of each layer differs from the others with S2 layer occupying 80% of the total thickness of the cell wall [51]. The thicknesses of each layer in a cell wall, obtained from [51], are presented in Table 4.3. The purpose of this section is to evaluate the effective properties (independent elastic constants) of a secondary cell wall layer with a varying volume fraction of basic constituents (C, HC, L). The volume fraction of basic constituents in different bast fibers are given in [52]. Some volume fraction combinations chosen for the analysis are given in Table 4.4. There are
71 55 Table 4.2: Elastic Constants of Constituents [11] Material E 11 (MP a) E 22 (MP a) G 12 (MP a) ν 12 ν 23 Cellulose Hemi-Cellulose Lignin Table 4.3: Structural Dimensions Layer Thickness (µm) MFA( ) M P S1 0.3 ±50-70 S S ±60-80 n number of combinations possible and it is impractical to determine the effective properties for each combination through numerical experiments. From the structural point of view, the orientation of fibrils, volume fraction and geometry of constituents are all that is required to evaluate the effective properties. A schematic representation of cell wall layers with constituents is shown in Figure 4.4. The shape of cellulose and arrangement of constituents are of significance in the analysis. The shape of cellulose was found to be square with the work carried out by O Sullivan [53]. Regarding the arrangement of these constituents, the results presented by Salmen and Preston [54] are also of importance. Table 4.4: Volume Fraction of Constituents S.No Vcellulose Vhemicellulose Vlignin

72 56 Fig. 4.4: Basic Constituents in Cell Wall Layer Geometry and Meshing The full 3-dimensional unit cell geometry of the cell wall layer is shown in Figure 4.5. All the constituents are assumed to be square in shape. This assumption results in transversely isotropic properties of an equivalent material with five independent elastic constants. Therefore, five numerical tests were performed to obtain five independent elastic constants. The unit cell geometry was created in the Gmsh meshing software. Gmsh is a 3D mesh generator software developed by Geuzaine and Remacle[55] with the capability of meshing 2D and 3D geometries using different kinds of elements. The Gmsh code was written to create the geometry of a unit cell with a specified mesh size. Also, Gmsh facilitates the option of selecting the number of elements/division along the line during discretization. The application of periodic boundary conditions requires the nodal points to be exactly on the opposite face. Orderly numbering and transfinite algorithms are built-in functions of Gmsh software, facilitating the use of the structured meshes required to implement periodic boundary conditions. The mesh file.msh was generated from Gmsh, which comprises nodal coordinates and element connectivity. A pseudo code is shown in Table 4.5) and the mesh


73 57 file.msh for a simple geometry is presented in Appendix Table??. Fig. 4.5: 3D Unit Cell Geometry Fig. 4.6: Node Numbering of Unit Cell Geometry The 3D quadrant model created to simulate axial and transverse load case is shown in Figure 4.7. The geometry of the longitudinal shear model is similar to the one shown in Figure 4.5.
 Quadrant Cell Geometry Gmsh (b) Mesh in Gmsh Fig. 4.")

74 58 Table 4.5: Mesh Format File $MeshFormat version-number file-type data-size $EndMeshFormat $Nodes number-of-nodes node-number x-coord y-coord z-coord... $EndNodes $Elements number-of-elements elm-number elm-type number-of-tags < tag >... node-number-list... $EndElements (a) Quadrant Cell Geometry Gmsh (b) Mesh in Gmsh Fig. 4.7: Quadrant Unit Cell Model FE Analysis and Results A 3D finite element code was developed in a SCILAB environment, which requires an input file.msh generated from Gmsh, to compute the effective properties. The input files required to run finite element analysis were generated by the program created to read.msh file as shown in Appendix C.1 and boundary conditions (constraints) were generated by the code sortingsurface.sci (Appendix C.3). The full 3D FE code is presented in Appendix C.4. A finite element code was run for each load case, according to the boundary conditions specified in the previous section. Stress and displacement contour obtained for each load case are shown in Figure The computed elastic constants through the 3D finite element unit cell model are compared with those values presented in [51] and semi-empirical relations given in Equations Comparisons of elastic constants with various methods are

 Stress in y (b) Displacements U y Fig. 4.")
75 presented in Tables , corresponding to each secondary layer and Figure (a) Stress in x (b) Displacements U x Fig. 4.8: Axial Load Case (a) Stress in y (b) Displacements U y Fig. 4.9: Transverse Load Case (a) Stress in 1-2 (b) Displacements U x Fig. 4.10: Longitudinal Shear Loading
76 60 Semi-Empirical Equations: Rule of Mixtures: E 11 = V C E 11 (C) + V HC E 11 (HC) + V L E 11 (L) (4.16) Tsai-Hahn Empirical Relation: 1 E 2 = 1 V f + ηv m ( Vf + η V ) m ; η = 0.5 (4.17) E f E m 1 G 12 = 1 V f + ηv m ( Vf + η V ) ( m ; η = G ) m G f G m G f (4.18) Halpin-Tsai Empirical Relation: E f E m = 1 + ηψv f 1 ηv f ; η = γ 1 γ + Ψ ; γ = E f E m ; (4.19) The Young s modulus in the axial direction and Poisson s ratio computed by all the methods are in good agreement and match exactly with the Rule of Mixtures. Transverse modulus compared from the Tsai-Hahn relation is in good agreement with 3D FE results, whereas the multi-pass homogenization procedure gives an error of 17%. The Halpin-Tsai relation involves a parameter that is dependent on the geometry of the fiber and can be derived if the exact results are known. Here the values compared in the Table are computed using Ψ = 2 and the error was observed to be around 7%. Based on 3D results and through inverse calculations, Ψ was found to be 1.58 for the transverse modulus and 0.9 for the shear modulus in this particular problem. The Tsai-Hahn equation, in conjunction with the Rule of Mixtures, results in the elastic constants approximate to 3D results. After validating the existing semi-empirical relations with those of the 3D results for a set of combinations, these equations can be directly applied to derive effective elastic constants. Given any natural fiber, the geometric parameters that play a major role in the cell wall tube properties are: micro fibril orientation, thickness of each layer and the cross-sectional shape. In the next section, the micro fibril orientation in the S2 layer and volume fraction of the constituents were varied to obtain the effective properties of composite.
77 D FEM Rule of M ixt ures Fig. 4.11: Young s Modulus in Axial Direction D FEM Tsai-Hahn Empirical Fig. 4.12: Young s Modulus in Transverse Direction
78 D FEM Tsai-Hahn Fig. 4.13: Longitudinal Shear Modulus Fig. 4.14: Poisson s Ratio from 3D Model
79 63 Table 4.6: Comparison of Elastic Constants in S1 Layer Elastic Constant 3D FEM Leon Halpin-Tsai Tsai-Hahn E 11 (GP a) E 22 (GP a) (16.6%) G 12 (GP a) ν ν Table 4.7: Comparison of Elastic Constants in S2 Layer Elastic Constant 3D FEM Leon Halpin-Tsai Tsai-Hahn E 11 (GP a) E 22 (GP a) (18.2%) G 12 (GP a) ν ν Table 4.8: Comparison of Elastic Constants in S3 Layer Elastic Constant 3D FEM Leon Halpin-Tsai Tsai-Hahn E 11 (GP a) E 22 (GP a) (17%) G 12 (GP a) ν ν
80 64 Table 4.9: Elastic Constants with Varying Volume Fractions Volume Fraction(C/HC/L) E 11 (GP a) E 22 (GP a) G 12 (GP a) ν 12 ν 23 50/27/ /24/ (17%) /23/ /20/ /17/ Effective Properties of Unidirectional Composite The properties of the cell wall layers obtained in previous section were used in the second step of homogenization which was carried out at mesoscopic scale. The elastic constants of each layer in a cell wall for various volume fractions of basic constituents were used in performing parametric modeling of the unit cell of unidirectional kenaf fiber composite properties. It was assumed that the bond between matrix and fiber was perfect and the fibers were straight (without any flaws) in the finite element analysis of a unit cell. The fiber volume fraction was considered to be 22% in this analysis as the experiments were carried out at the same volume fraction. Geometry and Meshing The cell wall geometry was assumed to be hexagonal in shape with the dimensions adopted from [50] and shown in Table 4.3. The basic geometrical parameters required to create hexagon is shown in Figure The parameter θ in the Gmsh code is a shape factor, meaning that at θ = 30 the geometry of the cell wall is a regular hexagon and changes to an irregular hexagon at other θ values. A fiber geometry consisting of a bundle of seven cell walls and the periodic arrangement of fibers in the matrix was created in Gmsh is shown in Figure 4.16 and 4.17 respectively. The unit cell geometry meshed with hexahedral elements is shown in Figure As the properties obtained were invariant of length (Z-dir), the unit cell thickness and number of elements in thickness direction was kept about (1/10)th of cross-sectional dimension, which reduced the computation effort.
![65 [ P = [A + B sin(θ), 0] ; Q1 = Q + Fig. 4.](/docs-images/80/81992307/images/81-1.jpg "15: Basic Hexagonal Shaped Cell ] T tan(θ 1 ), T P 1 = P + [ T cos(θ), 0 ] ; R = [0, B cos(θ)] ; Q = [A, B cos(θ)] ; R1")
81 65 [ P = [A + B sin(θ), 0] ; Q1 = Q + Fig. 4.15: Basic Hexagonal Shaped Cell ] T tan(θ 1 ), T P 1 = P + [ T cos(θ), 0 ] ; R = [0, B cos(θ)] ; Q = [A, B cos(θ)] ; R1 = R + [0, T ] ; Fig. 4.16: Schematic Representation of Bundle of Cell Walls

82 66 Fig. 4.17: Periodic Arrangement of Natural Fiber in a Matrix FE Analysis and Results The secondary layers of the cell wall consist of micro fibrils with orientations varying as follows: S1:50-70, S2:0-30, S3: A finite element analysis by Qing et.al. [50], concluded that the fiber properties in the axial direction were strongly influenced by the S2 layer properties. Therefore, only S2 layer micro fibril orientation was varied from 0 to 30 with an interval of 5, whereas the S1 and S3 layer orientation was fixed as 70 and 80 respectively throughout the analysis. The effect of S1 and S3 micro fibril orientation on the transverse modulus was observed to be minimal (5%)[50]. In this section, for varying volume fractions of basic constituents (Table 4.4), the MFA in the S2 layer was varied and FE analysis was carried out to obtain the macroscopic properties of the unit cell shown in Figure As explained in [50], for layer S1 and S3, the bidirectional reinforcement was considered and the properties of these layers were calculated in a similar way. The properties are listed in Table 4.10.
 Layer E XX E Y Y E ZZ G Y Z G ZX G XY ν XY ν XZ ν Y Z M 2820 2820 2820 1084.62 1084.62 1084.62 0.3 0.3 0.3 P 3970 3970 3970 1550.")
83 67 Fig. 4.18: Unit Cell of Natural Fiber Reinforced Unidirectional Composite Table 4.10: Material Properties of Each Layer in Cell Wall Except S2 (MPa) Layer E XX E Y Y E ZZ G Y Z G ZX G XY ν XY ν XZ ν Y Z M P S S

")
 Stress in Y")

84 68 (a) Stress in Z Fig. 4.19: Axial Load Case (b) Displacements U z (a) Stress in Y Fig. 4.20: Transverse Load Case (b) Displacements U y
85 69 Augmented Lagrange Method The Lagrange multipliers method introduces more equations (equal to constraint equations) to the stiffness matrix and the diagonal terms of the matrix go to zero, implying that the matrix becomes nearly singular. Therefore, an Augmented Lagrange method was applied to obtain a new stiffness matrix, that is a combination of penalty and Lagrange multiplier methods and was solved for displacements. The potential energy functional with perturbed constraint equation is given by Π = 1 2 DT KD D T F α (penaltyfunction perturbation)2 (4.20) Let g(d) be the penalty function ([C][D]-[Q]=0) and δ is perturbation Π = 1 2 DT KD D T F α (g(d) δ)2 (4.21) After expansion of the third term and neglecting delta square term, the final equation takes the following form: Π = 1 2 DT KD D T F gt αg g T αδ (4.22) replacing αδ by λ T Π = 1 2 DT KD D T F + λ T g gt αg (4.23) The first three terms represents the Lagrange multiplier formulation and fourth term is the penalty function augmented. Minimization of potential w.r.t D results in [ K + C T αc ] D = F + C T αq C T λ P (4.24) and considering the last two terms of Equation 4.23 as equivalent to Lagrange formulation λ P = λ i + αg(d) (4.25)
 Shear Stress in ZX (b) Displacements Fig. 4.")
![21: Longitudinal Shear Transverse Shear Simulation The transverse shear properties of a composite were obtained by subjecting the unit cell to the periodic boundary conditions, as explained in [46].](/docs-images/80/81992307/images/86-2.jpg "The implementation of periodic boundary conditions involves the nodes on opposite faces (i.e. i-j and k-l) as shown in Figure 4.22. These nodes were subjected to same displacements.")
86 70 Algorithm to obtain λ 1. Input : α (penalty factor), tolerance 2. While λ λ P tolerance { Calculate D using Equation 4.24 Substitute D in Equation 4.25 to obtain updated λ value. } (a) Shear Stress in ZX (b) Displacements Fig. 4.21: Longitudinal Shear Transverse Shear Simulation The transverse shear properties of a composite were obtained by subjecting the unit cell to the periodic boundary conditions, as explained in [46]. The implementation of periodic boundary conditions involves the nodes on opposite faces (i.e. i-j and k-l) as shown in Figure These nodes were subjected to same displacements. In order to prevent rigid body motion during the finite element simulation, the following boundary conditions were imposed on the unit cell. Boundary conditions v(x, b) = v(x, b); u( a, y) = u(a, y); v( a, y) = v(a, y) = 0 v( a, b) = v(a, b) = v(a, b) = v( a, b) = 0 u(x, b) = δ; u(x, b) = δ
87 71 Fig. 4.22: Periodic Boundary Conditions for Transverse Shear The variation of elastic properties as a function of the MFA in the S2 layer are shown in Figure The axial modulus of the composite decreased with an increase in MFA of the S2 layer. The transverse modulus and transverse shear modulus were least effected. The transverse modulus decreased by 7%. For the transverse loading case, the maximum stress in y-direction was observed at the point P of the hexagon, as shown in Figure 4.20(a). For the transverse shear load, maximum shear stress was observed on the interface between matrix and cell wall layer P1 and Q1, as shown in Figure 4.23(a).
 at Volume Fraction 50/27/23 Volume fraction 50/27/23 θ Ezz Exx Eyy Gxy Gzy Gzx ν zx ν zy ν yx 0 6.4660 3.1690 3.1690 1.0613 2.7490 2.")

88 72 (a) Shear Stress in XY (b) Displacements U x Fig. 4.23: Transverse Shear Table 4.11: Elastic Constants(GPa) at Volume Fraction 50/27/23 Volume fraction 50/27/23 θ Ezz Exx Eyy Gxy Gzy Gzx ν zx ν zy ν yx
89 73 Table 4.12: Elastic Constants(GPa) at Volume Fraction 55/24/21 Volume fraction 55/24/21 θ Ezz Exx Eyy Gxy Gzy Gzx ν zx ν zy ν yx Table 4.13: Elastic Constants(GPa) at Volume Fraction 60/23/17 Volume fraction 60/23/17 θ Ezz Exx Eyy Gxy Gzy Gzx ν zx ν zy ν yx
90 74 Table 4.14: Elastic Constants(GPa) at Volume Fraction 65/20/15 Volume fraction 65/20/15 θ Ezz Exx Eyy Gxy Gzy Gzx ν zx ν zy ν yx Table 4.15: Elastic Constants(GPa) at Volume Fraction 70/17/13 Volume fraction 70/17/13 θ Ezz Exx Eyy Gxy Gzy Gzx ν zx ν zy ν yx
91 75 Fig. 4.24: Effect of MFA on Axial Modulus Fig. 4.25: Effect of MFA on Macroscopic Elastic Properties Observation Increase in MFA 1. The axial modulus reduced by 48-54%. 2. Transverse and shear modulus were least effected. 3. The longitudinal shear modulus increased by 15%. 4. The longitudinal Poisson s ratio increased by 3% and transverse Poisson s ratio decreased by 10% due to reduced stiffness in the axial direction.
92 76 Increase in Cellulose Content 1. The axial modulus increased by 22% at MFA of zero. 2. The shear modulus and Poisson s ratio were least effected, with an increase in cellulose content. 4.6 Von-Mises Fisher Probability Distribution The importance of Von-Mises distributions for directional data is similar to that of normal distribution for linear data [56]. The generalized (p-1) dimensional Von-Mises density function for a vector of observations X can be written as f µ,k,p (X) = C P (k)e kµx (4.26) where µ is the mean vector, k is the concentration parameter and Cp(k) is the normalizing factor with the values, For p=2, circle: C p (k) = 1/(2πI o (k)) 2 (4.27) For p=3, sphere: C p (k) = k/(4π sinh(k)) (4.28) For low concentration values of k < 1, the distribution is normal on a spherical plot and as the concentration value increased, all the data points were concentrated (green) in one direction, as shown in Figure 4.26.
93 77 Fig. 4.26: Von-Mises Fisher Random Variables The purpose of this probability distribution function is to define the orientational distribution of fibers in a composite. The higher the k value, the more parallel the fibers are to the longitudinal axis, as shown in Figure 4.27(d). The lower the k-value, the more randomly distributed the fibers are in all directions, as shown in Figure 4.27(a). The derivation of random variables from the Von-Mises Fisher probability distribution function is explained below: Derivation of random variables Probability density function f (θ) = k 2 sinh (k) ek cos(θ) sin (θ) ; g (φ) = 1 2π (4.29) Cumulative distribution function ξ = θ ke k 1 e 2k π e k cos(θ) sin (θ) dθ (4.30) After evaluating integral in WxMaxima and performing inverse,
![78 [ ] log (ξ (1 λ) + λ) θ = 2 sin 1 2k (4.](/docs-images/80/81992307/images/94-2.jpg "31) where λ = e 2k To generate random θ values for a particular concentration factor k, a uniformly distributed random number vector ξ is given as an input to the Equation 4.31. The PDF obtained for different concentration values is shown in Figure 4.")
94 78 [ ] log (ξ (1 λ) + λ) θ = 2 sin 1 2k (4.31) where λ = e 2k To generate random θ values for a particular concentration factor k, a uniformly distributed random number vector ξ is given as an input to the Equation The PDF obtained for different concentration values is shown in Figure A SCILAB program was written to generate the randomly oriented cylindrical fiber in a bounded cube, where the orientation is controlled by a factor k. (a) Random Fiber Distribution k=1 (b) Random Fiber Distribution k=10
")

 Von-Mises")
95 79 (c) Random Fiber Distribution k=50 (d) Random Fiber Distribution k=1000 Fig. 4.27: Random Fiber Distribution with Varying k (a) Von-Mises PDF k=1

96 80 (b) Von-Mises PDF k=10 (c) Von-Mises PDF k=1000 Fig. 4.28: Von-Mises PDF with Varying k 4.7 Equivalent Properties of Randomly Oriented Short Fiber Composite The orientational averaging technique was explained in the work done by [57] to obtain the properties of random fiber composite. Some of the other works related to orientation averaging can be seen in [58-62]. In this section, the Von-Mises probability distribution is considered for use in obtaining properties of random short fiber composite. The concentration parameter for the distribution is in a selected range of 0.5 to 80, explaining fiber orientation in a particular direction to random. The properties for various volume fractions were considered, and the orientation averaging technique was applied to each of them respectively. Orientational Averaging
97 81 The orientational averaging technique to obtain effective elastic modulus was derived by Christensen and Waals [57]. The various empirical relations for predicting the elastic modulus of a 2D and 3D randomly oriented short fiber composite was presented by [62]. The idea behind orientational averaging technique is to obtain the average of unidirectional fiber composite properties for all possible orientations. Mathematically, the orientation averaging is expressed as: σ ij ε ij = π 0 π 0 σ ij ε ij (pdf) sin (θ) dθdφ π π sin (θ) dθdφ 0 0 (4.32) Fig. 4.29: Coordinate System Assuming that the fiber is cylindrical and oriented in 3 dimensional space, as shown in Figure 4.29, with 123 as a rotated coordinate system and as a fixed coordinate system. If the composite properties is transversely isotropic with fiber oriented along 1- axis, the constitutive relation in transformed axis is given by CM = λ ij Cλ T ij
98 82 λ = a 2 b 2 c 2 2ab 2ac 2bc d 2 e 2 f 2 2de 2df 2ef g 2 h 2 i 2 2gh 2gi 2ih ad be cf ae + bd af + cd bf + ce ag bh ci ah + bg ai + cg bi + ch dg eh fi dh + eg di + fg ei + fh (4.33) a b c d e f g h i = sin (θ) cos (φ) cos (θ) cos (φ) sin (φ) sin (θ) sin (φ) cos (θ) sin (φ) cos (φ) cos (θ) sin (θ) 0 (4.34) C = C 11 C 12 C C 22 C C C C 66 0 (4.35) C 66 The relation between σ 33 and ɛ 33, σ 22 and ɛ 33 for an arbitrarily applied ɛ 33 were given by σ 33 ε 33 = C 11 cos 4 θ + (2C C 66 ) cos 2 θ sin 2 θ + C 22 sin 4 θ (4.36) σ 22 ε 33 = C 11 d 2 g 2 + C 12 (d 2 h 2 + e 2 g 2 + d 2 f 2 ) + C 22 e 2 h 2 + 4C 66 ghde + C 23 h 2 f 2 (4.37) σ 33 ε 33 = 1 15 (3C C C C 66 ) (4.38) σ 22 ε 22 = 1 15 (C C 12 + C 22 4C C 23 ) (4.39)
99 83 For a normal distribution, pdf=1 and the orientational averaging results in Equations 4.39 and 4.38 in 2 and 3 directions respectively. Assuming the behavior of a randomly oriented composite to be quasi isotropic, the equivalent relation to the Equations 4.39 and 4.38 were written as σ 33 ε 33 = (E(1 ν)) ((1 2ν)(1 + ν)) (4.40) σ 22 ε 22 = (Eν) ((1 2ν)(1 + ν)) (4.41) Equating 4.39 and 4.41, 4.38 and 4.40 and solving the equations will result in equivalent elastic properties E and ν. The Von-Mises Fisher probability density function was chosen to calculate the average macroscopic properties of a random oriented composite with varying concentration parameters, as explained in the previous section. For the purpose of analysis, concentration parameters of k=0.5, 2, 5, 8, 10, 20, 40, 60, and 80 were chosen. The transverse isotropic properties evaluated on the unit cell as explained in Section 4.5 for various volume fractions of basic constituents were substituted in the constitutive relation given in the Equation 4.35 and average value of elastic modulus and Poisson s ratio were calculated according to the procedure explained in Equations 4.38 to The evaluated elastic constants for the volume fraction of 50/27/23 is shown in Table 4.35 and the values of remaining volume fraction are presented in Appendix A.5-A.8.
100 84 Table 4.16: 50/27/23 Elastic Constants(GPa) of Random Fiber Composite at Volume Fraction E(GP a) θ K=0.5 K=2 K=5 K=8 K=10 K=20 K=40 K=60 K= ν Fig. 4.30: Equivalent Young s Modulus With Varying Concentration Factor
101 85 Fig. 4.31: Equivalent Poisson s Ratio With Varying Concentration Factor Observations 1. The finite element model for unidirectional composite properties was based on the assumption that the bond between fiber and matrix was perfect. 2. From the graph Figure , it was deduced that the concentration factor of 0.5 and 2 suggests more random fiber orientation and quasi isotropic properties. That is, properties were least affected by the MFA orientation. 3. The range of equivalent Young s modulus obtained through orientation averaging was GPa, whereas the mean Young s modulus evaluated from tensile test was 6.48GPa. 4. The increase in concentration factor k resulted in direction dependent effective properties. The Poisson s ratio remained almost same for varying cellulose content.
102 86 Chapter 5 Summary, Conclusion, and Future Work 5.1 Summary of Work Performed As a part of this dissertation, the micro-structure of kenaf fiber was explored using an optical microscope and a scanning electron microscope. Defects such as fiber damage, variation in the fiber width along axial direction, and delamination were observed (Figure 3.3). The images of the kenaf fiber obtained from the scanning electron microscope revealed one of the cell wall shapes to be a hollow rectangle Figure 3.2(b), whereas in general the cell wall shapes were an irregular polygon, as observed from the optical microscope images as shown in Figure 3.1. In order to obtain the tensile modulus of kenaf fiber, a tensile test was performed using the Instron 5848 testing machine. To study the influence of fiber gage length on the tensile modulus, four different gage lengths of 10, 15, 20 and 25.4 mm were selected and ten fibers in each lot were tested. The approximate cross-sectional area of fiber after failure was measured using an optical microscope. The procedure used to prepare the sample for microscopy examination was discussed in section ImageJ software was used to evaluate the fiber cross-sectional area of the images obtained from the optical microscope at 50X magnification. The kenaf fiber composite sample was processed by mixing chopped kenaf fibers and epoxy matrix using a vacuum bagging technique in the first attempt. Before preparing the composite, the chopped kenaf fibers were rinsed in a 3% sodium hydroxide solution to remove surface impurities and shredded using carding brushes. The vacuum bagging technique resulted in a composite plate with an uneven surface that was not suitable for tensile tests.therefore, in the second attempt composite samples (dimensions as per ASTM D638) were prepared in HDPE molds by applying pressure through clamps and cured at 80 0 C. Tensile tests were conducted on the composite samples to obtain Young s modulus and
103 87 Poisson s ratio. Fourteen samples were tested on the Tinius Olsen tensile testing machine and force and strain data were acquired through NIDAQ 9237, for which a LabVIEW code was written, as shown in Figure B.3. A 3D finite element code was written in a SCILAB environment to calculate the homogenized or effective properties of the natural fiber composite. A two-step homogenization was carried out: the first step obtained the properties of the cell wall layers at the microscopic scale and the second obtained unidirectional natural fiber composite properties. To avoid an ill-conditioned matrix that appeared due to the number of constraint equations, an augmented Lagrange technique was applied in the finite element code. To create a geometric model, Gmsh 3D mesh generator software was used, which provided an advantage of the structured mesh. In the final step of modeling, an orientational averaging technique was applied to evaluate the random fiber composite properties using the Von-Mises Fisher probability distribution function, as explained in section Summary of Findings and Conclusion Micro-structure of Kenaf Fiber 1. The optical microscopic images of kenaf fibers obtained along the fiber axial direction exhibited defects such as delamination between cell walls, varying width, damage of fiber and sudden reduction in cross-sectional area. This lead to varying tensile strengths of kenaf fiber due to the amount of defects present based on the weakest links theory. 2. The cross-sectional images obtained through the optical microscope and the scanning electron microscope revealed the irregular cell wall shape and the hollow portion of the cell wall. Therefore, an appropriate cross-sectional area was required to evaluate stress in the fiber, taking into account the voids present on the cross-section. The cross-sectional area of the kenaf fiber measured after tensile test had an equivalent circular diameter of 45 µm on average. Influence of Gage Length on Kenaf Fiber Modulus
104 1. The tensile behavior of kenaf fibers was observed to be linear and failure to be brittle The tensile modulus of kenaf fiber was seen to increase with an increase in gage length. This might be due to inconsistent micro-structure, accurate cross-sectional area for evaluating stress and effective gage length in strain calculations. It can be concluded that to evaluate the Young s modulus of a kenaf fiber, a minimum gage length of 25.4 mm or more should be adopted. 3. The Weibull method was applied to characterize the tensile strength of a kenaf fiber. Two parameter, three parameter and Weibull of Weibull models were used to fit the tensile strength data. The average tensile strength obtained from the Weibull of Weibull model was observed to be in good agreement with the experimental values. In order to obtain appropriate Weibull distribution fit, more samples should be tested. Tensile Properties of Randomly Oriented Kenaf Fiber Composite 1. The kenaf fiber composite exhibited linear behavior and brittle failure with the tensile strength in the range of MPa, as presented by other researchers in the past. The tensile strength is very low compared to that of the neat resin due to the amount of tensile strength reducing voids present in the composite. 2. The Poisson s ratio varied from specimen to specimen and was found to be in the range of A possible reason for this might be the fiber orientation and inconsistent micro-structure at the point where the strains were measured. 3. The mean Young s modulus of the kenaf fiber composite at 22% fiber volume fraction is 6.48 GPa and comparative to the glass fiber composite of 7-8 GPa. This is an evidence that the kenaf fiber composite can replace glass fiber composite in terms of elastic modulus. Numerical Modeling of Natural Fiber Composite 1. The Youngs modulus in the axial direction and Poisson s ratio computed using 3D finite element and semi-empirical relations presented in Section 4.4 were observed
105 89 to be in good agreement with the Rule of Mixtures. The transverse modulus was observed to be in good agreement with Tsai-Hahn empirical relation, whereas results from the multi-pass homogenization procedure gave an error of about 17%. Through inverse calculations, parameter χ of Halpin-Tsai empirical relation was seen to be 1.58 for the transverse modulus and 0.9 for the shear modulus. 2. The homogenized properties of an unidirectional kenaf fiber composite were obtained using parametric finite element modeling, with varying micro-fibril orientation in S2 layer. The axial modulus was reduced by 48-54% with an increase in MFA in the S2 layer. The transverse modulus and shear modulus were least affected. The axial modulus increased by 22% with an increase in cellulose content at MFA of 0 o. The shear modulus and Poisson s ratio were least affected by an increase in cellulose content. These results indicate that the axial modulus of a composite is a function of fiber anisotropy. The numerical tests shows that the axial modulus increases with an increase in the cellulose content and the composites processed from fibers like cotton and ramie (which constitute 90% cellulose) as reinforcement will have increased Young s modulus as. 3. It was deduced that the composite properties remained quasi-isotropic at the concentration parameter of 0.5 and 2 (i.e. equivalent modulus remained almost constant) as shown in Figure With an increase in the concentration parameter, the equivalent modulus appeared to be directional dependent (i.e. it decreases with an increase in MFA). The homogenization model developed for randomly oriented short fiber composite was able to predict the equivalent modulus (material is quasi-isotropic) and also explained the direction dependence property with fibers oriented in a particular direction. 5.3 Future Work 1. Understanding fiber and matrix interfacial characteristics through fiber pull out tests/single fiber fragmentation tests will provide an opportunity for enhancing the strength
106 90 of natural fiber composites. 2. The appropriate manufacturing method for reducing the voids will enhance the strength of composites. 3. The application of kenaf fiber reinforced composites becomes crucial in the hygroscopic environment due to fiber water absorption property. Therefore, durability studies will be required to understand the behavior of the composite. 4. The voids in the unit cell and an imperfect bond (interface model) between fiber and matrix will be required to model the fracture and damage behavior of the composite.
107 91 References [1] Mallick, P. K., Fiber-Reinforced Composites: Materials, Manufacturing, and Design, CRC press, [2] Joshi, S. V., Drzal, L., Mohanty, A., and Arora, S., Are natural fiber composites environmentally superior to glass fiber reinforced composites? Composites Part A: Applied Science and Manufacturing, Vol. 35, No. 3, 2004, pp [3] Faruk, O., Bledzki, A. K., Fink, H.-P., and Sain, M., Biocomposites reinforced with natural fibers: , Progress in Polymer Science, Vol. 37, No. 11, 2012, pp [4] Paridah, M. T., Basher, A. B., SaifulAzry, S., and Ahmed, Z., RETTING PROCESS OF SOME BAST PLANT FIBRES AND ITS EFFECT ON FIBRE QUALITY: A REVIEW, BioResources, Vol. 6, No. 4, 2011, pp [5] Das, P., Nag, D., Debnath, S., and Nayak, L., Machinery for extraction and traditional spinning of plant fibres, Indian Journal of Traditional Knowledge, Vol. 9, No. 2, 2010, pp [6] Wambua, P., Ivens, J., and Verpoest, I., Natural fibres: can they replace glass in fibre reinforced plastics? Composites Science and Technology, Vol. 63, No. 9, 2003, pp [7] Symington, M. C., Banks, W. M., West, D., and Pethrick, R., Tensile Testing of Cellulose Based Natural Fibers for Structural Composite Applications, Journal of Composite Materials, [8] Ochi, S., Tensile Properties of Kenaf Fiber Bundle, SRX Materials Science, Vol. 2010, [9] Rowell, R. M., Sanadi, A. R., Caulfield, D. F., and Jacobson, R. E., Utilization of Natural Fibers in Plastic Composites: Problems and Opportunities, Lignocellulosic- Plastics Composites, 1997, pp [10] Sen, T. and Reddy, H. J., Various Industrial Applications of Hemp, kenaf, Flax and Ramie Natural Fibres, International Journal of Innovation, Management and Technology, Vol. 2, 2011, pp [11] Holbery, J. and Houston, D., Natural-Fiber-Reinforced Polymer Composites in Automotive Applications, JOM, Vol. 58, No. 11, 2006, pp [12] Zampaloni, M., Pourboghrat, F., Yankovich, S., Rodgers, B., Moore, J., Drzal, L., Mohanty, A., and Misra, M., Kenaf natural fiber reinforced polypropylene composites: A discussion on manufacturing problems and solutions, Composites Part A: Applied Science and Manufacturing, Vol. 38, No. 6, 2007, pp
108 [13] John, S., Nilmini, P., Amandeep, S., and Hall, W., A review of bast fibers and their composites. Part 1: fibers as reinforcement, Composites Part A, Vol. 41, 2010, pp [14] Won, J. S., Lee, J. E., Jin, D. Y., and Lee, S. G., Mechanical Properties and Biodegradability of the Kenaf/Soy Protein Isolate-PVA Biocomposites, International Journal of Polymer Science, [15] Akil, H., Omar, M., Mazuki, A., Safiee, S., Ishak, Z., and Bakar, A. A., Kenaf fiber reinforced composites: a review, Materials & Design, Vol. 32, No. 8, 2011, pp [16] Lee, B.-H., Kim, H.-J., and Yu, W.-R., Fabrication of long and discontinuous natural fiber reinforced polypropylene biocomposites and their mechanical properties, Fibers and Polymers, Vol. 10, No. 1, 2009, pp [17] Ku, H., Wang, H., Pattarachaiyakoop, N., and Trada, M., A review on the tensile properties of natural fiber reinforced polymer composites, Composites Part B: Engineering, Vol. 42, No. 4, 2011, pp [18] de Andrade Silva, F., Chawla, N., and de Toledo Filho, R. D., Tensile behavior of high performance natural (sisal) fibers, Composites Science and Technology, Vol. 68, No. 15, 2008, pp [19] Pan, N., Chen, H., Thompson, J., Inglesby, M., Khatua, S., Zhang, X., and Zeronian, S., The size effects on the mechanical behaviour of fibres, Journal of Materials Science, Vol. 32, No. 10, 1997, pp [20] Mohanty, S., Nayak, S., Verma, S., and Tripathy, S., Effect of MAPP as a coupling agent on the performance of jute PP composites, Journal of Reinforced Plastics and Composites, Vol. 23, No. 6, 2004, pp [21] Meon, M. S., Othman, M. F., Husain, H., Remeli, M. F., and Syawal, M. S. M., Improving tensile properties of kenaf fibers treated with sodium hydroxide, Procedia Engineering, Vol. 41, 2012, pp [22] Herrera-Franco, P. and Valadez-Gonzalez, A., A study of the mechanical properties of short natural-fiber reinforced composites, Composites Part B: Engineering, Vol. 36, No. 8, 2005, pp [23] Lim, J., Zheng, J. Q., Masters, K., and Chen, W. W., Effects of gage length, loading rates, and damage on the strength of PPTA fibers, International Journal of Impact Engineering, Vol. 38, No. 4, 2011, pp [24] Xue, Y., Du, Y., Elder, S., Wang, K., and Zhang, J., Temperature and loading rate effects on tensile properties of kenaf bast fiber bundles and composites, Composites Part B: Engineering, Vol. 40, No. 3, 2009, pp [25] De Santo, M., Liguori, C., Paolillo, A., and Pietrosanto, A., Standard uncertainty evaluation in image-based measurements, Measurement, Vol. 36, No. 3, 2004, pp
109 [26] Liguori, C., Paolillo, A., and Pietrosanto, A., An automatic measurement system for the evaluation of carotid intima-media thickness, Instrumentation and Measurement, IEEE Transactions on, Vol. 50, No. 6, 2001, pp [27] Coleman, H. W. and Steele, W. G., Experimentation, validation, and uncertainty analysis for engineers, John Wiley & Sons, [28] UNCERT, C., 7: 2000-Gabauer, W., Manual of Codes of Practice for the Determination of Uncertainties in Mechanical Tests on Metallic Materials, The Determination of Uncertainties in Tensile Testing, Project, No, Tech. rep., SMT4-CT , [29] Weibull, W., Wide applicability, Journal of Applied Mechanics, [30] Todinov, M., Probability of fracture initiated by defects, Materials Science and Engineering: A, Vol. 276, No. 1, 2000, pp [31] Zhu, Y. T., Blumenthal, W. R., Taylor, S. T., Lowe, T. C., and Zhou, B., Analysis of size dependence of ceramic fiber and whisker strength, Journal of the American Ceramic Society, Vol. 80, No. 6, 1997, pp [32] Wang, F. and Shao, J., Modified Weibull Distribution for Analyzing the Tensile Strength of Bamboo Fibers, Polymers, Vol. 6, No. 12, 2014, pp [33] Fidelis, M. E. A., Pereira, T. V. C., Gomes, O. d. F. M., de Andrade Silva, F., and Toledo Filho, R. D., The effect of fiber morphology on the tensile strength of natural fibers, Journal of Materials Research and Technology, Vol. 2, No. 2, 2013, pp [34] Shao, J., Wang, F., Li, L., and Zhang, J., Scaling Analysis of the Tensile Strength of Bamboo Fibers Using Weibull Statistics, Advances in Materials Science and Engineering, Vol. 2013, [35] Da Costa, L., Loiola, R., and Monteiro, S., Diameter dependence of tensile strength by Weibull analysis: Part I bamboo fiber, Matéria (Rio de Janeiro), Vol. 15, No. 2, 2010, pp [36] Zhang, Y., Wang, X., Pan, N., and Postle, R., Weibull analysis of the tensile behavior of fibers with geometrical irregularities, Journal of Materials Science, Vol. 37, No. 7, 2002, pp [37] Andersons, J., Spārniņš, E., Joffe, R., and Wallström, L., Strength distribution of elementary flax fibres, Composites Science and Technology, Vol. 65, No. 3, 2005, pp [38] Xia, Z., Yu, J., Cheng, L., Liu, L., and Wang, W., Study on the breaking strength of jute fibres using modified Weibull distribution, Composites Part A: Applied Science and Manufacturing, Vol. 40, No. 1, 2009, pp [39] Curtin, W., Tensile strength of fiber-reinforced composites: III. Beyond the traditional Weibull model for fiber strengths, Journal of Composite Materials, Vol. 34, No. 15, 2000, pp
110 [40] Ochi, S., Mechanical properties of kenaf fibers and kenaf/pla composites, Mechanics of Materials, Vol. 40, No. 4, 2008, pp [41] Manera, M., Elastic Properties of Randomly Oriented Short Fiber-Glass Composites, Journal of Composite Materials, Vol. 11, No. 2, 1977, pp [42] Li, S., On the unit cell for micromechanical analysis of fibre-reinforced composites, Proceedings of the Royal Society of London. Series A: Mathematical, Physical and Engineering Sciences, Vol. 455, No. 1983, 1999, pp [43] Aboudi, J., Micromechanical Analysis of Composites by the Method of Cells, Applied Mechanics Reviews, Vol. 42, No. 7, 1989, pp [44] Hashin, Z., Analysis of Composite MaterialsA Survey, Journal of Applied Mechanics, Vol. 50, No. 3, 1983, pp [45] Sun, C. and Vaidya, R., Prediction of composite properties from a representative volume element, Composites Science and Technology, Vol. 56, No. 2, 1996, pp [46] Xia, Z., Zhang, Y., and Ellyin, F., A unified periodical boundary conditions for representative volume elements of composites and applications, International Journal of Solids and Structures, Vol. 40, No. 8, 2003, pp [47] Xia, Z., Zhou, C., Yong, Q., and Wang, X., On selection of repeated unit cell model and application of unified periodic boundary conditions in micro-mechanical analysis of composites, International Journal of Solids and Structures, Vol. 43, No. 2, 2006, pp [48] Qu, J. and Cherkaoui, M., Macroscopic Averages, Fundamentals of Micromechanics of Solids, pp [49] Cook, R. D. et al., Concepts and applications of finite element analysis, John Wiley & Sons, [50] Qing, H. and Mishnaevsky, L., 3D hierarchical computational model of wood as a cellular material with fibril reinforced, heterogeneous multiple layers, Mechanics of Materials, Vol. 41, No. 9, 2009, pp [51] Thomas, S., Paul, S., Pothan, L., and Deepa, B., Natural Fibres: Structure, Properties and Applications, Cellulose Fibers: Bio-and Nano-Polymer Composites, Springer, 2011, pp [52] O SULLIVAN, A. C., Cellulose: the structure slowly unravels, Cellulose, Vol. 4, No. 3, 1997, pp [53] Salmén, L. and de Ruvo, A., A model for the prediction of fiber elasticity, Wood and Fiber Science, Vol. 17, No. 3, 1985, pp [54] Geuzaine, C. and Remacle, J.-F., Gmsh: A 3-D finite element mesh generator with built-in pre-and post-processing facilities, International Journal for Numerical Methods in Engineering, Vol. 79, No. 11, 2009, pp
111 [55] De Sá, J. P. M., Applied Statistics Using SPSS, STATISTICA, MATLAB and R: Using SPSS, Statistica, MATLAB, and R, Springer Science & Business Media, [56] Christensen, R., Introduction to the Mechanics of Composites [Russian translation], Mir, Moscow, [57] Pan, N., The Elastic Constants of Randomly Oriented Fiber Composites: A New Approach to Prediction, Science and Engineering of Composite Materials, Vol. 5, No. 2, 1996, pp [58] Pan, Y., Iorga, L., and Pelegri, A. A., Numerical generation of a random chopped fiber composite RVE and its elastic properties, Composites Science and Technology, Vol. 68, No. 13, 2008, pp [59] Pan, Y., Iorga, L., and Pelegri, A. A., Analysis of 3D random chopped fiber reinforced composites using FEM and random sequential adsorption, Computational Materials Science, Vol. 43, No. 3, 2008, pp [60] Kari, S., Berger, H., Rodriguez-Ramos, R., and Gabbert, U., Computational evaluation of effective material properties of composites reinforced by randomly distributed spherical particles, Composite Structures, Vol. 77, No. 2, 2007, pp [61] Kari, S., Berger, H., and Gabbert, U., Numerical evaluation of effective material properties of randomly distributed short cylindrical fibre composites, Computational Materials Science, Vol. 39, No. 1, 2007, pp
112 Appendices 96

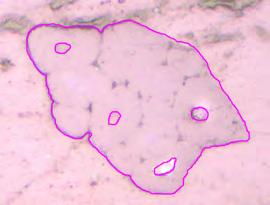
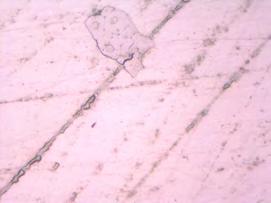
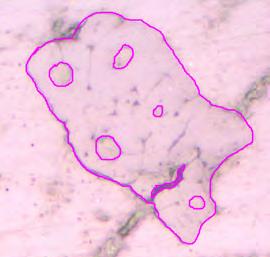
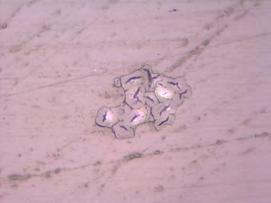
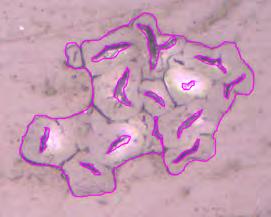
113 97 Appendix A Fiber Cross-Sectional Area Table A.1: Evaluated Fiber Area Using ImageJ (25.4mm) Specimen Optical Microscopic Image ImageJ Fiber 1 Fiber 2 Fiber 3


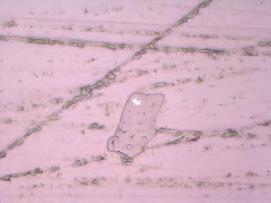
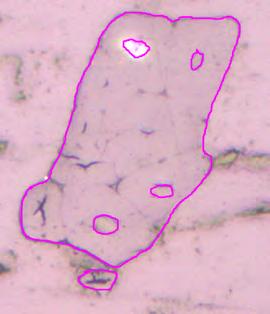
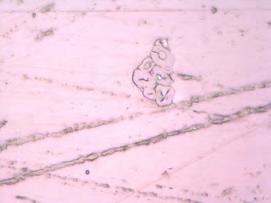
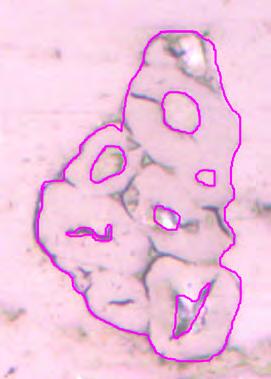
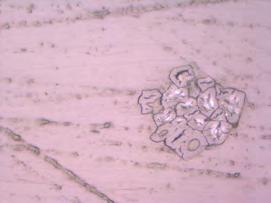
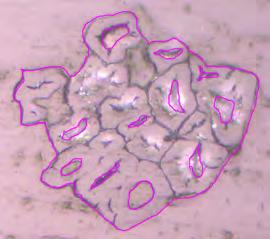
114 98 Fiber 4 Fiber 5 Fiber 6 Fiber 7


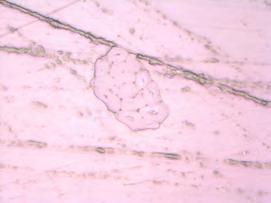
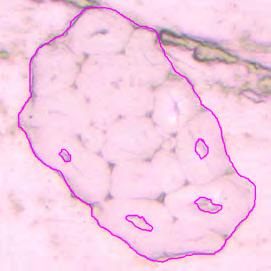
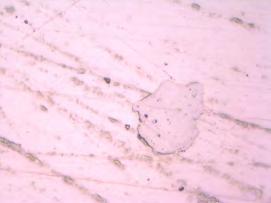
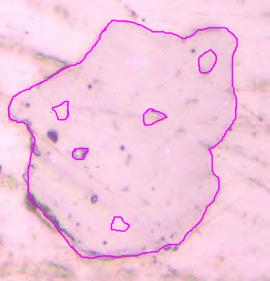
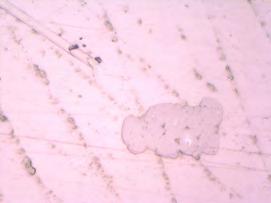

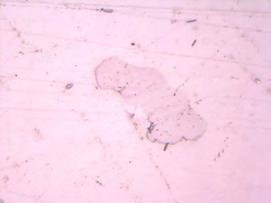
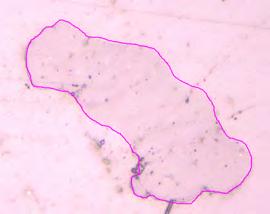
115 99 Fiber 8 Fiber 9 Fiber 10 Fiber 11 Fiber 12


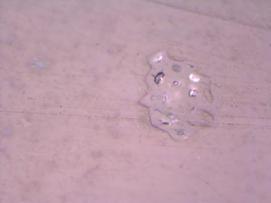
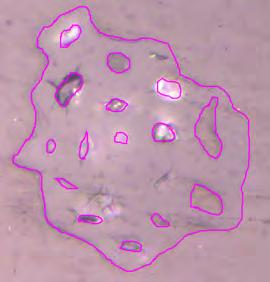
116 100 Table A.2: Evaluated Fiber Area Using ImageJ (20mm) Specimen Optical Microscopic Image ImageJ Fiber 1 Fiber 2 Fiber 3


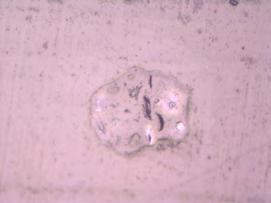
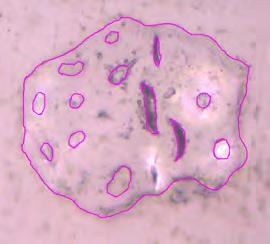
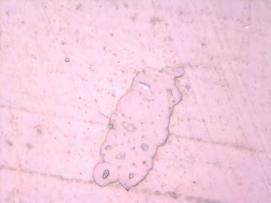
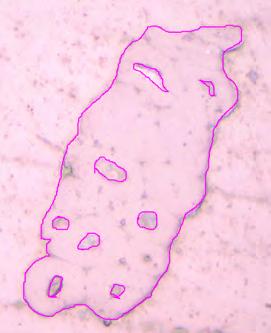
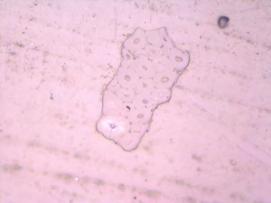

117 101 Fiber 4 Fiber 5 Fiber 6 Fiber 7


")

118 102 Fiber 8 Fiber 9 Fiber 10 Table A.3: Evaluated Fiber Area Using ImageJ (15mm) Specimen Optical Microscopic Image ImageJ


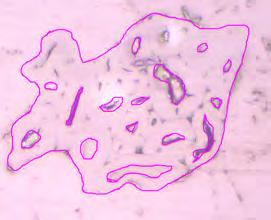
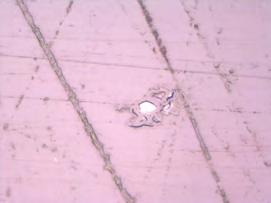
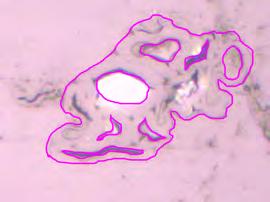
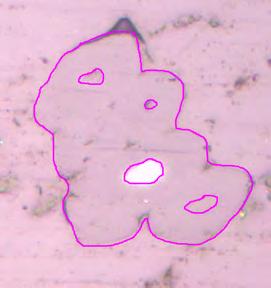
119 103 Fiber 1 Fiber 2 Fiber 3 Fiber 4


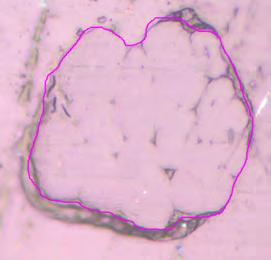
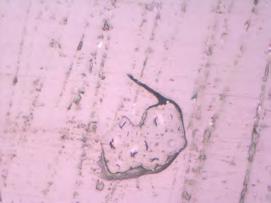
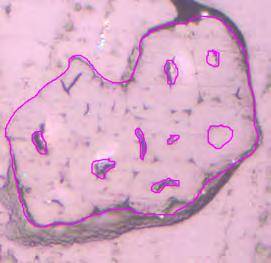
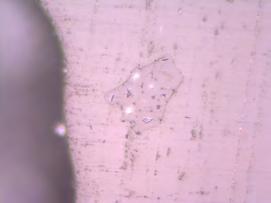
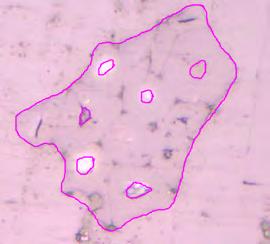
120 104 Fiber 5 Fiber 6 Fiber 7 Fiber 8


")

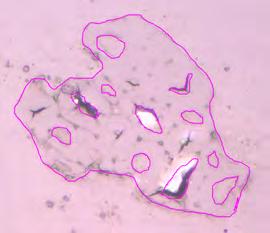
121 105 Fiber 9 Fiber 10 Fiber 11 Fiber 12 Table A.4: Evaluated Fiber Area Using ImageJ (10mm) Specimen Optical Microscopic Image ImageJ


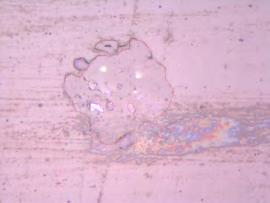
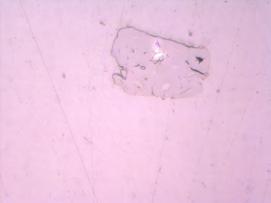
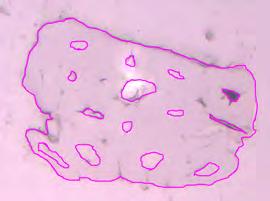
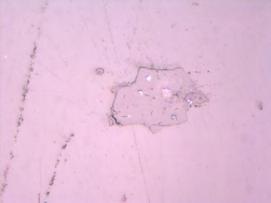
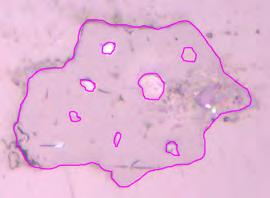
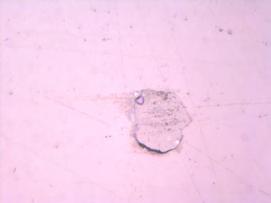
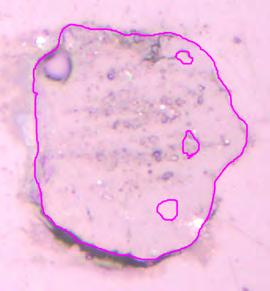
122 106 Fiber 1 Fiber 2 Fiber 3 Fiber 4 Fiber 5


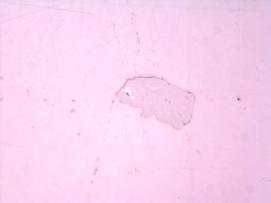
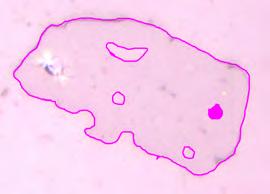
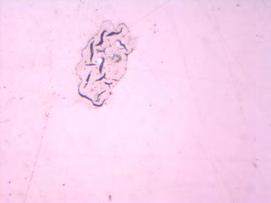
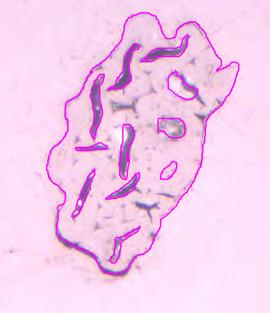
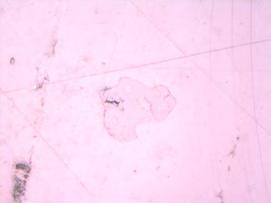
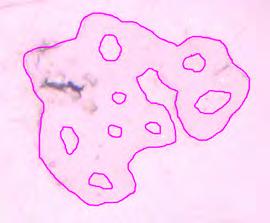
123 107 Fiber 6 Fiber 7 Fiber 8 Fiber 9

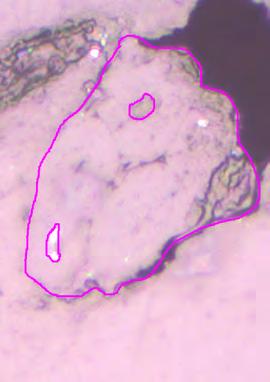
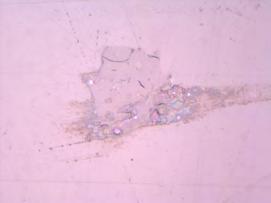
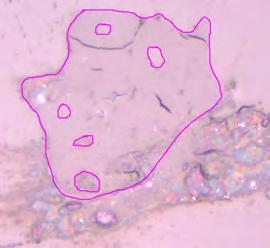
124 108 Fiber 10 Fiber 11
125 109 Table A.5: 55/24/21 Elastic Constants(GPa) of Random Fiber Composite at Volume Fraction E(GP a) θ K=0.5 K=2 K=5 K=8 K=10 K=20 K=40 K=60 K= ν Table A.6: 60/23/17 Elastic Constants(GPa) of Random Fiber Composite at Volume Fraction E(GP a) θ K=0.5 K=2 K=5 K=8 K=10 K=20 K=40 K=60 K= ν
126 110 Table A.7: 65/20/15 Elastic Constants(GPa) of Random Fiber Composite at Volume Fraction E(GP a) θ K=0.5 K=2 K=5 K=8 K=10 K=20 K=40 K=60 K= ν Table A.8: 70/17/13 Elastic Constants(GPa) of Random Fiber Composite at Volume Fraction E(GP a) θ K=0.5 K=2 K=5 K=8 K=10 K=20 K=40 K=60 K= ν
127 111 Appendix B Figures (a) GL : 25.4 mm (b) GL : 20 mm Fig. B.1: Cumulative Distribution Function with Evaluated Parameters
128 112 (c) GL : 15 mm (d) GL : 10 mm Fig. B.1: Cumulative Distribution Function with Evaluated Parameters (Contd)
129 113 (a) GL : 25.4 mm (b) GL : 20 mm Fig. B.2: Cumulative Distribution Function of Three Parameter Model for Consistent Data
130 114 (c) GL : 15 mm (d) GL : 10 mm Fig. B.2: Cumulative Distribution Function of Three Parameter Model for Consistent Data (Contd)

131 Fig. B.3: Block Diagram of Tensile Test 115
CHEM-C2410: Materials Science from Microstructures to Properties Composites: basic principles
 CHEM-C2410: Materials Science from Microstructures to Properties Composites: basic principles Mark Hughes 14 th March 2017 Today s learning outcomes To understand the role of reinforcement, matrix and
ASPECTS CONCERNING TO THE MECHANICAL PROPERTIES OF THE GLASS / FLAX / EPOXY COMPOSITE MATERIAL
 5 th International Conference Advanced Composite Materials Engineering COMAT 2014 16-17 October 2014, Braşov, Romania ASPECTS CONCERNING TO THE MECHANICAL PROPERTIES OF THE GLASS / FLAX / EPOXY COMPOSITE
Mechanical and Thermal Properties of Coir Fiber Reinforced Epoxy Composites Using a Micromechanical Approach
 Mechanical and Thermal Properties of Coir Fiber Reinforced Epoxy Composites Using a Micromechanical Approach Sandhyarani Biswas Department of Mechanical Engineering, N.I.T Rourkela, INDIA Abstract: Now-a-days,
FLEXURAL BEHAVIOR OF NEEDLE PUNCH GLASS/JUTE HYBRID MAT COMPOSITES
 FLEXURAL BEHAVIOR OF NEEDLE PUNCH GLASS/JUTE HYBRID MAT COMPOSITES Defang Zhao 1, Kai Mao 1, Zhilan Xu 1, Zhiyuan Zhang 1, Yuqiu Yang 2, Hiroyuki Hamada 1 1 Advanced Fibro-Science, Kyoto Institute of Technology,
The Challenges of Natural Fibres. as Engineering Composite. Reinforcements
 The Challenges of Natural Fibres as Engineering Composite Reinforcements Jim Thomason, Fiona Gentles, Jamie Carruthers 19 th Annual BEPS Meeting September 28-3 th 211 Vienna, Austria Introduction Natural
All Graduate Theses and Dissertations
 Utah State University DigitalCommons@USU All Graduate Theses and Dissertations Graduate Studies 5-2017 Mechanical Performance of Natural / Natural Fiber Reinforced Hybrid Composite Materials Using Finite
BIAXIAL STRENGTH INVESTIGATION OF CFRP COMPOSITE LAMINATES BY USING CRUCIFORM SPECIMENS
 BIAXIAL STRENGTH INVESTIGATION OF CFRP COMPOSITE LAMINATES BY USING CRUCIFORM SPECIMENS H. Kumazawa and T. Takatoya Airframes and Structures Group, Japan Aerospace Exploration Agency 6-13-1, Ohsawa, Mitaka,
Micromechanical analysis of FRP hybrid composite lamina for in-plane transverse loading
 Indian Journal of Engineering & Materials Sciences Vol. 15, October 2008, pp. 382-390 Micromechanical analysis of FRP hybrid composite lamina for in-plane transverse loading K Sivaji Babu a *, K Mohana
Multi Disciplinary Delamination Studies In Frp Composites Using 3d Finite Element Analysis Mohan Rentala
 Multi Disciplinary Delamination Studies In Frp Composites Using 3d Finite Element Analysis Mohan Rentala Abstract: FRP laminated composites have been extensively used in Aerospace and allied industries
Computational Analysis for Composites
 Computational Analysis for Composites Professor Johann Sienz and Dr. Tony Murmu Swansea University July, 011 The topics covered include: OUTLINE Overview of composites and their applications Micromechanics
CHEM-E2200: Polymer blends and composites Fibre architecture and principles of reinforcement
 CHEM-E2200: Polymer blends and composites Fibre architecture and principles of reinforcement Mark Hughes 19 th September 2016 Outline Fibre architecture Volume fraction and the rule of mixtures Principle
ISSN: ISO 9001:2008 Certified International Journal of Engineering Science and Innovative Technology (IJESIT) Volume 2, Issue 4, July 2013
 Volume 2, Issue 4, July 2013") Delamination Studies in Fibre-Reinforced Polymer Composites K.Kantha Rao, Dr P. Shailesh, K. Vijay Kumar 1 Associate Professor, Narasimha Reddy Engineering College Hyderabad. 2 Professor, St. Peter s Engineering
Delamination Studies in Fibre-Reinforced Polymer Composites K.Kantha Rao, Dr P. Shailesh, K. Vijay Kumar 1 Associate Professor, Narasimha Reddy Engineering College Hyderabad. 2 Professor, St. Peter s Engineering
Non-conventional Glass fiber NCF composites with thermoset and thermoplastic matrices. F Talence, France Le Cheylard, France
 20 th International Conference on Composite Materials Copenhagen, 19-24th July 2015 Non-conventional Glass fiber NCF composites with thermoset and thermoplastic matrices. Thierry Lorriot 1, Jalal El Yagoubi
TABLE OF CONTENTS. Mechanics of Composite Materials, Second Edition Autar K Kaw University of South Florida, Tampa, USA
 Mechanics of Composite Materials, Second Edition Autar K Kaw University of South Florida, Tampa, USA TABLE OF CONTENTS 1. INTRODUCTION TO COMPOSITE MATERIALS 1.1 Introduction... 1.2 Classification... 1.2.1
*Corresponding author: Keywords: Finite-element analysis; Multiscale modelling; Onset theory; Dilatational strain invariant.
 18 TH INTERNATIONAL CONFERENCE ON COMPOSITE MATERIALS MICROMECHANICAL MODELLING OF TEST SPECIMENS FOR ONSET OF DILATATIONAL DAMAGE OF POLYMER MATRIX IN COMPOSITE MATERIALS T. D. Tran 1, D. Kelly 1*, G.
FINITE ELEMENT AND EXPERIMENTAL STUDY OF NOVEL CONCEPT OF 3D FIBRE CELL STRUCTURE
 FINITE ELEMENT AND EXPERIMENTAL STUDY OF NOVEL CONCEPT OF 3D FIBRE CELL STRUCTURE M. Růžička, V. Kulíšek 2, J. Had, O. Prejzek Department of Mechanics, Biomechanics and Mechatronics, Faculty of Mechanical
Prediction of Micromechanical Behaviour of Elliptical Frp Composites
 Prediction of Micromechanical Behaviour of Elliptical Frp Composites Kiranmayee.Nerusu Dept. of Mechanical Engg. P. V. P. Siddhartha Institute of Technology, Vijayawada 520 007, A.P, India. P. Phani Prasanthi
LAMINATION THEORY FOR THE STRENGTH OF FIBER COMPOSITE MATERIALS
 XXII. LAMINATION THEORY FOR THE STRENGTH OF FIBER COMPOSITE MATERIALS Introduction The lamination theory for the elastic stiffness of fiber composite materials is the backbone of the entire field, it holds
Anisotropy in Natural Fibres and its Influence on Composite Performance. Jim Thomason
 Anisotropy in Natural Fibres and its Influence on Composite Performance Jim Thomason Thermoplastic Composites Growth Strong continuing growth Attractive & Improving Performance to Price Ratio Clean processing
Development of a code to generate randomly distributed short fiber composites to estimate mechanical properties using FEM
 International Journal of Theoretical and Applied Mechanics. ISSN 0973-6085 Volume 12, Number 4 (2017) pp. 863-872 Research India Publications http://www.ripublication.com Development of a code to generate
3D Compression Molding
 Autodesk Simulation Moldflow Insight 2014 3D Compression Molding Executive summary In this work, the simulation results from a program developed for the three-dimensional analysis of compression molding
EFFECT OF THERMAL FATIGUE ON INTRALAMINAR CRACKING IN LAMINATES LOADED IN TENSION
 EFFECT OF THERMAL FATIGUE ON INTRALAMINAR CRACKING IN LAMINATES LOADED IN TENSION J.Varna and R.Joffe Dept of Applied Physics and Mechanical Engineering Lulea University of Technology, SE 97187, Lulea,
DAMAGE MECHANICS MODEL FOR OFF-AXIS FATIGUE BEHAVIOR OF UNIDIRECTIONAL CARBON FIBER-REINFORCED COMPOSITES AT ROOM AND HIGH TEMPERATURES
 DAMAGE MECHANICS MODEL FOR OFF-AXIS FATIGUE BEHAVIOR OF UNIDIRECTIONAL CARBON FIBER-REINFORCED COMPOSITES AT ROOM AND HIGH TEMPERATURES M. Kawai Institute of Engineering Mechanics University of Tsukuba,
Comparison of Ply-wise Stress-Strain results for graphite/epoxy laminated plate subjected to in-plane normal loads using CLT and ANSYS ACP PrepPost
 Comparison of Ply-wise Stress-Strain results for graphite/epoxy laminated plate subjected to in-plane normal loads using CLT and ANSYS ACP PrepPost 1 Mihir A. Mehta, 2 Satyen D. Ramani 1 PG Student, Department
Effect of Specimen Dimensions on Flexural Modulus in a 3-Point Bending Test
 Effect of Specimen Dimensions on Flexural Modulus in a 3-Point Bending Test M. Praveen Kumar 1 and V. Balakrishna Murthy 2* 1 Mechanical Engineering Department, P.V.P. Siddhartha Institute of Technology,
Effect of Machining Parameters on Milled Natural Fiber- Reinforced Plastic Composites
 Journal of Advanced Mechanical Engineering (2013) doi:10.7726/jame.2013.1001 Research Article Effect of Machining Parameters on Milled Natural Fiber- Reinforced Plastic Composites G Dilli Babu 1*, K. Sivaji
Dynamic analysis of Composite Micro Air Vehicles
 Dynamic analysis of Composite Micro Air Vehicles Shishir Kr. Sahu Professor and Head, Civil Engineering, National Institute of Technology, Rourkela, India E-mail: sksahu@nitrkl.ac.in ABSTRACT The present
MICROMECHANICAL ANALYSIS OF FRP COMPOSITES SUBJECTED TO LONGITUDINAL LOADING
 MICROMECHANICAL ANALYSIS OF FRP COMPOSITES SUBJECTED TO LONGITUDINAL LOADING N. Krishna Vihari 1, P. Phani Prasanthi 1, V. Bala Krishna Murthy 2* and A. Srihari Prasad 3 1 Mech. Engg. Dept., P. V. P. Siddhartha
2 Experiment of GFRP bolt
 16 TH INTERNATIONAL CONFERENCE ON COMPOSITE MATERIALS FATIGUE LIFE EVALUATION OF BOLT MADE OF WOVEN FABRIC FRP Takeshi INOUE*, Hiroaki NAKAI**, Tetsusei KURASHIKI**, Masaru ZAKO**, Yuji KOMETANI*** *Graduate
Evaluation of in-plane orthotropic elastic constants of paper and paperboard
 Evaluation of in-plane orthotropic elastic constants of paper and paperboard T. Yokoyama and K. Nakai Department of Mechanical Engineering, Okayama University of Science - Ridai-cho, Okayama 7-5, Japan
Laboratory 4 Bending Test of Materials
 Department of Materials and Metallurgical Engineering Bangladesh University of Engineering Technology, Dhaka MME 222 Materials Testing Sessional.50 Credits Laboratory 4 Bending Test of Materials. Objective
Hygrothermal stresses in laminates
 Hygrothermal stresses in laminates Changing environment conditions (temperature and moisture) have an important effect on the properties which are matrix dominated. Change in temperaturet and moisture
American Society for Testing and Materials (ASTM) Standards. Mechanical Testing of Composites and their Constituents
 Standards. Mechanical Testing of Composites and their Constituents") Mechanical Testing of Composites and their Constituents American Society for Testing and Materials (ASTM) Standards Tests done to determine intrinsic material properties such as modulus and strength for
Mechanical Testing of Composites and their Constituents American Society for Testing and Materials (ASTM) Standards Tests done to determine intrinsic material properties such as modulus and strength for
Passive Damping Characteristics of Carbon Epoxy Composite Plates
 Journal of Materials Science and Engineering A 6 (-) 35-4 doi:.765/6-63/6.-.5 D DAVID PUBLISHING Passive Damping Characteristics of Carbon Epoxy Composite Plates Dileep Kumar K * and V V Subba Rao Faculty
In Situ Ultrasonic NDT of Fracture and Fatigue in Composites
 ECNDT 26 - Mo.2.6.5 In Situ Ultrasonic NDT of Fracture and Fatigue in Composites I. SOLODOV, K. PFLEIDERER, and G. BUSSE Institute for Polymer Testing and Polymer Science (IKP), Non-destructive Testing
Tensile Properties of Thermoplastic-Laminated Composites Based on a Polypropylene Matrix Reinforced with Continuous Twaron Fibers
 Tensile Properties of Thermoplastic-Laminated Composites Based on a Polypropylene Matrix Reinforced with Continuous Twaron Fibers J. L. MENA-TUN, P. I. GONZALEZ-CHI Centro de Investigación Científica de
Module III - Macro-mechanics of Lamina. Lecture 23. Macro-Mechanics of Lamina
 Module III - Macro-mechanics of Lamina Lecture 23 Macro-Mechanics of Lamina For better understanding of the macromechanics of lamina, the knowledge of the material properties in essential. Therefore, the
TENSILE FATIGUE BEHAVIOR OF SINGLE FIBRES AND FIBRE BUNDLES
 TENSILE FATIGUE BEHAVIOR OF SINGLE FIBRES AND FIBRE BUNDLES C. Qian 1 *, R. P. L. Nijssen 1, D. D. Samborsky 2, C.Kassapoglou 3, Z. Gürdal 3, G. Q. Zhang 4 1 Knowledge Centre Wind turbine Materials and
Lab Exercise #5: Tension and Bending with Strain Gages
 Lab Exercise #5: Tension and Bending with Strain Gages Pre-lab assignment: Yes No Goals: 1. To evaluate tension and bending stress models and Hooke s Law. a. σ = Mc/I and σ = P/A 2. To determine material
Open-hole compressive strength prediction of CFRP composite laminates
 Open-hole compressive strength prediction of CFRP composite laminates O. İnal 1, A. Ataş 2,* 1 Department of Mechanical Engineering, Balikesir University, Balikesir, 10145, Turkey, inal@balikesir.edu.tr
A RESEARCH ON NONLINEAR STABILITY AND FAILURE OF THIN- WALLED COMPOSITE COLUMNS WITH OPEN CROSS-SECTION
 A RESEARCH ON NONLINEAR STABILITY AND FAILURE OF THIN- WALLED COMPOSITE COLUMNS WITH OPEN CROSS-SECTION H. Debski a*, J. Bienias b, P. Jakubczak b a Faculty of Mechanical Engineering, Department of Machine
MECHANICAL FAILURE OF A COMPOSITE HELICOPTER STRUCTURE UNDER STATIC LOADING
 MECHANICAL FAILURE OF A COMPOSITE HELICOPTER STRUCTURE UNDER STATIC LOADING Steven Roy, Larry Lessard Dept. of Mechanical Engineering, McGill University, Montreal, Québec, Canada ABSTRACT The design and
INTERNATIONAL JOURNAL OF APPLIED ENGINEERING RESEARCH, DINDIGUL Volume 2, No 1, 2011
 Interlaminar failure analysis of FRP cross ply laminate with elliptical cutout Venkateswara Rao.S 1, Sd. Abdul Kalam 1, Srilakshmi.S 1, Bala Krishna Murthy.V 2 1 Mechanical Engineering Department, P. V.
Mechanical Properties of Kenaf Composites Using Dynamic Mechanical Analysis
 Utah State University DigitalCommons@USU All Graduate Theses and Dissertations Graduate Studies 2015 Mechanical Properties of Kenaf Composites Using Dynamic Mechanical Analysis Thomas A. Loveless Follow
Keywords: Adhesively bonded joint, laminates, CFRP, stacking sequence
 THE 19 TH INTERNATIONAL CONFERENCE ON COMPOSITE MATERIALS GLOBAL AND LOCAL INFLUENCE OF STACKING SEQUENCE ON THE STRENGTH OF ADHESIVELY BONDED JOINTS OF CFRP LAMINATES J. Rousseau*, P. Satthamnuwong DRIVE,
Micro-meso draping modelling of non-crimp fabrics
 Micro-meso draping modelling of non-crimp fabrics Oleksandr Vorobiov 1, Dr. Th. Bischoff 1, Dr. A. Tulke 1 1 FTA Forschungsgesellschaft für Textiltechnik mbh 1 Introduction Non-crimp fabrics (NCFs) are
Assessment Methods of Mechanical Properties of Composite Materials
 Mechanics and Mechanical Engineering Vol. 21, No. 4 (2017) 1005 1018 c Lodz University of Technology Assessment Methods of Mechanical Properties of Composite Materials Monika Kamocka Radoslaw J. Mania
SOME RESEARCH ON FINITE ELEMENT ANALYSIS OF COMPOSITE MATERIALS
 Mechanical Testing and Diagnosis ISSN 2247 9635, 2012 (II), Volume 3, 79-85 SOME RESEARCH ON FINITE ELEMENT ANALYSIS OF COMPOSITE MATERIALS Valeriu DULGHERU, Viorel BOSTAN, Marin GUŢU Technical University
Mechanical Behavior of Circular Composite Springs with Extended Flat Contact Surfaces
 Mechanical Behavior of Circular Composite Springs with Extended Flat Contact Surfaces Ping-Cheung Tse epartment of Mechanical Engineering, The Hong Kong Polytechnic University, Hunghom, Kowloon, Hong Kong
Size Effects In the Crushing of Honeycomb Structures
 45th AIAA/ASME/ASCE/AHS/ASC Structures, Structural Dynamics & Materials Conference 19-22 April 2004, Palm Springs, California AIAA 2004-1640 Size Effects In the Crushing of Honeycomb Structures Erik C.
INVESTIGATION OF THE PROCESSING PARAMETERS OF A 3D WOVEN REINFORCEMENT
 INVESTIGATION OF THE PROCESSING PARAMETERS OF A 3D WOVEN REINFORCEMENT Andreas Endruweit, Dhiren K. Modi and Andrew C. Long School of Mechanical, Materials and Manufacturing Engineering, University of
Module 7: Micromechanics Lecture 25: Strength of Materials Approach. Introduction. The Lecture Contains. Effective Transverse Modulus
 Introduction In the previous lecture we have introduced the concept of Representative Volume Element or Unit Cell. This is the basic building block in a micromechanical study. Further, we explained the
AERO 214. Lab II. Measurement of elastic moduli using bending of beams and torsion of bars
 AERO 214 Lab II. Measurement of elastic moduli using bending of beams and torsion of bars BENDING EXPERIMENT Introduction Flexural properties of materials are of interest to engineers in many different
UNIT I SIMPLE STRESSES AND STRAINS
 Subject with Code : SM-1(15A01303) Year & Sem: II-B.Tech & I-Sem SIDDHARTH GROUP OF INSTITUTIONS :: PUTTUR Siddharth Nagar, Narayanavanam Road 517583 QUESTION BANK (DESCRIPTIVE) UNIT I SIMPLE STRESSES
THE ROLE OF DELAMINATION IN NOTCHED AND UNNOTCHED TENSILE STRENGTH
 THE ROLE OF DELAMINATION IN NOTCHED AND UNNOTCHED TENSILE STRENGTH M. R. Wisnom University of Bristol Advanced Composites Centre for Innovation and Science University Walk, Bristol BS8 1TR, UK M.Wisnom@bristol.ac.uk
Modelling the nonlinear shear stress-strain response of glass fibrereinforced composites. Part II: Model development and finite element simulations
 Modelling the nonlinear shear stress-strain response of glass fibrereinforced composites. Part II: Model development and finite element simulations W. Van Paepegem *, I. De Baere and J. Degrieck Ghent
Generic Strategies to Implement Material Grading in Finite Element Methods for Isotropic and Anisotropic Materials
 University of Nebraska - Lincoln DigitalCommons@University of Nebraska - Lincoln Engineering Mechanics Dissertations & Theses Mechanical & Materials Engineering, Department of Winter 12-9-2011 Generic
Prediction of Elastic Constants on 3D Four-directional Braided
 Prediction of Elastic Constants on 3D Four-directional Braided Composites Prediction of Elastic Constants on 3D Four-directional Braided Composites Liang Dao Zhou 1,2,* and Zhuo Zhuang 1 1 School of Aerospace,
Outline. Tensile-Test Specimen and Machine. Stress-Strain Curve. Review of Mechanical Properties. Mechanical Behaviour
 Tensile-Test Specimen and Machine Review of Mechanical Properties Outline Tensile test True stress - true strain (flow curve) mechanical properties: - Resilience - Ductility - Toughness - Hardness A standard
Experimental Investigation and Analysis of Machining Characteristics in Drilling Hybrid Glass-Sisal-Jute Fiber Reinforced Polymer Composites
 5 th International & 26 th All India Manufacturing Technology, Design and Research Conference (AIMTDR 2014) December 12 th 14 th, 2014, IIT Guwahati, Assam, India Experimental Investigation and Analysis
Flexural properties of polymers
 A2 _EN BUDAPEST UNIVERSITY OF TECHNOLOGY AND ECONOMICS FACULTY OF MECHANICAL ENGINEERING DEPARTMENT OF POLYMER ENGINEERING Flexural properties of polymers BENDING TEST OF CHECK THE VALIDITY OF NOTE ON
VALIDATION of CoDA SOFTWARE for COMPOSITES SYNTHESIS AND PRELIMINARY DESIGN (or GETTING COMPOSITES USED - PART 2 )
") VALIDATION of CoDA SOFTWARE for COMPOSITES SYNTHESIS AND PRELIMINARY DESIGN (or GETTING COMPOSITES USED - PART 2 ) Graham D Sims and William R Broughton Composites Design Data and Methods, Centre for Materials
VALIDATION of CoDA SOFTWARE for COMPOSITES SYNTHESIS AND PRELIMINARY DESIGN (or GETTING COMPOSITES USED - PART 2 ) Graham D Sims and William R Broughton Composites Design Data and Methods, Centre for Materials
MINE ROOF SUPPORT DESIGN AND ANALYSIS. Document no : Revision no : 1.0
 MINE ROOF SUPPORT DESIGN AND ANALYSIS Document no : 1806-2697-23 Revision no : 1.0 DOCUMENT TITLE : MINE ROOF SUPPORT DESIGN AND ANALYSIS DOCUMENT NUMBER : 1806-2697-23 ISSUE : Issue 1.0 DATE : 7 October
ALIGNED FLAX FIBRE/POLYLACTATE COMPOSITES A MATERIALS MODEL SYSTEM TO SHOW THE POTENTIAL OF BIOCOMPOSITES IN ENGINEERING APPLICATIONS
 ALIGNED FLAX FIBRE/POLYLACTATE COMPOSITES A MATERIALS MODEL SYSTEM TO SHOW THE POTENTIAL OF BIOCOMPOSITES IN ENGINEERING APPLICATIONS Bo Madsen 1, Hans Lilholt 1, Anders Thygesen 2, Elaine Arnold 3, Brendon
Composite Structural Mechanics using MATLAB
 Session 2520 Composite Structural Mechanics using MATLAB Oscar Barton, Jr., Jacob B. Wallace United States Naval Academy Annapolis, Md 21402 Abstract In this paper MATLAB is adopted as the programming
A Numerical Study on Prediction of BFS in Composite Structures under Ballistic Impact
 VOL. 1, 2015 ISSN 2394 3750 EISSN 2394 3769 SCIENCE & TECHNOLOGY A Numerical Study on Prediction of BFS in Composite Structures under Ballistic Impact Bandaru Aswani Kumar 1, Suhail Ahmad 2 1. Research
Out life 30 days at 70 F (21 C) Shelf life 6 months at 40 F (4 C) 12 months at 0 F (-18 C)
 Shelf life 6 months at 40 F (4 C) 12 months at 0 F (-18 C)") 4708 250-300 F (120-150 C) High T g Epoxy Resin System Typical applications General aviation Aerospace Industrial Sporting goods Out life 30 days at 70 F (21 C) Shelf life 6 months at 40 F (4 C) 12 months
4708 250-300 F (120-150 C) High T g Epoxy Resin System Typical applications General aviation Aerospace Industrial Sporting goods Out life 30 days at 70 F (21 C) Shelf life 6 months at 40 F (4 C) 12 months
NORMAL STRESS. The simplest form of stress is normal stress/direct stress, which is the stress perpendicular to the surface on which it acts.
 NORMAL STRESS The simplest form of stress is normal stress/direct stress, which is the stress perpendicular to the surface on which it acts. σ = force/area = P/A where σ = the normal stress P = the centric
Engineering Composite Reinforcements
 Facing up to the Challenges of Natural Fibres as Potential Engineering Composite Reinforcements Jim Thomason Composites Week @Leuven September 16-20 th 2013 Leuven, Belgium Jim why are you so down on Natural
Applicability of Engineering Models in Multiscale Modeling of Natural Fiber Hygro- Elastic Properties
 Applicability of Engineering Models in Multiscale Modeling of Natural Fiber Hygro- Elastic Properties Janis Varna and Eri Marlund Department of Applied Physics and Mechanical Engineering Where is Luleå?
Strength Prediction Of Composite Laminate
 Strength Prediction Of Composite te Prof. Yogananda. A 1, Mr. R. Vijayakumar 2 Assistant Professor, Department of Mechanical Engineering, East West Institute of Technology, Bangalore. Research Scholar,
NON-DESTRUCTIVE EVALUATION METHODS FOR COMPOSITE PILES
 NON-DESTRUCTIVE EVALUATION METHODS FOR COMPOSITE PILES John F. Davila Graduate Research Assistant 2006 URI-UPRM SUMMER INTERNSHIP RESEARCH PROGRAM Kingstown, RI July 29 of 2006 PRESENTATION OUTLINE Introduction
GB/T / ISO 527-1:1993
 Translated English of Chinese Standard: GB/T1040.1-2006 www.chinesestandard.net Sales@ChineseStandard.net GB NATIONAL STANDARD OF THE PEOPLE S REPUBLIC OF CHINA ICS 83.080.01 G 31 GB/T 1040.1-2006 / ISO
QUESTION BANK Composite Materials
 QUESTION BANK Composite Materials 1. Define composite material. 2. What is the need for composite material? 3. Mention important characterits of composite material 4. Give examples for fiber material 5.
Composite Materials Research Laboratory, State University of New York at Buffalo, Buffalo, NY , USA
 Composite Interfaces, Vol. 7, No. 4, pp. 257 275 (2000) VSP 2000. Discontinuous surface-treated submicron-diameter carbon filaments as an interlaminar filler in carbon fiber polymer-matrix composites for
ISO 178 INTERNATIONAL STANDARD. Plastics Determination of flexural properties. Plastiques Détermination des propriétés en flexion
 INTERNATIONAL STANDARD ISO 178 Fourth edition 2001-12-15 Plastics Determination of flexural properties Plastiques Détermination des propriétés en flexion Reference number ISO 2001 PDF disclaimer This PDF
USE OF DIGITAL IMAGE CORRELATION TO OBTAIN MATERIAL MODEL PARAMETERS FOR COMPOSITES
 USE OF DIGITAL IMAGE CORRELATION TO OBTAIN MATERIAL MODEL PARAMETERS FOR COMPOSITES Brian Croop, Hubert Lobo (DatapointLabs, USA). Presenter: Hubert Lobo, President SUMMARY The development of material
PLY LEVEL UNCERTAINTY EFFECTS ON FAILURE OF COMPOSITE
 7th European Workshop on Structural Health Monitoring July 8-11, 2014. La Cité, Nantes, France More Info at Open Access Database www.ndt.net/?id=17206 PLY LEVEL UNCERTAINTY EFFECTS ON FAILURE OF COMPOSITE
Fracture Mechanics, Damage and Fatigue: Composites
 University of Liège Aerospace & Mechanical Engineering Fracture Mechanics, Damage and Fatigue: Composites Ludovic Noels Computational & Multiscale Mechanics of Materials CM3 http://www.ltas-cm3.ulg.ac.be/
Anisotropic modeling of short fibers reinforced thermoplastics materials with LS-DYNA
 Anisotropic modeling of short fibers reinforced thermoplastics materials with LS-DYNA Alexandre Hatt 1 1 Faurecia Automotive Seating, Simplified Limited Liability Company 1 Abstract / Summary Polymer thermoplastics
Module 4: Behaviour of a Laminae-II. Learning Unit 1: M1. M4.1 Mechanics of Composites. M4.1.1 Introduction to Mechanics of Composites
 Module 4: Behaviour of a Laminae-II Learning Unit 1: M1 M4.1 Mechanics of Composites M4.1.1 Introduction to Mechanics of Composites The relation between ply uniaxial strengths and constituent properties
N = Shear stress / Shear strain
 UNIT - I 1. What is meant by factor of safety? [A/M-15] It is the ratio between ultimate stress to the working stress. Factor of safety = Ultimate stress Permissible stress 2. Define Resilience. [A/M-15]
Failure analysis of serial pinned joints in composite materials
 Indian Journal of Engineering & Materials Sciences Vol. 18, April 2011, pp. 102-110 Failure analysis of serial pinned joints in composite materials Alaattin Aktaş* Department of Mechanical Engineering,
NUMERICAL DESIGN OF COMPOSITE MATERIALS THROUGH MULTI-SCALE COMPUTER SIMULATION
 THE 19 TH INTERNATIONAL CONFERENCE ON COMPOSITE MATERIALS NUMERICAL DESIGN OF COMPOSITE MATERIALS THROUGH J. Leach 1 *, J. Mackiewicz 2, Dr. S. Risser 1 1 Battelle Memorial Institute, Columbus, OH, USA,
Calibration and Experimental Validation of LS-DYNA Composite Material Models by Multi Objective Optimization Techniques
 9 th International LS-DYNA Users Conference Optimization Calibration and Experimental Validation of LS-DYNA Composite Material Models by Multi Objective Optimization Techniques Stefano Magistrali*, Marco
MULTI-SCALE MODELLING OF FIBRE BUNDLES
 THE 19 TH INTERNATIONAL CONFERENCE ON COMPOSITE MATERIALS MULTI-SCALE MODELLING OF FIBRE BUNDLES N. D. Chakladar 1, P. Mandal 1 *, P. Potluri 2 1 School of Mechanical, Aerospace and Civil Engineering,
INTERNAL STRAIN MEASUREMENTS IN CFRP PLATES SUBJECTED TO IMPACT LOAD USING FBG SENSORS
 INTERNAL STRAIN MEASUREMENTS IN CFRP PLATES SUBJECTED TO IMPACT LOAD USING FBG SENSORS J. Frieden, J. Cugnoni, J. Botsis, Th. Gmür, D. Coric Laboratoire de Mécanique appliquée et d Analyse de Fiabilité
Design of Hybrid Composites for Axial loads with Zero Coefficient of Thermal Expansion
 Design of Hybrid Composites for Axial loads with Zero Coefficient of Thermal Expansion Zaffar M. Khan 1 and Asim Shahzad 2 Institute of Space Technology, Islamabad, Pakistan, 44000 Aerospace structures
Design Survey of Laminated Composite I-Beam
 Utah State University DigitalCommons@USU All Graduate Plan B and other Reports Graduate Studies 8-2018 Design Survey of Laminated Composite I-Beam Mrinmoy Saha Utah State University Follow this and additional
NUMERICAL SIMULATION OF DAMAGE IN THERMOPLASTIC COMPOSITE MATERIALS
 5 th European LS-DYNA Users Conference Composites NUMERICAL SIMULATION OF DAMAGE IN THERMOPLASTIC COMPOSITE MATERIALS Kevin Brown 1, Richard Brooks, Nicholas Warrior School of Mechanical, Materials and
THE TRANSVERSE OFF-AXIS STIFFNESS AND STRENGTH OF SOFTWOODS. Abstract
 THE TRANSVERSE OFF-AXIS STIFFNESS AND STRENGTH OF SOFTWOODS Carl S. Moden 1, Jessica Polycarpe 1 and Lars A. Berglund 2 1 Dept. of Aeronautical and Vehicle Engineering The Royal Institute of Technology
MESH MODELING OF ANGLE-PLY LAMINATED COMPOSITE PLATES FOR DNS AND IPSAP
 16 TH INTERNATIONAL CONFERENCE ON COMPOSITE MATERIALS MESH MODELING OF ANGLE-PLY LAMINATED COMPOSITE PLATES FOR DNS AND IPSAP Wanil Byun*, Seung Jo Kim*, Joris Wismans** *Seoul National University, Republic
ME 243. Mechanics of Solids
 ME 243 Mechanics of Solids Lecture 2: Stress and Strain Ahmad Shahedi Shakil Lecturer, Dept. of Mechanical Engg, BUET E-mail: sshakil@me.buet.ac.bd, shakil6791@gmail.com Website: teacher.buet.ac.bd/sshakil
DEVELOPMENT OF THERMOELASTIC STRESS ANALYSIS AS A NON-DESTRUCTIVE EVALUATION TOOL
 DEVELOPMENT OF THERMOELASTIC STRESS ANALYSIS AS A NON-DESTRUCTIVE EVALUATION TOOL S. Quinn*, R.K. Fruehmann and J.M. Dulieu-Barton School of Engineering Sciences University of Southampton Southampton SO17
PARTICLE SIZE EFFECT FROM MICRO TO NANO ON THE THERMAL AND MECHANICAL PROPERTIES OF POLYMER COMPOSITES
 Indian Institute of Technology Delhi (IITD), New Delhi, 2013 PARTICLE SIZE EFFECT FROM MICRO TO NANO ON THE THERMAL AND MECHANICAL PROPERTIES OF POLYMER COMPOSITES by: M.HOSSEIN ALAEI Department of Applied
Composite models 30 and 131: Ply types 0 and 8 calibration
 Model calibration Composite Bi-Phase models 30 and 3 for elastic, damage and failure PAM-CRASH material model 30 is for solid and 3 for multi-layered shell elements. Within these models different ply types
STRESS ANALYSIS OF BONDED JOINTS IN PULTRUDED GRP COMPONENTS
 16 TH INTERNATIONAL CONFERENCE ON COMPOSITE MATERIALS STRESS ANALYSIS OF BONDED JOINTS IN PULTRUDED GRP COMPONENTS S.W. Boyd*, J. M. Dulieu-Barton*, O. T. Thomsen**, A.Gherardi* [J.M. Dulieu-Barton]: janice@soton.ac.uk
SSRG International Journal of Mechanical Engineering (SSRG-IJME) volume1 issue5 September 2014
 volume1 issue5 September 2014") Finite Element Modeling for Delamination Analysis of Double Cantilever Beam Specimen Mohammed Waseem H.S. 1, Kiran Kumar N. 2 1 Post Graduate Student, 2 Asst. Professor Dept. of Mechanical Engineering,
Finite Element Modeling for Delamination Analysis of Double Cantilever Beam Specimen Mohammed Waseem H.S. 1, Kiran Kumar N. 2 1 Post Graduate Student, 2 Asst. Professor Dept. of Mechanical Engineering,
International Journal of Scientific & Engineering Research, Volume 5, Issue 1, January ISSN
 International Journal of Scientific & Engineering Research, Volume 5, Issue 1, January-214 29 An Experimental Analysis of Stress Relaxation in Nonwoven Fabrics Sajid Ahmed Qureshi ABSTRACT - The current
Finite element analysis of drilled holes in uni-directional composite laminates using failure theories
 American Journal of Science and Technology 2014; 1(3): 101-105 Published online May 30, 2014 (http://www.aascit.org/journal/ajst) Finite element analysis of drilled holes in uni-directional composite laminates