Behaviour of the Cold-formedTrapezoidal Sheet Overlap Jointin a Gerber Lapped Connection
|
|
|
- Arlene Ray
- 6 years ago
- Views:
Transcription
1 Behaviour of the Cold-formedTrapezoidal Sheet Overlap Jointin a Gerber Lapped Connection April Anne Acosta Sustainable Constructions under Natural Hazards and Catastrophic Events, master's level (60 credits) 2018 Luleå University of Technology Department of Civil, Environmental and Natural Resources Engineering
 Luleå University of Technology")
2 Behaviour of the Cold-formed Trapezoidal Sheet Overlap Joint in a Gerber Lapped Connection April Anne Acosta Masters Course in Sustainable Constructions under Natural Hazards and Catastrophic Events (SUSCOS) Luleå University of Technology 12/02/2018
3 ABSTRACT The behavior of the overlap joint in a cold-formed trapezoidal sheeting used for roof decking is studied in this research. A Gerber-type connection is used, where an overlap joint is introduced in the second span. This joint acts as a hinge of zero-moment to achieve balanced field and support moments. However, this type of joint is sensitive to collapse in the event of sheet failure at the internal support. Due to this problem, a variant of the Gerber joint with an increased overlap length is developed. At normal snow load conditions, the system acts as a Gerber system, transferring minimal moments at the hinge; while at the event of the sheet failure at mid-support, the system acts as a continuous beam and provides a post-elastic load bearing capacity, avoiding sudden collapse. Due to the thinness of the material, local buckling often occurs in cold-formed sections which can cause drastic loss of stiffness and capacity. This research is also investigating the effects of this loss of stiffness to the internal forces in the overlap joint. The research is carried out using theoretical, numerical, and experimental approaches. Full-scale experimental tests are performed to observe the behaviour and failure modes of the trapezoidal sheet for two different overlap lengths. Full-scale finite element models are also developed. These numerical models are used to perform parametric analysis on the varying stiffness at mid-support. The internal forces at the overlap joint are determined, and how these forces change with the stiffness at mid-support. Finally, the overlap joint is checked for structural adequacy under maximum stresses at the ultimate load. Keywords: cold-formed steel, roof decking, trapezoidal sheet, thin-walled, plastic analysis, trapezoidal sheet, Gerber system, roof collapse, FEA 2
4 ACKNOWLEDGMENT The research would have not been made possible without the engineering guidance of Jan-Christer Maeki of Lindab, who is generous enough to shower us with ideas and supervision. I thank also our adviser, Naveed Iqbal, who is instrumental to the conduct of the study and who always lets his door open to us. I would also like to thank the people who helped us in the setting up of the experiments especially Kenneth Palo of Lindab and Erik Andersson from the LTU Laboratory. Finally, I thank my family and friends who have been in constant support to me since the beginning. 3
5 TABLE OF CONTENTS 1 INTRODUCTION Background of the Study Gerber System Disadvantages of Gerber System Maeki System Elastic and Post-Elastic Conditions Objectives Significance Limitations Incidents of Roof Collapse Cold-formed Steel History and Trend in Construction Types of Cold-formed Sections Advantages of Cold-formed Steel Sections Buckling of Cold-formed Section Plastic Design Effective Section 21 2 ANALYTICAL STUDY Load Calculation Properties of Trapezoidal Sheeting Moment Distribution and Deflection in the Elastic Range Effective Section Design of Cold-formed Steel under Bending 31 3 EXPERIMENTAL STUDY Overview of the Experimental Study 33 4
6 3.2 Experimental Set-Up Force Applied Results of the Experiment Tests for 0.85 mm thick Tests for 1.00 mm thick Tests for 1.50 mm thick Analysis of Results Comparison of Maximum Load Comparison of Deflection Overlap Gap Opening Rotational Stiffness Reserve Capacity of the Sheet Overlap Joint under Residual Moment 71 4 NUMERICAL STUDY Overview of the Numerical Study Method of Analysis Finite Element Model Parts Mesh Assembly Interaction Step Load and Boundary Condition Analysis of Results Stress Results and Comparison Deflection Results and Comparison Different stiffness over mid-support Beam Model Model and Results Moment and shear distribution 101 5
7 5 CONCLUSIONS AND RECOMMENDATIONS BIBLIOGRAPHY 105 ANNEX A Reference Drawings A.1 Gross Properties of 0.85 mm Thick Trapezoidal Sheet 2 A.2 Gross Properties of 1.00 mm Thick Trapezoidal Sheet 3 A.3 Gross Properties of 1.25 mm Thick Trapezoidal Sheet 4 A.4 Gross Properties of 1.50 mm Thick Trapezoidal Sheet 5 A.5 Experimental Set-Up 1 6 A.6 Experimental Set-Up 2 7 A.7 Location of LVDT Sensors 8 ANNEX B Calculation Sheets B.1 Calculation of Loads for the Trapezoidal Sheeting 10 B.2 Properties of Trapezoidal Sheet 12 B.3 Moment Distribution and Deflection of Gerber Beam 16 B.4 Comparison of Moment Distribution 22 B.5 Effective Section Properties of 0.85mm Trapezoidal Sheet 25 B.6 Effective Section Properties of 1.00mm Trapezoidal Sheet 37 B.7 Ultimate Limit State Design of Trapezoidal Sheet 48 B.8 Ultimate Limit State Design of Overlap Joint 51 B.9 Stresses in the Cross-Section 56 6
8 1 INTRODUCTION 1.1 Background of the Study Gerber System Roof decking profiles can be installed in different ways. One of which is introducing a hinged connection in the span instead of the support as shown in Figure 1.1. The sheets overlap in the joint and are connected by screw fixings. This structural system is called a Gerber system. Figure 1.1. Gerber system in roof decking profiles (Höglund & Johansson, 2015) Popularized in the 1800s by Heinrich Gerber for use in bridges, the Gerber system has also been used in roof framings, roof panels, curtainwall frames, and slabs. Multi-span Gerber beams are statically determinate structures that are made up of one-span beams connected by hinges. Figure 1.2. Simplest form of Gerber-Semikolenov beams (Karnovsky & Lebed, 2010) In the design of continuous spans, the moments at the support are always higher than the field moment. In this case, the design of the members is governed by the support moment which is considered more critical. The Gerber system, on the other hand, allows moving the point of zero-moment, and as a result, the span and the support moments can be optimized. This manipulation of moments results to efficient material use, and therefore, the product becomes more economical and competitive. As shown in Figure 1.3, the maximum bending moment of the Gerber beam subjected to uniform loading is only 69% of the maximum moments of the single and continuous spans. The maximum moment of the single span is located at the midspan with zero moments at the supports, while the continuous beam has maximum moment at the support. The point of zero moment at the continuous beam is at 0.21L, where L is the length of one span. In the Gerber system, this contraflexure point may be relocated and positioned 7
9 so that the maximum moments for the field and support are equal. For a two-span beam, the optimized location of the hinge is at 0.17L, assuming the cross-section properties of the top and bottom flanges are equal. Figure 1.3. Moment distribution of single span, double span, and Gerber system To generate statically determinate beams, the Gerber system has the following conditions for the distribution of hinges in beams with simply supported ends: (Karnovsky & Lebed, 2010) a) Each span may contain no more than two hinges. b) Spans with two hinges must alternate with spans without hinges. c) Spans with one hinge may follow each other, providing that the first (or last) span has no hinges. d) One of support has to prevent movement in the horizontal direction. Figure 1.4. Distribution of hinges in a multi-span beam 8
10 1.1.2 Disadvantages of Gerber System The Gerber system in roofs is sensitive to collapse in case of sheet failure at the internal support. In many cases, it has been found to result in unacceptable large secondary damage after the occurrence of a local failure in the sheet (Höglund & Johansson, 2015). At the moment, the Gerber system has been deemed inefficient for use in roof systems. At the hinge location, there is no moment resistance and rotation is allowed. This causes a larger deflection at the joint compared, for example, to a continuous span without any hinge. This deflection could be even higher if the Gerber joint is subjected to uneven loading. With increasing loads, the sheet over the mid-support may initiate buckling leading to failure. Consequently, the overlap connection needs to resist additional moments that may be high enough for its capacity. Without enough overlap strength to secure the continuity of the span, the result can be total collapse of the system. Figure 1.5. Failure at the internal support causing collapse of the joint (Maeki, 2017) Progressive collapse is also critical for the Gerber system. In continuous Gerber beams, the sheet pieces are installed on top of the previous sheet. Once the first sheet collapses, the subsequent steel sheets can start to collapse in a domino effect even if the ultimate capacity is not yet reached. 9
11 Figure 1.6. Progressive collapse of a Gerber system (Sjölander & Tiderman, 2016) Maeki System To address the danger in sudden failure of the joint leading to total collapse of the system, a variant of the Gerber system called the Maeki system is studied in this research. Named after the pioneering engineer, Jan Christer Maeki, the design is modified to accommodate more deflection in the joint by increasing the overlap length and number of fixings in the overlap. These modifications to the joint are made to ensure the continuity of the beam after failure of the sheet at the mid-support, therefore increasing the ductility of the joint and the robustness of the entire system. Figure 1.7. The Maeki system (Maeki, 2017) The increased overlap length and adequate number of fixings can provide an additional load bearing capacity after failure. This post-failure capacity is very desirable to avoid sudden collapse of the roof decking, thereby increasing safety. Compared to the conventional Gerber system, the Maeki system can withstand additional deflection at the joint. This is important to convey warning for evacuation or to provide time to repair the joint in case of imminent failure. 10
12 1.1.4 Elastic and Post-Elastic Conditions Basically, the research is interested in both the elastic and post-elastic behaviour of the sheet. The study considers a two-span beam where an overlap joint is introduced in the second span. In the elastic stage, the overlap joint acts as a hinge to achieve a balanced field and support moments. Under normal snow loads, the sheets are not in contact with each other and the joint acts a pin where rotation is allowed. With the increasing loads, the sheet is expected to reach its load carrying capacity in the regions of the midspans and the mid-support where the moments are highest. After the sheet reaches its capacity in the midsupport, it undergoes a loss of stiffness and capacity. As a result, the sheets in the overlap joint gradually become in contact with each other as shown in Figure 1.8. With this interaction, the whole system becomes a continuous beam providing a higher post-failure load bearing capacity, avoiding sudden failure. To ensure this residual capacity of the joint, adequate number of fixings and overlap length are required. Figure 1.8. The beam before and after collapse at mid-support Cold-formed members have very limited plastic capacity, and elastic design is recommended in most cases. Because of the thinness of the material, the cold-formed sheet is prone to sectional buckling such as local and distortional buckling that leads to structural instability. With the appearance of these buckling modes, the sheet drastically loses stiffness. This loss of stiffness is exhibited in Figure 1.17 which shows comparison of the capacities of thick-walled and thin-walled cross-sections. The graph highlights the effect of local buckling to the stiffness of the material. 11
13 1.1.5 Objectives The general objective of the study is to understand the behaviour of the overlap joint in the elastic and post-elastic stages. This also entails the structural check of the joint under maximum stresses. The Gerber joint has been deemed inefficient because of the lack of reserve capacity after failure. Therefore, a variant of the Gerber joint called the Maeki joint is under study in this research. It is expected to observe an increase in ductility of the joint compared to the old Gerber system. The research also investigates the loss of stiffness of the sheet over the mid-support in a two-span beam. As the stiffness diminishes and the moment distribution changes, additional stresses are induced in the overlap joint. The study is interested in obtaining the shear and moments in the joint corresponding to different sheet stiffness in the mid-support. With the results obtained, it is aimed to structurally design the joint, which means checking the number of fixings and the overlap length. To achieve these objectives, theoretical, numerical and experimental studies are conducted. The numerical studies provide the parametric study of the varying stiffness of the sheet Significance The use of the Gerber joint leads to more efficient material use due to the balanced support and field moments. With this economic design, the metal costs are driven down, potentially increasing future savings which is mostly beneficial to the manufacturing companies. In addition, the researchers would like to understand better the post-elastic behaviour of the cold-formed trapezoidal sheet, and how the joint can be optimized and improved further. The variant of the Gerber joint, the Maeki joint, is designed structurally to reflect an increase in joint ductility and safety Limitations The study is focused only on two-span Gerber beams, with the hinge at the second span. The beam is subjected to uniform loading, and does not consider the uneven loading. The study also has a limitation in considering the effect of a continuous sheet in 3D, and assuming that the trapezoidal sheet acts as a beam in 2D. In the experiment, this limitation is addressed by attaching steel angles on each side to constrain the edge movement. The numerical model is assumed to have perfect geometry, and no imperfection is considered. In the structural checks, only the ultimate limit state is considered in the design. 12
14 1.2 Incidents of Roof Collapse In the Scandinavian winters of and , several roof collapses occurred across Sweden. Most of the cases were located in the south-west part of the country and few cases in the north. From January January 2011, 179 reported cases of collapsed roofs have been listed (Erfarenheter från takras i Sverige vintrarna 2009/10 och 2010/11, 2011). It is found that the snow loads experienced by the collapsed roofs are generally lower than the design load, and the roofs should have not failed under the snow loading. However, the investigations suggest that the collapses may have been due to the unevenly distributed snow caused by excessive snow drifting. Figure 1.9. Map showing the locations of the collapsed roofs (Erfarenheter från takras i Sverige vintrarna 2009/10 och 2010/11, 2011) The results of the investigation show that the failure of the collapsed roofs is caused by varied factors. These factors range from the manufacturing of materials to the construction work to the design and planning (Hansson, 2017). Some of the factors that affected the collapses are the listed as follows: Errors in the design, planning and execution Errors in material Flat roofs are more susceptible to damage Longer spans allow for more varied distribution of snow loads Age of the structure 13
15 Highly nonsymmetrical loading resulting to snow pockets Large difference in snow depth Lack of maintenance Among the listed cases, 37 cases were investigated in more detail. Ten (10) of these cases are using trapezoidal sheeting, and seven (7) of which are using the old Gerber system. It was evident that the system needed to be further investigated. In addition, some collapses have even occurred during the manual removal of the snow from the Gerber roofs. This happened because the Gerber beam is sensitive to uneven loading, and moving the snow even contributed to the failure. Strong winds and blockades in the surface can also cause the snow to accumulate in one part of the roof causing asymmetric distributed loads. Snow removal may be done safely by clearing the snow in the order in which the roof is installed (Höglund & Johansson, 2015). 1.3 Cold-formed Steel History and Trend in Construction The design of cold-formed steel profiles have always posed a challenge to designers because of its sensitivity to buckling which results to numerous failure modes that are not commonly found in the design of hot-rolled profiles. The advent of the use of cold-formed profiles in construction started in 1850s in United States and Great Britain. Until the 1940s, the utilization of the cold-formed steel is limited because there is no adequate design standard available. With the wide array of complex sizes and shapes of cold-formed profiles, it is also a challenge to devise a general design standard for all the occurring shapes. It wasn t until the recent years that the cold-formed sections gain popularity in construction, where it is even being used as the primary framing component. For example, lipped channel sections may be assembled back-to-back to provide a stronger profile and act as wall studs. In usual cases, cold-formed sections are used as secondary structural systems in roofs, walls, and floors; or may also be used for building envelopes. Another use of cold-formed steel that has widely gained popularity in recent years is profile decking, which is a basic component used in composite steel-concrete slabs. With the developing technology, coldformed steel sections are now being manufactured to have thicker sections and higher yield strength. (Dubina, Ungureanu, & Landolfo, 2012) 14


16 Figure Different shapes and sizes of cold-formed profiles (Dubina, Ungureanu, & Landolfo, 2012) Types of Cold-formed Sections The cold-forming process, which includes roll-forming and press braking, are applied to thin flat steel sheets to achieve varied shapes and sizes. There are two major types of cold-formed steel sections: 1. Structural framing members which include single open sections, open built-up sections or closed built-up sections. Figure Structural framing members (Dubina, Ungureanu, & Landolfo, 2012) 15
17 2. Panels and decks include profiled sheets and linear trays. Figure Panels and decks (Dubina, Ungureanu, & Landolfo, 2012) The edge and intermediate stiffening elements are necessary to add stiffness to the section. Stiffeners are of different forms as shown in the figure below. Figure Edge and intermediate stiffeners (Dubina, Ungureanu, & Landolfo, 2012) Advantages of Cold-formed Steel Sections The recent decades have seen the increasing use of cold-formed profiles. Cold-formed steel becomes more advantageous since steel has already the impressive carrying capacity for a structural material, and the use of cold-forming can help optimize the material. Aside from being efficient in stiffness and strength, the cold-formed steel offers a number of advantages for use in construction, some of which are listed below. Cold-formed profiles are very lightweight. Thin-walled sections normally have thickness of less than 3mm. The strength to weight ratio is high which translates to cost efficiency in terms of material use. It is also ideal for use in conditions with relatively lights loads, and may form a built-up section to satisfy higher loads. Complex forms and shapes may be produced using cold-forming compared to the hot-rolled process. Cold-formed profiles usually have stiffening elements to increase stiffness and prevent 16
18 buckling of the flanges or the webs. The forming process can allow more detailing in the profile, or allow the engineers to design more unusual sections that can be optimized for a specific purpose. It is manufactured rather easily and may even be done on-site. Galvanized steel coils, coated with zinc or aluminum/zinc coatings, are formed into thin-walled sections by cold-forming process. At relatively low temperatures, these profiles are formed using roll forming or folding and press braking. The process of cold-forming has an increasing effect in the yield strength of the material, specifically in the zones of folds and bends. Cold-formed profiles are easy to transport, store, assemble, and install. The construction is completed faster with fewer wastes, with a lead time can translate to financial savings. The sections can be stacked on top of each other which provide ease in transportation, and the compact packaging consumes less space for storage. It is usually galvanized; making it weatherproof and corrosion-resistant giving longer design life for the structure. It is not sensitive to moisture, and does not rot and attract insects unlike timber. Also, it is not sensitive to time-dependent behaviour like shrinking and creeping unlike concrete. Steel is the most recycled material. Being recyclable makes it a sustainable choice for construction. Sections may be fire-protected using plaster boards with fire resistance. Panels and decks can be used to resist in-plane loads, acting as a shear diaphragm. In addition, these sections allow for the passing of conduits Buckling of Cold-formed Section Structural instability of cold-formed sections occurs due to the thinness of the material. There are four general types of buckling that a steel section may be subjected to: local, global, distortional, and shear. Shown in Figure 1.14 are the different buckling modes that can occur for a lipped channel subjected to compression. The figure exhibits sectional and global buckling modes for different buckling lengths, and how these types of buckling interact with each other resulting to more complex coupled modes. 17
 a) local (L) b) distortional (D) c) flexural (F) d) flexural-torsional (FT)")

19 Figure Buckling modes for a lipped channel in compression (Dubina, Ungureanu, & Landolfo, 2012) a) local (L) b) distortional (D) c) flexural (F) d) flexural-torsional (FT) e) L + D f) F + L g) F + D h) FT + L i) FT + D j) F + FT Local buckling is a form of short wavelength buckling that appears in the local plate element. Distortional buckling is also a form of buckling of the cross-section. The global buckling considers the buckling along the length of the member, in this case is the flexural and the flexural-torsional buckling for columns, and lateral-torsional buckling for beams. Below is a graph of the wavelength against the buckling stress which 18
20 shows that the wavelength of the distortional buckling is generally in between of the local and global buckling. Figure 1.15 Elastic critical stress of different buckling modes (EN ) Figure 1.16 below displays the relationship of the member length to the increasing load, and the occurrence of the buckling modes. The graph provides a clear idea of the hierarchy of the buckling modes depending on the load applied and the buckling length. Shown in the dashed lines are the theoretical elastic buckling curves, and solid curves represent buckling resistances. The graph shows how shorter members are prone to sectional buckling, such as local and distortional buckling modes, and the overall buckling is more prevalent for longer members. Figure Elastic critical stresses and resistances as a function of member length (EN ) To further emphasize the effect of the local buckling to the total load-carrying capacity of the cold-formed section, shown in Figure 1.17 are two graphs comparing the behaviour of the thick-walled and thin-walled members in compression. It is observable that both the graphs did not achieve the critical load N cr. The 19
21 thick-walled bar reaches first yield at B, and started to depart from the elastic line and enters the plastic range. The ultimate capacity is achieved at C, and the curve asymptotically reached the rigid plastic curve until failure. This goes the same for the thin-walled member, but instead it departs from the elastic line at an earlier point at L. The local plastic mechanism occurs at C which is also the ultimate capacity of the member. The graph goes down parallel to the rigid plastic line up until its total rupture at D. The theoretical rigid-plastic curve defines the limit of the load-carrying capacity of the member. The occurrence of the sectional buckling does not result to failure right away since it is characterized by a stable post-critical path, but instead, the material significantly lose stiffness. It is evident that the thin-walled member has significantly lower plastic reserve. This is mainly due to the local plastic mechanism that causes a significant drop in the stiffness of the material, thereby limiting its post-buckling load bearing capacity. Figure Behaviour of (a) slender thick-walled and (b) thin-walled compression bar (Dubina, Ungureanu, & Landolfo, 2012) Plastic Design Even if the steel is a known ductile material and allows for plastic redistribution of stresses, the design for cold-formed steel is usually based in the elastic region only because of the slenderness of the elements. In hot-rolled steel design, the plastic capacity may be utilized depending on the class of the section, however, the cold-formed steel profiles are mostly governed by local buckling which limits its capacity, and results to limited inelastic reserve. 20
22 Class 4 sections, where thin-walled sections are generally classified, have to consider the effect of the local buckling to its plastic capacity. The flat plate of the webs or the flanges may start to buckle at stress levels below the yield point. Plates are known to have a stable post-critical behaviour which means that even if the section has reached the local buckling stress, it may still continue to resist additional loads Effective Section The effective width of a plate in compression dictates its carrying capacity. Figure 1.18a shows the actual load distribution in a plate subjected to compression. The region of the plate that is closer to the edges carries a larger portion of the load compared to the central portion of the plate element. The real distribution of the stresses in the cross-section is non-uniform and therefore difficult to determine. To simplify this assumption, the maximum stresses are assumed to act uniformly on the two side strips at the edges of the plate, leaving the central region unstressed as shown in Figure 1.18b. a) Actual stress distribution b) Simplified stress distribution over effective width Figure Effective width concept (Design Procedures for Sheeting) The prevalence of local buckling in thin-walled sections is considered in design by using the effective section instead of the gross section of the member. In obtaining the effective cross-section, it is important to know which elements are subjected to compression since local buckling will occur in these plate elements. The part of the section that has buckled will be removed from the entire section, and therefore resulting to a reduced cross-section. For elements in tension, the full section is used. A comparison of the effect of using the effective section with the gross section is shown in Figure The graph for the effective section clearly has lower load-carrying capacity because of the erosion due to 21
23 imperfections and the local buckling effect. Figure Effect of local buckling on the member capacity (Dubina, Ungureanu, & Landolfo, 2012) Figure 1.20 shows a sample of a reduced cross-section of a member in bending, where the top part of the neutral axis is under compression. There are several flat plates that are candidates for the reduction of the cross-section, both in the webs and the flanges. The sections are considered effective if they are adjacent to the corners and bends, or next to intermediate stiffeners as in the webs. Figure Example of reduced cross-section 22
24 2 ANALYTICAL STUDY 2.1 Load Calculation Applied Loads The roof decking is generally subjected to dead, snow, wind, and maintenance loads. For the purpose of this study, only the effects of self-weight and snow loads are considered. The snow load depends largely on the shape of the roof, whether the shape will allow accumulation of the snow. Accidental load is also calculated. The entire system must be able to carry the loads in the accidental stage after an initial failure has occurred. The self-weight of the profiled sheeting is obtained from the technical manual of LHP 200. For each thickness, the value of the load is computed. The main variable load used is the snow loads. The snow actions applied is calculated based on EN 1994 and EKS 10. The characteristic value for the ground snow load is 3 kpa. Exposure and thermal coefficients are assumed to be 1.0. In addition, the snow load shape coefficient which is higher when the surface is flat, is assumed as 0.8. The calculation is presented in Annex B.1. Load Combinations The load combination for the ultimate limit state is based on EN 1990 using the equation: Eq. 2.1 In addition to the equation, a safety factor of 0.91 is used which correspond to the safety class 2. The accidental load combination that is applied to the structure in the post-failure stage is based on the EN 1990 equation: Eq. 2.2 The complete calculation for the loads is presented in Annex B.1. Below is the summary of the calculated loads for the different thicknesses of the sheet: 23


25 Thickness (mm) Permanent Load (kpa) Snow Load (kpa) ULS (kpa) ALC (kpa) Table 2.1 Summary of the calculated loads 2.2 Properties of Trapezoidal Sheeting The trapezoidal sheet to be studied, the LHP 200, is used for structural decking for insulated roofs. It is a galvanized steel sheet with hot-dip zinc coating and is available in varying thicknesses: 0.85mm, 1.00mm, 1.25mm, and 1.50mm. This self-supporting steel sheet is optimized for use in arenas and other large buildings. The profile also has good acoustic properties compared to other products in the same category. Figure 2.1. LHP 200 in IFU Arena in Uppsala, Sweden ( Shown below are the gross dimensions of a single trapezoid, measured using its midline. Figure 2.2. Dimensional properties of LHP
26 Tabulated below are the gross dimensional properties of the sheet with different thicknesses. These values were gathered from Annexes A.1 to A.4. Thickness (mm) Area (mm 2 ) Moment of Inertia (mm 4 ) Distance of neutral axis to top flange (mm) Distance of neutral axis to bottom flange (mm) Table 2.2. Gross cross-section properties The calculation presented in Annex B.2 involves computation of the plastic strain to be used in the numerical model. Also presented are the gross dimensions of a single sheet, including areas and moments of inertia for the different thicknesses. The design moment and shear capacities obtained from the technical manual are also shown. Listed below are the characteristic material properties of the trapezoidal sheet obtained from the technical manual. The ultimate strength is obtained from a previous study of the LHP200 (Cardenas, 2017). The thickness used in the analyses is the nominal thickness. Thickness (mm) Modulus of elasticity (GPa) 210 Yield Strength (MPa) Ultimate Strength (MPa) 760 Poisson s ratio 0.3 Table 2.3. Material properties for different thicknesses For the plastic properties of the material, the use of bilinear material properties with linear strain hardening from EN is employed in the model. Figure 2.3. Assumption for the plastic property of the sheet 25
27 2.3 Moment Distribution and Deflection in the Elastic Range When a prismatic beam is subjected to pure bending and bent into an arc of circle, within the elastic range, the curvature of the neutral surface is Eq. 2.3 where M is the bending moment, E is the modulus of elasticity and I is the moment of inertia along the bending axis. The expression permits the determination of the elastic curve, or the deformed shape of the beam, by doing two successive integrations. The deflection at any point may be determined using this second-order linear differential equation: Eq. 2.4 In the elastic stage, moment distribution and elastic curve can be obtained by analytical computation because of its statical determinacy. The two-span Gerber beam is broken down to a cantilever with an overhang for the left beam, and a simply supported beam in the right. Figure 2.4. Representation of the two-span Gerber beam (Karnovsky & Lebed, 2010) After the computation of the support reactions, the shear and moment diagrams are generated by use of singularity functions. The maximum values and their locations are obtained. The pre-failure stage allows for the Gerber system to be active. The premise that the moment at the joint is zero provides a necessary boundary condition for the calculation. The location of the hinge is computed to be at 0.21L when the design moment capacities at the support and the span are equal, considering the difference in the properties of the top and bottom flanges. After the moment equation has been established, the rotation and deflection equations are also derived and presented with graphs. The load is assumed to be uniformly distributed. The sheet of thickness 1.00mm is used computation of rotation and deflection. 26
28 a) Loading condition b) Shear Diagram c) Moment Diagram 27
29 d) Slope diagram e) Deflection Diagram Figure 2.5 Two-span Gerber system with uniform loading Further into the calculation is the derivation of the moment distribution for continuous beam and single span for the purpose of comparison. The result is a graph that compares the maximum moments at the support and the span of the different structural systems. The graph below proves that the Gerber system is an efficient system with regard to material use. The complete calculations are presented in Annexes B.3 and B.4. 28

30 Figure 2.6. Comparison of bending moment diagrams for Gerber, double span, and single span 2.4 Effective Section To consider the occurrence of the local buckling in the cross-section, Class 4 cross-sections need to be reduced. To reduce the cross-section, it is important to identify which parts of the member are under compression and tension. The research is concerned on the steel sheet over the mid-support, therefore looking at Figure 2.7, it is seen that the bottom flange (narrow flange) is in compression and the top flange (wide flange) is in tension at this location. This inverse is true for the spans, where the top is in compression and the bottom is in tension. Elements in tension need not to be reduced. Note that this stress configuration is valid only for a specific loading condition, which in this case are distributed snow loads. Figure 2.7. Regions in compression and tension For the purpose of computing the effective section and comparing with the values from the technical manual, the narrow flange section is considered in the calculation. The effective section calculation is based on EN
31 Figure 2.8. Effective cross-section computed as per Eurocode The sheets of thickness of 0.85mm and 1.00mm are used in the calculation example presented in Annexes B.5 and B.6. In the computation, it is assumed that the material is concentrated in the midline of the section and the corners are replaced by the intersections of flat elements. The elements in compression consist of a part of the web and the bottom flange. First, the flange is checked for local buckling. The check involves computation for the critical buckling stress of the central flange stiffener. The results show that the bottom flange is a fully effective section. Same with the flange computation, the critical buckling stress for the web intermediate stiffener needs to be calculated. The calculation for the web, on the other hand, shows that the web needs to be reduced. Since the web and flange both have intermediate stiffeners, the interaction between the distortional buckling of the stiffeners should also be considered. This is done by using a modified elastic critical stress for both types of stiffeners. The neutral axis is recalculated and updated for the reduced section. Values from the gross cross-section and the technical manual are compared with the effective section properties. It shows that the effective section corresponds to less design moment resistance compared to the moment capacity listed in the manual. Effective Section Technical Manual Gross Section Area (mm 2 ) Moment of inertia (mm 4 ) Section modulus (mm 3 ) Design moment resistance (kn-m) Table 2.4. Comparison of effective section properties for 0.85mm thick sheet Effective Section Technical Manual Gross Section Area (mm 2 ) Moment of inertia (mm 4 ) Section modulus (mm 3 ) Design moment resistance (kn-m) Table 2.5. Comparison of effective section properties for 1.00 mm thick sheet 30
32 2.5 Design of Cold-formed Steel under Bending Failure Modes At the support location, the bottom of the sheet is under compression while the top part is subjected to tension. The region in tension can fail in tension yielding with the maximum elastic load of 420 MPa. More complicated is the behaviour of the elements in compression. These elements are prone to buckling but there are stiffening elements both in the web and in the bottom flange to increase the capacity against buckling. During the calculation of the effective section, the critical stresses for these elements are computed. From the calculation of the 1.00mm thick sheet, the critical stress of the web is MPa, and for the bottom flange is MPa. These values suggest that the bottom flange is 5.4 times more resistant to buckling than the web, and naturally, the web will buckle first. This buckling of the web is observed in the experimental study presented in Chapter 3. The modified critical stress considering distortional buckling is MPa. Figure 2.9. Tension and compression in the cross-section Design Thin-walled sections are usually classified as Class 3 and Class 4 cross-sections. These slender crosssections are characterized by the local buckling limiting the moment resistance of the section. The sections buckle at stress levels less than the yield point of the material. Due to this phenomenon, Class 4 sections have reduced post-elastic strength compared to the other section class as shown in Figure
33 Figure Cross-section behaviour classes (Dubina, Ungureanu, & Landolfo, 2012) Web crippling is also a phenomenon in thin-walled sections where loads are concentrated at a point, compressing the web. For cold-formed sections, the depth-to-thickness ratio is usually large and some webs have inclination that adds to the web crippling. For this case, web crippling is addressed by not fixing the bottom flange to the support, only the top flange. Cold-formed members also usually have low torsional rigidity, but profiled sheeting do not undergo this torsional failure mode. The design requirement for cold-formed steel is provided in EN The design value of the bending moment should satisfy the following: Eq. 2.5 where is the design internal moment for ultimate limit state and is the design moment resistance. The moment resistance of a cross-section about the bending axis should be obtained from: Eq. 2.6 where is the effective section modulus and is the basic yield strength. The calculation for the design of the cold-formed trapezoidal sheet is presented in Annex B.7. 32
34 3 EXPERIMENTAL STUDY 3.1 Overview of the Experimental Study Complex and unusual shapes can be formed with the cold-forming process, where some aspects may not be covered by the design standards. The behaviour of the material, specifically in the post-elastic range, cannot be determined by analytical computations alone. In this case, design codes permit the use of testing procedures to validate the structural adequacy of the member. One of the primary objectives of the experimental study is to determine the reserve capacity of the sheet. From the experimental results, the effect of the overlap length with the post-elastic load bearing capacity of the joint can be established. The behaviour of the material, specifically in the post-elastic range, cannot be determined by analytical computations alone, therefore the experimentation is necessary. The postelastic rotational stiffness of the mid-support is also derived experimentally. This provides information on the loss of stiffness of the sheet in the plastic range. The structural integrity of the overlap joint is also observed from the series of tests. Finally, a visual inspection of the failed sheet can give insights on the possible mode of failures. This experiment aims to study closely the resistance of the bottom flange in the mid-support which is subjected to compression. The top flange only acts as a bridge to the narrow flange profiles and its resistance is not significant to this research. Full scale tests were conducted in the Steel Structures Laboratory of Luleå University of Technology. The materials were provided by Lindab. Three thicknesses of the sheet were tested, where there are two setups per thickness for a total of six set-ups. Set-up 1 has 500 mm overlap length while Set-up 2 has 100 mm overlap length. 33
35 Experimental Study 0.85 mm 1.00 mm 1.50 mm Set-Up 1 Set-Up 2 Set-Up 1 Set-Up 2 Set-Up 1 Set-Up 2 Table 3.1 Number of experimental set-ups The first set-up mainly concerns the behaviour of the overlap joint connection until total collapse of the system. It is desired to design a connection that has a capacity to resist additional moments due to collapse of sheet at mid-support. For the first set-up, the behavior of the joint is observed, as well as the post-buckling reserve capacity of the whole system. Moreover, the second set-up is performed to determine the reserve capacity of the sheet after buckling at the internal support. For this experimental study, tensile tests were not performed on the samples pieces of the steel sheet to verify the properties of the samples. In this case, the nominal values of the thickness and the mechanical properties such as the yield strength are assumed in the analyses. The expected failure mechanisms in the experiment are presented in Figure 3.1, where it shows the plastic mechanism for Set-up 1 and Set-up 2. For the Set-up 1, the plastic hinges are formed at the support and the mid-span. This happens because of the redistribution of stresses in the mid-span after the capacity at the support has been reached. The redistribution is possible because the overlap joint refrains from acting as a hinge, instead it acts to bridge the sheets together and make a continuous beam. This is not the expected failure for the Set-up 2. In the Set-up 2, the overlap hinge, due to lack of overlap length, will remain a hinge throughout the experiment. This means that after the appearance of plastic hinges in the support, there will be a global failure in the system. The Gerber joint allows more deflection compared to the Maeki joint. This gives the Maeki system a higher load- bearing capacity and a ductile failure. 34


36 Figure 3.1 Formation of plastic hinges in Test Set-up 1 and Test Set-up Experimental Set-Up The entire experiment is composed of six full scale tests. The figure below shows the different components of the experiment for a single set-up: Figure 3.2. Components of the set-up: trapezoidal sheet, timber blocks for load application, support cleats, steel angle ties and self-drilling screws 35
37 Each set-up is composed of two spans, where each span is measuring 6 m for a total length of 12 m per set-up. Loads are applied on 4 points along the beam. The loads are originating from a single point, and distributed using series of loading steel beams. As mentioned, there are two set-ups for each thickness. Set-up 1 has 500 mm overlap length, and has an additional deflection sensor to measure the gap in the overlap, while Set-up 2 has only 100 mm overlap length. Everything else is kept constant. Figure 3.3. Set-up 1 and Set-up 2 As shown in the figures above, the hinge joint is located at 0.22L in the second span. This value is used in the experiment, and not the theoretical value of 0.17L, because the theoretical value was obtained assuming that properties of the sheet at support and the span are the same. Updating these values considering an unequal moment capacities from the technical manual, a value of 0.212L is derived. This value when used, however, will reach both the support and span moment capacities at the same time. And since it is preferred for the support moment to govern and the sheet to fail at the support, the value used in the experiment is rounded up to 0.22L. The profile used for the set-up is one full trapezoid, with half trapezoids attached on each side by fixing their bottom flanges. The fixings at the narrow flange are at 500 mm distance on centers. However, in the support location, the narrow flange is subjected to compression. In this location, the fixing distance is reduced to 250 mm to lessen the buckling length at the bottom of the section. 36


38 Figure 3.4. Trapezoidal profile for the experiment For the support, the sheets are fixed to the 150-mm long support cleats at the ends and at the mid-support. There are two fixings each top flange to the cleat. The bottom flange is not fixed to the support to prevent web crippling. Steel angles are used as ties in the longitudinal and transverse directions to prevent the sheet from spreading and to keep the edges straight. Figure 3.5. Support cleats The timber blocks are used to apply the loads to the sheet. For each load applicator, two 75-mm long blocks are in contact with the sheet. The load goes directly to the bottom flange. The load is applied at a rate of 2mm/min until the sheet exhibits collapse or can no longer hold the loads being applied. On each side of the timber block is a trapezoidal transverse blocks to prevent it from tilting, see Figure 3.6. Figure 3.6. Timber blocks in position 37

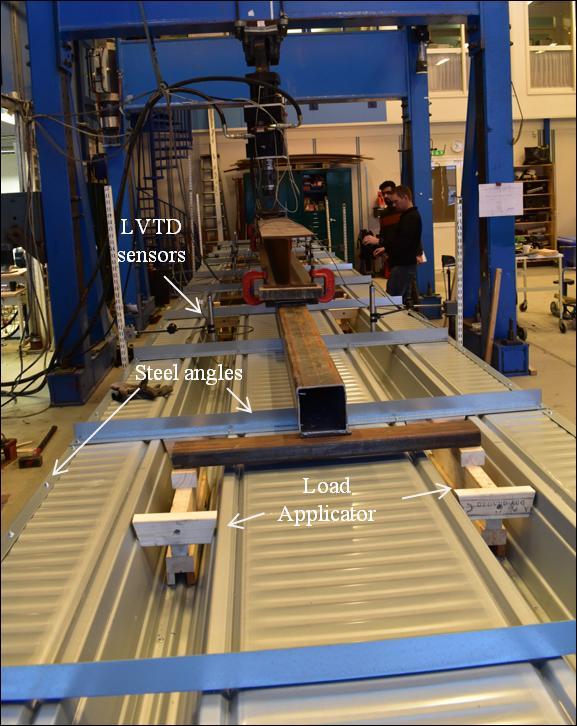
39 The overlap joint is fixed using three screws, two on the sides and one on top, see Figure 3.7. This configuration is assumed to act as a hinge and allow rotation in the elastic stage. Figure 3.7. Overlap fixing The LVDT sensors are used to measure the deflection at different points in the beam shown in Figure 3.8. Sensors are put in the middle of each span, and additional sensors are placed in the overlap. Most of the sensors are intended to measure the global displacements at specific points. The sensor is attached to a steel post which allows it to measure the displacement with respect to the unmoving post. For the Set-up 1, there is an additional sensor right on the end of the overlap to measure the relative movement between the two sheets in the overlap. This sensor can measure the local deflection or the gap opening of the overlap. The opening of the overlap is of interest because large deflection may apply pressure on the insulation to be placed above the sheet. The sensor is placed in the center of a 260mm steel plate to get the average displacements between two points in each side of the flange. In Figure 3.9, the locations of all the LVDT sensors are shown. LVDTs 2-1 and 2-2 measure the local displacements. 38


40 a) Local displacement in the gap b) Global displacement in the overlap Figure 3.8. Measuring local and global displacements Figure 3.9. Location of the LVDT sensors Figure 3.10 shows the complete set-up for the experiment before load is applied, where the location of the loads are indicated, as well as the spans. 39

41 Figure 3.10 Complete experimental set-up 40
42 3.3 Force Applied To obtain the force to be applied on the sheet, the theoretical moment distributions are obtained. The supports are assumed to be pinned, and the hinge allows full rotation. The figures below show the moment distribution, as well as shear distribution for the 0.85mm sheet. The load applied corresponds to the maximum moment capacity of the sheet at mid-support. The load is applied at 2 points every quarter point in the beam, representing the timber blocks in contact with the sheet. a) Load application b) Moment distribution c) Shear distribution Figure Load application, moment, and shear for experimental configuration Table 3.2 summarizes the amount of load to be applied in the full scale tests for the different thicknesses. The load corresponds to the design moment resistance of the narrow flange from the technical manual. The design resistances are listed below considering a width of 800 mm for one profile. The final column corresponds to the total load applied by the hydraulic machine to the system that theoretically represents the maximum design moment resistance of the section. Note that there are two narrow flange profiles in the experiment set-up. The design moment resistance for the wide flange (field span) is also tabulated on Table 3.3 for reference. 41

 Thickness (mm) Design Moment Resistance Total Load until Design of Wide Flange (kn-m)")
43 Thickness (mm) Design Moment Resistance Total Load until Design of Narrow Flange (kn-m) Moment Resistance (kn) Table 3.2. Load applied to achieve maximum moment capacity of sheet (narrow flange, one profile) Thickness (mm) Design Moment Resistance Total Load until Design of Wide Flange (kn-m) Moment Resistance (kn) Table 3.3. Load applied to achieve maximum moment capacity of sheet (wide flange, one profile) 3.4 Results of the Experiment Tests for 0.85 mm thick 0.85mm - Set-Up 1 The test underwent a premature failure due to the misalignment of the applied load. The loading beam is tilted more on one side causing failure of the loading timber blocks. The experiment was terminated before reaching the total collapse of the system. However, before the experiment ended, local buckling has appeared in the sheets in the mid-support and span near the loading point. a) Buckling at support b) Failure of the loading timber blocks Figure Failure of the 0.85mm Test Set-up 1 42
44 The force applied to the whole system is plotted and presented in Figure The plot shows a linear load applied until a maximum load of 58.3 kn. Afterwhich, there is a slight decrease of load in the system corresponding to the occurrence of the local buckling, and then the system recovers again. The forcedeflection graphs of each LVDT points are also presented in Figure Refer to Figure 3.9 for the location of the LVDT sensors along the beam. Figure Force-Time graph 0.85mm Test Set-up 1 Figure Force-Deflection graph of all LVDT sensors 0.85mm Test Set-up 1 43


45 0.85mm - Set-Up 2 The sheet at the mid-support completely buckled and the 100-mm overlap joint collapsed for this test. Looking at the failure, it can be seen that the screws at the overlap connection have excessively stretched the holes, corresponding to a bearing failure. The fixings on the overlap as well as the screw at the bottom flange have failed in pull-out. 44


46 Figure Failure of 0.85mm Test Set-up 2 Since this is the thinnest sheet, it is expected to be more difficult to predict its behaviour at failure because of the early appearance of buckling. The sudden failure of the sheet exhibits how the local buckling can affect the overall capacity of the section. The buckling is initiated in the support and consequently, the global failure follows. It is important to note that the mid-span has not yet reached the full elastic capacity before the total collapse at the mid-support. Figure 3.16 shows the load resisted by the sheet through the course of the experiment. It is clear that there is a linear relationship until the sheet experiences collapse at maximum load of kn. The sheet and the joint together exhibited a brittle failure which is reflected by the sudden drop in the load after reaching its peak. Figure Force-Time graph 0.85mm Test Set-up 2 45
47 Figure Force-Deflection graph of all LVDT sensors 0.85mm Test Set-up 2 Figure 3.17 shows the deflection plot for all the sensors. It is observed in this plot that the LVDTs 1-3 and 2-3 underwent an excessive deflection compared to the other points in the beam. The LVDT 1-3 is at the overlap location while 2-3 is at the mid-span of the collapsed side Tests for 1.00 mm thick 1.00mm - Set-Up 1 For this test, the failure is initiated on one side in the mid-support. It was then followed by buckling at the mid-span of the second beam. This buckled section is located at 775mm from the mid-span and right before the load applicator. Maximum load applied to the system is kn. The overlap joint remains intact. It is observed that the buckling in the support occurred in the web. Meanwhile, the buckling in the span occurred in the top region of the profile. 46


48 Figure Failure of 1.00mm Test Set-up 1 Several peaks and downward curves are recorded on the force-time graph on Figure These peaks correspond to the appearance of the buckling on one either side of the sheet. After the first peak, the plot goes down signaling a loss of stress measured by strain gauge. The plot recovers and steadily increases again showing that the system, even if one side has buckled, can still carry more loads. The last peak corresponds to the total collapse of the system where a plastic mechanism has already been formed due to the appearance of the buckling at the support and mid-span. At this time, the system can no longer carry additional load and therefore the plot goes down to zero. This failure shows a clear manifestation of plastic redistribution along the beam. The areas of the support and the mid-span reached their plastic capacities before total collapse of the whole system. Also, it is observable that the overlap joint ceased to act as a hinge and instead provided continuity on the sheet. 47
49 Figure Force-Time graph 1.00mm Test Set-up 1 Figure Force-Deflection graph of all LVDT sensors 1.00mm Test Set-up mm - Set-Up 2 Same with the Test Set-up 1, the Set-Up 2 force-time plot shows a series of peaks indicating that there are series of buckling that has occurred. For this test, the first buckling occurred on the web at one side of the mid-support, followed by the buckling on the other side. Finally, total collapse of the system was 48


50 achieved when both of the sides have failed. The hinge on the 100mm overlap joint together with the introduction of the plastic hinges at the support led to total collapse. This phenomenon is not observed with the Test Set-up 1, where there is a redistribution of stresses in the support and mid-span. The maximum load is at kn, and the overlap joint remains intact. Figure Failure of 1.00mm Test Set-up 2 In the graph below, Point A is the point of the maximum loading applied to the system before it undergoes instability, which is the buckling of one side at the mid-support. The graph highlights the reserve capacity of the sheet represented by the drop at Point B and increase of load to Point C, where the second buckling of the other side of the mid-support occurred. After the both sides have buckled, there is 49
51 ultimate collapse of the system. A video is uploaded at showing the total collapse of the sheet. Figure Force-Time graph 1.00mm Test Set-up 2 Figure Force-Deflection graph of all LVDT sensors 1.00mm Test Set-up 2 50


52 3.4.3 Tests for 1.50 mm thick 1.50mm - Set-Up 1 The collapse of the system is not achieved in the Set-up 1. The maximum load/ stroke that the hydraulic machine can apply has been applied and only web buckling at the mid-support occurred, and not the ultimate failure. Under the high loads, the support cleats have also buckled, which is not expected in the test. The maximum load applied to the system is kn. Figure Failure of 1.50mm Test Set-up 1 The force-time plot shows a linear increase. The deviation from linearity signals an occurrence of buckling. However, the system exhibited a steady load carrying capacity and shows a plateau at the kn range. Afterwhich, the test is terminated because the maximum load that can be applied by the machine has been reached. 51
53 Figure Force-Time graph 1.50mm Test Set-up 1 Figure Force-Deflection graph of all LVDT sensors 1.50mm Test Set-up 1 52


54 1.50mm - Set-Up 2 At the end of the test, buckling occurred for both profiles in the mid-support. For this case, both the web and the bottom flange exceeded their critical stress. The total collapse followed, after the plastic mechanism has been formed. The mechanism consisted of the hinge at the overlap joint and the hinge at the support. For this test, the support cleats have also buckled. The maximum load applied is kN, and the joint remains intact. Figure Failure of 1.50mm Test Set-up 2 53
55 The plot shows a series of peaks corresponding to the appearance of instabilities in the system. Even the sheet has buckled, it can still carry additional load until total collapse. Figure Force-Time graph 1.50mm Test Set-up 2 Figure Force-Deflection graph of all LVDT sensors 1.50mm Test Set-up 2 54
56 3.5 Analysis of Results Comparison of Maximum Load Shown below are the comparisons of the force-time plot for each thickness. Test Set-up 1 is compared with Test Set-up 2 for each thickness to determine if there is a notable difference in the load carrying capacity of the sheet after the overlap length is reduced. The last plot shows the force-time plots of all the thicknesses for a better view of the maximum loads that each sheet can carry. a) Comparison of 0.85mm thick sheet 55
57 b) Comparison of 01.00mm thick sheet c) Comparison of 1.50mm thick sheet 56
58 d) Comparison of all thicknesses Figure Comparison of the force-time plots of different thicknesses The graph shows that the maximum loads are highest for the 1.50mm, which is the thickest sheet, and lowest for the 0.85mm thick sheet. In general, the failure of the 0.85mm thick sheet was more unpredictable compared to the thicker sheets. This is due to the early appearance of buckling in the sheet and failure of the timber blocks. In the linear plot of the graph, the sheets behave very similar, and the difference starts as they reach the peak loads. It is observed that the Set-up 1 (represented by solid lines), the one with the 500mm overlap length, has generally carried a larger amount of load judging by the area under the curve compared to the Set-up 2 (dashed lines), the system with only 100mm overlap. It is also observed that the peaks or the maximum loads were higher for Set-Up 1. 57
59 Tabulated below is the computation for the additional capacity of the sheets based on the design capacities in the technical manual. The critical section is the mid-support, and in this case, the design capacity at the mid-support is considered for the table below Thickness Load until Design Moment Resistance (kn) Maximum Applied Load (kn) % Additional Capacity Set-Up Set-Up Set-Up Set-Up Set-Up Set-Up Table 3.4. Comparison of the maximum load applied with the capacity from the technical manual The maximum values of the load applied are all higher than the design moment capacity found in the technical manual. These results are found to be very agreeable regardless of the different configurations of the overlap lengths. The additional capacity is ranging from 1% to 24%. The results suggest that all the sheets tested worked very well according to their design capacities. There is also a noticeable difference on the sheet capacities between Set-up 1 and Set-up 2. For the 1.00mm and the 1.50mm thick sheet, the Set-up 1 with the 500mm overlap length has clearly resisted higher loads than the Set-up 2 with 100mm overlap. It is important to note that the test for the 0.85mm thick sheet was terminated before it reached total collapse, and therefore the maximum applied load of 58.3 kn is not the ultimate capacity. The 1.00mm Set-up 1 carried kn more than the Set-up 2, meanwhile the 1.50mm Set-up 1 carried 9.68 kn more. This affirms the concept of the Maeki system that the capacity of the whole system can be improved by increasing the length of the lapped connection. As for the failure modes at the maximum loads, all of the specimens exhibited web buckling at the midsupport. Stronger profiles such as the 1.50mm thick sheet also underwent buckling of the bottom flange. The overlap joint of 500mm was structurally intact under the maximum load. As mentioned in the Section 3.4.2, the Set-up 2 is observed to allow more rotation on the hinge. This causes a plastic mechanism to be achieved once the sheet at the mid-support has buckled. On the other hand, the Set-up 1 acts as a continuous beam after the sheet failure at mid-support leading to a redistribution of the stresses. This means that as the sheet at the support fails, the system does not totally collapse. Instead, the loads are transferred to the span, and it is possible because the overlap joint is no longer acting as a hinge. This is observed when the mid-span failed in the Set-up 1 but not in Set-up 2. 58


60 . Figure Global mechanism for Test Set-up 1, 1.00mm thick sheet Figure Global mechanism for Test Set-up 2, 1.00mm thick sheet 59
61 3.5.2 Comparison of Deflection The deflection of the beam in the elastic range is compared with the derived calculated values for the deflection. The analytical result assumes that the hinge transfers zero moment. The points of interest are the locations of the maximum moments which are the two mid-spans and the location of the joint. For this case, the deflection at the load when the first peak occurred is used for comparison. The experimental values for both sides of the sheet will be averaged and compared with the theoretical. The theoretical model is consisted of 3 pinned supports, with the Gerber hinge fully free to rotate. The moment of inertia used in the calculation is from the Technical Manual. There is an observed difference between the values from the experiment with the theoretical values. The deflection from all experiment set-ups are higher compared to their theoretical counterpart Set-up 1 Set-up 2 Set-up 1 Set-up 2 Set-up 1 Set-up 2 Mid-span 1 Mid-span 2 Overlap (Span w/o overlap) (Span w/ overlap) Theoretical Experimental Theoretical Experimental Theoretical Experimental Theoretical Experimental Theoretical Experimental Theoretical Experimental Table 3.5. Experimental values of deflection compared with theoretical 60
62 0.85mm Deflection Theoretical Experimental Theoretical Experimental Set-up 1 Set-up mm Mid-span 1 (Span w/o overlap) Overlap Mid-span 2 (Span w/ overlap) Figure Deflection for the 0.85mm sheet mm Deflection Theoretical Experimental Theoretical Experimental Set-up 1 Set-up 2 1 mm Mid-span 1 (Span w/o overlap) Overlap Mid-span 2 (Span w/ overlap) Figure Deflection for the 1.00mm sheet 61
63 mm Deflection Theoretical Experimental Theoretical Experimental Set-up 1 Set-up mm Mid-span 1 (Span w/o overlap) Overlap Mid-span 2 (Span w/ overlap) Figure Deflection for the 1.50mm sheet The deflection at the overlap is compared for Test Set-up 1 and 2 in Figure The comparison clearly shows that the Set-up 2 has allowed more deflection in the overlap compared to the Set-up 1. Also, it can be seen from the figure below that after the first drop in the graph of Set-up 1, the capacity gained steadily until almost reaching the same initial capacity. By this time, the overlap is no longer a hinge and acting to provide continuity of the sheet, compared to the deflection of Set-up 1 which is increasing until ultimate failure. Also presented in Figure 3.37 are photos showing how much more deflection is in Set-up 2 compared to Set-up 1. Figure Comparison of deflection for Test Set-ups 1 and 2 for 1.00mm thick sheet 62
 Set-up 2, 1.5m")

64 a) Set-up 1, 1.5mm sheet b) Set-up 2, 1.5mm sheet Figure Overlap joint after the test Overlap Gap Opening The gap in the overlap is measured to see if it is significant enough to cause serviceability problems for the insulation that will be placed on top of the sheet. Theoretically, the gaps are expected to open during the elastic stage when the system is acting as Gerber beam, and close in the post-elastic stage when the system acts as a continuous beam (see Figure 1.8). The force-deflection plot of the sensor at the overlap exhibits an opening-closing of the gap. For this result, the positive deflection is a downward displacement (gap is closing) and negative means that the sensor is pushed upward (opening of the gap). At the start of the application of the load, the deflection measured negative. The deflection then becomes positive after the reaching the maximum load. This means that before reaching the elastic peak, the gap opens and then closes in the post-elastic stage. This affirms the assumption that the system behaves as a Gerber system hinged at the overlap during the elastic stage, and continuous system during the post-elastic stage. 63
65 Figure Force-deflection plot of the overlap for 1.00mm thick (Set-up 1) From this experiment, it is observed that the gaps are opening very small to cause any major problem. The maximum measured openings are listed in Table 3.6 below. Thickness (mm) Maximum gap (mm) Table 3.6. Overlap gap opening Rotational Stiffness The rotational stiffness is the ability of the sheet to resist a change in rotation. The sheet is expected to lose stiffness after the apearance of buckling. In the support, the rotational stiffness of the sheet can be calculated using the relationship of the moment and rotation. Eq. 3.1 The computation will be made for 1.0mm thick sheet. The moment is analytically derived using the load applied. The rotation is determined by computing for the angle of the sheet by knowing the deflection at the overlap joint and the distance of the sensor from the support. 64
66 Test Set-up 1 Table Moment-rotation curve for Set-up 1 Moment (kn-m) Rotation Rotational Stiffness (kn-m/rad) LVDT 1-3 Pt. A Pt. C LVDT 1-4 Pt. A Pt. C Table 3.7. Rotational stiffness values for Set-up 1 65
67 Test Set-up 2 Table Moment-rotation curve for Set-up 2 Moment (kn-m) Rotation Rotational Stiffness (kn-m/rad) LVDT 1-3 Pt. A Pt. C LVDT 1-4 Pt. A Pt. C Table 3.8. Rotational stiffness values for Set-up 2 The rotational stiffness, which is the slope of the moment-rotation plot, is initially large, and depending on the occurrence of instabilities, the stiffness changes. There is no constant stiffness from the initial to the ultimate load. The rotational stiffness for the support alone can be obtained from Set-up 2. For the succeeding calculations, the stiffness for LVDT 1-4 in Set-up 2 will be used Reserve Capacity of the Sheet In all the tests conducted, the sheet always failed in the mid-support. In some cases, the mid-span also failed but the initial plastic hinge is always formed in the support. Even after this failure has occured, the distorted sheet still has some capacity to withstand additional load until ultimate failure of the whole system. This reserve capacity is an important measure of the robustness of the whole system to ensure a non-brittle collapse. This reserve capacity is determined in this section. 66

68 Test Set-up 1 The reserve capacity of the sheet is derived based on the deformation plots of the Set-up 1 of 1.00mm thick sheet. It is difficult to obtain the reserve capacities from other thicknesses because they did not reach overall collapse. The Set-up 1 for the 0.85mm thick has failed prematurely due to tilting of the loading timber blocks, while the 1.50mm Set-up 1 did not reach ultimate collapse at all. 1.00mm thick Two scenarios are considered, the capacity of the section at the maximum elastic load (Figure 3.41.a) and the capacity of the section assuming that the mid-support has completely collapsed (Figure 3.41.b). When the system is under maximum loads, the internal support has nonzero moment at the support which is equal to the capacity of the sheet at the mid-support. On the other hand, the second scenario assumes no moment at the support since the sheet has totally collapsed in that location. Hinges are introduced in the internal support to recreate the simply supported condition. In this scenario, the capacity of the span is achieved. The load applied in both cases is the highest load applied in the test kn. a) Moment distribution at maximum elastic load (k=100%) b) Moment distribution assuming sheet at support totally collapsed (k=0%) Figure Moment distribution for computation of reserve capacity To derive the reserve capacity, the maximum capacity of the sheet in the span is determined. Knowing the value of the applied moment, the excess bending moment that is applied at the support can be derived. Computation is presented below. The computed reserve capacity is 69%. 67

69 Figure Bending moment diagram separately for the span and the support at maximum load (85.16kN) M des.f M des.s 10.89kN m 14.66kN m Design moment capacity of single profile in the field span Design moment capacity of single profile in the support M applied 15.97kN m Moment at the single span when maximum load of kn is applied M exc M applied M des.f 5.08kN m Excess moment at the span M add.sup 2M exc 10.16kN m Excess moment at the support (2*span) M res M add.sup % M des.s Reserve capacity at the support Test Set-up 2 The reserve capacity for the Test Set-up 2 is determined by observing the deflection-force plots of the part of the sheet that has buckled. The deflection results from Test Set-up 2 on the overlap (LVDT 1-3, LVDT 1-4) will be used for the computation of the reserve capacity. The idea is that one of the sides of the sheet will buckle first. This buckling, when occurred, will cause a tilt in the loading beams, following the deformed configuration. Meanwhile, the load is still being applied on both the deformed and undeformed sides of the sheet until total collapse is observed. This means that the buckled sheet can still carry an additional load until overall collapse. 68
70 From the graphs below, the plot is linear until achieving the first peak which is the capacity of the two narrow profiles acting together. After the peak load is achieved, there is a drop in the capacities indicating that one of the sheets has buckled. In this stage, the loads are still being applied. One side has higher deflection, but both sides have increasing deflection. The second peak in the plot is the load resisted right before the total collapse. This is also the ultimate capacity achieved by the undeformed sheet, and also the additional moment resisted by the buckled section. Table 3.9 lists the values for the reserve capacity of the sheets. 0.85mm thick Figure Force-deflection plot at the overlap of 0.85mm sheet 69
71 1.00mm thick Figure Force-deflection plot at the overlap of 1.00mm sheet 1.50mm thick Figure Force-deflection plot at the overlap of 1.50mm sheet 70
72 Reserve Capacity (%) Thickness (mm) Capacity of both profiles (kn)* Capacity of single profile (kn)** Moment resisted after buckling (kn-m) Addl moment resisted by the buckled section (kn-m) Reserve capacity of the profile % % % *Load applied to achieve the capacities of the profiles acting together. The values are obtained from the experiment. ** Load applied to achieve the capacities of single profile. The values are obtained from the technical manual. Table 3.9. Reserve capacity for Set-Up 2 100% Reserve Capacity 80% 60% 40% 20% 0% Thickness (mm) Figure Plot of reserve capacity with thickness Overlap Joint under Residual Moment Additional Forces in the Overlap The overlap joint in Set-up 1 is closely examined in the series of tests. As aforementioned, the Set-up 1 has the 500mm length of the overlap with three fixings. In all cases, the joint remained fixed and intact throughout the entire experiment. In some cases, it is observable that the fastener holes have been stretched due to bearing forces but not large enough to allow for screw disengagement. The design of the overlap joint is presented in Annex B.8. In theory, the overlap is supposed to be free of bending stresses because it is the point zero-moment. However, this is only true for the elastic stage. In the post-elastic stage, the residual moment due to the reserve capacity of the sheet generates additional moment in the joint. Therefore, the overlap joint must be checked for these additional stresses. 71


73 The additional moment due to the reserve capacity of the sheet is determined. The resulting moment in the overlap joint is 5.49 kn-m, which is obtained by getting the difference between kn-m and 7.92 kn-m from Figure Similarly, the shear force is computed using the procedure in Section The shear at the joint at the collapsed stage would be equal to 3.63 kn, which is the difference of 5.32 kn and 1.69 kn, see Figure However, this value is smaller than the initial shear of 8.19 kn during the elastic stage, see Figure Therefore the value of the shear used for checking is the higher of the two. a) Moment and shear distribution when system is acted upon by support moment alone b) Moment and shear distribution when system is acted upon by field moment alone Figure Moment and shear distribution for the computation of shear at joint 72
74 Figure Moment and shear distribution at initial stage Joint Fixings The fixings need to be checked for the maximum shear from the elastic and post-elastic conditions. In the elastic stage, the Gerber system will be active which constitutes that the screws act as a hinge. The hinged joint requires that the screws are placed close to each other to result to minimal transfer of moments. The fixings in the joint are stainless steel self-drilling screws with 6.3mm diameter. The properties are obtained from Lindab Technical Manual and EKS 10. The complete structural check of the screw is presented in Annex B.8. Figure Self-drilling screws The fastener must never be the weakest link in a joint when subjected to shearing loads according to the Lindab Technical Manual. In addition, there should be at least 2 fasteners for load bearing screws for safety reasons. For the edge and centre distances under shear force, the minimum "a" distance is 3d and minimum "b" distance is 1.5d, where d is the diameter of the screw (see Figure 3.50). 73
, pulling through or punching through of the screw, and tensile failure in the fastener.")
75 Figure Minimum distances The fastener must be checked for both shear and tension forces. For the tension forces, mode of failure could be extraction from surface (pull-out), pulling through or punching through of the screw, and tensile failure in the fastener. However, the screws on the side are assumed to be the active fasteners for this joint, and these are not subjected to tension but to shear forces. The top screw will be assumed to act as a placing screw only and not structural. The shear failure includes failure of the hole edge and shear failure of the fastener. The design of connection should observed that the governing mode of failure is ductile (ie. bearing of the sheet) and not the rupture of the screws. This is indeed the case in all the test specimens where the bearing failure is observed (see Figure 3.51). Figure Screw holes disfigured due to bearing forces 74
76 Overlap Length To check the overlap length, the maximum loads that can be carried by the screw fixings are determined. These loads will determine the maximum force that can be applied to the joint and should be resisted by the appropriate overlap length. The force arm would be the length of the overlap, and basically the moment that the overlap length should carry is the product of force and distance. The calculation is presented in Annex B.8. The additional moment at the overlap length is compared with the moment resistance of the sheet in the table below. Thickness (mm) Design Moment Resistance of Wide Flange (kn-m) Moment in the Overlap (kn-m) Table Additional moment on the overlap After the structural check, it is concluded that the overlap joint is structurally adequate even after application of the maximum loads. 75
77 4 NUMERICAL STUDY 4.1 Overview of the Numerical Study This chapter is particularly concerned on the stiffness of the sheet over the mid-support at the post-elastic stage. Full-scale models in the Abaqus software are developed for the 1.00mm thick sheet with 500mm overlap length. The numerical models are created to be as similar as possible to the experimental set-up, mainly for comparison purposes. The model is made to exhibit varying stiffness of the sheet above the internal support, which mirrors a spring with varying values of spring constant. To model the variation in stiffness, the model consists of three separate parts over the mid-support as shown in Figure 4.1. Parts 1, 2 and 3 are partitioned parts in the model. These elements have the same properties, but Part 2 will be modified to have varying stiffness. Figure 4.1. Diagram for the numerical model Due to collapse over mid-support, Part 2 reaches elastic capacity and starts to plasticize. With the distribution of the plasticity, Part 2 undergoes loss of stiffness. Meanwhile, Parts 1 and 3 are still in elastic region and has full elastic stiffness. The stiffness at Part 2 is varied and the internal stresses at the overlap joint are obtained. The model was made for 1.00mm thick sheet, with seven different values of stiffness ranging from 100% to 0.5% of the original stiffness. 76
78 E1 k = 100% E = 210 GPa E2 k = 75% E = 158 GPa E3 k = 50% E = 105 GPa E4 k = 25% E = 53 GPa E5 k = 10% E = 21 GPa E6 k = 2.5% E = 5.25 GPa E7 k = 0.5% E = 1 GPa Table 4.1. Varying elastic stiffness used in the model 4.2 Method of Analysis The purpose of the numerical simulation is to predict the internal forces and deflection of the sheet as accurate as possible to its real behaviour. A number of assumptions have been introduced to the model, and the results from the numerical analysis are compared to the experimental results to determine the accuracy of the model. The computational analysis used in the model is the Geometrically and Materially Non-linear Analysis of the perfect structure (GMNA). Since the research aims to determine the behavior of the sheet before and after failure, it is best to use the nonlinear properties of the material to capture its plastic behaviour. The plastic analysis assumes progressive yielding in the cross-section, leading to redistribution of stresses. The material is assumed to be free from imperfections, but the geometric nonlinearity is assumed in the model to take into account the full change in geometry. Shown in Figure 4.2 below is the loaddisplacement curves of different computational models that can be used in numerical modeling. Figure 4.2. Comparison of the different computational analyses (Dubina, Ungureanu, & Landolfo, 2012) 77

79 4.3 Finite Element Model Using Abaqus 6.14, finite element analysis was performed on full scale models of the trapezoidal profiled sheeting. The units used for the numerical model is listed below: Length Force Stress mm N MPa Table 4.2. Units used in the model For a more efficient numerical computation, only half of the experimental profile is used for the numerical model. This simplification is based on the idea that the research is particularly concerned on the behaviour of the sheet when the narrow flange is in compression; therefore only a trapezoidal sheet with a single narrow flange is used. Shown in the figure below are the different profiles assumed in every step of the research. For the experimental study, a 1600mm width profile consisting of two narrow flanges are used. For the numerical and the analytical analysis, a single narrow flange is used. However in the numerical model, the top flange is omitted since it causes extreme deflection results in the model. This simplification is expected to increase the computational speed of the software while not compromising the results. a) Profile used for the experimental study b) Profile used for the numerical study 78
 is significantly larger than the other dimension (thickness).")
80 c) Profile used for the analytical study Figure 4.3. Profiles used for the different stages of the study Parts Part Definition Shell finite elements are used to model the trapezoidal sheet. Shell elements are chosen because it can give more efficient calculating process for thin-walled sections, where one dimension (width) is significantly larger than the other dimension (thickness). It is mentioned that the shell model is optimal for models with width-to-thickness ratio of 20. The sketch of the profile is imported from AutoCAD, and extruded up to the required length. Figure 4.4. Part used in the model Figure 4.4 shows half of the profile which is at the left part of the assembly. The right part of the assembly is fastened to the left part using point-based fasteners at the bottom flange. The top flange is decided to be cut and reduced to 50mm to avoid the instabilities in the edges. The appearance of the local buckling constitutes a stable path but causes a drastic loss of stiffness to the material. The loss of stiffness leads to a spring-like connection at the mid-support. Since there is no 79
81 accurate value yet for this spring constant, the model will employ the use of parts with varying modulus of elasticity. Figure 4.5. Partitioned part where stiffness is varied Properties The properties used in the model are found in Annex B.2. The values for the plastic strain input are: Yield Stress (MPa) Plastic Strain Table 4.3. Plastic strain input for model Mesh Mesh Definition The mesh size is constant at a global size of 40mm. The shape of the mesh is quad and S4R elements are used as the large-strain shell elements. S4R is a quadrilateral four-noded shell element with reduced integration. It can be used for general purpose, and is suitable for wide range of applications (Shell Elements in ABAQUS/Explicit, 2005). 80
82 Force (N) Mesh Convergence Study A convergence study is performed to see the influence of the mesh sizes in the model. For this check, a simple one trapezoid model is used with plastic and geometrically nonlinear properties. The analysis is General Static and a uniformly distributed load is applied along the length of the beam. The forcedisplacement curve is plotted for a single node in the middle of the span. The mesh sizes were varied with values 40mm, 30mm, 20mm, and 10mm, and all other variables are kept constant Mesh Convergence Study Displacement (mm) 40mm 30mm 20mm 10mm Figure 4.6. Force-displacement plot of the different mesh sizes The force-displacement curve for the different mesh sizes is generated and shown in Figure 4.6. It is observed that the plots assume the same behaviour initially. Interestingly enough, the mesh sizes of 40mm and 10mm, deviated from linearity in the same direction, while mesh sizes 30mm and 20mm have a different nonlinear pattern. From the images in Figure 4.7 below, it is seen that the buckling patterns are not the same for all the mesh sizes. 30mm and 20mm have the same buckling mode, where a local buckling started to appear in the middle of the beam. While in the beam with 40mm and 10mm mesh sizes, the several local instabilities occurred at the same time in the midspan that caused for a premature failure of the beam. 81

83 a) 40mm mesh size b) 30mm mesh size c) 20mm mesh size d) 10mm mesh size Figure 4.7. Trapezoidal sheet model with different mesh sizes The convergence study shows that the mesh sizing has a significant influence to the inelastic behaviour of the sheet, and the ultimate carrying capacity of the model. It also shows that the results from the convergence study are not conclusive in choosing the mesh sizes. One suggestion to address this inconsistency is to validate the results with an experiment. According to the result, the 40mm mesh size has a similar behaviour with the 10mm mesh size, and therefore the 40mm is accepted by the user. This mesh size will also work well in expediting the result generation Assembly The assembled configuration of the model is presented below. The full-scale model consists of two spans, where the left is an overhang beam and the right beam is lying on top of the left. Each span is measuring 6m. The overlap length in the joint is 500mm located in the second span. There are three supports and four load points along the beam. 82


84 Figure 4.8. Assembly of the model Interaction The screws on the bottom flanges and the overlap joint are represented as point-based fasteners with 6.3mm diameter. For the fixings at the bottom flange, the fasteners are constrained in all the degrees of freedom. This can represent the clamping effect of the screws on both the sheets being attached. However in the overlap, the fasteners are modeled as hinges, where the UR1 rotation is allowed. The configuration of the fasteners at the overlap follows the same configuration from the experiment, see Figure 4.9. Figure 4.9. Overlap screw fixings 83

85 The contact between sheets is also a vital part of the model. A surface-to-surface interaction is used for the sheet-to-sheet interaction. For the Normal Behaviour, the hard contact option is employed. This option minimizes the penetration of the slave surface into the master surface. It also does not allow transferring tensile stresses in the interface (ABAQUS Analysis User's Guide, 2014). For the Tangential Behaviour, an assumed friction coefficient is specified with the value of Step Since the objective of the analysis is to capture the complete behaviour of the sheet, the Riks method is opted to be used. The arc-length method is an efficient method in solving non-linear systems, especially when there are one or more critical points. A critical point is characterized by an occurrence of instability when the loaded body can no longer support the increase of external forces (Vasios, 2015). Riks method is suitable for cases of buckling or collapse, because the arc-length can determine the response of the structure with significant change in stiffness. This method is chosen to capture the behaviour of the material after the failure where the stress-strain diagram starts deviate from linearity Load and Boundary Condition The end supports are represented by coupling constraints. This entails that the movement of the reference point is followed by the slave points. The degrees of freedom of the points at the surface of the support are tied to a reference point. The reference point is chosen to be the center point of the surfaces. The support is idealized as pinned, which may not be the case in the experimental set-up. Figure Support boundary condition There are also side boundary conditions in the experiment provided by the L-shaped angles acting as steel ties. These steel ties occur at several points along the length of the beam to prevent the sheet from 84

86 spreading or to become distorted. These are represented in the model by restricting the movement of the top flange in the horizontal direction. In the experiment set-up, timber blocks are used to apply the load along the beam. This is represented similarly in the numerical model. The loads are applied using coupling interaction. Figure 4.11 shows a plan view of the model with the surfaces used for load application. The points on these surfaces are tied to the reference point and the reference point is subjected to a -1000N force. There are four load reference points throughout the beam. Figure Load application 4.4 Analysis of Results The model converged until the elastic limit only, when the capacity for tension yielding in the midsupport is reached. The stress and deflection results are extracted and compared with the other investigative approaches in this study Stress Results and Comparison Maximum Load The maximum load in the numerical model is at kn total load for a single profile. Comparing this value with the experimental and the design capacity from the technical manual, it can be seen that this maximum load in good agreement with them. 85
 throughout the beam. The von Mises stress values were generated from Abaqus.")
87 Maximum Load (kn) Abaqus Technical Manual Experiment Setup Experiment Setup Table 4.4. Maximum load for numerical, theoretical, and experimental Maximum Stress The results of the 1.00mm thick sheet is presented, with uniform elastic stiffness (k=100%) throughout the beam. The von Mises stress values were generated from Abaqus. At the last increment of the model, the maximum stress is achieved at 420MPa. This corresponds to the tension yielding of sheet over the internal support. This maximum stress is observed on the edge of the constrained surface assigned as the support boundary condition, see Figure It is also observable that other than the supports, the midspan locations also have an increased stress region indicating stress redistribution. Figure Location of maximum von Mises stress 86
88 The averaged S22 stresses along the beam are obtained for both the top and bottom flanges. Plotted in Figure 4.13, the maximum stress is shown to occur in the mid-support and mid-spans. There is also a peak stress in the end supports resulting from restraining the end element. The location of the overlap joint shows a drop of stresses, which is expected since joint is acting as a hinge during the elastic phase. The sudden decrease of stresses in the location of the load application and at the mid-support are due to the constraint placed in the model, therefore these drops in stress are not significant in the analysis. Figure S22 stress along the beam Stress in the Cross-Section The stresses in the cross-section at the mid-support and mid-spans are extracted from the model and compared with the theoretical values. The calculation for the theoretical stress is presented in Annex B.9. The theoretical and the numerical values are close with each other. However, the biggest difference occur in the midspan which may have been caused by the support condition that is not purely hinged, but rather takes some stresses as seen in the stress distribution on Figure
89 Stress at Mid-support (MPa) Stress at Span (MPa) Top Bottom Top Bottom Abaqus Theoretical Table 4.5. Comparison of the computed stresses with the numerical results Figure Stress in the cross-section of the profile at the support Figure Stress in the cross-section of the profile at the span 88
90 4.4.2 Deflection Results and Comparison The numerical model successfully generated results until maximum yield stress indicated in the material properties. Shown in Table 4.6 is the comparison of the deflection from the experimental results with the numerical results under the same stress. The locations of the deflection are the points where the deflection sensors were stationed along the beam in the experiment. The deflections in the same location were extracted from the numerical results. The maximum deflections in the model are located in the spans. Theoretical values for the deflection are also obtained and compared with the results of the numerical model. Figure Deflection of the whole model 89
91 Deflection (mm) Table 4.6 shows the deflection from the two experiments, the numerical model and the theoretical analysis. For the analytical calculation, the moments of inertia of the gross section and from technical manual are used. The values for the experimental data are the average of the two sensors at that location. Deflections are in mm. Mid-span 1 Mid-span 2 Overlap (Span w/o Overlap) (Span with Overlap) Gap Experiment (Test 1) Experiment (Test 2) ABAQUS Analytical (Gross Section) Analytical (Technical Manual) Table 4.6. Deflection from experiment, numerical and theoretical analysis Comparison of Deflection at Maximum Load Mid-span 1 Overlap Mid-span 2 Gap Experiment (Test 1) Experiment (Test 2) ABAQUS Analytical (Gross Section) Analytical (Technical Manual) Figure Bar graph of the different deflection for comparison As seen from the result, the difference of the deflection of the numerical model with the experimental values is significant. The discrepancy in the results may have stemmed from the modeling of the supports. The theoretical value with the gross moment of inertia is the closest to the numerical model. Moreover, the calculated deflection using the moment of inertia from the technical manual amounted to less deflection that the actual deflection in the experiment. It comes close to the experimental values for midspan locations. 90


92 From this comparison, it is seen that the experimental values have the same behaviour regardless of the overlap condition. This is because both set-ups have same stiffness up until the maximum elastic load from where the sheets start behaving differently. The consistency of the two experimental values is clear from the results. The gap opening is also computed by determining the rotation at the point of the hinge, assuming that the hinge allows perfect rotation. The gap opening for the experimental is close with the theoretical values. Below is the determination of the theoretical gap. Computation for the theoretical gap opening rad deg rad deg L ov 500mm gap 1 L ov tan 1 gap 2 L ov tan 2 gap 1 gap 2 1.5mm 6mm 4.5mm Some other behaviour of the numerical model was also found comparable to the experimental results. Figure Opening of the bottom sheet in the overlap at the end of the experiment, Test Set-up 1 for 1.00mm sheet 91


93 Figure Web buckling at k=0.5% Different stiffness over mid-support One of the objectives of the finite element model is to investigate the evolution of the stresses at the overlap as the system undergoes elastic to post-elastic behaviour. The model in Abaqus converged only up until the elastic limit. To capture the post-elastic loss of stiffness, the partitioned sheet in the midsupport was assigned to have varying stiffness values ranging from 0% - 100%. The 100% stiffness corresponds to the stiffness of the original material which is 210 GPa. This study of the stiffness aims to give an understanding on how the stresses are developed in the overlap joint as the loads are increased until the ultimate failure. For the stresses in the overlap, the highlighted selections in Figure 4.20 are the elements selected for data extraction. These elements are chosen since they represent the peaks and lows of stresses in the overlap. Three elements are on the overlap edge: top, bottom and side; and one element away from the edge which correspond to the element with high increase of stress at the ultimate load. The von Mises stress is obtained for each of these elements and the evolution of the stress is studied and presented in Figure The stresses in the section is also presented in Figure
 Overlap, Away from edge Overlap Edge, Bottom Overlap Edge, Side Overlap Edge, Top Figure 4.21.")
94 Stress (MPa) Figure Elements selected for stress data Stress vs Stiffness Stiffness (%) Overlap, Away from edge Overlap Edge, Bottom Overlap Edge, Side Overlap Edge, Top Figure Stress on the chosen elements for varying stiffness Interestingly, the results showed that the relationship of the stiffness at the support with the moments in the beam is not linearly proportional. It is observed that the stresses at the overlap joint are increasing / decreasing depending on the element chosen. 93
95 Stress (MPa) The plot for the element away from the edge is singled out and presented in Figrue This plot shows that if the stiffness is reduced to as low as 20%, there are minimal and non-significant additional stresses in the overlap. The slope of the curve is mild in this region. However, for stiffness of less than 20%, huge amounts of additional stresses are observed in the profile. Plotting a trendline in the curve, a logarithmic relationship matches the results. This trend is also the same for deflection Stress vs Stiffness y = ln(x) R² = Stiffness (%) Figure Stress on the elements away from the overlap edge, plotted with trendline From the stress results, the moments are calculated. It is noticed that there is an initial moment for k=100% as shown in Figure This is in contrast with the assumption of zero-moment for an ideal Gerber beam with perfect hinge. This moment at the overlap is not easy to verify since it is difficult to choose which elements to extract data from that will give the best representation of stress at the overlap. With this information, the stresses are obtained for the element away from the edge. This element has the increasing stress as the stiffness decreases, and is located at the bottom where the moment calculation is based. 94


96 Figure Moment for the element away from the edge with varying stiffness k=100% k=75% 95


97 k=50% k=25% k=10% k=2.5% k=0% Figure Evolution of the stresses at the overlap joint with varying k 96
98 4.5 Beam Model To validate these findings, another analytical model was developed where a spring is introduced in the support with varying rotational stiffness. The maximum stiffness used as input corresponds to the same moment distribution at elastic stage, and the lowest stiffness corresponds to a simply supported span Model and Results In order to make a comparison with the results from the Abaqus model, a beam model using the engineering design software STAAD was created. The beam is made up of two spans but the Gerber joint is no longer present because the condition being observed is at the collapse stage. At the mid-support location, there will be an imposed rotational stiffness which will be varied. The moments at the overlap joint will be investigated as the stiffness at the mid-support ranged from 0% (simply supported) to 100% (initial stiffness of the system). Figure Model in STAAD From Figure 4.25, there is a small circle right after the internal support, which represent the spring in the start of the beam. This spring is characterized by a spring constant derived from the experimental values. The stiffness of the mid-support comes from the Set-up 2 of 1.00 mm sheet, LVDT 1-4. The rotational stiffness is calculated using the deflection at the end of the overlap and the moment at the support. The initial stiffness of the system is at kn-m/rad, and the stiffness at collapse is 653 kn-m/rad, (see Section 3.5.4). Using these values of the stiffness and the maximum load applied to the system, the relationship of the stiffness with the overlap moment is determined and presented in the graph in Figure
99 Moment in the Overlap (kn-m) Stiffness vs Moment in the Overlap k=10% 8 6 k=25% 4 2 k=50% k=75% k=100% Stiffness (kn-m/rad) Figure Rotational stiffness at the support against the moment in the overlap (k=100%= kn-m/rad) The plot shows a nonlinear, almost logarithmic relationship of the stiffness with the moment in the overlap joint. If the end stiffness of 653 kn-m/rad is plotted in the same graph, the value of the moment on the overlap during the collapse would be 3.92 kn-m/rad. However, it should be noted that at k=100%, it is expected that the moment at the overlap is zero, but in this case it is not. It has some 2 kn-m at the initial stiffness. Comparing with the previously obtained values from the Abaqus, the trend of the plot is almost similar. To see the range of stiffness in the plot, a model was made and experimented to put extreme values of the rotational stiffness. For the initial stiffness, an arbitrary high value of kn-m/rad was used, which also correspond to zero moment at the hinge. It shows that to have zero moment at the hinge location, the value of the stiffness should be very high. For the lower value of stiffness, the rotational stiffness would be a very low value of 0.5 kn-m/rad. This plot is shown below in red. 98
100 Moment in the Overlap (kn-m) Moment in the Overlap (kn-m) Stiffness vs Moment in the Overlap k=0% k=2.5% k=5% k=10% k=25% k=50% k=75% k=100% Stiffness (kn-m/rad) Figure Stiffness vs Moment in the overlap for an extremely high arbitrary value of k k=0% k=25% k=50% k=75% k=100% Moment vs Stiffness Stiffness (kn-m/rad) Figure Moment-stiffness plot of the overlap overlays in the general plot Using the plot generated from STAAD results, Figure 4.29 shows the comparison with the moment calculated form Abaqus generated previously. Note that the element considered in the Abaqus is from the element away from the edge. It is interesting to observe that in both cases, the initial moment is not zero, which is the assumption for the Gerber joint. It is important to know that the zero moment in the hinge is 99

101 Moment in the Overlap (kn-m) only theoretical, and in the real behavior, the overlap joint is expected to transfer minimal moments because of the attached fixings and the contact between sheets. Both values are increasing in almost similar trend, starting with a mild slope. However, the end moments are not in agreement. It is thought to be because of the assumed width of the partitioned element in Abaqus where the stiffness is varied. It is assumed to be 150mm corresponding to the width of the support cleats underneath. However, the experiment shows that the web buckling could have widths of mm, see Figure Stiffness vs Moment in the Overlap 6 4 STAAD Abaqus Stiffness (%) Figure Moment at the overlap for STAAD and Abaqus Figure Width of web buckling for 1.50mm sheet, Test Set-up 2 100
Influence of residual stresses in the structural behavior of. tubular columns and arches. Nuno Rocha Cima Gomes
 October 2014 Influence of residual stresses in the structural behavior of Abstract tubular columns and arches Nuno Rocha Cima Gomes Instituto Superior Técnico, Universidade de Lisboa, Portugal Contact:
Accordingly, the nominal section strength [resistance] for initiation of yielding is calculated by using Equation C-C3.1.
![Accordingly, the nominal section strength [resistance] for initiation of yielding is calculated by using Equation C-C3.1.](/thumbs/89/98617066.jpg "Accordingly, the nominal section strength [resistance] for initiation of yielding is calculated by using Equation C-C3.1.") C3 Flexural Members C3.1 Bending The nominal flexural strength [moment resistance], Mn, shall be the smallest of the values calculated for the limit states of yielding, lateral-torsional buckling and distortional
C3 Flexural Members C3.1 Bending The nominal flexural strength [moment resistance], Mn, shall be the smallest of the values calculated for the limit states of yielding, lateral-torsional buckling and distortional
PLATE GIRDERS II. Load. Web plate Welds A Longitudinal elevation. Fig. 1 A typical Plate Girder
 16 PLATE GIRDERS II 1.0 INTRODUCTION This chapter describes the current practice for the design of plate girders adopting meaningful simplifications of the equations derived in the chapter on Plate Girders
Design of Beams (Unit - 8)
") Design of Beams (Unit - 8) Contents Introduction Beam types Lateral stability of beams Factors affecting lateral stability Behaviour of simple and built - up beams in bending (Without vertical stiffeners)
Design of Beams (Unit - 8) Contents Introduction Beam types Lateral stability of beams Factors affecting lateral stability Behaviour of simple and built - up beams in bending (Without vertical stiffeners)
NUMERICAL EVALUATION OF THE ROTATIONAL CAPACITY OF STEEL BEAMS AT ELEVATED TEMPERATURES
 8 th GRACM International Congress on Computational Mechanics Volos, 12 July 15 July 2015 NUMERICAL EVALUATION OF THE ROTATIONAL CAPACITY OF STEEL BEAMS AT ELEVATED TEMPERATURES Savvas Akritidis, Daphne
Finite Element Modelling with Plastic Hinges
 01/02/2016 Marco Donà Finite Element Modelling with Plastic Hinges 1 Plastic hinge approach A plastic hinge represents a concentrated post-yield behaviour in one or more degrees of freedom. Hinges only
FINITE ELEMENT ANALYSIS OF TAPERED COMPOSITE PLATE GIRDER WITH A NON-LINEAR VARYING WEB DEPTH
 Journal of Engineering Science and Technology Vol. 12, No. 11 (2017) 2839-2854 School of Engineering, Taylor s University FINITE ELEMENT ANALYSIS OF TAPERED COMPOSITE PLATE GIRDER WITH A NON-LINEAR VARYING
QUESTION BANK SEMESTER: III SUBJECT NAME: MECHANICS OF SOLIDS
 QUESTION BANK SEMESTER: III SUBJECT NAME: MECHANICS OF SOLIDS UNIT 1- STRESS AND STRAIN PART A (2 Marks) 1. Define longitudinal strain and lateral strain. 2. State Hooke s law. 3. Define modular ratio,
QUESTION BANK DEPARTMENT: CIVIL SEMESTER: III SUBJECT CODE: CE2201 SUBJECT NAME: MECHANICS OF SOLIDS UNIT 1- STRESS AND STRAIN PART A
 DEPARTMENT: CIVIL SUBJECT CODE: CE2201 QUESTION BANK SEMESTER: III SUBJECT NAME: MECHANICS OF SOLIDS UNIT 1- STRESS AND STRAIN PART A (2 Marks) 1. Define longitudinal strain and lateral strain. 2. State
Failure in Flexure. Introduction to Steel Design, Tensile Steel Members Modes of Failure & Effective Areas
 Introduction to Steel Design, Tensile Steel Members Modes of Failure & Effective Areas MORGAN STATE UNIVERSITY SCHOOL OF ARCHITECTURE AND PLANNING LECTURE VIII Dr. Jason E. Charalambides Failure in Flexure!
SERVICEABILITY OF BEAMS AND ONE-WAY SLABS
 CHAPTER REINFORCED CONCRETE Reinforced Concrete Design A Fundamental Approach - Fifth Edition Fifth Edition SERVICEABILITY OF BEAMS AND ONE-WAY SLABS A. J. Clark School of Engineering Department of Civil
Structural Steelwork Eurocodes Development of A Trans-national Approach
 Structural Steelwork Eurocodes Development of A Trans-national Approach Course: Eurocode Module 7 : Worked Examples Lecture 0 : Simple braced frame Contents: 1. Simple Braced Frame 1.1 Characteristic Loads
ENG1001 Engineering Design 1
 ENG1001 Engineering Design 1 Structure & Loads Determine forces that act on structures causing it to deform, bend, and stretch Forces push/pull on objects Structures are loaded by: > Dead loads permanent
R13. II B. Tech I Semester Regular Examinations, Jan MECHANICS OF SOLIDS (Com. to ME, AME, AE, MTE) PART-A
 PART-A") SET - 1 II B. Tech I Semester Regular Examinations, Jan - 2015 MECHANICS OF SOLIDS (Com. to ME, AME, AE, MTE) Time: 3 hours Max. Marks: 70 Note: 1. Question Paper consists of two parts (Part-A and Part-B)
SET - 1 II B. Tech I Semester Regular Examinations, Jan - 2015 MECHANICS OF SOLIDS (Com. to ME, AME, AE, MTE) Time: 3 hours Max. Marks: 70 Note: 1. Question Paper consists of two parts (Part-A and Part-B)
Sabah Shawkat Cabinet of Structural Engineering Walls carrying vertical loads should be designed as columns. Basically walls are designed in
 Sabah Shawkat Cabinet of Structural Engineering 17 3.6 Shear walls Walls carrying vertical loads should be designed as columns. Basically walls are designed in the same manner as columns, but there are
Mechanics of Materials Primer
 Mechanics of Materials rimer Notation: A = area (net = with holes, bearing = in contact, etc...) b = total width of material at a horizontal section d = diameter of a hole D = symbol for diameter E = modulus
Lecture-08 Gravity Load Analysis of RC Structures
 Lecture-08 Gravity Load Analysis of RC Structures By: Prof Dr. Qaisar Ali Civil Engineering Department UET Peshawar www.drqaisarali.com 1 Contents Analysis Approaches Point of Inflection Method Equivalent
COURSE TITLE : APPLIED MECHANICS & STRENGTH OF MATERIALS COURSE CODE : 4017 COURSE CATEGORY : A PERIODS/WEEK : 6 PERIODS/ SEMESTER : 108 CREDITS : 5
 COURSE TITLE : APPLIED MECHANICS & STRENGTH OF MATERIALS COURSE CODE : 4017 COURSE CATEGORY : A PERIODS/WEEK : 6 PERIODS/ SEMESTER : 108 CREDITS : 5 TIME SCHEDULE MODULE TOPICS PERIODS 1 Simple stresses
PES Institute of Technology
 PES Institute of Technology Bangalore south campus, Bangalore-5460100 Department of Mechanical Engineering Faculty name : Madhu M Date: 29/06/2012 SEM : 3 rd A SEC Subject : MECHANICS OF MATERIALS Subject
: APPLIED MECHANICS & STRENGTH OF MATERIALS COURSE CODE : 4021 COURSE CATEGORY : A PERIODS/ WEEK : 5 PERIODS/ SEMESTER : 75 CREDIT : 5 TIME SCHEDULE
 COURSE TITLE : APPLIED MECHANICS & STRENGTH OF MATERIALS COURSE CODE : 4021 COURSE CATEGORY : A PERIODS/ WEEK : 5 PERIODS/ SEMESTER : 75 CREDIT : 5 TIME SCHEDULE MODULE TOPIC PERIODS 1 Simple stresses
Karbala University College of Engineering Department of Civil Eng. Lecturer: Dr. Jawad T. Abodi
 Chapter 05 Structural Steel Design According to the AISC Manual 13 th Edition Analysis and Design of Beams By Dr. Jawad Talib Al-Nasrawi University of Karbala Department of Civil Engineering 71 Introduction
SSC-JE MAINS ONLINE TEST SERIES / CIVIL ENGINEERING SOM + TOS
 SSC-JE MAINS ONLINE TEST SERIES / CIVIL ENGINEERING SOM + TOS Time Allowed:2 Hours Maximum Marks: 300 Attention: 1. Paper consists of Part A (Civil & Structural) Part B (Electrical) and Part C (Mechanical)
Fundamentals of Structural Design Part of Steel Structures
 Fundamentals of Structural Design Part of Steel Structures Civil Engineering for Bachelors 133FSTD Teacher: Zdeněk Sokol Office number: B619 1 Syllabus of lectures 1. Introduction, history of steel structures,
Experimental Study and Numerical Simulation on Steel Plate Girders With Deep Section
 6 th International Conference on Advances in Experimental Structural Engineering 11 th International Workshop on Advanced Smart Materials and Smart Structures Technology August 1-2, 2015, University of
Design of Steel Structures Prof. S.R.Satish Kumar and Prof. A.R.Santha Kumar. Local buckling is an extremely important facet of cold formed steel
 5.3 Local buckling Local buckling is an extremely important facet of cold formed steel sections on account of the fact that the very thin elements used will invariably buckle before yielding. Thinner the
Design of Steel Structures Prof. S.R.Satish Kumar and Prof. A.R.Santha Kumar
 5.4 Beams As stated previousl, the effect of local buckling should invariabl be taken into account in thin walled members, using methods described alread. Laterall stable beams are beams, which do not
INFLUENCE OF FLANGE STIFFNESS ON DUCTILITY BEHAVIOUR OF PLATE GIRDER
 International Journal of Civil Structural 6 Environmental And Infrastructure Engineering Research Vol.1, Issue.1 (2011) 1-15 TJPRC Pvt. Ltd.,. INFLUENCE OF FLANGE STIFFNESS ON DUCTILITY BEHAVIOUR OF PLATE
Structural Steelwork Eurocodes Development of A Trans-national Approach
 Structural Steelwork Eurocodes Development of A Trans-national Approach Course: Eurocode 3 Module 7 : Worked Examples Lecture 20 : Simple braced frame Contents: 1. Simple Braced Frame 1.1 Characteristic
SRI CHANDRASEKHARENDRA SARASWATHI VISWA MAHAVIDHYALAYA
 SRI CHANDRASEKHARENDRA SARASWATHI VISWA MAHAVIDHYALAYA (Declared as Deemed-to-be University under Section 3 of the UGC Act, 1956, Vide notification No.F.9.9/92-U-3 dated 26 th May 1993 of the Govt. of
NORMAL STRESS. The simplest form of stress is normal stress/direct stress, which is the stress perpendicular to the surface on which it acts.
 NORMAL STRESS The simplest form of stress is normal stress/direct stress, which is the stress perpendicular to the surface on which it acts. σ = force/area = P/A where σ = the normal stress P = the centric
Flange Curling in Cold Formed Profiles
 Downloaded from orbit.dtu.dk on: Sep 4, 28 Flange Curling in Cold Formed Profiles Jönsson, Jeppe; Ramonas, Gediminas Published in: Proceedings of Nordic Steel Construction Conference 22 Publication date:
FLEXIBILITY METHOD FOR INDETERMINATE FRAMES
 UNIT - I FLEXIBILITY METHOD FOR INDETERMINATE FRAMES 1. What is meant by indeterminate structures? Structures that do not satisfy the conditions of equilibrium are called indeterminate structure. These
Engineering Science OUTCOME 1 - TUTORIAL 4 COLUMNS
 Unit 2: Unit code: QCF Level: Credit value: 15 Engineering Science L/601/10 OUTCOME 1 - TUTORIAL COLUMNS 1. Be able to determine the behavioural characteristics of elements of static engineering systems
Civil Engineering Design (1) Analysis and Design of Slabs 2006/7
 Analysis and Design of Slabs 2006/7") Civil Engineering Design (1) Analysis and Design of Slabs 006/7 Dr. Colin Caprani, Chartered Engineer 1 Contents 1. Elastic Methods... 3 1.1 Introduction... 3 1. Grillage Analysis... 4 1.3 Finite Element
Civil Engineering Design (1) Analysis and Design of Slabs 006/7 Dr. Colin Caprani, Chartered Engineer 1 Contents 1. Elastic Methods... 3 1.1 Introduction... 3 1. Grillage Analysis... 4 1.3 Finite Element
National Exams May 2015
 National Exams May 2015 04-BS-6: Mechanics of Materials 3 hours duration Notes: If doubt exists as to the interpretation of any question, the candidate is urged to submit with the answer paper a clear
Flexure: Behavior and Nominal Strength of Beam Sections
 4 5000 4000 (increased d ) (increased f (increased A s or f y ) c or b) Flexure: Behavior and Nominal Strength of Beam Sections Moment (kip-in.) 3000 2000 1000 0 0 (basic) (A s 0.5A s ) 0.0005 0.001 0.0015
Chapter 8: Bending and Shear Stresses in Beams
 Chapter 8: Bending and Shear Stresses in Beams Introduction One of the earliest studies concerned with the strength and deflection of beams was conducted by Galileo Galilei. Galileo was the first to discuss
9-3. Structural response
 9-3. Structural response in fire František Wald Czech Technical University in Prague Objectives of the lecture The mechanical load in the fire design Response of the structure exposed to fire Levels of
KINGS COLLEGE OF ENGINEERING DEPARTMENT OF MECHANICAL ENGINEERING QUESTION BANK. Subject code/name: ME2254/STRENGTH OF MATERIALS Year/Sem:II / IV
 KINGS COLLEGE OF ENGINEERING DEPARTMENT OF MECHANICAL ENGINEERING QUESTION BANK Subject code/name: ME2254/STRENGTH OF MATERIALS Year/Sem:II / IV UNIT I STRESS, STRAIN DEFORMATION OF SOLIDS PART A (2 MARKS)
SECTION 7 DESIGN OF COMPRESSION MEMBERS
 SECTION 7 DESIGN OF COMPRESSION MEMBERS 1 INTRODUCTION TO COLUMN BUCKLING Introduction Elastic buckling of an ideal column Strength curve for an ideal column Strength of practical column Concepts of effective
Structural Steelwork Eurocodes Development of A Trans-national Approach
 Structural Steelwork Eurocodes Development of A Trans-national Approach Course: Eurocode Module 7 : Worked Examples Lecture 22 : Design of an unbraced sway frame with rigid joints Summary: NOTE This example
Purpose of this Guide: To thoroughly prepare students for the exact types of problems that will be on Exam 3.
 ES230 STRENGTH OF MTERILS Exam 3 Study Guide Exam 3: Wednesday, March 8 th in-class Updated 3/3/17 Purpose of this Guide: To thoroughly prepare students for the exact types of problems that will be on
Seismic Pushover Analysis Using AASHTO Guide Specifications for LRFD Seismic Bridge Design
 Seismic Pushover Analysis Using AASHTO Guide Specifications for LRFD Seismic Bridge Design Elmer E. Marx, Alaska Department of Transportation and Public Facilities Michael Keever, California Department
Chapter Objectives. Design a beam to resist both bendingand shear loads
 Chapter Objectives Design a beam to resist both bendingand shear loads A Bridge Deck under Bending Action Castellated Beams Post-tensioned Concrete Beam Lateral Distortion of a Beam Due to Lateral Load
MODULE C: COMPRESSION MEMBERS
 MODULE C: COMPRESSION MEMBERS This module of CIE 428 covers the following subjects Column theory Column design per AISC Effective length Torsional and flexural-torsional buckling Built-up members READING:
Downloaded from Downloaded from / 1
 PURWANCHAL UNIVERSITY III SEMESTER FINAL EXAMINATION-2002 LEVEL : B. E. (Civil) SUBJECT: BEG256CI, Strength of Material Full Marks: 80 TIME: 03:00 hrs Pass marks: 32 Candidates are required to give their
Equivalent Uniform Moment Factor for Lateral Torsional Buckling of Steel Beams
 University of Alberta Department of Civil & Environmental Engineering Master of Engineering Report in Structural Engineering Equivalent Uniform Moment Factor for Lateral Torsional Buckling of Steel Beams
PERIYAR CENTENARY POLYTECHNIC COLLEGE PERIYAR NAGAR - VALLAM THANJAVUR. DEPARTMENT OF MECHANICAL ENGINEERING QUESTION BANK
 PERIYAR CENTENARY POLYTECHNIC COLLEGE PERIYAR NAGAR - VALLAM - 613 403 - THANJAVUR. DEPARTMENT OF MECHANICAL ENGINEERING QUESTION BANK Sub : Strength of Materials Year / Sem: II / III Sub Code : MEB 310
Structural Calculations for Juliet balconies using BALCONY 2 System (Aerofoil) handrail. Our ref: JULB2NB Date of issue: March 2017
 handrail. Our ref: JULB2NB Date of issue: March 2017") Juliet balconies using BALCONY 2 System (Aerofoil) handrail PAGE 1 (ref: JULB2NB280317) Structural Calculations for Juliet balconies using BALCONY 2 System (Aerofoil) handrail Our ref: JULB2NB280317 Date
Juliet balconies using BALCONY 2 System (Aerofoil) handrail PAGE 1 (ref: JULB2NB280317) Structural Calculations for Juliet balconies using BALCONY 2 System (Aerofoil) handrail Our ref: JULB2NB280317 Date
March 24, Chapter 4. Deflection and Stiffness. Dr. Mohammad Suliman Abuhaiba, PE
 Chapter 4 Deflection and Stiffness 1 2 Chapter Outline Spring Rates Tension, Compression, and Torsion Deflection Due to Bending Beam Deflection Methods Beam Deflections by Superposition Strain Energy Castigliano
STRESS STRAIN AND DEFORMATION OF SOLIDS, STATES OF STRESS
 1 UNIT I STRESS STRAIN AND DEFORMATION OF SOLIDS, STATES OF STRESS 1. Define: Stress When an external force acts on a body, it undergoes deformation. At the same time the body resists deformation. The
Research Collection. Numerical analysis on the fire behaviour of steel plate girders. Conference Paper. ETH Library
 Research Collection Conference Paper Numerical analysis on the fire behaviour of steel plate girders Author(s): Scandella, Claudio; Knobloch, Markus; Fontana, Mario Publication Date: 14 Permanent Link:
A Simplified Method for the Design of Steel Beam-to-column Connections
 P P Periodica Polytechnica Architecture A Simplified Method for the Design of Steel Beam-to-column Connections 48() pp. 79-86 017 https://doi.org/10.3311/ppar.11089 Creative Commons Attribution b Imola
Unit III Theory of columns. Dr.P.Venkateswara Rao, Associate Professor, Dept. of Civil Engg., SVCE, Sriperumbudir
 Unit III Theory of columns 1 Unit III Theory of Columns References: Punmia B.C.,"Theory of Structures" (SMTS) Vol II, Laxmi Publishing Pvt Ltd, New Delhi 2004. Rattan.S.S., "Strength of Materials", Tata
UNIT- I Thin plate theory, Structural Instability:
 UNIT- I Thin plate theory, Structural Instability: Analysis of thin rectangular plates subject to bending, twisting, distributed transverse load, combined bending and in-plane loading Thin plates having
ε t increases from the compressioncontrolled Figure 9.15: Adjusted interaction diagram
 CHAPTER NINE COLUMNS 4 b. The modified axial strength in compression is reduced to account for accidental eccentricity. The magnitude of axial force evaluated in step (a) is multiplied by 0.80 in case
DEFORMATION CAPACITY OF OLDER RC SHEAR WALLS: EXPERIMENTAL ASSESSMENT AND COMPARISON WITH EUROCODE 8 - PART 3 PROVISIONS
 DEFORMATION CAPACITY OF OLDER RC SHEAR WALLS: EXPERIMENTAL ASSESSMENT AND COMPARISON WITH EUROCODE 8 - PART 3 PROVISIONS Konstantinos CHRISTIDIS 1, Emmanouil VOUGIOUKAS 2 and Konstantinos TREZOS 3 ABSTRACT
Influence of column web stiffening on the seismic behaviour of beam-tocolumn
 Influence of column web stiffening on the seismic behaviour of beam-tocolumn joints A.L. Ciutina & D. Dubina The Politehnica University of Timisoara, Romania ABSTRACT: The present paper summarises the
DEPARTMENT OF CIVIL ENGINEERING
 KINGS COLLEGE OF ENGINEERING DEPARTMENT OF CIVIL ENGINEERING SUBJECT: CE 2252 STRENGTH OF MATERIALS UNIT: I ENERGY METHODS 1. Define: Strain Energy When an elastic body is under the action of external
SERVICEABILITY LIMIT STATE DESIGN
 CHAPTER 11 SERVICEABILITY LIMIT STATE DESIGN Article 49. Cracking Limit State 49.1 General considerations In the case of verifications relating to Cracking Limit State, the effects of actions comprise
Presented by: Civil Engineering Academy
 Presented by: Civil Engineering Academy Structural Design and Material Properties of Steel Presented by: Civil Engineering Academy Advantages 1. High strength per unit length resulting in smaller dead
L13 Structural Engineering Laboratory
 LABORATORY PLANNING GUIDE L13 Structural Engineering Laboratory Content Covered subjects according to the curriculum of Structural Engineering... 2 Main concept... 4 Initial training provided for laboratory
Design of Reinforced Concrete Structures (II)
") Design of Reinforced Concrete Structures (II) Discussion Eng. Mohammed R. Kuheil Review The thickness of one-way ribbed slabs After finding the value of total load (Dead and live loads), the elements are
Design of Reinforced Concrete Structures (II) Discussion Eng. Mohammed R. Kuheil Review The thickness of one-way ribbed slabs After finding the value of total load (Dead and live loads), the elements are
D : SOLID MECHANICS. Q. 1 Q. 9 carry one mark each. Q.1 Find the force (in kn) in the member BH of the truss shown.
 in the member BH of the truss shown.") D : SOLID MECHANICS Q. 1 Q. 9 carry one mark each. Q.1 Find the force (in kn) in the member BH of the truss shown. Q.2 Consider the forces of magnitude F acting on the sides of the regular hexagon having
D : SOLID MECHANICS Q. 1 Q. 9 carry one mark each. Q.1 Find the force (in kn) in the member BH of the truss shown. Q.2 Consider the forces of magnitude F acting on the sides of the regular hexagon having
Tuesday, February 11, Chapter 3. Load and Stress Analysis. Dr. Mohammad Suliman Abuhaiba, PE
 1 Chapter 3 Load and Stress Analysis 2 Chapter Outline Equilibrium & Free-Body Diagrams Shear Force and Bending Moments in Beams Singularity Functions Stress Cartesian Stress Components Mohr s Circle for
CIVIL DEPARTMENT MECHANICS OF STRUCTURES- ASSIGNMENT NO 1. Brach: CE YEAR:
 MECHANICS OF STRUCTURES- ASSIGNMENT NO 1 SEMESTER: V 1) Find the least moment of Inertia about the centroidal axes X-X and Y-Y of an unequal angle section 125 mm 75 mm 10 mm as shown in figure 2) Determine
 Balcony balustrades using the SG12 laminated glass system: PAGE 1 (SG12FF010717) Structural Calculations for SG12 System balustrades using 21.5mm laminated toughened glass without the need for a handrail
4.MECHANICAL PROPERTIES OF MATERIALS
 4.MECHANICAL PROPERTIES OF MATERIALS The diagram representing the relation between stress and strain in a given material is an important characteristic of the material. To obtain the stress-strain diagram
2. (a) Explain different types of wing structures. (b) Explain the advantages and disadvantages of different materials used for aircraft
 Explain different types of wing structures. (b) Explain the advantages and disadvantages of different materials used for aircraft") Code No: 07A62102 R07 Set No. 2 III B.Tech II Semester Regular/Supplementary Examinations,May 2010 Aerospace Vehicle Structures -II Aeronautical Engineering Time: 3 hours Max Marks: 80 Answer any FIVE
Code No: 07A62102 R07 Set No. 2 III B.Tech II Semester Regular/Supplementary Examinations,May 2010 Aerospace Vehicle Structures -II Aeronautical Engineering Time: 3 hours Max Marks: 80 Answer any FIVE
Chapter 7: Bending and Shear in Simple Beams
 Chapter 7: Bending and Shear in Simple Beams Introduction A beam is a long, slender structural member that resists loads that are generally applied transverse (perpendicular) to its longitudinal axis.
Chapter 4. Test results and discussion. 4.1 Introduction to Experimental Results
 Chapter 4 Test results and discussion This chapter presents a discussion of the results obtained from eighteen beam specimens tested at the Structural Technology Laboratory of the Technical University
Section Forces Within Earth. 8 th Grade Earth & Space Science - Class Notes
 Section 19.1 - Forces Within Earth 8 th Grade Earth & Space Science - Class Notes Stress and Strain Stress - is the total force acting on crustal rocks per unit of area (cause) Strain deformation of materials
CE6306 STRENGTH OF MATERIALS TWO MARK QUESTIONS WITH ANSWERS ACADEMIC YEAR
 CE6306 STRENGTH OF MATERIALS TWO MARK QUESTIONS WITH ANSWERS ACADEMIC YEAR 2014-2015 UNIT - 1 STRESS, STRAIN AND DEFORMATION OF SOLIDS PART- A 1. Define tensile stress and tensile strain. The stress induced
Chapter 12 Elastic Stability of Columns
 Chapter 12 Elastic Stability of Columns Axial compressive loads can cause a sudden lateral deflection (Buckling) For columns made of elastic-perfectly plastic materials, P cr Depends primarily on E and
3. BEAMS: STRAIN, STRESS, DEFLECTIONS
 3. BEAMS: STRAIN, STRESS, DEFLECTIONS The beam, or flexural member, is frequently encountered in structures and machines, and its elementary stress analysis constitutes one of the more interesting facets
STRENGTH OF MATERIALS-I. Unit-1. Simple stresses and strains
 STRENGTH OF MATERIALS-I Unit-1 Simple stresses and strains 1. What is the Principle of surveying 2. Define Magnetic, True & Arbitrary Meridians. 3. Mention different types of chains 4. Differentiate between
Entrance exam Master Course
 - 1 - Guidelines for completion of test: On each page, fill in your name and your application code Each question has four answers while only one answer is correct. o Marked correct answer means 4 points
Name :. Roll No. :... Invigilator s Signature :.. CS/B.TECH (CE-NEW)/SEM-3/CE-301/ SOLID MECHANICS
/SEM-3/CE-301/ SOLID MECHANICS") Name :. Roll No. :..... Invigilator s Signature :.. 2011 SOLID MECHANICS Time Allotted : 3 Hours Full Marks : 70 The figures in the margin indicate full marks. Candidates are required to give their answers
Name :. Roll No. :..... Invigilator s Signature :.. 2011 SOLID MECHANICS Time Allotted : 3 Hours Full Marks : 70 The figures in the margin indicate full marks. Candidates are required to give their answers
EXTERIOR FRAMING EXTERIOR FRAMING
 1 EXTERIOR FRAMING BUILDSTRONG www.buildstrong.com 2 TABLE OF CONTENTS Product Identification...........................5 General Product Information....................... 4-5 Compliance Guaranteed...............................
ME Final Exam. PROBLEM NO. 4 Part A (2 points max.) M (x) y. z (neutral axis) beam cross-sec+on. 20 kip ft. 0.2 ft. 10 ft. 0.1 ft.
 M (x) y. z (neutral axis) beam cross-sec+on. 20 kip ft. 0.2 ft. 10 ft. 0.1 ft.") ME 323 - Final Exam Name December 15, 2015 Instructor (circle) PROEM NO. 4 Part A (2 points max.) Krousgrill 11:30AM-12:20PM Ghosh 2:30-3:20PM Gonzalez 12:30-1:20PM Zhao 4:30-5:20PM M (x) y 20 kip ft 0.2
ME 323 - Final Exam Name December 15, 2015 Instructor (circle) PROEM NO. 4 Part A (2 points max.) Krousgrill 11:30AM-12:20PM Ghosh 2:30-3:20PM Gonzalez 12:30-1:20PM Zhao 4:30-5:20PM M (x) y 20 kip ft 0.2
ENCE 455 Design of Steel Structures. III. Compression Members
 ENCE 455 Design of Steel Structures III. Compression Members C. C. Fu, Ph.D., P.E. Civil and Environmental Engineering Department University of Maryland Compression Members Following subjects are covered:
ME 243. Mechanics of Solids
 ME 243 Mechanics of Solids Lecture 2: Stress and Strain Ahmad Shahedi Shakil Lecturer, Dept. of Mechanical Engg, BUET E-mail: sshakil@me.buet.ac.bd, shakil6791@gmail.com Website: teacher.buet.ac.bd/sshakil
If the number of unknown reaction components are equal to the number of equations, the structure is known as statically determinate.
 1 of 6 EQUILIBRIUM OF A RIGID BODY AND ANALYSIS OF ETRUCTURAS II 9.1 reactions in supports and joints of a two-dimensional structure and statically indeterminate reactions: Statically indeterminate structures
five Mechanics of Materials 1 ARCHITECTURAL STRUCTURES: FORM, BEHAVIOR, AND DESIGN DR. ANNE NICHOLS SUMMER 2017 lecture
 ARCHITECTURAL STRUCTURES: FORM, BEHAVIOR, AND DESIGN DR. ANNE NICHOLS SUMMER 2017 lecture five mechanics www.carttalk.com of materials Mechanics of Materials 1 Mechanics of Materials MECHANICS MATERIALS
An Increase in Elastic Buckling Strength of Plate Girder by the Influence of Transverse Stiffeners
 GRD Journals- Global Research and Development Journal for Engineering Volume 2 Issue 6 May 2017 ISSN: 2455-5703 An Increase in Elastic Buckling Strength of Plate Girder by the Influence of Transverse Stiffeners
Theory of structure I 2006/2013. Chapter one DETERMINACY & INDETERMINACY OF STRUCTURES
 Chapter one DETERMINACY & INDETERMINACY OF STRUCTURES Introduction A structure refers to a system of connected parts used to support a load. Important examples related to civil engineering include buildings,
Bridge deck modelling and design process for bridges
 EU-Russia Regulatory Dialogue Construction Sector Subgroup 1 Bridge deck modelling and design process for bridges Application to a composite twin-girder bridge according to Eurocode 4 Laurence Davaine
UNIT 1 STRESS STRAIN AND DEFORMATION OF SOLIDS, STATES OF STRESS 1. Define stress. When an external force acts on a body, it undergoes deformation.
 UNIT 1 STRESS STRAIN AND DEFORMATION OF SOLIDS, STATES OF STRESS 1. Define stress. When an external force acts on a body, it undergoes deformation. At the same time the body resists deformation. The magnitude
BUCKLING MODE CLASSIFICATION OF MEMBERS WITH OPEN THIN-WALLED CROSS-SECTIONS
 CIMS 4 Fourth International Conference on Coupled Instabilities in Metal Structures Rome, Italy, 27-29 September, 24 BUCKLING MODE CLASSIFICATION OF MEMBERS WITH OPEN THIN-WALLED CROSS-SECTIONS S. ÁDÁNY,
POST-BUCKLING CAPACITY OF BI-AXIALLY LOADED RECTANGULAR STEEL PLATES
 POST-BUCKLING CAPACITY OF BI-AXIALLY LOADED RECTANGULAR STEEL PLATES Jeppe Jönsson a and Tommi H. Bondum b a,b DTU Civil Engineering, Technical University of Denmark Abstract: Results from a detailed numerical
Critical Load columns buckling critical load
 Buckling of Columns Buckling of Columns Critical Load Some member may be subjected to compressive loadings, and if these members are long enough to cause the member to deflect laterally or sideway. To
Interactive Buckling of Cold-Formed Steel Sections Applied in Pallet Rack Upright Members
 Interactive Buckling of Cold-Formed Steel Sections Applied in Pallet Rack Upright Members D. Dubina, V. Ungureanu, A. Crisan Politehnica University of Timişoara Peculiarities of cold-formed thin-walled
PERFORATED METAL DECK DESIGN
 PERFORATED METAL DECK DESIGN with Commentary Prepared By: L.D. Luttrell, Technical Advisor Steel Deck Institute November 18, 2011 Copyright 2011 All rights reserved P.O. Box 25 Fox River Grove, IL 60021
Karbala University College of Engineering Department of Civil Eng. Lecturer: Dr. Jawad T. Abodi
 Chapter 04 Structural Steel Design According to the AISC Manual 13 th Edition Analysis and Design of Compression Members By Dr. Jawad Talib Al-Nasrawi University of Karbala Department of Civil Engineering
Analysis of Shear Lag Effect of Box Beam under Dead Load
 Analysis of Shear Lag Effect of Box Beam under Dead Load Qi Wang 1, a, Hongsheng Qiu 2, b 1 School of transportation, Wuhan University of Technology, 430063, Wuhan Hubei China 2 School of transportation,
Mechanical Design in Optical Engineering
 OPTI Buckling Buckling and Stability: As we learned in the previous lectures, structures may fail in a variety of ways, depending on the materials, load and support conditions. We had two primary concerns:
CHAPTER 5. T a = 0.03 (180) 0.75 = 1.47 sec 5.12 Steel moment frame. h n = = 260 ft. T a = (260) 0.80 = 2.39 sec. Question No.
 0.75 = 1.47 sec 5.12 Steel moment frame. h n = = 260 ft. T a = (260) 0.80 = 2.39 sec. Question No.") CHAPTER 5 Question Brief Explanation No. 5.1 From Fig. IBC 1613.5(3) and (4) enlarged region 1 (ASCE 7 Fig. -3 and -4) S S = 1.5g, and S 1 = 0.6g. The g term is already factored in the equations, thus
CHAPTER 5 Question Brief Explanation No. 5.1 From Fig. IBC 1613.5(3) and (4) enlarged region 1 (ASCE 7 Fig. -3 and -4) S S = 1.5g, and S 1 = 0.6g. The g term is already factored in the equations, thus
Dr. Hazim Dwairi. Example: Continuous beam deflection
 Example: Continuous beam deflection Analyze the short-term and ultimate long-term deflections of end-span of multi-span beam shown below. Ignore comp steel Beam spacing = 3000 mm b eff = 9000/4 = 2250
THE EC3 CLASSIFICATION OF JOINTS AND ALTERNATIVE PROPOSALS
 EUROSTEEL 2002, Coimbra, 19-20 September 2002, p.987-996 THE EC3 CLASSIFICATION OF JOINTS AND ALTERNATIVE PROPOSALS Fernando C. T. Gomes 1 ABSTRACT The Eurocode 3 proposes a classification of beam-to-column
MECHANICS OF STRUCTURES SCI 1105 COURSE MATERIAL UNIT - I
 MECHANICS OF STRUCTURES SCI 1105 COURSE MATERIAL UNIT - I Engineering Mechanics Branch of science which deals with the behavior of a body with the state of rest or motion, subjected to the action of forces.