2-D and 3-D Assessment of Cambered and Symmetric Airfoils: A CFD Study
|
|
|
- Jonah Caldwell
- 6 years ago
- Views:
Transcription

1 Clemson University TigerPrints All Theses Theses D and 3-D Assessment of Cambered and Symmetric Airfoils: A CFD Study Tuncay Kamas Clemson University, tkamas@clemson.edu Follow this and additional works at: Part of the Operations Research, Systems Engineering and Industrial Engineering Commons Recommended Citation Kamas, Tuncay, "2-D and 3-D Assessment of Cambered and Symmetric Airfoils: A CFD Study" (2009). All Theses This Thesis is brought to you for free and open access by the Theses at TigerPrints. It has been accepted for inclusion in All Theses by an authorized administrator of TigerPrints. For more information, please contact kokeefe@clemson.edu.
2
3 ABSTRACT: A two-dimensional and three-dimensional computational study has been carried out respectively regarding aerodynamic forces affecting a symmetric airfoil, NACA0015 and a cambered airfoil, NACA2414. The negative lift (down force) and drag forces were predicted through the simulation of airflows over inverted rear-wings in different configurations namely; varying incidences i.e. angles of attack of the airfoils -two dimensional cross-section of the inverted rear wings to be mounted on back of a car- and varying speeds of initial airflow. The downforce increases as the angle of attack increases however, if an inverted rear wing is fixed on a car at high angle of attacks the rear-wing starts to stall which is not a desired condition affecting the vehicle stability. Furthermore, the camberness added to the airfoil increased the downforce, which contributes more to the stability concept of the automobile. Consequently, three dimensional simulations have evaluated effects of the 3-D features of the airflow over the rear-wings of a road car. The features are tip vortices along the upper edge, the lower edge and at the tip in addition to the sheet vortex along the trailing edge. The visualizations of the vortex vectors and streamlines explicitly depicted the features. The contour and the 2-D plots of the pressure distribution over the inverted rear-wings, set at angle of attack of 4 o illustrated the effects of the airflow features. The tip vortices and the vortex sheets decrease the downforce. ii
4 ACKNOWLEDGEMENT: I would like to thank my supervisor, Dr. Mohammad Omar for his encouragement and contributions to me during this project. His attributes were very helpful. I would also like to thank my friends in the research group for sharing their knowledge and nice times together, while I was studying. iii
5 TABLE OF CONTENTS: Abstract... ii Acknowledgement... iii List of Figures... vi List of Tables... x Nomenclatures... xi 1. Introduction Literature Review Rearwings on Automobiles Boundary Layer Adverse Pressure Gradient Airfoils Effects of Airfoils Geometry Three Dimenasional Aspects of Wings Computational Fluid Dynamics Reynolds Averaged Navier-Stokes (RANS) Equations Turbulence Modeling Methods One-Equation Turbulence Model a. Spallart Allmaras One-Equation Turbulence Model Two-Equation Turbulence Model iv
6 a. The Standard k-ε Two-Equation Turbulence Model Two-Dimensional Assessment of Cambered and Symmetric Airfoils At Various Angles Of Attack And Speeds: A Cfd Study Geometric Features of the Airfoils and Computational Domains and Flow Properties Validation of the Computational Process Results and Discussion Conclusions for Two-Dimensional Simulations Over the Symmetric And Cambered Airfoils Three-Dimensional Assessment of Cambered and Symmetric Airfoils at Various Angles of Attack and Speeds: A CFD Study Conclusions for Two-Dimensional Simulations Over the Symmetric and Cambered Airfoils...50 Appendix A...53 Appendix B...57 References...61 v
7 List of Figures Figure 2.1. Velocity distribution near a flat plate in a free stream [14]...5 Figure 2.2. Transition of boundary layer along a flat plate [14]...6 Figure 2.3. Illustration of the pressure gradients and streamlines of a flow over a circle...7 Figure 2.4. Illustration of the effect of adverse pressure gradient on velocity profile Figure 2.5. Streamlines in a steady flow over a cambered airfoil...8 Figure 2.6. Pressure distribution over symmetric and cambered airfoils [16]...10 Figure 2.7. Effect of camber on an airfoil s lift coefficient [16]...11 Figure 2.8. Illustration of a wing with a rectangular section[16]...13 Figure 2.9. Contours of axial normal turbulence stress normalized on free stream velocity[17]...14 Figure 3.1. Geometry of the airfoils (a) NACA2414 cambered airfoil (b) NACA0015 symmetric airfoil...27 Figure 3.2. Geometry of the computational domain for NACA0015 correspond the values [13]...28 Figure 3.3. Pressure coefficient and velocity magnitude plots of NACA0015 at AOA= Figure 3.4. Distribution of Pressure coefficient versus position along the lower and upper surfaces of a-) NACA 0015 airfoil and b-)naca 2414 airfoil at AOA=4 degree...30 vi
8 Figure 3.5. Distribution of Pressure coefficient versus position along the upper surfaces of a-)naca 0015 airfoil and b-) NACA 2414 airfoil at AOA=4 degree...33 Figure 3.6. Distribution of Pressure coefficient versus position along the suction surfaces of a-)naca 0015 airfoil and b-) NACA 2414 airfoil at AOA=4 degree...34 Figure 3.7. Distribution of velocity magnitude versus position along the lower and upper surfaces of a-) NACA 0015 airfoil and b-) NACA 2414 airfoil at AOA=4 degree...36 Figure 3.8. The distribution of the pressure coefficient along the airfoil NACA2414 at different angle of attacks...38 Figure 3.9. The distribution of the velocity magnitude of the airflow at different angle of attacks...39 Figure 4.1. Illustration of the 3-D inverted rear wing and the computational domain which represents a wind tunnel...43 Figure 4.2. Plot that depicts negative lift and drag forces over the rearwing versus iteration...45 Figure D plot for pressure distribution versus length obtained from 3-D simulations of airflows over NACA0015 and NACA2415 inverted rearwings at angle of attack of 4 o...46 vii
9 Figure 4.4. Contour plots of pressure distribution on a-) the half-span fictitious plane b-) the wing-tip fictitious plane...47 Figure 4.5. Visualization of tip vortices and vortex sheet...48 Figure 4.6 Contour plot of velocity distribution obtained from the simulation of airflow over the NACA2415 cambered inverted rearwing...48 Figure 4.7. Visualizations of the streamlines generated by simulations of airflows over the NACA2415 and NACA0015 shown respectively...49 Figure A1. Contour plots of a-) dynamic pressure b-) velocity magnitude of NACA2414 at AOA= Figure A2. Contour plots of a-) dynamic pressure b-) velocity magnitude of NACA2414 at AOA= Figure A3. Contour plots of a-) dynamic pressure b-) velocity magnitude of NACA2414 at AOA= Figure A4. Contour plots of a-) dynamic pressure b-) velocity magnitude of NACA2414 at AOA= Figure A5. Contour plots of a-) dynamic pressure b-) velocity magnitude of NACA2414 at AOA= Figure A6. Contour plots of dynamic pressure of NACA0015 at different angle of attacks...55 viii
10 Figure B1. Contour plots of a-) dynamic pressure b-) velocity magnitude of NACA0015 at different angle of attacks...57 Figure B2. Contour plots of velocity magnitude of NACA2414 at different angle of attacks...58 Figure B3. Pathlines of NACA2414 at different angle of attacks...59 Figure B4. Plots for pressure coefficient of NACA2414 at different speeds through Spallart Allmaras turbulence model...60 ix
11 List of Tables Table 3.1. The data regarding drag and inverse lift coefficient of both airfoils with an angle of attack of 4 at the speed of 30 m/s...37 Table 4.1. Negative lift and drag forces for NACA 0015 and NACA x
12 NOMENCLATURES: 1 : Expected flow property that is a function of time Φ : Time averaged flow property ϕ '( t) : The fluctuation of the flow property that is a function of time ρ : Density of the air U: Velocity of the airflow P: Pressure µ: Dynamic viscosity µ t : Turbulence viscosity u ' u ': Reynolds stress term i j k: Kinetic energy per unit mass δ ij : Kronecker delta (0 if i j; 1 if i=j) τ ij : Shear stress tensor ε: Dissipation rate V r : Free stream velocity xi
13 1. INTRODUCTION: Aerodynamics of inverted rearwings of race and road cars has been a major concern in automobile industry due to the need to increase of efficiency of gasoline consumption while increasing the vehicle safety and stability. Therefore, design concepts of airfoils need further attention in order to develop more efficient and more stable automobiles. In inverted wing concept, researchers conduct computational studies regarding downforce (negative lift) and drag forces which affect the design of symmetric or cambered (anti-symmetric) rearwings, mostly two-dimensional and three-dimensional models. Computational investigations of both double-element and single-element inverted wings in ground effect, for instance, have been numerically conducted by Mahon and Zhang in different studies referred to in [1] and [2] respectively. The comparison among six turbulence models was carried out and the outcomes quantitatively obtained while indicating that the k-ε model provided the best predictions of the surface pressure and the wake entities for the downstream airflow domain. For the study of the height clearance effect of an Inverted Double-Element Airfoil [1], nevertheless the same authors indicated that when analyzing the pressure and wake characteristics of a single-element airfoil for ground effects, the k-ω SST provides better predictions of the surface pressure, while the realizable k-ε better predicts the wake flow field at variety of ride heights of the same single-element airfoil. Kieffer et-al [3] conducted a numerical investigation utilizing k-ε model to provide negative lift and drag coefficients plots along with pressure coefficients plots and velocity contours, at different heights and different angle of attacks for a 2D
14 cross section of a front wing. The research indicated the stall condition in high angle of attack (12 and 16 ) complying with the experimental validation for Formula Mazda race car. Ranzenbach et-al [4] numerically simulated 2D cambered airfoil NACA 4412 in two sets of boundary conditions, no-slip wind tunnel and road conditions, where the ground and free-stream flow were moving. [4] introduced and discussed the force reversal phenomena and provided a comparison to symmetrical airfoil NACA Also, the preliminary study in [5] for a symmetric NACA0015 airfoil conducted a comparison using experimental data to validate the computational results for the same set of boundary conditions as those described in [4]. The entity that shall be perceived in this research is symmetricalness and whether there exists any contribution of asymmetric inverted rearwing to the road car on which it is to be mounted. This work shall carry out an investigation utilizing proper turbulence models. Furthermore, in order to computationally investigate both symmetric and asymmetric airfoil models, NACA 0015 symmetric and NACA 2414 asymmetric 2D airfoils were utilized. Also after the study will conduct 2D simulations, it shall be followed by 3D simulations for the inverted rear wing profiles to investigate some of the entities of 3D airflow such as tip vortices that occur about the tips of the inverted rear wings. As computational fluid dynamics methods, the Reynolds Averaged Navier-Stokes Equations (RANS), one equation Spallart-Allmaras, and the two-equation k-ε turbulence models derived from RANS will be employed in this research. Subsonic flow will be taken into account with low baseline Reynolds number which is based on the chord length of 2.01x10 6 in both cases since any automobile has speed which is way lower 2
15 compared to the sound of speed. Boundary layers of the airfoils are meshed with structured grids and rest of the computational domain is meshed with unstructured tridiagonal cells in order to lessen the time to compute. The free airflow velocities are set at 30, 35, 40, 45 and 50 m/s as most of the road cars generally possess for the inverted rearwings set at angles of attack of 0 and 4 degrees and the free-stream velocity is also set at 30 m/s for the inverted rearwings set at the higher levels of angles of attack of 8, 12, and 16 degrees in order to illustrate the stall condition occurring at high level AoAs. Second order accurate upwinding scheme and SIMPLE algorithm are utilized to descritize the Navier-Stokes equations to approach the solution on a commercial simulation software, Fluent The significant properties of the airflow over the 2D airfoils shall be captured to obtain qualitative results so that pressure and velocity contours are investigated in regard to the airflow in the upstream and downstream domains, moreover, the pressure coefficient values along the airfoils top and bottom edges from the leading edges through the trailing edges of both the symmetric and the cambered airfoils. The distances of computational domains are determined as corresponding to the values used by Kieffer et-al in [3]. The solver selected on Fluent was pressure based in order to gain pressure coefficient versus position plots, in addition to other entities regarding the scheme of the solver which are chosen to be implicit and steady flow. Some features would not have been captured without the three dimensional simulation. Vortex sheets and tip vortices are two of these features of the airflow over the inverted rear-wing. These features and their effects on the results from both anti- 3
16 symmetric and symmetric rearwings are to be precisely depicted using some contour plots for pressure and velocity distributions and streamlines visualizations, in addition to the vortex vectors and the velocity vector distribution as well as plots for pressure versus chord length. The plots have been obtained from commercial airflow simulation software, CosmoFloWorks. 2. LITERATURE REVIEW 2.1. REARWINGS ON AUTOMOBILES Wings had been solely and sufficiently used on airplanes by the time middle of the 20 th century; the time when car designers adopted the wings to utilize them on their car designs on optimization purposes, the application of a wing is inherently different from that of an airplane though. Especially, the fact that front wings are too close to the ground, which is commonly known as the ground effect has been one of the major concerns and motivations to have the front wings investigated experimentally and computationally in different ride heights by many researchers and designers for several decades. Another significant difference is generation of downforce which is reverse of lift force therefore the wings were designed for an automobile classifying them as inverted wings. Additionally, the aspect ratio (span/chord length) should be smaller for cars in comparison to that of airplane wings. Having smaller aspect ratio results in higher drag but beside the fact that the drag increases, the benefit is delaying the stall that is the sudden drop of downforce. This disadvantage of the increase of the drag can be eliminated by using endplates [13]. 4
17 Same design strategies and physical phenomena used to refine the design of a wing aerodynamically can be also utilized for inverted wings as being employed in this study for an investigation of the symmetric and the cambered inverted rear wings on a road car.. The phenomena are namely flow separation, vortices, boundary layers and so forth Boundary Layer: velocity locity profile of a viscous flow over a flat plate. The Figure 2.1 illustrates the ve The relative velocity of very small particles on the flat plate is zero with respect to the velocity of the plate. As rising away from the plate into the freestream airflow, the particles become independent nt from the viscous effects. The he velocity of the particles in a certain distance from the flat plate possess possesses the freestream velocity V. Figure 2.1 : Velocity distribution near a flat plate in a free stream from [14] 5
18 The distance where the fluid particles become independent from the viscous effects draws a fictitious layer which is called a boundary layer. The boundary layer along the plate possesses three regions depicted in the Figure 2.2. as; 1- Laminar 2- Transition and 3- Turbulent. The sublayer which has laminar features in the turbulent region of the boundary layer appears in advance. Figure 2.2. Transition of boundary layer along a flat plate. [14] Adverse Pressure Gradient: The simplest definition of a viscous flow is so called Coutte flow and to be employed to explain one of the important aerodynamic phenomena which plays a significant role on airfoils. The flow is basically assumed to be fully-developed, incompressible, laminar and 2-D Newtonian. Airflow over a circular body is depicted by the Figure 2.3. The mass flow rate between two streamlines is always zero. Since the flow is forced to go from a region with high pressure to another with low pressure, in this example, the pressure gradient needs to be negative for the flow to be in positive X 6
19 2 direction. Only the pressure gradient and the shearing stress ( τ u = µ 2 Ψ y for laminar flow) play roles in the governing equations, namely the Navier-Stokes equations which are further simplified by the use of all the assumptions above. Due to the sign convention of the pressure gradient, negative value of the pressure gradient assists the flow in the positive X direction. If the pressure gradient is higher than zero, it forces the flow to go backward through the negative X direction, which results in velocity decrease. Therefore, if the value of pressure gradient is larger than zero then it is called adverse effect and the gradient is adverse pressure gradient. This phenomenon also results in separation of the flow streamlines from the surface of the body over which the fluid passes. Also, the velocity profile significantly changes in the separated flow region of the downstream. Negative values of the velocity appear (Figure 2.4) in the zone of the velocity profile which is closer to the surface. P < 0 x P > 0 x y Ψ=0 x Figure 2.3: Illustration of the pressure gradients and streamlines of a flow over a circle. 7

20 Seperation point V r Figure 2.4 : Illustration of the effect of adverse pressure gradient on velocity profile Airfoils: The streamlines of airflow over an airfoil is indicated in the Figure 2.5. The attached flow, according to the figure, may be defined as the flow when the streamlines near the solid surface go exactly along with the shape of the foil s surface; otherwise the flow is called separated flow. Leading edge Chord length Upper camber Trailing edge Lower camber Streamlines Figure 2.5 Streamlines in a steady flow over a cambered airfoil. 8
21 Chord: A fictitious straight line from the leading edge (the most forward edge) of the airfoil to the trailing edge (the most backward edge) of the airfoil. Camber: The anti-symmetry (maximum distance) between the upper and the lower surface of an airfoil. Chord length: The distance between the trailing edge and the most front point on the leading edge where the chord intersects the leading edge a NACA Airfoils The National Advisory Committee for Aeronoutics (NACA) suggested airfoil figures for aircraft wings. These airfoils are mostly coded by four digit numbers Four Digit Series of NACA The NACA four-digit wing profiles are defined by the following definitions of the codes. - One digit defining the maximum distance between the upper and the lower edges (camber) as percentage of the chord. - One digit defining the distance of maximum camber from the leading edge in tens of percentage of the chord. - Two digits defining maximum thickness of the airfoil as percentage of the chord. For instance, the NACA 0015 is symmetric because the first two digits defines no camber and the NACA 2414 is a cambered airfoil which has a maximum camber 2% located at 40% (0.4 chords) from the leading edge with a maximum thickness of 14% of the chord. 9
22 Effects of Airfoils Geometry: In the 2-D CFD simulation portion of this report, some of the results obtained investigated how effective is the geometry of the airfoils on the velocity and the pressure distributions over a symmetric inverted airfoil and a cambered inverted airfoil. The similar results regarding the geometry of an upward airfoil was obtained by Katz [16] and shown in his book. Herein the results for an upward wing are to be discussed to highlight the 2-D simulation work that has been done for an inverted rearwing. Figure 2.6 Pressure distributions over symmetric and cambered airfoils. [16] The pressure distribution shown on the left hand side of the Figure 2.6 belongs to a symmetric airfoil at an incidence α. The upward arrows indicate that the pressure magnitude on the both top and the bottom surfaces are different while the directions of the pressure distributions are the same. The top surfaces of the airfoils are called suction side as the bottom surfaces are called pressure side due to the larger upward pressure 10
23 magnitude on the upper side in comparison to that of the lower surface. The difference in pressure distribution magnitude on the cambered airfoil depicted on the right hand side of the same figure is larger than that of the symmetric one due to the camber geometry added on the symmetric airfoil. Figure 2.7 Effect of camber on an airfoil s lift coefficient [16]. The variety in the pressure distribution over the symmetric airfoil generates lift force because of the angle of attack. If it had zero angle of attack, there would be no lift force generated due to the symmetry. However, this evidence does not apply for the cambered airfoil so that cambered airfoils generate lift force even at zero angle of attack. 11
24 The lift coefficient versus angle of attack for both cambered and symmetric airfoils is shown in the Figure 2.5. The slope of the straight inclination is 2π. C l = l C (1/ 2) V c 2 l = πα ρ (2.1) where; c: The chord length V : The free stream velocity ρ: The density of the air C l : The coefficient of lift α : The angle of attack π: Three-Dimensional Aspects of the Wings: Aspect Ratio: Aspect Ratio may be defined as a measure of how wide a wing is compared to its chord [16] mathematically defined as : 2 b AR= (2.2) S where S: The wing area and b: The span 12
25 c b Figure 2.8 Illustration of a wing with rectangular section. [16]. For a rectangular wing; AR=b/c where c: chord Tip Vortex: The downforce cannot maintain similar values at inverted rearwing tips as that along its span, also there will be a dramatic decrease in the downforce in the tips. The airflow twists about the wing tips generating two strong vortices initiated by the shedding streamlines nearby the tips. The flow structure along the tip crossection of the inverted rearwing is dominated by vortices with rotational motion. The vortex spirally improves into the wing wake. The vortex imposes some rate of strain which results in various turbulence stress levels along the spiral wake structure. 13
26 Figure 2.9. Contours of axial normal turbulence stress normalized on free stream velocity [17] COMPUTATIONAL FLUID DYNAMICS In order to understand the physical phenomena in terms of aerodynamic forces arisen by an airfoil over which airflow crosses, researchers have used some methodologies to acquire and analyze data. There exist some tools such as computational fluid dynamics (CFD) and wind tunnels. CFD is a complementary tool along with wind tunnels. Wind tunnels are utilized to validate the adequacy of the data acquired from CFD simulations that solve the numerical governing fluid mechanics equations. These governing equations are basically; - conservation of mass, - conservation of momentum (Navier-Stokes equations), - conservation of energy (The first law of thermodynamics), and - simplified boundary layer equations (coming up with the assumptions of initial conditions and boundary conditions). 14
27 In addition, advancements in computer hardware technology enable researchers to develop new computational and numerical techniques, which also lead designers to come up with novel designs through varying the geometry and flow conditions easily. The new computational techniques aided by computer are namely; - finite difference, - finite volume, and - finite element methods. The governing equations which are usually composed of partial differentials need to be stated approximately, so that in the digital environment (can only cover analytical and logical operations) the algebraic or analytical methods, just mentioned above, can be utilized to approach the solution considering accuracy. However one should also remember that the more accurate the computation of flow is and the more complex shape the sample over which the air flow has, the more computer performance and the more time and intelligence are necessary. In this particular research, the upwinding second order accurate finite difference method and implicit algorithm were utilized by the commercial software FLUENT Nevertheless computational fluid dynamics method has some shortcomings. One of those is basically lack of distinguishing the boundaries, for example, in transition between laminar and turbulent flow. It may be easier to explicitly distinguish flow transition around corners of a simple shaped box but can be very complicated for the flow 15
28 transition over a race car. Another shortcoming is that CFD method requires very high performance-computer to numerically resolve the very complex Navier Stokes equations and still might be very time-consuming process in comparison to wind tunnel [4]. The computational investigations have been done using turbulent modeling through Reynolds averaged Navier-Stokes equations (RANS) to model the various parameters such as wake length and vortices behind the rear-wing and different influences of the air flow with different Reynolds numbers based on the chord of the airfoils. Turbulent modeling is a wide subject offering many kinds of models such as the one-equation Spallart-Allmaras model, the standard k-ε model, the k-ω SST model, the k-ε RNG model, the realizable k-ε model, and the standard k-ω model [1]. The accuracy and the compatibility of the results from each computational model with the corresponding experiment results from another study conducted have been investigated in order to validate the computational turbulence models Reynolds Averaged Navier Stokes (RANS) Equations Approaching the precise solution for a turbulence feature at every single time requires very long computational process and high computing power. This is the main reason why researchers prefer to compute the averaged properties of turbulent flow over interval time, which is adequate in many cases. The flow properties (velocities, pressures, and stresses) are overall symbolized by ϕ and time averaged properties (mean velocities, 16
29 mean pressures, and mean stresses) by Φ and formalized. The ensemble average and the fluctuation of the flow properties, ϕ '( t), that is function of time are superimposed so that time averaged flow property is obtained as indicated below: ϕ ( t) =Φ+ ϕ' ( t) (2.3) Reynolds Averaged Navier Stokes (RANS) equations are derived from general Navier Stokes Equations along with the statistical assumption above. Hence; ( ρ i j) U U P U = + µ ρui ' u j ' xi x j xi xi (2.4) whereas µ is the dynamic viscosity and ρ is the fluid density and assumed as a constant while fluctuation of fluid density insignificantly shows up and possesses unimportant effects on the flow up to around Mach number 3-5 [8]. Since in this particular case of the research, as investigating subsonic flow over a car, i.e. much smaller than Mach number 1, the density does not importantly fluctuate, thus indeed the fluctuation is assumed as zero and the density as a constant. The correlation between the density and both velocity fluctuation components is named as Reynolds stress and is non-zero while two fluctuations of the velocity components are statistically dependent on one another. Therefore Reynolds stress term is an additional unknown and needs to be solved to obtain the resolution of the RANS equations. Boussinesq s assumption is suggested to relate the Reynolds stress to constant turbulent viscosity by the following equation; U U i j 2 U k 2 ρ ui ' u j ' = µ t + δij ρkδ ij x j xi 3 x k 3 (2.5) 17
30 Where k represents the kinetic energy per unit mass and the equation below defines k as the half of the production from the correlation between two velocity fluctuation components; ui ' uj ' k= 2 (2.6) The mean flow features along with the effects of turbulent fluctuations averaged out the turbulence through Reynolds stress ρu ' u '. The various models have been developed regarding turbulent flows employing RANS in the range from the oneequation turbulent models to Reynolds-stress model. RANS models enable users to obtain sufficiently promising resolution rapidly and do not require too much power consuming process. Therefore RANS equation is chosen for this particular inverted rearwing project and the methods are further discussed in the later sections. i j Turbulence Modeling Methods The resource in regard to an M.S. thesis needs to be acknowledged at this point since Vu from Cranfield University had utilized the same one-equation Spallart-Allmaras and the two equation standard k-ε turbulence models along with the Reynolds Stress Model (RSM) in order to predict the coefficients of drag and lift (downforce) corresponding to various clearance [9] (i.e. ride height which is defined as the distance between the most bottom point of the lower edge of an inverted airfoil and the ground) of a frontwing of a race car. The Reynolds stress model has been chosen in Vu s research to 18
31 precisely predict the results although the RSM requires more time and more powerful hardware in contrast to being less robust. However the limitations in predicting the performance for the case of highly turbulent flows, due to additional sources accumulating additional forces in which Boussinesq s assumption fails, the third turbulence model, RSM, has been suggested by Vu to better simulate the vortices in the downstream domain. Bousinessq s assumption is defined in a referred book named Computational Methods for Fluid Dynamics by Ferzeiger et al. [12] as the density of the fluid is assumed to be a constant in the unsteady and convection terms of the N.S. equations whereas the density does not vary largely if the temperature variation is small One-Equation Turbulence Models In order to include the effects from history of flow and to predict wake length, a transport equation is derived from Navier-Stokes equation. If one transport equation is included in the model, it is called one-equation turbulence model and many kinds of oneequation turbulence models have been proposed over the past a few decades and one of them shall be present in this section. 19
32 a Spallart-Allmaras One-Equation Turbulence Model Spallart-Allmaras depicts good agreement with experimental data and improvement in prediction especially in subsonic flow since the model elaborates more equation or the eddy-viscosity and more function describing the turbulence length scale as David C. Wilcox postulated in Turbulence Modeling for CFD. Spalart-Allmaras method is being used to evaluate a transport equation; therefore, firstly, the transport equation is derived from Navier-Stokes equations in order to represent variety of physical factors of turbulence in airflow such as viscidity, convection and dissipation throughout the realm of turbulence. Turbulence Kinetic Energy (TKE) equation, i.e. transport equation is shown below; k 1 U j ( ρ Uik) = µ + p' ui ' + ρui ' u j ' ui ' + ρui ' u j ' + ρε y xi xi xi 2 xi (2.7) or could be expressed as the following; µ t k ( ρk) + ( ρ u jk) = µ + + Pk ρε y x j x j σ k xi (2.8) where; µ t represents the eddy-viscosity which refers to the ratio between a turbulence U V magnitude ( ρ u ' v ') and a mean flow magnitude ( + y x ) although neither turbulence entities k and l nor mean flow entities is pursued by µ t and accordingly µ = ρ in 1/2 t k l 20
33 ui u equilibrium flows [2]. Pk = ρui ' u j ' = τ ij x x j i j term represents the production which is rate of the average flow s kinetic energy transfer to turbulence, herein the large size exchange of momentum exists due to turbulence flow is represented by the term of turbulence shear stress or so called Reynolds stress ( ρui ' u j ' ) denoted by τ ij. µ t k x j σk xi term represents diffusion term, x j k µ xi term denotes the work by turbulence viscous stress whereas ui ' ui ' ρε = µ x x j j term refers to turbulence viscous dissipation as each term of the equation refers to various physical aspects of turbulent flow domain [8] The governing equation of Spallart Allmaras turbulence model solving the transport equation for the eddy viscosity related parameter υ was derived as nondimensionalized and in computational space. The nondimensional variables were obtained from the following fractions; * tu t =, L x =, L * x y * µ =, µ =, L * y µ ρ =, * ρ ρ υ =, * υ υ υ υ =, * t t υ k * = k 2 u L =, u * ε ε 3 *2 * Re T = k* * υ ε (2.9) where the variables are defined as; Re T : the turbulence Reynolds number k: the turbulence kinetic energy 21
34 ε: the dissipation of turbulence υ: the kinematic viscosity µ: the turbulence viscosity ρ: the density of the fluid and nondimensional form of the governing equation in Cartesian coordinate is transformed into computational space using the transformation expressions below; = ξx + ηx x ξ η (2.10) = ξ y + η y y ξ η (2.11) ξx ηx ξx ηx = ξ 2 2 x + ξη 2 x x + ηx + ξ 2 x + + ηx + x ξ ξ η η ξ ξ η η η ξ η η ξ y η y ξ y η y = ξ 2 2 y + ξη 2 y y + ηy + ξ 2 y + + ηy + y ξ ξ η η ξ ξ η η η ξ η η (2.12) As Hoffman et-al proposed in Ref [8], the transformation yields the following form of the Spallart-Allmaras turbulence model governing equation in computational space; 22
35 υ υ υ 1 1+ c t b2 + U + V = ξ η Re σ υ υ υ υ a4 ( υ+ υ) + b4 ( υ+ υ) + c5 ( υ+ υ) + ( υ+ υ) ξ ξ η η η ξ ξ η υ υ υ υ υ + ( υ+ υ ) a c5 + b4 + g g2 Re σ ξ ξ η η ξ η 1 υ + cb 1(1 ft 2) Sυ ( cw 1 fw) Re d cb 1 υ 2 + ((1 2 ft 2) fv2+ ft 2) + Re ft1( q) Re κ d (2.13) where u u v v S = ξ y + η y ξx ηx ξ η ξ η (2.14) and the coefficients defined as the followings; a b c g g = ξ + ξ 2 2 x y = η + η 2 2 x y = ξη + ξ η x x y y ξ x ξ ξ x y ξ y = ξx + ηx + ξ y + η y ξ η ξ η ηx η η x y η y = ξx + ηx + ξ y + η y ξ η ξ η (2.15) 23
36 and the constants; 2 σ = 3 c = c b1 b2 = cb 1 cw 1= + 2 ( 1 + cb 2) / σ κ κ = 0.41 κ :Von Karman constant Since the governing equation is a semi-empirical equation, the constants are suggested from experimental investigations. The models need to be adjusted at different levels of flow such as from wallbounded to free-shear flows, i.e. flow over a trailing edge of an airfoil [2]; Therefore, the more accommodating model to various kinds of flows is, the more universal model is, particularly in this research, for separated flows over an airfoil, transport effects on the turbulence length scale shall be taken into account. In order to achieve the universal model, in the next section, a two equation model suggested by many publications as a good representation of physical phenomena behind turbulent flows in general will be discussed Two Equation Turbulence Model Two equation turbulence models deal with more complex flow domains which may cover multi-length scales, highly separated and unsteady flows in comparison with 24
37 one, half, or zero equation turbulence models. Two equation turbulence models are 2 generally based upon Bousinessq approximation τ ij = 2µ Sij ρkδij (2.16) 3 where; τ ij : The Reynolds-stress tensor S ij : The mean strain-rate tensor [2]. The main characteristic of this type of the model is to possess two transport equations. These transport equations are so called the turbulent kinetic equation and the dissipation rate equation that will be investigated in the section of the k-ε Two-Equation Turbulence Model a The Standard k-ε Two-Equation Turbulence Model The most popular approach among the two-equation turbulence models is k-ε model according to the sources [7], [8], and [12]. Two partial differential equations derived from Navier-Stokes equations are known as transport equations and further employed to evaluate CFD problems regarding turbulent flow fields resulted from to surface roughness, convection, and dissipation. In this section, turbulent kinetic equation (TKE), as introduced in the section a, and the dissipation rate equation are introduced herein and employed by the model named k-ε Two-Equation Turbulence Model. The model has been postulated to be worth being preferred for complex turbulent flowfield due to its ability of computation of not only k (kinetic energy of turbulence) but 25
38 also of turbulence length scale; therefore as a result the model was assumed to be a complete model [7]. The turbulent kinetic equation in Cartesian coordinates with respect to two dimensional flowfields is as the following; k k k µ t k µ t k ρ + u + v = ( µ + ) + µ + + Pk ρε t x y x σ k x y σ k y (2.17) where P k is the production of turbulence and Pk τij( ui / x j) = (2.18) The dissipation rate equation in Cartesian coordinates in two dimension is; 2 ε ε ε µ t ε µ t ε ε ε ρ + u + v = µ + + µ + + cε 1Pk cε 2ρ dt dx dy dx σε dx dy σε dy k k (2.19) where the constants are σ k =1.0 σ ε =1.3 σ ε1 =1.44 σ ε2 =1.92 and µ t is the turbulent viscosity and 2 k = in relation with ε and with c µ =0.09 [8] ε µ t ρc µ 26
 (b) Figure 3.")
39 3. TWO-DIMENSIONAL ASSESSMENT OF CAMBERED AND SYMMETRIC AIRFOILS AT VARIOUS ANGLES OF ATTACK AND SPEEDS: A CFD STUDY 3.1 GEOMETRIC FEATURES OF THE AIRFOILS AND COMPUTATIONALDOMAINS ANDFLOW PROPERTIES: (a) (b) Figure 3.1: Geometry of the airfoils (a) NACA2414 cambered airfoil (b) NACA0015 symmetric airfoil The airfoils utilized in this study are NACA 2414 cambered (asymmetric) and NACA0015 asymmetric airfoils and the point data files identifying the shape of the airfoils are obtained from UIUC Airfoils Coordinates Database at the webpage link The chord of the both airfoils c is 1000 mm and the angle of attack determined is 0,4,8,12, and 16 degrees as the features of the airfoils are indicated in Figure 3.1. The origin of the Cartesian coordinate system is located right in the most front point of the leading edge of the airfoil. The structured mesh of boundary layer region and the unstructured mesh are also demonstrated in the Figure
40 The Reynolds number based on chord length is determined 2.01x10 6 along with the baseline freestream velocity of 30 m/s in both cambered and symmetric cases. (-1.75, 2.59) (4, 2.59) y x (-1.75, -2.59) (4, 2.59) Figure 3.2: Geometry of the computational domain for NACA0015 correspond the values from In Figure 3.2, the x, y coordinate of the computational domain corners are given corresponding to the values given by Kieffer et-al. A velocity inlet boundary condition for the upstream boundary and an outlet vent boundary condition for the downstream boundary are set at a uniform velocity profile of 30 m/s for the baseline simulation and the gauge pressure is set zero and slip boundary condition is imposed. 28
41 3.2. VALIDATION OF THE COMPUTATIONAL PROCESS: As a preliminary study the Spallart-Allmaras method had been utilized, it can be said that the Spallart-Allmaras one-equation turbulence model can be employed to capture only the major changes in the surface pressure features along the surfaces of the symmetric airfoils. The cambered airfoil possesses enough complexity in terms of its feature for the turbulence model employed not to be used to capture sharp pressure diversity such as stagnation pressure on the leading edge and the suction peak along the suction surface (lower one in the inverted case). Consequently it was decided to use the k-ε turbulence model as a two-equation turbulence model since the two equation model provides more accurate results in comparison to the one-equation model, Spallart- Allmaras model. The validation process has also been carried out via the realization of a simulation of the symmetric airfoil at zero angle of attack. Figure 3.3: Pressure coefficient and velocity magnitude plots of NACA0015 at AOA=0 29
42 The Figure 3.3 of pressure coefficient plots obtained from the simulation of the airflow over NACA0015 symmetric airfoil can be used as well as the velocity magnitude plots to verify the computational method utilized. The distribution of the value points of the pressure coefficients on both the upper edge and lower edge should be conflicting with fully agreement along the chord length due to the symmetry of the airfoil and the absence of an angle of attack. Since the two curves are in very close agreement with only negligible fluctuations in the region nearby the leading edge and with even more little ones in the vicinity of the trailing edge, one can conclude that the turbulence method, the scheme, and the algorithm chosen provided proper and applicable results from which more conclusions can be drawn. The similar observation can be carried out on the plot which depicts the velocity magnitude distribution of the same symmetric airfoil at zero angle of attack. 3.3 RESULTS AND DISCUSSION: a-) b-) Figure 3.4. Distribution of Pressure coefficient versus position along the lower and upper surfaces of a-) NACA 0015 airfoil and b-) NACA 2414 airfoil at AOA=4 degree 30
43 A qualitative evaluation of the comparison between the two airfoils was conducted to have better understanding of whether a contribution exists via the cambered airfoil to desired pressure distribution. The most outstanding contribution might happen in the vicinity of the trailing edges because, significant flow phenomena such as separations, transition to turbulence starts forming about the trailing edge and wake is also generated in the downstream domain led by the trailing edge. Moreover some significant airflow phenomena also occur about the leading edge such as suction peak and stagnation pressure. Suction peak was defined as the value of maximum suction along the lower surface of the inverted airfoil in [9] by Mahon et-al. Stagnation pressure may be defined as a static pressure at stagnation point that is in the front of the leading edge where the local velocity of the flow is zero thus the static pressure has its maximum magnitude. Suction peak and subsequently stabilized surface pressure along the suction surface of the NACA 0015 symmetric airfoil was captured as -1042Pa by the turbulence model approximately at x/c of as can be seen in Figure 3. Suction peak value of Cp of the cambered airfoil was larger than that of the symmetric airfoil and appears at further location in x direction over which the distribution of Cp smears away. A pressure gradient on the suction surface of the NACA 0015 is in the inclination form in the downstream of the leading edge whereas the pressure increase is more likely linear along the suction surface of the NACA 2414 airfoil. The distributions of the pressure coefficient values for the two airfoils appear to be in close agreement along the pressure (upper) surface. They appear at the largest values and begin a sharp decrease up to zero of C p s at the stagnation point; however the 31
44 pressure declination of that of the cambered airfoil is sharper. One can realize that there exists only a slight difference, as decreasing, between the C p distributions of NACA 0015 and NACA However, on the suction surfaces, a large discrepancy occurs. The large variety on the C p distribution along the suction surface draws attention and a contribution of the cambered airfoil in terms of higher magnitude of downforce (inverse lift) and more stability can be presumed through this diversity. Therefore, the pressure difference between the upper and lower surfaces of the symmetric airfoil is significantly less in comparison to that of the cambered airfoil. Consequently, it is evident such that the cambered airfoil causes more downforce than the symmetric one in the same angle of attack of 4 degree as might be desired for the stability concern of the car. Pressure gradient with respect to X position along the chord length of NACA0015 at angle of attack of 4 o, in Figure 3.5, reaches the smallest value between on the upper edge at the speed of 50m/s. In the same interval of X position along the length, the discrepancies also appear where the pressure value decreases as the airflow accelerates. The pressure values at all speeds of airflow happen to meet about Cp of zero at X position of 0.85 on both lower and upper edges where the turbulence flow starts to be generated. The reverse pressure gradient phenomenon is also to start at the same time, which forces the velocity magnitude to dramatically decrease. This phenomenon can also be observed on the plot which demonstrates the velocity magnitude along the upper edge of the same symmetric airfoil. The decrease in velocity and reversed pressure result in separation and the boundary layer around the trailing edge turns into wake generated 32
45 right behind the trailing edge. The thickness of the generated wake became larger as the airfoils were set at the higher angle of attacks. a-) b-) Figure 3.5. Distribution of Pressure coefficient versus position along the upper surfaces of a-)naca 0015 airfoil and b-) NACA 2414 airfoil at AOA=4 degree Since the airfoil is symmetric, one can see the same region at X position of 0.85 on the lower edge to be hosting the same reverse pressure gradient phenomenon however the distribution of the pressure coefficient values are to be in different manner, gradually increasing up to around zero value of Cp along the lower edge of the airfoil. The difference in the magnitude between Cp along the upper edge and that along the lower edge can also be obviously realized due to the sharp decrease of Cp 33
46 a-) b-) Figure 3.6. Distribution of Pressure coefficient versus position along the suction surfaces of a-) NACA 0015 airfoil and b-) NACA 2414 airfoil at AOA=4 degree value between the X position of 0.01 and 0.02 on the lower edge of NACA0015, which is above called the suction peak. The higher the speed of the air flow over both airfoils, the lower the pressure along the chord length until the region nearby the trailing edge. The pressure values at different speeds match about zero pressure in the vicinity of the trailing edge of the both airfoils. The negative pressure values on the suction surface avail the airfoil to fulfill the generation of the downforce that will be used for more stability when the car speeds up. Inspecting Figure 6, one can observe that the pressure values are even lower up to Pa on the plot, which belongs to the cambered airfoil, NACA2414 when the car speeds up to 50 m/s then this figure also shows that the cambered airfoils enable an 34
47 aerodynamicist to obtain higher down-force by mounting a cambered rearwing behind the car. The analysis of velocity magnitude was assessed by the simulation over both airfoils as well. As already mentioned on the discussion of the pressure diversity, the velocity magnitude of the flow over the airfoils also varies as seen in Figure 6. As always referred to Bernoulli equation while explaining the relationship between pressure and velocity, also herein, the diversity in velocity can be explained through the same relationship concluding that the change in velocity magnitude along the upper and the lower edges is strongly related to the corresponding pressure change. Figure 6.a highlights this concept, illustrating that the velocity increases on the pressure surface while the velocity on the suction surface decreases up to the X position of 0.1 so that the largest discrepancy appears in the upstream and gradually shrinks along the leading edge of the symmetric airfoil down to the X position of 0.2. The velocity magnitude at that point was captured as 26 m/s. The down-force was, as postulated, generated by the difference in pressure, hence, indirectly by the difference in velocity i.e. the lower velocity along the pressure side and the higher velocity along the suction side there exist, the higher downforce can be generated. Therefore, the downforce was evaluated at its highest value at the most front of the leading edge and decreases down to zero and since the difference in velocity increases along the chord length as depicted on Figure 6.a, the downforce also increases upto the trailing edge. 35
48 a-) b-) Figure 3.7. Distribution of velocity magnitude versus position along the lower and upper surfaces of a-) NACA 0015 airfoil and b-) NACA 2414 airfoil at AOA=4 degree The feature of NACA0015 is more curved on the leading edge in comparison to that of NACA2414; therefore the velocity of the airflow over NACA0015 is higher than the velocity of the airflow over NACA2414, especially on the leading edge. However, the discrepancy between the pressure and the suction surfaces of the cambered airfoil is larger in comparison to that of the symmetric airfoil. As it can be concluded that the downforce generated along the chord length of NACA2414 is higher, in most of the region, with comparing to the downforce magnitude along the NACA0015. For instance, the inverse lift (downforce) coefficient was assessed on the points in the vicinity of the trailing edges of both airfoils. The data regarding downforce and drag coefficients are on Table 3.1. Since the discrepancy became larger due to the camber; as a result, the 36
49 cambered airfoils contribute better to the stability due to the generation of the higher downforce. NACA 0015 AOA=4 NACA 2414 AOA=4 Speed [m/s] C L C D C L C D Table 3.1. The data regarding drag and inverse lift coefficient of both airfoils with an angle of attack of 4 at the speed of 30 m/s The camber also results in, as can be obviously seen on the table, higher drag coefficient which is not desired because it results in lower performance due to the resistance against the airflow in road conditions. The higher drag may also be a cause of lower fuel efficiency i.e. more gasoline consumption. This increase in drag coefficient should also be taken into account with the sustainability concerns in design concepts and one might consider the optimization with respect to drag and inverse lift coefficients. 37
50 Figure 3.8. The distribution of the pressure coefficient along the airfoil NACA2414 at different angle of attacks 38


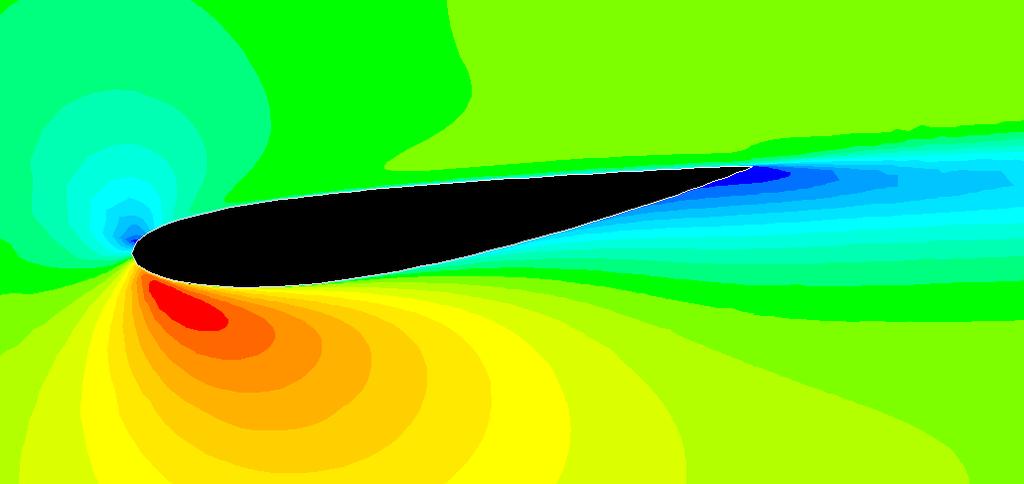
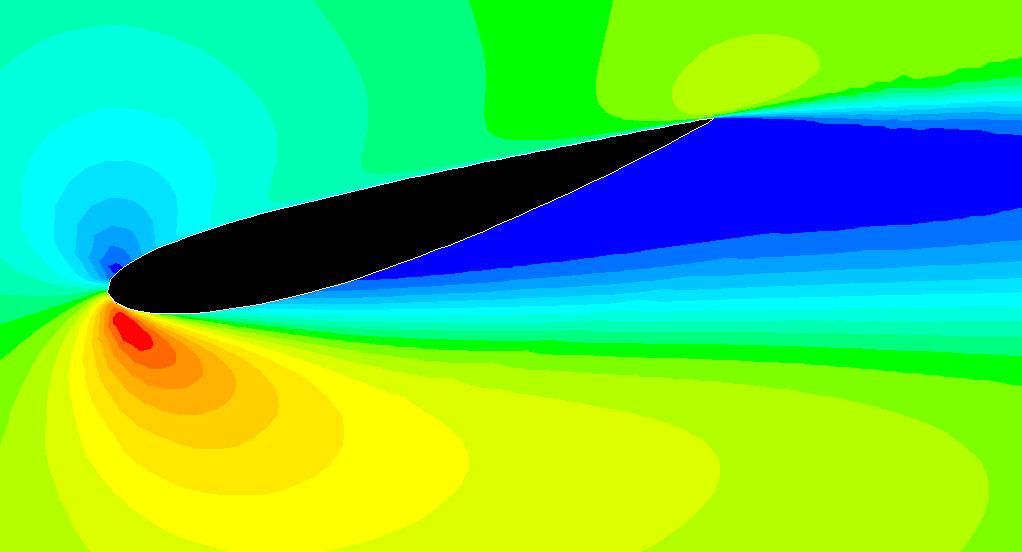
51 AOA=0 AOA=4 AOA=8 AOA=12 AOA=16 Figure 3.9. The distribution of the velocity magnitude of the airflow at different angle of attacks As discussed earlier, the distribution of the velocity magnitude which can be seen on the Figure 7 is symmetric on the both upper and lower edges of NACA0015 at angle of attack of zero so that there exists no downforce along the chord length. At the most front point of the leading edge in this zero AOA and symmetric airfoil case, the stagnation pressure point where the velocity magnitude is zero can be obviously realized. 39
52 The symmetry in the distribution of the velocity magnitude disappeared when the AOA was switched to 4 degree. The stagnation point on the leading edge slid upright as the wake thickness in the downstream led by the trailing edge was enlarged. The improvement of the wake thickness is evidence that the separation which is still nearby the trailing edge occurred earlier i.e. turbulence flow was generated earlier as compared to the airfoil in the lower angle of attack. The velocity magnitudes are in very low levels around the stagnation point on the leading edge and in the wake generated in the downstream domain. Besides that, the velocity values remained at the highest level, as expected, about the most curved region of the lower edge. The angle of attacks of the higher values than 8 degree resulted in the distribution of velocity beyond the desires such as lift force instead of downforce. The AOA up to 8 degree caused the generation of downforce since the velocity distribution over the upper and lower edges differed from one side to another. The separation started in the closer region to the leading edge as the airfoil was set at over 8 degree and the airflow over the lower edge kept decelerating in the bigger zone due to the growth of the wake in terms of length and thickness. This phenomenon arisen by increase of AOA over 8 degree may result in lift force instead of downforce as can be observed in Figure 9 and more obviously in Figure B3 in the Appendix B. The same incidence that was called stall condition by Kieffer et-al in Ref. 10 might be observed on the demonstration of the cambered airfoil set at the corresponding angles of attack. The same conclusion could be drawn regarding the cambered airfoil since fundamentals of the incidences occurring in both cases should be 40
53 the same eventhough the location or the sizes of the wake and velocity distribution might be slightly different. (Appendix A) 3.4. CONCLUSIONS FOR TWO-DIMENSIONAL SIMULATIONS OVER THE SYMMETRIC AND CAMBERED AIRFOILS: The symmetric airfoil NACA0015 and NACA2414 are simulated at different speeds and at different angles of attack through the commercial airflow simulation software Fluent. The velocity and pressure distributions were obtained and plugged in the plots shown; comparing the differences regarding the cambered feature and the symmetric feature of two types of the airfoils. Consequently, first of all, the downforce generated along the chord length of NACA2414 was higher, in most of the region, with comparing to the downforce magnitude along the NACA0015. Second of all, because the discrepancy became larger due to the camber; the cambered airfoils better contribute in regard to stability due to the generation of the higher downforce which will affect the rear axis of the car and make the cornering and speeding under better control. The incidence of stall condition was explained via the contour plots that depict velocity magnitude distribution. This phenomenon arisen from the increase of the angles of attack of 8 and over 8 degree may result in lift force instead of downforce. The same conclusion could be drawn regarding the cambered airfoil since fundamentals of the incidences occurring in both cases should be the same. The camber also causes higher drag coefficient which is not desired due to its negative effect on performance because of the increased resistance against the airflow in 41
54 road conditions. The higher drag may also result in more gasoline consumption. This increase in drag coefficient should also be taken into account with the sustainability concerns in design concept and one might consider the optimization with respect to drag and inverse lift coefficients as a future work. 4. THREE-DIMENSIONAL ASSESSMENT OF CAMBERED AND SYMMETRIC AIRFOILS AT VARIOUS ANGLES OF ATTACK AND SPEEDS: A CFD STUDY Negative lift (downforce) and drag force predictions have been evaluated through three dimensional simulation of airflow over an anti-symmetric airfoil NACA2415 and a symmetric airfoil NACA0015 by use of commercial software, COSMOFLO-WORKS module of Solidworks. Firstly, the airfoil spanned by aspect ratio of 5 generated on Solidworks as a 3-D geometric model of the inverted rearwing. A rear wing set at angle of attack of 4, as an example, can be seen in the Figure 4.1. The boundaries of the computational domain of 3-D models in size and in mathematical definition were set as same as those of 2-D models in the project for the computational simulation of the wind tunnel model. 42

55 Figure 4.1. Illustration of the 3-D inverted rear wing and the computational domain which represents a wind tunnel. Simulation continued until the convergence criteria were satisfied. The negative lift and drag forces became unchangeable in iteration domain so that convergence occurred and computation completed as seen in the Figure 4.2. Visualization of the outcomes obtained from the simulation was observed to result in qualitative and quantitative predictions. Table 4.1 includes the downforce (negative lift) and drag force results for the both symmetric and anti-symmetric rearwings. 43
56 NACA0015 NACA2415 Negative lift Drag Table 4.1. Negative lift and drag forces for NACA 0015 and NACA 2415 The downforce value for NACA0015 is lower as compared to that of NACA2415 due to the camber added as explained in the literature review section and also it is the same conclusion as that drawn from the 2D simulations. The drag value did not significantly change when the camber was added as seen in the Table 4.1. Some of the consequences drawn from the comparison of the two types of rearwings are also shown herein by some visualization of streamlines, distribution of the vortex vectors and velocity vectors over the rearwing. The streamlines were observed, for instance, in different manner about the tip of the rear-wing model from the spanwise of it, which is so called tip vortices caused by swirling flow feature around the tip. 44
57 Figure D plot that depicts negative lift and drag forces over the rearwing versus iteration The difference between the flow feature nearby the tips and the rest of the inverted rear-wing is depicted by use of two contour plots for pressure distributions, one for pressure distribution on tip surface plane and the other is for pressure distribution on half-span surface plane. The pressure distribution on semi-span surface plan is alike and somewhat straightforward as the 2-D results of the pressure distributions as expected. As can be observed in the Figure 4.4 of the distribution on the tip surface fictitious plane, the pressure difference between the upper surface and the lower surface significantly decreased as causing less downforce. 45
58 The pressure distributions along the upper and lower edges at the tip of the inverted rearwings through a 2D plots for pressure vs length can be seen in Figure 4.3 as well NACA0015 [AOA4] Pressure (Pa) Length (m) NACA2415 [AOA4] Pressure (Pa) Length (m) Figure D plot for pressure distribution versus length obtained from 3D simulations of airflows over NACA0015 and NACA2415 inverted rearwings at angle of attack of 4 46


59 The suctions peaks on both plots are similar with the pressure value of Pa. No significant variation appear between the pressure distributions over the leading edges of both symmetric and anti-symmetric rearwing tips but the variation begins to appear at the region where the separation occurs and the variation between the pressure distributions along the upper and lower edges of the tips of the both rearwing appears up to the trailing edges. Moreover, the separations happen to be at different points on the NACA0015 and NACA2415 rearwing tips. The suction peak pressure is demonstrated as Pa at the stagnation point on the leading edge. The pressure values were distributed in low variety on the edges at the tip due to the flow there has a swirling feature. a-) b-) Figure 4.4. Contour plots of pressure distribution on a-) the half-span fictitious plane b-) the wing-tip fictitious plane. 47


60 The best observation of the tip vortices and the vortex sheet can be made through the vortex vector visualization obtained from the simulation in Figure 4.5. Figure 4.5. Visualization of tip vortices and vortex sheet. Figure 4.6 Contour plot of velocity distribution obtained from the simulation of airflow over the NACA2415 cambered inverted rearwing. 48

61 Figure 4.7. Visualizations of the streamlines generated by simulations of airflows over the NACA2415 and NACA0015 shown respectively 49
62 4.1. CONCLUSIONS FOR THREE-DIMENSIONAL SIMULATIONS OVER THE SYMMETRIC AND CAMBERED AIRFOILS: The swirling features of the airflows over the both symmetric and cambered rearwings were explicitly depicted by the three-dimensional simulations using the commercial software, CosmoFloWorks bysolidworks. The airflow feature, so called tip vortices and the other feature, vortex sheet, resulted in decrease in terms of downforce. Since the length scale of the tip vortices is larger for the cambered rearwing compared to that for the symmetric one, the downforce on the cambered rearwing more decreases due to the tip vortices than the downforce on the symmetric rearwing i.e. the larger tip vortices were generated, the more the downforce decreases due to the tip vortices. The decrease in the downforce can be prevented as a feature work by an aerodynamicist designer using end plates that prevent the airflow from shedding at the tips of the rearwings. The downforce generated by use of 3-D cambered inverted rearwing set at angle of attack of 4 o was %27.58 higher in comparison to that of 3-D symmetric rearwing at the same angle of attack. Although, the drag force affecting on the cambered rearwing also became %10 higher, which is not a desired increase for an aerodynamicist designer concerning to have better efficiency in terms of fuel consumption. The other concern of better stability could be sufficiently satisfied by adding the camberness possessing significantly higher downforce beside the handicap arisen from the increase of the drag with the camberness. An optimization between the stability and the fuel efficiency i.e. 50
63 between the drag forces and the dowforces on the symmetric and the cambered inverted rear-wings should be pursued in a future study. 51
64 52
 b-) Figure A1 : Contour")
 b-) Figure")
 b-) Figure A3 : Contour magnitude of")
65 APPENDIX A: CONTOUR PLOTS THROUGH THE k-ε TURBULENCE MODEL a-) b-) Figure A1 : Contour plots of a-) dynamic pressure b-) velocity magnitude of NACA2414 at AOA=0 a-) b-) Figure A2 : Contour plots of a-) dynamic pressure b-) velocity magnitude of NACA2414 at AOA=4 a-) b-) Figure A3 : Contour plots of a-) dynamic pressure b-) velocity magnitude of NACA2414 at AOA=8 53
 dynamic pressure b-)")
 b-) Figure A5 : Contour")
66 a-) b-) Figure A4 : Contour plots of a-) dynamic pressure b-) velocity magnitude of NACA2414 at AOA=12 a-) b-) Figure A5 : Contour plots of a-) dynamic pressure b-) velocity magnitude of NACA2414 at AOA=16 54


67 AOA=0 AOA=4 AOA=8 AOA=12 AOA=16 Figure A6: Contour plots of dynamic pressure of NACA0015 at different angle of attacks 55
68 56


 b-)")
 dynamic")

69 APPENDIX B CONTOUR PLOTS VIA THE SPALLART-ALLMARAS TURBULENCE MODEL AOA=0 AOA=0 AOA=4 AOA=4 AOA=8 AOA=8 a-) b-) Figure B1: Contour plots of a-) dynamic pressure b-)velocity magnitude of NACA0015 at different angle of attacks 57


70 Figure B2: Contour plots of velocity magnitude of NACA2414 at different angle of attacks 58


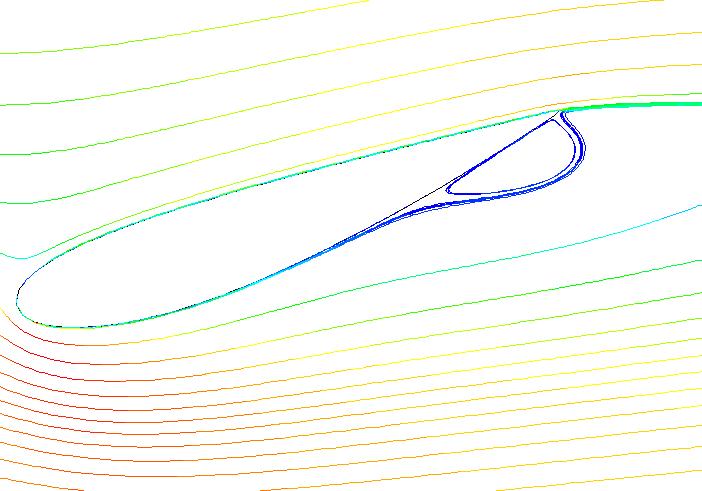
71 Figure B3: Pathlines of NACA2414 at different angle of attacks 59
COMPUTATIONAL SIMULATION OF THE FLOW PAST AN AIRFOIL FOR AN UNMANNED AERIAL VEHICLE
 COMPUTATIONAL SIMULATION OF THE FLOW PAST AN AIRFOIL FOR AN UNMANNED AERIAL VEHICLE L. Velázquez-Araque 1 and J. Nožička 2 1 Division of Thermal fluids, Department of Mechanical Engineering, National University
Turbulent Boundary Layers & Turbulence Models. Lecture 09
 Turbulent Boundary Layers & Turbulence Models Lecture 09 The turbulent boundary layer In turbulent flow, the boundary layer is defined as the thin region on the surface of a body in which viscous effects
Manhar Dhanak Florida Atlantic University Graduate Student: Zaqie Reza
 REPRESENTING PRESENCE OF SUBSURFACE CURRENT TURBINES IN OCEAN MODELS Manhar Dhanak Florida Atlantic University Graduate Student: Zaqie Reza 1 Momentum Equations 2 Effect of inclusion of Coriolis force
Masters in Mechanical Engineering. Problems of incompressible viscous flow. 2µ dx y(y h)+ U h y 0 < y < h,
+ U h y 0 < y < h,") Masters in Mechanical Engineering Problems of incompressible viscous flow 1. Consider the laminar Couette flow between two infinite flat plates (lower plate (y = 0) with no velocity and top plate (y =
Masters in Mechanical Engineering Problems of incompressible viscous flow 1. Consider the laminar Couette flow between two infinite flat plates (lower plate (y = 0) with no velocity and top plate (y =
A Computational Investigation of a Turbulent Flow Over a Backward Facing Step with OpenFOAM
 206 9th International Conference on Developments in esystems Engineering A Computational Investigation of a Turbulent Flow Over a Backward Facing Step with OpenFOAM Hayder Al-Jelawy, Stefan Kaczmarczyk
Mestrado Integrado em Engenharia Mecânica Aerodynamics 1 st Semester 2012/13
 Mestrado Integrado em Engenharia Mecânica Aerodynamics 1 st Semester 212/13 Exam 2ª época, 2 February 213 Name : Time : 8: Number: Duration : 3 hours 1 st Part : No textbooks/notes allowed 2 nd Part :
Given the water behaves as shown above, which direction will the cylinder rotate?
 water stream fixed but free to rotate Given the water behaves as shown above, which direction will the cylinder rotate? ) Clockwise 2) Counter-clockwise 3) Not enough information F y U 0 U F x V=0 V=0
Explicit algebraic Reynolds stress models for internal flows
 5. Double Circular Arc (DCA) cascade blade flow, problem statement The second test case deals with a DCA compressor cascade, which is considered a severe challenge for the CFD codes, due to the presence
CHAPTER 4 OPTIMIZATION OF COEFFICIENT OF LIFT, DRAG AND POWER - AN ITERATIVE APPROACH
 82 CHAPTER 4 OPTIMIZATION OF COEFFICIENT OF LIFT, DRAG AND POWER - AN ITERATIVE APPROACH The coefficient of lift, drag and power for wind turbine rotor is optimized using an iterative approach. The coefficient
Active Control of Separated Cascade Flow
 Chapter 5 Active Control of Separated Cascade Flow In this chapter, the possibility of active control using a synthetic jet applied to an unconventional axial stator-rotor arrangement is investigated.
Flow field in the compressor blade cascade NACA
 Flow field in the compressor blade cascade NACA 65-100 Tomáš Turek Thesis Supervisor: Ing. Tomáš Hyhlík, Ph.D. Abstract An investigation is made into the effects of a flow field in the compressor blade
Lecture-4. Flow Past Immersed Bodies
 Lecture-4 Flow Past Immersed Bodies Learning objectives After completing this lecture, you should be able to: Identify and discuss the features of external flow Explain the fundamental characteristics
Masters in Mechanical Engineering Aerodynamics 1 st Semester 2015/16
 Masters in Mechanical Engineering Aerodynamics st Semester 05/6 Exam st season, 8 January 06 Name : Time : 8:30 Number: Duration : 3 hours st Part : No textbooks/notes allowed nd Part : Textbooks allowed
Numerical study of battle damaged two-dimensional wings
 Advances in Fluid Mechanics IX 141 Numerical study of battle damaged two-dimensional wings S. Djellal, T. Azzam, M. Djellab & K. Lakkaichi Fluid Mechanics Laboratory Polytechnical School Bordj El Bahri,
Wall treatments and wall functions
 Wall treatments and wall functions A wall treatment is the set of near-wall modelling assumptions for each turbulence model. Three types of wall treatment are provided in FLUENT, although all three might
CFD Analysis for Thermal Behavior of Turbulent Channel Flow of Different Geometry of Bottom Plate
 International Journal Of Engineering Research And Development e-issn: 2278-067X, p-issn: 2278-800X, www.ijerd.com Volume 13, Issue 9 (September 2017), PP.12-19 CFD Analysis for Thermal Behavior of Turbulent
1. Fluid Dynamics Around Airfoils
 1. Fluid Dynamics Around Airfoils Two-dimensional flow around a streamlined shape Foces on an airfoil Distribution of pressue coefficient over an airfoil The variation of the lift coefficient with the
The Simulation of Wraparound Fins Aerodynamic Characteristics
 The Simulation of Wraparound Fins Aerodynamic Characteristics Institute of Launch Dynamics Nanjing University of Science and Technology Nanjing Xiaolingwei 00 P. R. China laithabbass@yahoo.com Abstract:
Aerodynamic Investigation of a 2D Wing and Flows in Ground Effect
 26 2 2009 3 CHINESE JOURNAL OF COMPUTATIONAL PHYSICS Vol. 26,No. 2 Mar., 2009 Article ID : 10012246 X(2009) 0220231210 Aerodynamic Investigation of a 2D Wing and Flows in Ground Effect YANG Wei, YANG Zhigang
1. Introduction, tensors, kinematics
 1. Introduction, tensors, kinematics Content: Introduction to fluids, Cartesian tensors, vector algebra using tensor notation, operators in tensor form, Eulerian and Lagrangian description of scalar and
TURBULENT FLOW ACROSS A ROTATING CYLINDER WITH SURFACE ROUGHNESS
 HEFAT2014 10 th International Conference on Heat Transfer, Fluid Mechanics and Thermodynamics 14 16 July 2014 Orlando, Florida TURBULENT FLOW ACROSS A ROTATING CYLINDER WITH SURFACE ROUGHNESS Everts, M.,
International Journal of Scientific & Engineering Research, Volume 6, Issue 5, May ISSN
 International Journal of Scientific & Engineering Research, Volume 6, Issue 5, May-2015 28 CFD BASED HEAT TRANSFER ANALYSIS OF SOLAR AIR HEATER DUCT PROVIDED WITH ARTIFICIAL ROUGHNESS Vivek Rao, Dr. Ajay
Detailed Outline, M E 320 Fluid Flow, Spring Semester 2015
 Detailed Outline, M E 320 Fluid Flow, Spring Semester 2015 I. Introduction (Chapters 1 and 2) A. What is Fluid Mechanics? 1. What is a fluid? 2. What is mechanics? B. Classification of Fluid Flows 1. Viscous
Detailed Outline, M E 521: Foundations of Fluid Mechanics I
 Detailed Outline, M E 521: Foundations of Fluid Mechanics I I. Introduction and Review A. Notation 1. Vectors 2. Second-order tensors 3. Volume vs. velocity 4. Del operator B. Chapter 1: Review of Basic
Parametric Investigation of Hull Shaped Fuselage for an Amphibious UAV
 Ninth International Conference on Computational Fluid Dynamics (ICCFD9), Istanbul, Turkey, July 11-15, 2016 ICCFD9-2016-226 Parametric Investigation of Hull Shaped Fuselage for an Amphibious UAV Emre Sazak
CHAPTER 3 ANALYSIS OF NACA 4 SERIES AIRFOILS
 54 CHAPTER 3 ANALYSIS OF NACA 4 SERIES AIRFOILS The baseline characteristics and analysis of NACA 4 series airfoils are presented in this chapter in detail. The correlations for coefficient of lift and
CHAPTER 7 NUMERICAL MODELLING OF A SPIRAL HEAT EXCHANGER USING CFD TECHNIQUE
 CHAPTER 7 NUMERICAL MODELLING OF A SPIRAL HEAT EXCHANGER USING CFD TECHNIQUE In this chapter, the governing equations for the proposed numerical model with discretisation methods are presented. Spiral
Applied Fluid Mechanics
 Applied Fluid Mechanics 1. The Nature of Fluid and the Study of Fluid Mechanics 2. Viscosity of Fluid 3. Pressure Measurement 4. Forces Due to Static Fluid 5. Buoyancy and Stability 6. Flow of Fluid and
Flight Vehicle Terminology
 Flight Vehicle Terminology 1.0 Axes Systems There are 3 axes systems which can be used in Aeronautics, Aerodynamics & Flight Mechanics: Ground Axes G(x 0, y 0, z 0 ) Body Axes G(x, y, z) Aerodynamic Axes
Aerofoil profile modification effects for improved performance of a vertical axis wind turbine blade
 Aerofoil profile modification effects for improved performance of a vertical axis wind turbine blade by Md. Farhad Ismail B.Sc., Bangladesh University of Engineering and Technology, 2012 Thesis Submitted
Principles of Convection
 Principles of Convection Point Conduction & convection are similar both require the presence of a material medium. But convection requires the presence of fluid motion. Heat transfer through the: Solid
COMPUTATIONAL STUDY OF SEPARATION CONTROL MECHANISM WITH THE IMAGINARY BODY FORCE ADDED TO THE FLOWS OVER AN AIRFOIL
 COMPUTATIONAL STUDY OF SEPARATION CONTROL MECHANISM WITH THE IMAGINARY BODY FORCE ADDED TO THE FLOWS OVER AN AIRFOIL Kengo Asada 1 and Kozo Fujii 2 ABSTRACT The effects of body force distribution on the
WALL ROUGHNESS EFFECTS ON SHOCK BOUNDARY LAYER INTERACTION FLOWS
 ISSN (Online) : 2319-8753 ISSN (Print) : 2347-6710 International Journal of Innovative Research in Science, Engineering and Technology An ISO 3297: 2007 Certified Organization, Volume 2, Special Issue
Simulation of Aeroelastic System with Aerodynamic Nonlinearity
 Simulation of Aeroelastic System with Aerodynamic Nonlinearity Muhamad Khairil Hafizi Mohd Zorkipli School of Aerospace Engineering, Universiti Sains Malaysia, Penang, MALAYSIA Norizham Abdul Razak School
Computational Fluid Dynamics Study Of Fluid Flow And Aerodynamic Forces On An Airfoil S.Kandwal 1, Dr. S. Singh 2
 Computational Fluid Dynamics Study Of Fluid Flow And Aerodynamic Forces On An Airfoil S.Kandwal 1, Dr. S. Singh 2 1 M. Tech Scholar, 2 Associate Professor Department of Mechanical Engineering, Bipin Tripathi
THE EFFECT OF INTERNAL ACOUSTIC EXCITATION ON THE AERODYNAMIC CHARACTERISTICS OF AIRFOIL AT HIGH ANGLE OF ATTACKE
 Vol.1, Issue.2, pp-371-384 ISSN: 2249-6645 THE EFFECT OF INTERNAL ACOUSTIC EXCITATION ON THE AERODYNAMIC CHARACTERISTICS OF AIRFOIL AT HIGH ANGLE OF ATTACKE Dr. Mohammed W. Khadim Mechanical Engineering
Numerical Methods in Aerodynamics. Turbulence Modeling. Lecture 5: Turbulence modeling
 Turbulence Modeling Niels N. Sørensen Professor MSO, Ph.D. Department of Civil Engineering, Alborg University & Wind Energy Department, Risø National Laboratory Technical University of Denmark 1 Outline
An Investigation of Tip-Vortex Turbulence Structure using Large-Eddy Simulation
 An Investigation of Tip-Vortex Turbulence Structure using Large-Eddy Simulation 1 David Hanson ; 1 Michael Kinzel; 1 Kyle Sinding; and 1 Michael Krane 1 The Pennsylvania State University, University Park,
Numerical Study on Flow Field for a Solar Collector at Various Inflow Incidence Angles *
 Journal of Aeronautics, Astronautics and Aviation, Vol.46, No.4 pp.241 248 (2014) 241 DOI:10.6125/14-0728-808 Numerical Study on Flow Field for a Solar Collector at Various Inflow Incidence Angles * Uzu-Kuei
Department of Mechanical Engineering
 Department of Mechanical Engineering AMEE401 / AUTO400 Aerodynamics Instructor: Marios M. Fyrillas Email: eng.fm@fit.ac.cy HOMEWORK ASSIGNMENT #2 QUESTION 1 Clearly there are two mechanisms responsible
Numerical Heat and Mass Transfer
 Master Degree in Mechanical Engineering Numerical Heat and Mass Transfer 19 Turbulent Flows Fausto Arpino f.arpino@unicas.it Introduction All the flows encountered in the engineering practice become unstable
Department of Energy Sciences, LTH
 Department of Energy Sciences, LTH MMV11 Fluid Mechanics LABORATION 1 Flow Around Bodies OBJECTIVES (1) To understand how body shape and surface finish influence the flow-related forces () To understand
CHAPTER 7 SEVERAL FORMS OF THE EQUATIONS OF MOTION
 CHAPTER 7 SEVERAL FORMS OF THE EQUATIONS OF MOTION 7.1 THE NAVIER-STOKES EQUATIONS Under the assumption of a Newtonian stress-rate-of-strain constitutive equation and a linear, thermally conductive medium,
Numerical study of the effects of trailing-edge bluntness on highly turbulent hydro-foil flows
 Numerical study of the effects of trailing-edge bluntness on highly turbulent hydro-foil flows T. Do L. Chen J. Tu B. Anderson 7 November 2005 Abstract Flow-induced noise from fully submerged lifting bodies
Research on Dynamic Stall and Aerodynamic Characteristics of Wind Turbine 3D Rotational Blade
 Research on Dynamic Stall and Aerodynamic Characteristics of Wind Turbine 3D Rotational Blade HU Guo-yu, SUN Wen-lei, Dong Ping The School of Mechanical Engineering Xinjiang University Urumqi, Xinjiang,
Aerodynamic force analysis in high Reynolds number flows by Lamb vector integration
 Aerodynamic force analysis in high Reynolds number flows by Lamb vector integration Claudio Marongiu, Renato Tognaccini 2 CIRA, Italian Center for Aerospace Research, Capua (CE), Italy E-mail: c.marongiu@cira.it
Experimental and Numerical Investigation of Flow over a Cylinder at Reynolds Number 10 5
 Journal of Modern Science and Technology Vol. 1. No. 1. May 2013 Issue. Pp.52-60 Experimental and Numerical Investigation of Flow over a Cylinder at Reynolds Number 10 5 Toukir Islam and S.M. Rakibul Hassan
PART 1B EXPERIMENTAL ENGINEERING. SUBJECT: FLUID MECHANICS & HEAT TRANSFER LOCATION: HYDRAULICS LAB (Gnd Floor Inglis Bldg) BOUNDARY LAYERS AND DRAG
 BOUNDARY LAYERS AND DRAG") 1 PART 1B EXPERIMENTAL ENGINEERING SUBJECT: FLUID MECHANICS & HEAT TRANSFER LOCATION: HYDRAULICS LAB (Gnd Floor Inglis Bldg) EXPERIMENT T3 (LONG) BOUNDARY LAYERS AND DRAG OBJECTIVES a) To measure the velocity
1 PART 1B EXPERIMENTAL ENGINEERING SUBJECT: FLUID MECHANICS & HEAT TRANSFER LOCATION: HYDRAULICS LAB (Gnd Floor Inglis Bldg) EXPERIMENT T3 (LONG) BOUNDARY LAYERS AND DRAG OBJECTIVES a) To measure the velocity
Numerical Investigation of Shock wave Turbulent Boundary Layer Interaction over a 2D Compression Ramp
 Advances in Aerospace Science and Applications. ISSN 2277-3223 Volume 4, Number 1 (2014), pp. 25-32 Research India Publications http://www.ripublication.com/aasa.htm Numerical Investigation of Shock wave
BLUFF-BODY AERODYNAMICS
 International Advanced School on WIND-EXCITED AND AEROELASTIC VIBRATIONS OF STRUCTURES Genoa, Italy, June 12-16, 2000 BLUFF-BODY AERODYNAMICS Lecture Notes by Guido Buresti Department of Aerospace Engineering
Turbulence - Theory and Modelling GROUP-STUDIES:
 Lund Institute of Technology Department of Energy Sciences Division of Fluid Mechanics Robert Szasz, tel 046-0480 Johan Revstedt, tel 046-43 0 Turbulence - Theory and Modelling GROUP-STUDIES: Turbulence
Numerical Study of Natural Unsteadiness Using Wall-Distance-Free Turbulence Models
 Numerical Study of Natural Unsteadiness Using Wall-Distance-Free urbulence Models Yi-Lung Yang* and Gwo-Lung Wang Department of Mechanical Engineering, Chung Hua University No. 707, Sec 2, Wufu Road, Hsin
Large-eddy simulations for wind turbine blade: rotational augmentation and dynamic stall
 Large-eddy simulations for wind turbine blade: rotational augmentation and dynamic stall Y. Kim, I.P. Castro, and Z.T. Xie Introduction Wind turbines operate in the atmospheric boundary layer and their
Heat Transfer from An Impingement Jet onto A Heated Half-Prolate Spheroid Attached to A Heated Flat Plate
 1 nd International Conference on Environment and Industrial Innovation IPCBEE vol.35 (1) (1) IACSIT Press, Singapore Heat Transfer from An Impingement Jet onto A Heated Half-Prolate Spheroid Attached to
Given a stream function for a cylinder in a uniform flow with circulation: a) Sketch the flow pattern in terms of streamlines.
 Sketch the flow pattern in terms of streamlines.") Question Given a stream function for a cylinder in a uniform flow with circulation: R Γ r ψ = U r sinθ + ln r π R a) Sketch the flow pattern in terms of streamlines. b) Derive an expression for the angular
Question Given a stream function for a cylinder in a uniform flow with circulation: R Γ r ψ = U r sinθ + ln r π R a) Sketch the flow pattern in terms of streamlines. b) Derive an expression for the angular
High Speed Aerodynamics. Copyright 2009 Narayanan Komerath
 Welcome to High Speed Aerodynamics 1 Lift, drag and pitching moment? Linearized Potential Flow Transformations Compressible Boundary Layer WHAT IS HIGH SPEED AERODYNAMICS? Airfoil section? Thin airfoil
Chapter 3 Lecture 8. Drag polar 3. Topics. Chapter-3
 Chapter 3 ecture 8 Drag polar 3 Topics 3.2.7 Boundary layer separation, adverse pressure gradient and favourable pressure gradient 3.2.8 Boundary layer transition 3.2.9 Turbulent boundary layer over a
SPC Aerodynamics Course Assignment Due Date Monday 28 May 2018 at 11:30
 SPC 307 - Aerodynamics Course Assignment Due Date Monday 28 May 2018 at 11:30 1. The maximum velocity at which an aircraft can cruise occurs when the thrust available with the engines operating with the
Numerical Investigation of Thermal Performance in Cross Flow Around Square Array of Circular Cylinders
 Numerical Investigation of Thermal Performance in Cross Flow Around Square Array of Circular Cylinders A. Jugal M. Panchal, B. A M Lakdawala 2 A. M. Tech student, Mechanical Engineering Department, Institute
A Multi-Dimensional Limiter for Hybrid Grid
 APCOM & ISCM 11-14 th December, 2013, Singapore A Multi-Dimensional Limiter for Hybrid Grid * H. W. Zheng ¹ 1 State Key Laboratory of High Temperature Gas Dynamics, Institute of Mechanics, Chinese Academy
Comparison of Turbulence Models in the Flow over a Backward-Facing Step Priscila Pires Araujo 1, André Luiz Tenório Rezende 2
 Comparison of Turbulence Models in the Flow over a Backward-Facing Step Priscila Pires Araujo 1, André Luiz Tenório Rezende 2 Department of Mechanical and Materials Engineering, Military Engineering Institute,
Contents. I Introduction 1. Preface. xiii
 Contents Preface xiii I Introduction 1 1 Continuous matter 3 1.1 Molecules................................ 4 1.2 The continuum approximation.................... 6 1.3 Newtonian mechanics.........................
Lecture 7 Boundary Layer
 SPC 307 Introduction to Aerodynamics Lecture 7 Boundary Layer April 9, 2017 Sep. 18, 2016 1 Character of the steady, viscous flow past a flat plate parallel to the upstream velocity Inertia force = ma
There are no simple turbulent flows
 Turbulence 1 There are no simple turbulent flows Turbulent boundary layer: Instantaneous velocity field (snapshot) Ref: Prof. M. Gad-el-Hak, University of Notre Dame Prediction of turbulent flows standard
ON USING ARTIFICIAL COMPRESSIBILITY METHOD FOR SOLVING TURBULENT FLOWS
 Conference Applications of Mathematics 212 in honor of the 6th birthday of Michal Křížek. Institute of Mathematics AS CR, Prague 212 ON USING ARTIFICIAL COMPRESSIBILITY METHOD FOR SOLVING TURBULENT FLOWS
International Conference on Energy Efficient Technologies For Automobiles (EETA 15) Journal of Chemical and Pharmaceutical Sciences ISSN:
 Journal of Chemical and Pharmaceutical Sciences ISSN:") HEAT TRANSFER ENHANCEMENT WITH PRESSURE LOSS REDUCTION IN COMPACT HEAT EXCHANGERS USING VORTEX GENERATORS Viswajith M V*, Gireesh Kumaran Thampi, James Varghese Department of Mechanical Engineering, School
HEAT TRANSFER ENHANCEMENT WITH PRESSURE LOSS REDUCTION IN COMPACT HEAT EXCHANGERS USING VORTEX GENERATORS Viswajith M V*, Gireesh Kumaran Thampi, James Varghese Department of Mechanical Engineering, School
AN UNCERTAINTY ESTIMATION EXAMPLE FOR BACKWARD FACING STEP CFD SIMULATION. Abstract
 nd Workshop on CFD Uncertainty Analysis - Lisbon, 19th and 0th October 006 AN UNCERTAINTY ESTIMATION EXAMPLE FOR BACKWARD FACING STEP CFD SIMULATION Alfredo Iranzo 1, Jesús Valle, Ignacio Trejo 3, Jerónimo
BOUNDARY LAYER FLOWS HINCHEY
 BOUNDARY LAYER FLOWS HINCHEY BOUNDARY LAYER PHENOMENA When a body moves through a viscous fluid, the fluid at its surface moves with it. It does not slip over the surface. When a body moves at high speed,
INSTITUTE OF AERONAUTICAL ENGINEERING (Autonomous) Dundigal, Hyderabad
 Dundigal, Hyderabad") INSTITUTE OF AERONAUTICAL ENGINEERING (Autonomous) Dundigal, Hyderabad - 500 043 AERONAUTICAL ENGINEERING TUTORIAL QUESTION BANK Course Name : LOW SPEED AERODYNAMICS Course Code : AAE004 Regulation : IARE
INSTITUTE OF AERONAUTICAL ENGINEERING (Autonomous) Dundigal, Hyderabad - 500 043 AERONAUTICAL ENGINEERING TUTORIAL QUESTION BANK Course Name : LOW SPEED AERODYNAMICS Course Code : AAE004 Regulation : IARE
BOUNDARY LAYER ANALYSIS WITH NAVIER-STOKES EQUATION IN 2D CHANNEL FLOW
 Proceedings of,, BOUNDARY LAYER ANALYSIS WITH NAVIER-STOKES EQUATION IN 2D CHANNEL FLOW Yunho Jang Department of Mechanical and Industrial Engineering University of Massachusetts Amherst, MA 01002 Email:
ADVERSE REYNOLDS NUMBER EFFECT ON MAXIMUM LIFT OF TWO DIMENSIONAL AIRFOILS
 ICAS 2 CONGRESS ADVERSE REYNOLDS NUMBER EFFECT ON MAXIMUM LIFT OF TWO DIMENSIONAL AIRFOILS Kenji YOSHIDA, Masayoshi NOGUCHI Advanced Technology Aircraft Project Center NATIONAL AEROSPACE LABORATORY 6-
CFD COMPUTATION OF THE GROUND EFFECT ON AIRPLANE WITH HIGH ASPECT RATIO WING
 28 TH INTERNATIONAL CONGRESS OF THE AERONAUTICAL SCIENCES CFD COMPUTATION OF THE GROUND EFFECT ON AIRPLANE WITH HIGH ASPECT RATIO WING Sun Tae Kim*, Youngtae Kim**, Tae Kyu Reu* *Agency for Defense Development,
Fluid Mechanics Prof. T. I. Eldho Department of Civil Engineering Indian Institute of Technology, Bombay
 Fluid Mechanics Prof. T. I. Eldho Department of Civil Engineering Indian Institute of Technology, Bombay Lecture No. # 35 Boundary Layer Theory and Applications Welcome back to the video course on fluid
On the transient modelling of impinging jets heat transfer. A practical approach
 Turbulence, Heat and Mass Transfer 7 2012 Begell House, Inc. On the transient modelling of impinging jets heat transfer. A practical approach M. Bovo 1,2 and L. Davidson 1 1 Dept. of Applied Mechanics,
Introduction to ANSYS FLUENT
 Lecture 6 Turbulence 14. 0 Release Introduction to ANSYS FLUENT 1 2011 ANSYS, Inc. January 19, 2012 Lecture Theme: Introduction The majority of engineering flows are turbulent. Successfully simulating
AER1310: TURBULENCE MODELLING 1. Introduction to Turbulent Flows C. P. T. Groth c Oxford Dictionary: disturbance, commotion, varying irregularly
 1. Introduction to Turbulent Flows Coverage of this section: Definition of Turbulence Features of Turbulent Flows Numerical Modelling Challenges History of Turbulence Modelling 1 1.1 Definition of Turbulence
DEVELOPMENT OF CFD MODEL FOR A SWIRL STABILIZED SPRAY COMBUSTOR
 DRAFT Proceedings of ASME IMECE: International Mechanical Engineering Conference & Exposition Chicago, Illinois Nov. 5-10, 2006 IMECE2006-14867 DEVELOPMENT OF CFD MODEL FOR A SWIRL STABILIZED SPRAY COMBUSTOR
Studies on the Transition of the Flow Oscillations over an Axisymmetric Open Cavity Model
 Advances in Aerospace Science and Applications. ISSN 2277-3223 Volume 3, Number 2 (2013), pp. 83-90 Research India Publications http://www.ripublication.com/aasa.htm Studies on the Transition of the Flow
NUMERICAL SIMULATION OF THE FLOW AROUND A SQUARE CYLINDER USING THE VORTEX METHOD
 NUMERICAL SIMULATION OF THE FLOW AROUND A SQUARE CYLINDER USING THE VORTEX METHOD V. G. Guedes a, G. C. R. Bodstein b, and M. H. Hirata c a Centro de Pesquisas de Energia Elétrica Departamento de Tecnologias
SENSITIVITY ANALYSIS OF THE FACTORS AFFECTING FORCE GENERATION BY WING FLAPPING MOTION
 Proceedings of the ASME 2013 International Mechanical Engineering Congress and Exposition IMECE2013 November 15-21, 2013, San Diego, California, USA IMECE2013-65472 SENSITIVITY ANALYSIS OF THE FACTORS
ν δ - 1 -
 ν δ - 1 - δ ν ν δ ν ν - 2 - ρ δ ρ θ θ θ δ τ ρ θ δ δ θ δ δ δ δ τ μ δ μ δ ν δ δ δ - 3 - τ ρ δ ρ δ ρ δ δ δ δ δ δ δ δ δ δ δ - 4 - ρ μ ρ μ ρ ρ μ μ ρ - 5 - ρ τ μ τ μ ρ δ δ δ - 6 - τ ρ μ τ ρ μ ρ δ θ θ δ θ - 7
Boundary-Layer Theory
 Hermann Schlichting Klaus Gersten Boundary-Layer Theory With contributions from Egon Krause and Herbert Oertel Jr. Translated by Katherine Mayes 8th Revised and Enlarged Edition With 287 Figures and 22
Experimental Verification of CFD Modeling of Turbulent Flow over Circular Cavities using FLUENT
 Experimental Verification of CFD Modeling of Turbulent Flow over Circular Cavities using FLUENT T Hering, J Dybenko, E Savory Mech. & Material Engineering Dept., University of Western Ontario, London,
COURSE ON VEHICLE AERODYNAMICS Prof. Tamás Lajos University of Rome La Sapienza 1999
 COURSE ON VEHICLE AERODYNAMICS Prof. Tamás Lajos University of Rome La Sapienza 1999 1. Introduction Subject of the course: basics of vehicle aerodynamics ground vehicle aerodynamics examples in car, bus,
Coupled Fluid and Heat Flow Analysis Around NACA Aerofoil Profiles at Various Mach Numbers
 International Journal of Engineering Research and Technology. ISSN 0974-3154 Volume 6, Number 2 (2013), pp. 249-258 International Research Publication House http://www.irphouse.com Coupled Fluid and Heat
The effect of geometric parameters on the head loss factor in headers
 Fluid Structure Interaction V 355 The effect of geometric parameters on the head loss factor in headers A. Mansourpour & S. Shayamehr Mechanical Engineering Department, Azad University of Karaj, Iran Abstract
International Journal of Modern Trends in Engineering and Research e-issn No.: , Date: 2-4 July, 2015
 International Journal of Modern Trends in Engineering and Research www.ijmter.com e-issn No.:2349-9745, Date: 2-4 July, 2015 CFD Analysis of Airfoil NACA0012 Pritesh S. Gugliya 1, Yogesh R. Jaiswal 2,
Introduction to Aerospace Engineering
 4. Basic Fluid (Aero) Dynamics Introduction to Aerospace Engineering Here, we will try and look at a few basic ideas from the complicated field of fluid dynamics. The general area includes studies of incompressible,
Numerical Simulation of Flow Around An Elliptical Cylinder at High Reynolds Numbers
 International Journal of Fluids Engineering. ISSN 0974-3138 Volume 5, Number 1 (2013), pp. 29-37 International Research Publication House http://www.irphouse.com Numerical Simulation of Flow Around An
Turbulence modelling. Sørensen, Niels N. Publication date: Link back to DTU Orbit
 Downloaded from orbit.dtu.dk on: Dec 19, 2017 Turbulence modelling Sørensen, Niels N. Publication date: 2010 Link back to DTU Orbit Citation (APA): Sørensen, N. N. (2010). Turbulence modelling. Paper presented
SIMULATION OF THREE-DIMENSIONAL INCOMPRESSIBLE CAVITY FLOWS
 ICAS 2000 CONGRESS SIMULATION OF THREE-DIMENSIONAL INCOMPRESSIBLE CAVITY FLOWS H Yao, R K Cooper, and S Raghunathan School of Aeronautical Engineering The Queen s University of Belfast, Belfast BT7 1NN,
Numerical investigation of plasma actuator configurations for flow separation control at multiple angles of attack
 Scholars' Mine Masters Theses Student Research & Creative Works Summer 2012 Numerical investigation of plasma actuator configurations for flow separation control at multiple angles of attack Thomas Kelsey
LEE-SIDE FLOW SIMULATIONS OF CRUCIFORM WING- BODY CONFIGURATIONS AT INCOMPRESSIBLE MACH NUMBERS
 LEE-SIDE FLOW SIMULATIONS OF CRUCIFORM WING- BODY CONFIGURATIONS AT INCOMPRESSIBLE MACH NUMBERS Janine Versteegh* ** *University of the Witwatersrand **Council for Scientific and Industrial Research (CSIR)
Effect of modification to tongue and basic circle diameter on vibration in a double-suction centrifugal pump
 5th International Conference on Information Engineering for Mechanics and Materials (ICIMM 2015) Effect of modification to tongue and basic circle diameter on vibration in a double-suction centrifugal
Numerical Investigation of the Transonic Base Flow of A Generic Rocket Configuration
 1 Numerical Investigation of the Transonic Base Flow of A Generic Rocket Configuration A. Henze, C. Glatzer, M. Meinke, W. Schröder Institute of Aerodynamics, RWTH Aachen University, Germany March 21,
AERODYNAMIC CHARACTERIZATION OF A CANARD GUIDED ARTILLERY PROJECTILE
 45th AIAA Aerospace Sciences Meeting and Exhibit 8-11 January 27, Reno, Nevada AIAA 27-672 AERODYNAMIC CHARACTERIZATION OF A CANARD GUIDED ARTILLERY PROJECTILE Wei-Jen Su 1, Curtis Wilson 2, Tony Farina
Numerical Simulation of Flow Separation Control using Multiple DBD Plasma Actuators
 Journal of Applied Fluid Mechanics, Vol. 9, No. 4, pp. 1865-1875, 2016. Available online at www.jafmonline.net, ISSN 1735-3572, EISSN 1735-3645. DOI: 10.18869/acadpub.jafm.68.235.25325 Numerical Simulation
Zonal hybrid RANS-LES modeling using a Low-Reynolds-Number k ω approach
 Zonal hybrid RANS-LES modeling using a Low-Reynolds-Number k ω approach S. Arvidson 1,2, L. Davidson 1, S.-H. Peng 1,3 1 Chalmers University of Technology 2 SAAB AB, Aeronautics 3 FOI, Swedish Defence
OpenFOAM Simulations for MAV Applications
 16 th Annual CFD Symposium 11th-12th August 2014, Bangalore 1 OpenFOAM Simulations for MAV Applications Syed Zahid*, A. Rajesh, M.B. Subrahmanya, B.N. Rajani *Student, Dept. of Mech. Engg, SDM, Dharwad,
Calculations on a heated cylinder case
 Calculations on a heated cylinder case J. C. Uribe and D. Laurence 1 Introduction In order to evaluate the wall functions in version 1.3 of Code Saturne, a heated cylinder case has been chosen. The case