How Does Straw Burning Affect Urban Air Quality in China?
|
|
|
- Patience Hodges
- 6 years ago
- Views:
Transcription
1 How Does Straw Burning Affect Urban Air Quality in China? Shiqi (Steven) Guo The Graduate Institute of International and Development Studies, Geneva September 2017, UNU-WIDER
2 Effects of Air Pollution Health mortality rate in US (Chay and Greenstone, 2003), Indonesia (Jayachandran, 2009), China (Tanaka, 2015; He et al., 2016), India (Greenstone and Hanna, 2015), South Korean (Jia and Ku, 2016), Mexico (Arceo et al., 2016), Brazil (Rangel and Vogl, 2017) life expectancy in China (Chen et al., 2013) mental health in China (Zhang et al., 2017) Individual performance agricultural worker productivity in US (Graff Zivin and Neidell, 2013) cognitive performance in Israel (Ebenstein et al., 2016) investment performance in China (Huang et al., 2016) Labor market labor supply in Mexico (Hanna and Oliva, 2015) Consumption air purifiers in China (Ito and Zhang, 2016) particulate-filtering masks in China (Zhang and Mu, 2017)

 clear the fields in time for")
3 Straw Burning in China fuels, forages, fertilizers changes in rural economy (energy structure, farm mechanization, rural labor) clear the fields in time for the next plantings


4 Straw Burning in China The day of burning straw, is the day when you will be in prison. 7 days detention and 1000 RMB fine for straw burning 15 days detention and 3000 RMB fine for straw burning Banning straw burning is patriotism.
5 Environmental Literature Research areas causal link, general effect Emission factors (Cao et al.,2008; Huang et al., 2012; Zhang et al.,2016) Co-movement of air pollution and straw burning (Li et al., 2008; Zha et al., 2013) Meteorological models (Yamaji et al., 2010; Cheng et al., 2014; Zhong et al., 2017) Microstructure of pollutants (Li et al., 2010) Case studies with severe pollution scenarios overestimate Mount Tai, June 2006 (Yamaji et al., 2010); Beijing, June 2007 (Li et al., 2010); Shanting, June 2010 (Zha et al., 2013); Chengdu, May 2012 (Chen and Xie, 2014); Huai River Basin, October 2015 (Zhong et al., 2017)
6 Overview 1 Data 2 Main Effects temporal effect density effect spillover effect 3 Heterogeneous Effects main pollutants pollution levels 4 Robustness Check samples models randomly generated burning
7 Data Straw Burning Ministry of Environmental Protection (MEP) of China various satellites: 10:30, 13:30, 14:30 16:30 14,528 fire points in 26 October December 2016 Satellites Data Availability Urban Air Quality MEP: 1,496 ground monitoring stations Air Quality Index (AQI), PM2.5, PM10, SO2, NO2, CO, O3 142 cities at first, 284 cities in 2016 Weather tianqi.2345.com maximum temperature, minimum temperature, smog, rain, sun, cloud, overcast, wind Observations: 284 prefectural-level cities 538 days
8 Straw Burning

9 Air Quality
10 Straw Burning And Air Quality over Time
11 Summary Statistics Variable Mean Median St.d Min Max Description AQI Air Quality Index PM Fine particles 2.5µm in diameter in µg/m3 PM in µg/m3 SO in µg/m3 CO in mg/m3 NO in µg/m3 O in µg/m3 Fire Number of straw burning fire points Fired Straw burning dummy Htemp Maximum temperature in degrees Celsius Ltemp Minimum temperature in degrees Celsius Smog Smoggy day dummy Rain Rainy day dummy Sun Sunny day dummy Cloud Cloudy day dummy Overcast Overcast day dummy Wind Windy day dummy
12 Main Effects Temporal effect How does straw burning affect urban AQI in the following days? Density effect number of fire points in the city-date grids Spillover effect How does straw burning affect urban AQI of the surrounding cities?
13 Temporal Effect AQI i,t = τ=15 τ=0 b τ Fired i,t τ + W i,t γ + u i + v t + w i,t Fired i,t : whether there exists straw burning in city i on day t W i,t : weather covariates u i, v t : city, date fixed effects s.e. clustered at city level
14 Temporal Effect Obs = 126,106; R-squared = AQI Helsinki: 22
15 Temporal Effect
16 Density Effect Linear: number of fire points detected in city i on day t AQI i,t = τ=10 τ=0 b τ Fire i,t τ + W i,t γ + u i + v t + w i,t Categorical: number of fire points in {1}, [2,4], [5,+ ) AQI i,t = τ=10 τ=0 τ=10 b τ FireD1 i,t τ + τ=0 Quadratic: linear and quadratic terms AQI i,t = τ=10 τ=0 τ=10 b τ Fire i,t τ + τ=0 τ=10 b τ FireD2 i,t τ + τ=0 b τ FireD3 i,t τ +W i,t γ + u i + v t + w i,t a τ Fire 2 i,t τ + W i,t γ + u i + v t + w i,t
17 Density Effect (1) (2) (3) (4) (5) (6) Models Linear Categorical Quadratic Average AQI point 2-4 points 5 points linear terms quadratic terms Fire t 0.28** * Fire t *** 3.33*** 5.09*** 16.59*** 1.40*** *** Fire t *** 3.56*** 5.10*** 13.83*** 1.08*** ** Fire t *** 3.64*** 4.43*** 3.25** 0.41*** *** Fire t *** 2.35* 6.81*** 0.47*** *** Fire t *** 2.46* 4.58** 0.52*** *** Fire t * 4.75*** Fire t *** 2.90*** 4.10*** 10.69*** 0.91*** *** Fire t ** 4.87*** 5.79*** 0.56*** *** Fire t * ** Fire t ** * s.e. (0.05,0.18) (0.78,1.06) (1.10,1.67) (1.59,2.78) (0.15,0.26) (0.001,0.003) City, date FE Yes Yes Yes Weather Yes Yes Yes Observations 126, , ,106 R-squared Number of cities
18 Spillover Effect AQI i,t = τ=10 τ=0 τ=10 b τ Fired i,t τ + τ=0 τ=10 + τ=0 τ=10 b τ FiredR1 i,t τ + τ=0 b τ FiredR2 i,t τ b τ FiredR3 i,t τ + W i,t γ + u i + v t + w i,t Fired i,t : whether exists straw burning in city i on day t FiredR1 i,t : whether exists straw burning in other cities within 200 km from city i on day t FiredR2 i,t : 200 km km FiredR3 i,t : 400 km km
19 Spillover Effect (1) (2) (3) (4) Distance 0 km km km km (Helsinki) (Turku) (Stockholm) (Oulu) Number of other cities Fired t *** 0.63** Fired t *** 1.30*** 1.56*** 1.35*** Fired t *** 1.10*** 1.65*** 0.69** Fired t *** 1.18*** 0.62** 0.05 Fired t *** 1.77*** 0.53* -0.56** Fired t *** * -1.30*** Fired t *** *** -0.62** Fired t *** 1.45*** ** Fired t *** Fired t ** * Fired t *** s.e. (0.64, 1.00) (0.37, 0.43) (0.28, 0.37) (0.24, 0.32) City FE, date FE, weather Obs = 126,106; cities = 284; R-squared = Yes
20 Heterogeneous Effects Main pollutants PM2.5, PM10, SO2, CO, NO2, O3 Pollution levels quantile regression Regions Northeast, North, Central and South China Seasons
21 Main Pollutants
22 Main Pollutants Emission factors (Cao et al., 2008) Wheat straw Rice straw Corn stover Cotton stalk PM NO SO CO (in g/kg) O 3 (Yamaji et al., 2010; Zhong et al., 2017) PM 10 by µg/m 3 from rice residue in Eastern Spain (Viana et al, 2008) PM 10 and O 3 from sugarcane in Brazil (Rangel and Vogl, 2017)
23 Pollution Levels
24 Robustness Check Different samples missing days, no-burn days, year 2016, early cities, no-burn cities Different models dynamic model (Difference GMM) random coefficient model Panel Vector Autoregressive (Panel VAR) model Randomly generated burning same number of straw burning grids in every month, all over China
25 Different Samples (1) (2) (3) (4) (5) Sample + missing days - no-burn days Year 2016 Early cities + no-burn cities Cities Days Fired t Fired t *** 6.95*** 5.50*** 4.52*** 7.81*** Fired t *** 8.03*** 5.25*** 5.86*** 5.96*** Fired t *** 7.20*** 3.92*** 6.21*** 4.76*** Fired t *** 5.27*** 3.26*** 5.32*** 3.83*** Fired t *** 5.23*** 2.95*** 6.30*** 4.06*** Fired t *** 4.14*** 1.16*** 4.28*** 3.31*** Fired t *** 5.79*** 2.49*** 5.56*** 4.61*** Fired t *** 4.68*** 1.75*** 4.94** 3.76*** Fired t ** 0.92*** -1.74*** 2.36*** 1.11*** Fired t *** 3.36*** *** 2.95*** s.e. (0.6,1.1) (0.9,1.4) (0.6,1) (0.8,1.5) (0.7,1.1) Weather Y Y Y Y City, Day FE Y Y Y Y Y Observations 200,233 40,118 84,996 64, ,397 R-squared
26 Panel Vector Autoregressive model Rain i,t π 11j π 12j π 13j π 14j π 15j π 16j Rain i,t j u 1i v 1t w 1i,t Sun i,t 15 π 21j π 22j π 23j π 24j π 25j π 26j Sun i,t j u 2i v 2t w 2i,t Cloud i,t Wind i,t = π 31j π 32j π 33j π 34j π 35j π 36j Cloud i,t j j=1 π 41j π 42j π 43j π 44j π 45j π 46j Wind i,t j + u 3i u 4i + v 3t v 4t + w 3i,t w 4i,t Fire i,t π 51j π 52j π 53j π 54j π 55j π 56j Fire i,t j u 5i v 5t w 5i,t AQI i,t π 61j π 62j π 63j π 64j π 65j π 66j AQI i,t j u 6i v 6t w 6i,t
27 Impulse Responses
28 Impulse Responses All responses
29 Random Generated Burning
30 Conclusion Straw burning increases the urban AQI by 6.8 on the first two days after burning. The effect decreases gradually and remains significant for eleven days. Each fire point increase urban AQI by 0.9 on the first day after burning. The effect is larger with denser burning. The marginal effect is decreasing. Cities 400 to 600 km away are also affected. Heterogeneous effects are found with different pollutants, pollution levels, regions and seasons. Effects are robust with different sub-samples and models.
31 Thank you! Webpage:
32 Regions (1) (2) (3) (4) (5) (6) Regions Northeast North Central, South Cities Average AQI Average Fire Straw burning Dummy Number Dummy Number Dummy Number Fire t ** ** 0.64 Fire t *** 0.81*** *** 5.9*** 2.21*** Fire t *** 0.47*** 2.59** 0.42*** 4.08*** 1.27** Fire t *** *** 0.27* 2.43** 0.34 Fire t *** 0.6*** Fire t *** 0.78*** Fire t *** * 0.67* Fire t ** *** 0.48** ** Fire t *** -0.21** 2.68** Fire t *** ** Fire t ** ** 0.78*** *** s.e (1,1.7) (0.06,0.19) (1,1.4) (0.12,0.3) (0.8,1.4) (0.2,0.6) Weather Y Y Y Y Y Y City, day FE Y Y Y Y Y Y Observations 32,267 32,267 40,482 40,482 91,389 91,389 R-squared Northeast: Heilongjiang, Jilin, Liaoning, Neimenggu; North: Hebei, Henan, Shandong, Shanxi; Central and South: Hubei, Hunan, Sichuan, Chongqing, Yunnan, Jiangsu, Zhejiang, Anhui, Jiangxi, Fujian, Guangdong, Guangxi
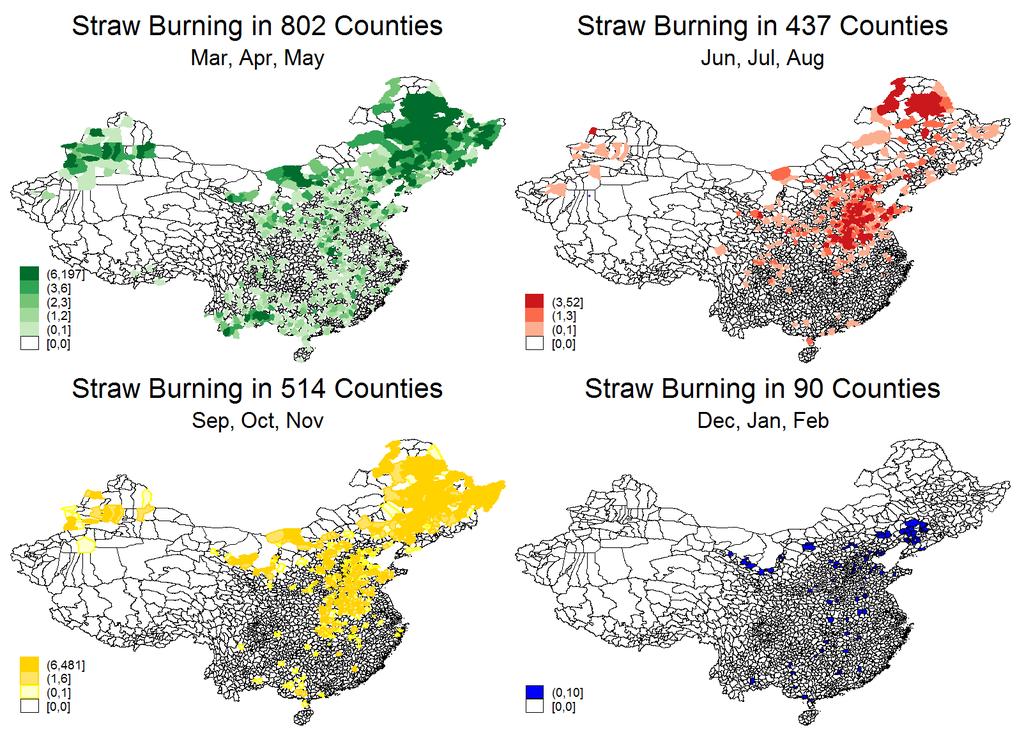
33 Seasons
34 Seasons (1) (2) (3) (4) Months Mar-May Jun-Aug Sep-Nov Dec-Feb Average AQI Average Fire Fired t *** Fired t *** 3.13** 9.54*** -8.83** Fired t *** *** Fired t *** 8.45*** 10.01*** Fired t *** 6.12*** Fired t * 6.62*** 3.95*** Fired t *** 5.89*** Fired t *** 10.31*** -3.2 Fired t *** 5.77*** 1.06 Fired t *** 3.68*** 4.76*** -8.19* Fired t *** 5.01*** *** s.e. (0.7,1.1) (0.8,1.3) (1.1,1.6) (3.9,5.2) Weather Y Y Y Y City, Day FE Y Y Y Y Observations 51,497 50,523 52,567 45,788 R-squared
35 Random Coefficient Model
36 Dynamic Panel Model (1) (2) Models FE Arellano-Bond L.aqi 0.61*** 0.52*** (0.01) (0.009) L2.aqi -0.06*** -0.12*** (0.006) (0.005) Fire * l1fire 6.21*** 6.86*** l2fire 2.57*** 4.18*** l3fire 1.85** 3.91*** l4fire 1.88** 3.47*** l5fire 2.16*** 3.41*** l6fire ** l7fire 1.73** 2.35*** l8fire 1* 1.29* l9fire l10fire 2.1*** 1.22 s.e. (0.58,0.96) (0.68,1.08) Weather Y Y City, Month FE Y Y Cubic Trend Y Y Observations 199, ,690 R-squared

37 All Impulse Responses Impulse Responses
38 Satellites Data Availability Data
DISTRIBUTION AND DIURNAL VARIATION OF WARM-SEASON SHORT-DURATION HEAVY RAINFALL IN RELATION TO THE MCSS IN CHINA
 3 DISTRIBUTION AND DIURNAL VARIATION OF WARM-SEASON SHORT-DURATION HEAVY RAINFALL IN RELATION TO THE MCSS IN CHINA Jiong Chen 1, Yongguang Zheng 1*, Xiaoling Zhang 1, Peijun Zhu 2 1 National Meteorological
A Numerical Simulation Analysis of (Hukou) Labour Mobility Restrictions in China
 Labour Mobility Restrictions in China") A Numerical Simulation Analysis of (Hukou) Labour Mobility Restrictions in China John Whalley Department of Economics, The University of Western Ontario and Shunming Zhang Department of Finance, School
A Numerical Simulation Analysis of (Hukou) Labour Mobility Restrictions in China John Whalley Department of Economics, The University of Western Ontario and Shunming Zhang Department of Finance, School
Analysis for Regional Differences and Influence Factor of Rural Income in China
 Modern Economy, 2012, 3, 578-583 http://dx.doi.org/10.4236/me.2012.35076 Published Online September 2012 (http://www.scirp.org/journal/me) Analysis for Regional Differences and Influence Factor of Rural
Variance Analysis of Regional Per Capita Income Based on Principal Component Analysis and Cluster Analysis
 0 rd International Conference on Social Science (ICSS 0) ISBN: --0-0- Variance Analysis of Regional Per Capita Income Based on Principal Component Analysis and Cluster Analysis Yun HU,*, Ruo-Yu WANG, Ping-Ping
Sampling Scheme for 2003 General Social Survey of China
 Sampling Scheme for 2003 General Social Survey of China 1. Sampling Unit This survey uses a five-stage stratified sampling scheme with unequal probabilities. The sampling units at each stage are as follows:
Lightning Casualties and Damages in China from 1997 to 2009
 Lightning Casualties and Damages in China from 1997 to 2009 Wenjuan ZHANG 1, Qing MENG 1, Ming MA 2, Yijun ZHANG 1 1 Laboratory of Lightning Physics and Protection Engineering, Chinese Academy of Meteorological
A Study on Differences of China s Regional Economic Development Level Based on Cluster Analysis
 MATEC Web of Conferences 22, 0 5 022 ( 2015) DOI: 10.1051/ matec conf / 201 5 220 5 022 C Owned by the authors, published by EDP Sciences, 2015 A Study on Differences of China s Regional Economic Development
Correlation Analysis between Agglomeration Effect of Producer Service and Manufacture Labor Productivity in China
 American Journal of Industrial and Business Management, 2015, 5, 1-10 Published Online January 2015 in SciRes. http://www.scirp.org/journal/ajibm http://dx.doi.org/10.4236/ajibm.2015.51001 Correlation
Modeling the Seasonal Patterns of Coal and Electricity Production across Chinese Provinces
 Modeling the Seasonal Patterns of Coal and Electricity Production across Chinese Provinces Eric Girardin * M.J. Herrerias Université de la Méditerranée, Aix Marseille II, GREQAM 20 July 2011 Abstract This
Evidence on the impact of sustained exposure to air pollution on life expectancy from China s Huai River policy, Chen et al.
 Evidence on the impact of sustained exposure to air pollution on life expectancy from China s Huai River policy, Chen et al. 2013, PNAS 11.4.2017 Matti Liski Department of Economics, BIZ Research question
Polio Bulletin 2013 Issue No Week 50 (as of 17 December 2013)
") 2013 Issue No. 16 - Week 50 (as of 17 December 2013) HIGHLIGHTS China moving forward in Polio End Game Strategy Plan Today, 17 December 2013, China Food and Drug Administration (CFDA) has conveyed an international
2013 Issue No. 16 - Week 50 (as of 17 December 2013) HIGHLIGHTS China moving forward in Polio End Game Strategy Plan Today, 17 December 2013, China Food and Drug Administration (CFDA) has conveyed an international
Polio Bulletin 2016 Issue No Week 27 (as of 4 July 2016)
") 2016 Issue No. 14 - Week 27 (as of 4 July 2016) HIGHLIGHTS The role of data in helping to fight eradicate polio At the heart of the work of the GPEI lie two essential tasks: finding the virus (surveillance)
2016 Issue No. 14 - Week 27 (as of 4 July 2016) HIGHLIGHTS The role of data in helping to fight eradicate polio At the heart of the work of the GPEI lie two essential tasks: finding the virus (surveillance)
Polio Bulletin 2018 Issue No Week 25 (as of 26 June 2018)
") 2018 Issue No. 13 - Week 25 (as of 26 June 2018) HIGHLIGHTS 27th Meeting of the Technical Advisory Group on Immunization and Vaccine-preventable Diseases in the Western Pacific Region 19 22 June 2018 -
2018 Issue No. 13 - Week 25 (as of 26 June 2018) HIGHLIGHTS 27th Meeting of the Technical Advisory Group on Immunization and Vaccine-preventable Diseases in the Western Pacific Region 19 22 June 2018 -
A STUDY OF PADDYSTEM BORER (SCIRPOPHAGA INCERTULAS) POPULATION DYNAMICS AND ITS INFLUENCE FACTORS BASE ON STEPWISE REGRESS ANALYSIS
 POPULATION DYNAMICS AND ITS INFLUENCE FACTORS BASE ON STEPWISE REGRESS ANALYSIS") A STUDY OF PADDYSTEM BORER (SCIRPOPHAGA INCERTULAS) POPULATION DYNAMICS AND ITS INFLUENCE FACTORS BASE ON STEPWISE REGRESS ANALYSIS Linnan Yang *, Lin Peng 1, Fei Zhong 2, Yinsong Zhang 3 1 College of
A STUDY OF PADDYSTEM BORER (SCIRPOPHAGA INCERTULAS) POPULATION DYNAMICS AND ITS INFLUENCE FACTORS BASE ON STEPWISE REGRESS ANALYSIS Linnan Yang *, Lin Peng 1, Fei Zhong 2, Yinsong Zhang 3 1 College of
NBER WORKING PAPER SERIES INEQUALITY CHANGE IN CHINA AND (HUKOU) LABOUR MOBILITY RESTRICTIONS. John Whalley Shunming Zhang
 LABOUR MOBILITY RESTRICTIONS. John Whalley Shunming Zhang") NBER WORKING PAPER SERIES INEQUALITY CHANGE IN CHINA AND (HUKOU) LABOUR MOBILITY RESTRICTIONS John Whalley Shunming Zhang Working Paper 10683 http://www.nber.org/papers/w10683 NATIONAL BUREAU OF ECONOMIC
NBER WORKING PAPER SERIES INEQUALITY CHANGE IN CHINA AND (HUKOU) LABOUR MOBILITY RESTRICTIONS John Whalley Shunming Zhang Working Paper 10683 http://www.nber.org/papers/w10683 NATIONAL BUREAU OF ECONOMIC
Spatial Characteristics of Extreme Rainfall over China with Hourly through 24-Hour Accumulation Periods Based on National-Level Hourly Rain Gauge Data
 ADVANCES IN ATMOSPHERIC SCIENCES, VOL. 33, NOVEMBER 2016, 1218 1232 Spatial Characteristics of Extreme Rainfall over China with Hourly through 24-Hour Accumulation Periods Based on National-Level Hourly
Polio Bulletin 2015 Issue No Week 37 (as of 14 September 2015)
") HIGHLIGHTS Implementa on of Polio Endgame Strategy in the WHO region for Western Pacific (Update on progress as of 15 September 2015) According to the global Polio Eradica on and Endgame Strategic Plan
HIGHLIGHTS Implementa on of Polio Endgame Strategy in the WHO region for Western Pacific (Update on progress as of 15 September 2015) According to the global Polio Eradica on and Endgame Strategic Plan
Journal of Asian Business Strategy ON THE RELATIONSHIP BETWEEN FOREIGN TRADE AND REGIONAL DISPARITY IN CHINA IN THE POST-REFORM ERA
 2016 Asian Economic and Social Society. All rights reserved ISSN (P): 2309-8295, ISSN (E): 2225-4226 Volume 6, Issue 3, 2016, pp. 50-62 Journal of Asian Business Strategy http://aessweb.com/journal-detail.php?id=5006
Polio Bulletin 2018 Issue No. 8 - Week 14 (as of 11 April 2018)
") 2018 Issue No. 8 - Week 14 (as of 11 April 2018) HIGHLIGHTS Workshop on the WHO Guidance for Non-Poliovirus Facilities to Minimize Risk of Sample Collections Potentially Infectious for Polioviruses 10-11
2018 Issue No. 8 - Week 14 (as of 11 April 2018) HIGHLIGHTS Workshop on the WHO Guidance for Non-Poliovirus Facilities to Minimize Risk of Sample Collections Potentially Infectious for Polioviruses 10-11
Accepted Manuscript. The comprehensive environmental efficiency of socioeconomic sectors in China: An analysis based on a non-separable bad output SBM
 Accepted Manuscript The comprehensive environmental efficiency of socioeconomic sectors in China: An analysis based on a non-separable bad output SBM Qi He, Ji Han, Dabo Guan, Zhifu Mi, Hongyan Zhao, Qiang
CARPATHIAN JOURNAL OF FOOD SCIENCE AND TECHNOLOGY
 CARPATHIAN JOURNAL OF FOOD SCIENCE AND TECHNOLOGY journal homepage: http://chimie-biologie.ubm.ro/carpathian_journal/index.html EMPIRICAL STUDY ON CHINA DAIRY INDUSTRIAL CLUSTER AND INFLUENCE FACTORS-BASED
Spatial Changes of Chinese Cities Under the Condition of Exo-Urbanization
 Spatial Changes of Chinese Cities Under the Condition of Exo-Urbanization Yanguang Chen Department of Geography, Peking University, Beijing 0087, PRC. Email: chenyg@pku.edu.cn. Abstract: Only a preliminary
Assessment Model of Set Pair Analysis for Flood Loss Based on Triangular Fuzzy Intervals under α-cut
 Assessment Model of Set Pair Analysis for Flood Loss Based on Triangular Fuzzy Intervals under -Cut PAN Zheng-wei WU Kai-ya 2 JIN Ju-liang 3 LIU Xiao-wei. College of Natural Resources and Environmental
Analysis of Spatial-Temporal Characteristics and Pattern Evolution of Fishery Geographic Agglomeration in China
 2016 International Conference on Education, Management Science and Economics (ICEMSE-16) Analysis of Spatial-Temporal Characteristics and Pattern Evolution of Fishery Geographic Agglomeration in China
Water resource utilization efficiency and spatial spillover effects in China
 J. Geogr. Sci. 2014, 24(5): 771-788 DOI: 10.1007/s11442-014-1119-x 2014 Science Press Springer-Verlag Water resource utilization efficiency and spatial spillover effects in China SUN Caizhi 1, ZHAO Liangshi
Polio Bulletin 2018 Issue No. 4 - Week 6 (as of 13 February 2018)
") 2018 Issue No. 4 - Week 6 (as of 13 February 2018) HIGHLIGHTS Global Polio Certification Risk Assessment Face-to-Face Meeting, Malta, 30-31 January 2018 The Global Commission for Certification of Poliomyelitis
2018 Issue No. 4 - Week 6 (as of 13 February 2018) HIGHLIGHTS Global Polio Certification Risk Assessment Face-to-Face Meeting, Malta, 30-31 January 2018 The Global Commission for Certification of Poliomyelitis
Role of Meteorology on Urban Air Pollution Dispersion: A 20yr Analysis for Delhi, India
 Simple Interactive Models for Better Air Quality Role of Meteorology on Urban Air Pollution Dispersion: A 20yr Analysis for Delhi, India Dr. Sarath Guttikunda January, 2010 Delhi, India SIM-air Working
Current and Future Impacts of Wildfires on PM 2.5, Health, and Policy in the Rocky Mountains
 Current and Future Impacts of Wildfires on PM 2.5, Health, and Policy in the Rocky Mountains Yang Liu, Ph.D. STAR Grants Kick-off Meeting Research Triangle Park, NC April 5, 2017 Motivation The Rocky Mountains
Chin. Geogra. Sci Vol. 27 No. 3 pp Springer Science Press
 Chin. Geogra. Sci. 2017 Vol. 27 No. 3 pp. 456 470 Springer Science Press doi: 10.1007/s11769-017-0877-7 www.springerlink.com/content/1002-0063 Industrial Agglomeration Externalities, City Size, and Regional
Creating a Provincial Long-Term Growth Model for China using the Kohonen Algorithm
 Creating a Provincial Long-Term Growth Model for China using the Kohonen Algorithm Elpida Makriyannis, Department of Computer Science, University College London, Gower Street, London, WC1E 6BT, U.K. Philip
Chapter 2 Thermal Springs in China
 Chapter 2 Thermal Springs in China Abstract This chapter introduces the quantity and distribution of thermal springs in China, Based on the investigation of whole country in 1970s, the total number of
Effect of the strengthened western Pacific subtropical high on summer visibility decrease over eastern China since 1973
 University of Nebraska - Lincoln DigitalCommons@University of Nebraska - Lincoln Papers in the Earth and Atmospheric Sciences Earth and Atmospheric Sciences, Department of 2013 Effect of the strengthened
The Importance of Ammonia in Modeling Atmospheric Transport and Deposition of Air Pollution. Organization of Talk:
 The Importance of Ammonia in Modeling Atmospheric Transport and Deposition of Air Pollution Organization of Talk: What is modeled Importance of NH 3 emissions to deposition Status of NH 3 emissions (model-based)
THE LIMITS (AND HARMS) OF POPULATION POLICY: FERTILITY DECLINE AND SEX SELECTION IN CHINA UNDER MAO
 OF POPULATION POLICY: FERTILITY DECLINE AND SEX SELECTION IN CHINA UNDER MAO") THE LIMITS (AND HARMS) OF POPULATION POLICY: FERTILITY DECLINE AND SEX SELECTION IN CHINA UNDER MAO Kimberly Singer Babiarz, Paul Ma, Grant Miller, and Shige Song Online Appendix Read the full paper at
THE LIMITS (AND HARMS) OF POPULATION POLICY: FERTILITY DECLINE AND SEX SELECTION IN CHINA UNDER MAO Kimberly Singer Babiarz, Paul Ma, Grant Miller, and Shige Song Online Appendix Read the full paper at
Central Ohio Air Quality End of Season Report. 111 Liberty Street, Suite 100 Columbus, OH Mid-Ohio Regional Planning Commission
 217 218 Central Ohio Air Quality End of Season Report 111 Liberty Street, Suite 1 9189-2834 1 Highest AQI Days 122 Nov. 217 Oct. 218 July 13 Columbus- Maple Canyon Dr. 11 July 14 London 11 May 25 New Albany
Online Appendix Income Opportunities and Sea Piracy in Indonesia
 Online Appendix Income Opportunities and Sea Piracy in Indonesia Sebastian Axbard List of Tables 1 Labor Market Effects by Lights at Night........... 2 2 Validating Measure of (Additional Specifications)............................
Analysis of China s Haze Days in the Winter Half-Year and the Climatic Background during
 ADVANCES IN CLIMATE CHANGE RESEARCH 5(1): 1-6, 2014 www.climatechange.cn DOI: 10.3724/SP.J.1248.2014.001 CHANGES IN CLIMATE SYSTEM Analysis of China s Haze Days in the Winter Half-Year and the Climatic
Total-factor water efficiency of regions in China
 ARTICLE IN PRESS Resources Policy 31 (2006) 217 230 www.elsevier.com/locate/resourpol Total-factor water efficiency of regions in China Jin-Li Hu, Shih-Chuan Wang, Fang-Yu Yeh Institute of Business and
Evaluation on Social Vulnerability to Natural Disasters
 Kamla-Raj 2016 Anthropologist, 24(2): 570-580 (2016) Evaluation on Social Vulnerability to Natural Disasters Xuxian Yan 1 and Xianjun Li 2 1 College of Management Science and Engineering, Shanxi University
Over the course of this unit, you have learned about different
 70 People and Weather TA L K I N G I T O V E R Over the course of this unit, you have learned about different aspects of earth s weather and atmosphere. Atmospheric scientists, climatologists, hydrologists,
AREP GAW. AQ Forecasting
 AQ Forecasting What Are We Forecasting Averaging Time (3 of 3) PM10 Daily Maximum Values, 2001 Santiago, Chile (MACAM stations) 300 Level 2 Pre-Emergency Level 1 Alert 200 Air Quality Standard 150 100
PROJECT REPORT (ASL 720) CLOUD CLASSIFICATION
 CLOUD CLASSIFICATION") PROJECT REPORT (ASL 720) CLOUD CLASSIFICATION SUBMITTED BY- PRIYANKA GUPTA 2011CH70177 RINI KAPOOR 2011CH70179 INDIVIDUAL CONTRIBUTION- Priyanka Gupta- analysed data of region considered in India (West:80,
PROJECT REPORT (ASL 720) CLOUD CLASSIFICATION SUBMITTED BY- PRIYANKA GUPTA 2011CH70177 RINI KAPOOR 2011CH70179 INDIVIDUAL CONTRIBUTION- Priyanka Gupta- analysed data of region considered in India (West:80,
DROUGHT IN MAINLAND PORTUGAL
 DROUGHT IN MAINLAND Ministério da Ciência, Tecnologia e Ensino Superior Instituto de Meteorologia, I. P. Rua C Aeroporto de Lisboa Tel.: (351) 21 844 7000 e-mail:informacoes@meteo.pt 1749-077 Lisboa Portugal
Spatial Inequality Analysis of Fire Risk in China
 Journal of Risk Analysis and Crisis Response, Vol. 6, No. 3 (October 2016), 145-155 Spatial Inequality Analysis of Fire Risk in China Guohui Li, Lizeng Zhao, Weiping Han, Ying Wang Tianjin Fire Research
The Impact of Urbanization and Factor Inputs on China s Economic Growth A Spatial Econometrics Approach
 Economic Management Journal December 2018, Volume 7 Issue 2, PP. 145-154 The Impact of Urbanization and Factor Inputs on China s Economic Growth A Spatial Econometrics Approach Yajie Bai SHU-UTS SILC Business
Determining Minimum Wages in China: Do Economic Factors Dominate?
 DISCUSSION PAPER SERIES IZA DP No. 9716 Determining Minimum Wages in China: Do Economic Factors Dominate? Christian Dreger Reinhold Kosfeld Yanqun Zhang February 2016 Forschungsinstitut zur Zukunft der
Preliminary Experiences with the Multi Model Air Quality Forecasting System for New York State
 Preliminary Experiences with the Multi Model Air Quality Forecasting System for New York State Prakash Doraiswamy 1, Christian Hogrefe 1,2, Winston Hao 2, Brian Colle 3, Mark Beauharnois 1, Ken Demerjian
ECONOMICS REGIONAL DISPARITY, TRANSITIONAL DYNAMICS AND CONVERGENCE IN CHINA. Tsun Se Cheong. and. Yanrui Wu
 ECONOMICS REGIONAL DISPARITY, TRANSITIONAL DYNAMICS AND CONVERGENCE IN CHINA by Tsun Se Cheong and Yanrui Wu Business School University of Western Australia DISCUSSION PAPER 12.23 REGIONAL DISPARITY, TRANSITIONAL
Springer is collaborating with JSTOR to digitize, preserve and extend access to Social Indicators Research.
 Principal Component Analysis on Human Development Indicators of China Author(s): Dejian Lai Reviewed work(s): Source: Social Indicators Research, Vol. 61, No. 3 (Mar., 2003), pp. 319-330 Published by:
Effect of rainfall and temperature on rice yield in Puri district of Odisha in India
 2018; 7(4): 899-903 ISSN (E): 2277-7695 ISSN (P): 2349-8242 NAAS Rating: 5.03 TPI 2018; 7(4): 899-903 2018 TPI www.thepharmajournal.com Received: 05-02-2018 Accepted: 08-03-2018 A Baliarsingh A Nanda AKB
Land Use Regionalization of Rural Settlements in China
 Chin. Geogra. Sci. 2013 Vol. 23 No. 4 pp. 421 434 Springer Science Press doi: 10.1007/s11769-013-0592-y www.springerlink.com/content/1002-0063 Land Use Regionalization of Rural Settlements in China SONG
Article Internet Access, Spillover and Regional Development in China
 Article Internet Access, Spillover and Regional Development in China Juan Lin 1, Zhou Yu 2, *, Yehua Dennis Wei 3 and Mingfeng Wang 1 1 Center for Modern Chinese City Studies, East China Normal University,
Study of Hydrometeorology in a Hard Rock Terrain, Kadirischist Belt Area, Anantapur District, Andhra Pradesh
 Open Journal of Geology, 2012, 2, 294-300 http://dx.doi.org/10.4236/ojg.2012.24028 Published Online October 2012 (http://www.scirp.org/journal/ojg) Study of Hydrometeorology in a Hard Rock Terrain, Kadirischist
China Chemical Pharmaceutical Market Report, 2008
 China Chemical Pharmaceutical Market Report, 2008 By the end of Aug, 2008, the total output value of China s chemical pharmaceutical industry was CNY 273.272 billion, among which, the total output value
Driving Restriction, Traffic Congestion, and Air Pollution: Evidence from Beijing
 Driving Restriction, Traffic Congestion, and Air Pollution: Evidence from Beijing Chen Liu Junjie Zhang UC San Diego Camp Resources XXI August 10-12, 2014 Traffic Congestion and Air Pollution 1 Motivation
PRELIMINARY EXPERIENCES WITH THE MULTI-MODEL AIR QUALITY FORECASTING SYSTEM FOR NEW YORK STATE
 PRELIMINARY EXPERIENCES WITH THE MULTI-MODEL AIR QUALITY FORECASTING SYSTEM FOR NEW YORK STATE Prakash Doraiswamy 1,,*, Christian Hogrefe 1,2, Winston Hao 2, Brian Colle 3, Mark Beauharnois 1, Ken Demerjian
Chiang Rai Province CC Threat overview AAS1109 Mekong ARCC
 Chiang Rai Province CC Threat overview AAS1109 Mekong ARCC This threat overview relies on projections of future climate change in the Mekong Basin for the period 2045-2069 compared to a baseline of 1980-2005.
Characteristics of the Acid Rain Variation in China During and Associated Causes
 NO.2 ZHAO Yanxia and HOU Qing 239 Characteristics of the Acid Rain Variation in China During 1993 2006 and Associated Causes ZHAO Yanxia 1 ( ) and HOU Qing 1,2 ( ) 1 Chinese Academy of Meteorological Sciences,
2003 Water Year Wrap-Up and Look Ahead
 2003 Water Year Wrap-Up and Look Ahead Nolan Doesken Colorado Climate Center Prepared by Odie Bliss http://ccc.atmos.colostate.edu Colorado Average Annual Precipitation Map South Platte Average Precipitation
Emerging Needs, Challenges and Response Strategy
 Emerging Needs, Challenges and Response Strategy Development of Integrated Observing Systems in China JIAO Meiyan Deputy Administrator China Meteorological Administration September 2011 Geneva Outline
Temporal Trends in Forest Fire Season Length
 Temporal Trends in Forest Fire Season Length Alisha Albert-Green aalbertg@sfu.ca Department of Statistics and Actuarial Science Simon Fraser University Stochastic Modelling of Forest Dynamics Webinar March
Study on China s Electronic Information Industrial Agglomeration and Regional Industrial Competitiveness
 TELKOMNIKA, Vol. 11, No. 7, July 2013, pp. 4020 ~ 4029 e-issn: 2087-278X 4020 Study on China s Electronic Information Industrial Agglomeration and Regional Industrial Competitiveness Xuan Zhaohui*1, LV
Estimating the provincial environmental Kuznets curve in China: a geographically weighted regression approach
 https://doi.org/10.1007/s00477-017-1503-z ORIGINAL PAPER Estimating the provincial environmental Kuznets curve in China: a geographically weighted regression approach Yoomi Kim 1 Katsuya Tanaka 2 Chazhong
Variability of Reference Evapotranspiration Across Nebraska
 Know how. Know now. EC733 Variability of Reference Evapotranspiration Across Nebraska Suat Irmak, Extension Soil and Water Resources and Irrigation Specialist Kari E. Skaggs, Research Associate, Biological
Environmental Effects of Foreign Trade and Its Spatial Variations in Mid-eastern Provinces and Cities of China
 Chin. Geogra. Sci. 2012 Vol. 22 No. 5 pp. 626 636 doi: 10.1007/s11769-012-0546-9 www.springerlink.com/content/1002-0063 Environmental Effects of Foreign Trade and Its Spatial Variations in Mid-eastern
WHEN IS IT EVER GOING TO RAIN? Table of Average Annual Rainfall and Rainfall For Selected Arizona Cities
 WHEN IS IT EVER GOING TO RAIN? Table of Average Annual Rainfall and 2001-2002 Rainfall For Selected Arizona Cities Phoenix Tucson Flagstaff Avg. 2001-2002 Avg. 2001-2002 Avg. 2001-2002 October 0.7 0.0
UPDATE OF REGIONAL WEATHER AND SMOKE HAZE December 2016
 UPDATE OF REGIONAL WEATHER AND SMOKE HAZE December 2016 1. Review of Regional Weather Conditions in November 2016 1.1 Inter monsoon conditions prevailed in the first half of November 2016. During this
The Output Effect of Trade Openness in China: Evidence from Provincial Data
 The Output Effect of Trade Openness in China: Evidence from Provincial Data Jang C. Jin (jcjin@cuhk.edu.hk) Chinese University of Hong Kong, Hong Kong Abstract Unlike other studies that concentrate on
Supplementary appendix
 Supplementary appendix This appendix formed part of the original submission and has been peer reviewed. We post it as supplied by the authors. Supplement to: Lowe R, Stewart-Ibarra AM, Petrova D, et al.
Local Government, Polluting Enterprise and Environmental Pollution: Based on MATLAB Software
 2182 JOURNAL OF SOFTWARE, VOL. 7, NO. 10, OCTOBER 2012 Local Government, Polluting Enterprise and Environmental Pollution: Based on MATLAB Software Zhiyi Guo, Zhousheng Zheng School of Economics, Lanzhou
UPDATE OF REGIONAL WEATHER AND SMOKE HAZE November 2016
 UPDATE OF REGIONAL WEATHER AND SMOKE HAZE November 2016 1. Review of Regional Weather Conditions in November 2016 1.1 Southwest Monsoon conditions prevailed on most days in October 2016 and the winds were
Climatology and Trends of High Temperature Extremes across China in Summer
 ATMOSPHERIC AND OCEANIC SCIENCE LETTERS, 2009, VOL. 2, NO. 3, 153 158 Climatology and Trends of High Temperature Extremes across China in Summer WEI Ke and CHEN Wen Center for Monsoon System Research,
Direct Normal Radiation from Global Radiation for Indian Stations
 RESEARCH ARTICLE OPEN ACCESS Direct Normal Radiation from Global Radiation for Indian Stations Jaideep Rohilla 1, Amit Kumar 2, Amit Tiwari 3 1(Department of Mechanical Engineering, Somany Institute of
UPDATE OF REGIONAL WEATHER AND SMOKE HAZE (December 2017)
") UPDATE OF REGIONAL WEATHER AND SMOKE HAZE (December 2017) 1. Review of Regional Weather Conditions for November 2017 1.1 In November 2017, Southeast Asia experienced inter-monsoon conditions in the first
UPDATE OF REGIONAL WEATHER AND SMOKE HAZE (December 2017) 1. Review of Regional Weather Conditions for November 2017 1.1 In November 2017, Southeast Asia experienced inter-monsoon conditions in the first
Understanding the spatial disparities and vulnerability of population aging in China
 Received: 29 December 2017 Revised: 26 June 2018 Accepted: 16 October 2018 DOI: 10.1002/app5.267 ORIGINAL ARTICLE Understanding the spatial disparities and vulnerability of population aging in China Yang
China s changing landscape during the 1990s: Large-scale land transformations estimated with satellite data
 GEOPHYSICAL RESEARCH LETTERS, VOL. 32, L02405, doi:10.1029/2004gl021649, 2005 China s changing landscape during the 1990s: Large-scale land transformations estimated with satellite data Jiyuan Liu, 1 Hanqin
Dependence of Air Quality on Meteorological Parameters in Dar es Salaam, Tanzania
 Tanzania Journal of Natural and ISSN 1821-7249 Applied Sciences (TaJONAS) Faculty of Natural and Applied Science December 21: Volume 1, Issue 2 Dependence of Air Quality on Meteorological Parameters in
Influence Regularity of Fog on Expressway in China
 Influence Regularity of Fog on Expressway in China Tang Jun-jun 1, Bai Song-ping 2, He Yong 1, Gao Hai-long 1 1 Research Institute of Highway, MOC, Key Laboratory of Road Safety Technology, MOC, PRC. 8
The Canadian ADAGIO Project for Mapping Total Atmospheric Deposition
 The Canadian ADAGIO Project for Mapping Total Atmospheric Deposition Amanda S. Cole Environment & Climate Change Canada (ECCC) MMF-GTAD Workshop Geneva, Switzerland February 28, 2017 ADAGIO team Amanda
SPATIAL AND TEMPORAL PATTERN OF FOREST/PLANTATION FIRES IN RIAU, SUMATRA FROM 1998 TO 2000
 SPATIAL AND TEMPORAL PATTERN OF FOREST/PLANTATION FIRES IN RIAU, SUMATRA FROM 1998 TO 2000 SHEN Chaomin, LIEW Soo Chin, KWOH Leong Keong Centre for Remote Imaging, Sensing and Processing (CRISP) Faculty
End of Ozone Season Report
 End of Ozone Season Report Central Ohio: April 1 through October 31, 2016 The Mid-Ohio Regional Planning Commission (MORPC) is part of a network of agencies across the country that issues daily air quality
Mount Cotton Quarry Dust Investigation
 Mount Cotton Quarry Dust Investigation December 28 to December 29 Department of Science, Information Technology, Innovation and the Arts Mount Cotton Quarry Dust Investigation: December 28 to December
Aerosol Optical Depth investigated with satellite remote sensing observations in China
 IOP Conference Series: Earth and Environmental Science OPEN ACCESS Aerosol Optical Depth investigated with satellite remote sensing observations in China To cite this article: Hu Die et al 2014 IOP Conf.
Who is polluting the Columbia River Gorge?
 Who is polluting the Columbia River Gorge? Final report to the Yakima Nation Prepared by: Dan Jaffe, Ph.D Northwest Air Quality, Inc. 7746 Ravenna Avenue NE Seattle WA 98115 NW_airquality@hotmail.com December
Measurement and Analysis of the Vertical Distribution Characteristic of the Atmospheric Particle Concentration in Beijing District
 International Journal of Environmental Science and Development, Vol. 5, No. 2, April 214 Measurement and Analysis of the Vertical Distribution Characteristic of the Atmospheric Particle Concentration in
Modeling Study of A Typical Summer Ozone Pollution Event over Yangtze River Delta
 36 11 2015 11 ENVIRONMENTAL SCIENCE Vol 36 No 11 Nov 2015 * - - 210044 WRF /Chem 2013 8 10 ~ 18 11 ~ 13 h 15 00 WRF /Chem X51 A 0250-3301 2015 11-3981-08 DOI 10 13227 /j hjkx 2015 11 006 Modeling Study
Life Science Archives (LSA)
") Available online at www.jpsscientificpublications.com Life Science Archives (LSA) ISSN: 2454-1354 Volume 2; Issue - 3; Year 2016; Page: 579 585 DOI: 10.21276/lsa.2016.2.3.9 Research Article ANALYSIS OF
Available online at www.jpsscientificpublications.com Life Science Archives (LSA) ISSN: 2454-1354 Volume 2; Issue - 3; Year 2016; Page: 579 585 DOI: 10.21276/lsa.2016.2.3.9 Research Article ANALYSIS OF
INTRODUCTION AND PRELIMINARY ANALYSIS OF STRONG MOTION RECORDINGS FROM THE 12 MAY 2005 Ms8.0 WENCHUAN EARTHQUAKE OF CHINA
 INTRODUCTION AND PRELIMINARY ANALYSIS OF STRONG MOTION RECORDINGS FROM THE 12 MAY 2005 Ms8.0 WENCHUAN EARTHQUAKE OF CHINA Li Xiaojun 1, Zhou Zhenghua 1, Huang Moh 3, Wen Ruizhi 1, Yu Haiyin 1, Lu Dawei
Big Bend Regional Aerosol & Visibility Observational Study
 Big Bend Regional Aerosol & Visibility Observational Study BRAVO - Results Bret Schichtel National Park Service, Schichtel@cira.colostate.edu Presented at the BRAVO Public Meeting Alpine, Texas September
Study of Changes in Climate Parameters at Regional Level: Indian Scenarios
 Study of Changes in Climate Parameters at Regional Level: Indian Scenarios S K Dash Centre for Atmospheric Sciences Indian Institute of Technology Delhi Climate Change and Animal Populations - The golden
Long-lead prediction of the 2015 fire and haze episode in Indonesia
 Long-lead prediction of the 2015 fire and haze episode in Indonesia Robert Field 1,2 Dilshad Shawki 3, Michael Tippett 2, Bambang Hero Saharjo 4, Israr Albar 5, Dwi Atmoko 6, Apostolos Voulgarakis 1 1.
Forecasting the electricity consumption by aggregating specialized experts
 Forecasting the electricity consumption by aggregating specialized experts Pierre Gaillard (EDF R&D, ENS Paris) with Yannig Goude (EDF R&D) Gilles Stoltz (CNRS, ENS Paris, HEC Paris) June 2013 WIPFOR Goal
Spatial Drought Assessment Using Remote Sensing and GIS techniques in Northwest region of Liaoning, China
 Spatial Drought Assessment Using Remote Sensing and GIS techniques in Northwest region of Liaoning, China FUJUN SUN, MENG-LUNG LIN, CHENG-HWANG PERNG, QIUBING WANG, YI-CHIANG SHIU & CHIUNG-HSU LIU Department
Does accounting for spatial effects help forecasting the growth of Chinese. provinces?
 Does accounting for spatial effects help forecasting the growth of Chinese provinces? Eric Girardin Konstantin A. Kholodilin Abstract In this paper, we make multi-step forecasts of the annual growth rates
Brief introduction to recovery and reconstruction
 Brief introduction to recovery and reconstruction of Wenchuan earthquake stricken region He Yongnian China Earthquake Administration May 2011 Major parameters of Wenchuan earthquake Original time: 14:28,
Rainfall Observations in the Loxahatchee River Watershed
 Rainfall Observations in the Loxahatchee River Watershed Richard C. Dent Loxahatchee River District September 1997 Introduction Rain is a common occurrence in south Florida, yet its presence or absence
Effects of Intraregional Disparities on Regional Development in China: Inequality Decomposition and Panel-Data Analysis
 Effects of Intraregional Disparities on Regional Development in China: Inequality Decomposition and Panel-Data Analysis By Reuter, Ulrich * ABSTRACT This paper analyzes the development and effects of intra-provincial
Physicochemical and Optical Properties of Aerosols in South Korea
 Physicochemical and Optical Properties of Aerosols in South Korea Seungbum Kim, Sang-Sam Lee, Jeong-Eun Kim, Ju-Wan Cha, Beom-Cheol Shin, Eun-Ha Lim, Jae-Cheol Nam Asian Dust Research Division NIMR/KMA
PYROGEOGRAPHY OF THE IBERIAN PENINSULA
 PYROGEOGRAPHY OF THE IBERIAN PENINSULA Teresa J. Calado (1), Carlos C. DaCamara (1), Sílvia A. Nunes (1), Sofia L. Ermida (1) and Isabel F. Trigo (1,2) (1) Instituto Dom Luiz, Universidade de Lisboa, Lisboa,