Survival Analysis for Interval Censored Data - Nonparametric Estimation
|
|
|
- Mitchell Bates
- 6 years ago
- Views:
Transcription
1 Survival Analysis for Interval Censored Data - Nonparametric Estimation Seminar of Statistics, ETHZ Group 8, 02. May 2011 Martina Albers, Nanina Anderegg, Urs Müller
2 Overview Examples Nonparametric MLE for Current Status Censored Data Existence? Uniqueness? Characterization? Asymptotic Behavior?
3 Goals Different types of censoring Terminology Examples INTRODUCTION
4 Censored data Right censoring Current status censoring Interval censoring case Mixed case interval censoring Bivariate interval censored data k
5 Right censoring 1. X: failure time X ~ F 2. C: censoring time C ~ G 3. Cindependent of X 4. n observations: iid copies of Variable of interest ( ) ( U, ) min( X, C), 1 ( X C ) Goal: Estimate distribution function F( x) = P[ X x]
6 Censored data Right censoring Current status censoring Interval censoring case Mixed case interval censoring Bivariate interval censored data k
7 Current status censoring 1. X: failure time X ~ F 2. T: observation time T ~ G 3. X independent of T 4. n observations: iid copies of Variable of interest ( T ) ( T ),,1 { X T } Goal: Estimate distribution function F( x) = P[ X x]
8 Right censoring vs. Current status censoring Right Censoring Observe: Current Status Censoring Observe: ( ) ( U, ) min( X, C), 1 { X C } ( T ) ( T ),,1 { X T }
9 Example: Lung cancer data Time of onset of lung cancer (non lethal) 144 (special) mice (likely to get cancer) sacrifice each mouse at random time Determine current status: cancer/no cancer 2 groups Conventional environment (96) Germfree environment (48) Time to onset of lung cancer: [0 (start) onset of cancer]
10 Time to onset of cancer At time of sacrifice: find tumor Onset occurred at some earlier point At time of sacrifice: no tumor Onset will occur later/never Goal: estimate distribution of time to onset! (analyze for the two groups separately)
11 Mathematical Formulation X: time to onset of lung cancer T: time of sacrifice Random time! (chosen randomly!) Both are measured from the beginning of study
12 Mathematical Formulation ( x,t,δ ) realization of ( X,T, ) Cancer was observed at time of sacrifice: x t observe: conclusion: Cancer not observed at time of sacrifice: x > t observe: conclusion: ( t 1 ) (,1), { x t} = t ( 0 ] x,t ( t 1 ) (,0), { x t} = t ( t ) x,
13 Right censoring vs. Current status censoring Right Censoring Observe: ( ) ( U, ) min( X, C), 1 ( X C ) Current Status Censoring Observe: ( T ) ( T ),,1 { X T } Either know x exactly or c, NEVER know x exactly, i.e. x 0,t or x t, x ( ) ( ] ( )
14 Right censoring c x x ( c, )
15 Current status censoring (Interval censoring case 1) t ( 0 ] x ( t, ) x,t
 Germfree")
16 The data Conventional environment (96) Germfree environment (48)
17 The data With tumor: 381 After 381days: tumor was found in mouse No tumor: 45 After 45days: no tumor was found in mouse
18 Censored data Right censoring Current status censoring Interval censoring case Mixed case interval censoring Bivariate interval censored data k
19 2 intervals (k+1)intervals!
20 Theoretical example: HIV infection Age at HIV infection Representative sample Follow each person for 2 years 2 HIV tests during this period Determine: negative/positive Time to infection: [0 (start) HIV infection]
21 Interval censoring case k=2 1. X: failure time X ~ F 2. ( T ) 1,T 2 : observation times ( T T ) ~ G 1, 2 3. X independent of T 1,T 2 4. n observations: iid copies of ( ) ( T, T ), ( 1,1, ) ( ) T, 2 { X T } { T < X T } { T < X } ( ) Variable of interest Goal: Estimate distribution function F( x) = P[ X x]
22 2 observation times T1 T2 ( ) Nota bene: 3 = 1 1 2
23 Interval Censoring, case 1 vs. Interval Censoring, case k Case 1 1 observation per subject: ( T ) T, 1{ X T } ( ) Case k, ( ) k observations per subject: T, = (( T, T,..., T ) ( )) 1 2 k, 1 { X T,1,...,1 1 } { T1 < X T2 } { Tk < X } ( ) = ( T,1, ) T, { X T } 1{ T < X }
24 Mathematical Formulation X: age at HIV infection ( ) : ages at time of HIV tests T 1,T 2 Random times (chosen randomly!) All times are measured from the beginning of study
25 Mathematical Formulation ( ) x, t1, t2, δ1, δ2, δ3 realization of 1 st test is positive: x t 1 observe: conclusion: 1 st test is negative, 2 nd test is positive: t1 < x t 2 observe: conclusion: 1 st and 2 nd test are negative: x > t 2 observe: conclusion ( X, T, T,, ) , ( t t,1,1,1 ) ( t,,1,0,0 ), 2 { x t } { t < x t } { t < x} = t x x ( 0, t ] ( t t,1,1,1 ) ( t,,0,1,0 ), 2 { x t } { t < x t } { t < x} = t [ ) t 1,t 2 ( t t,1,1,1 ) ( t,,0,0,1 ), 2 { x t1} { t1< x t2} { t < x} = 1 t2 x t 2, 1 2 [ ) 3
26 Censored data Right censoring Current status censoring Interval censoring case Mixed case interval censoring Bivariate interval censored data k
27 fixed k variable K! for all patients: k observations (fix!) Let number of observations vary from patient to patient Define random variable Kas number of visits
28 HIV infection Patient A: ( t t,1,1,1 ) ( t,,1,0,0 ), 2 { x t } { t < x t } { t < x} = t Patient B: ( t t, t,1,1,1,1 ) ( t, t,,0,0,1,0 ), 2 3 { x t } { t < x t } { t < x t } { t < x} = t Patient C: K = 2 K = 3 K = 1 ( t 1,1 ) (,0,1), { x t } { t < x} = 1 1 t 1 1
29 Example: Breast cosmesisdata Time to breast retraction 94 patients clinic visits to determine current status retraction/no retraction Number of visits vary from patient to patient! 2 groups Radiotherapy (46) Radiotherapy + chemotherapy (48) Time to breast retraction: [0 (start) retraction]
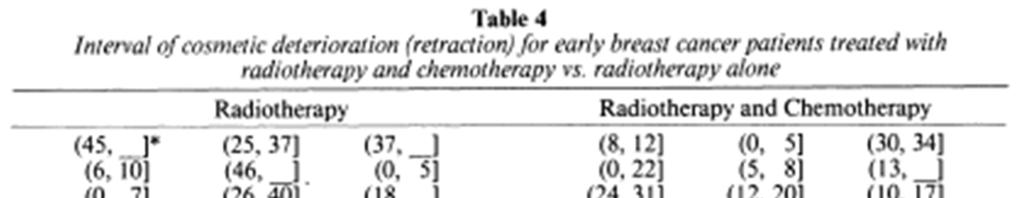
30 The data
31 The data ( 6,10] At 6 months: patient showed no deterioration in initial cosmetic result By 10 months: retraction was present 45, _ At 45 months: patient showed no deterioration in initial cosmetic result _ : No second test ( ]
32 Censored data Right censoring Current status censoring Interval censoring case Mixed case interval censoring Bivariate interval censored data k
33 Bivariate interval censoring 1. ( X,Y ) : failure times ( X, Y ) ~ F U = ( U ( U, V 1, U2 ), V = ( V1, V2 ) ) ~ G ( X,Y ) 2. : observation times 3. independent of V 4. n observations: iid copies of where = U, ( ) Variables of interest, ( U,V ) (,,,,,,, ) , Goal: Estimate distribution function F( x, y) = P[ X x, Y y] 33
34 Bivariate interval censoring R R R R R R R R R = = = = = = = = = ij = 1, {( X Y ) } R ij ( 0, U1] ( 0, V1 ] ( U1, U2] ( 0, V1 ] ( U2, ) ( 0, V1 ] ( 0, U1] ( V1, V2 ] ( U1, U2] ( V1, V2 ] ( U2, ) ( V1, V2 ] ( 0, U1] ( V2, ) ( U1, U2] ( V2, ) ( U, ) ( V, ) 2 2
35 Sketch on blackboard
36 Example: ACTG 181 Time to shedding of a cytomegalovirus (CMV) Time to colonization of mycobacterium avium complex (MAC) 204 patients test for CMV shedding and MAC colonization at least once during trial (no prior CMV/MAC diagnosis) Tested at regular monthly intervals
37 Time to CMV shedding and MAC colonization Patient didn t miss any clinical visit: record month of 1 st positive test ( discrete failure time data) Patient missed some visits and was tested positive after missed visit: record time interval ( discrete interval censored failure time data) Goal: estimate distribution of time of shedding and of colonization!
38 Mathematical Formulation X: time to CMV shedding Y: time to MAC colonization ( U,U 1 2 ) ( ) : times of tests for CMV shedding : times of tests for MAC colonization V 1,V 2 Model is not perfect here! Number of observations varies from patient to patient Model should include different or random number of observation times
39 The data 204 subjects: 68 interval censored time of CMV shedding 10 interval censored time of MAC colonization 89 right censored times of CMV shedding 190 right censored times of MAC colonization 46 left censored times of CMV shedding 4 left censored times of MAC colonization Test every 12 weeks, i.e. quarterly screens Visit rounded to closest quarter
40 Number of patients The data an excerpt CMV MAC CMV MAC CMV MAC CMV MAC CMV MAC CMV MAC CMV MAC
41 ( ) 0,6 15 : The data at start: no CMV shedding missed controls in the following 6 months after 6 months: first CMV shedding MAC colonization after 15 months ( ) 3,3 : actual left and right endpoints are rounded to the same number.
42 Derive the likelihood for different censoring models THE LIKELIHOOD
43 Nonparametric MLE Completely nonparametric Do not assume that failure time distribution follows any parametric model Only assumption: variable of interest (X) is independent of censoring resp. observation times (Cresp. T)
44 Recall: Right censored data Likelihood of n iid observations n i= 1 f Nonparametric MLE F maximizes: ( u δ ), ( u, δ ),..., (, δ ) 1, ( ) δ ( ( )) ( ( ) ) ( ) i 1 δi δi u 1 F u 1 G u g u i L n n i ( ) ({ }) δ = ( ( )) i F F u 1 F u i= 1 i i i 1 δ i i u n 1 δ i n where F ({ u} ) = F( u) F( u )
45 Other representation: observed sets R, : observed sets 1 R2,..., R n Contain the unobservable realization of X! i.e.: { ui} if δi = 1 Ri = u, if δ = 0 ( i ) Nonparametric MLE F maximizes: ( ) Where is the probability under distribution Fthat X R i ( ) { } P F R i n i ( ) δi ( ( )) 1 δi 1 ( ) L F = F u F u = P R n i i F i i= 1 i= 1 n
46 Current status data Recall: n observations: iid copies of i.e.: X ~ ( T ) ( T ),,1 { X T } 1, t n n ( t δ ), ( t, δ ),..., (, δ ) F T ~ G Likelihood = product of densities of observations Consider = 0 and = 1separately, then combine
47 Current status data Likelihood of n iid observations Nonparametric MLE F maximizes: ( ) ( ) ( ) ( ) = n i i i i t g t F t F i i δ δ ( ) ( ) ( ) ( ) = = n i i i n i i t F t F F L δ δ ( ) ( ) ( ) n t n t t δ δ δ,,...,,,,
48 Other representation: observed sets R, : observed sets 1 R2,..., R n Recall: contain the unobservable realization of X i.e.: ( 0, ti ] if δi = 1 Ri = t, if δ = 0 ( i ) Nonparametric MLE F maximizes: ( ) Where is the probability under distribution F that X R i P F R i n i ( ) ( ) 1 ( ) i ( ) 1 i ( ) δ δ L F = F t F t = P R n i i F i i= 1 i= 1 n
49 General form of the likelihood Representation in terms of observed sets: R 1, R2,..., R n L n n ( F ) = P ( ) F Ri i= 1 where change depending on censoring model! R i
50 ReducingtheOptimizationProblem Likelihood n L ( F) = P ( R ) n F i i= 1 Optimization problem: sup l ( F), F F n with l ( F) log L ( F) log P ( R ) = = n n F i i= 1 where F is the space of all distribution functions on the appropriate space. n
51 ReducingtheOptimizationProblem Problem infinite-dimensional optimization problem Solution maximal intersections A,, of observed sets 1 Am R,, 1 Rn Definition A j is a maximal intersection iff A R for some subset j = β { 1,, n} i β j i j { 1,, n} * no strict superset of s.t.: β j β j i β * j R i.
52 ReducingtheOptimizationProblem Maximize log PF ( Ri ), i= 1 distribute probability mass (total amount 1) on probability space. Properties of MLE n No mass outside the sets R, 1, Rn Some positive mass in each set R,, 1 Rn Mass only in maximal intersections: A,, 1 Am indifferent to the distribution of mass within the maximal intersections (representational nonuniqueness)
53 ReducingtheOptimizationProblem α,, : masses in corresponding maximal 1 αm intersection C: ( m n) clique matrix, with Likelihoodin termsof l n n ( α) = log P ( R ) i= 1 α i α C = 1{ A R } ji j i n n n = log α j1{ Aj Ri} = log C i= 1 j= 1 i= 1 ( T α ) i
54 Existenceand(non-)uniquenessofthe Notation where A Theorem 3.1 ˆα Theorem 3.2 The MLE exists. l n MLE ( ˆ α) = max l ( α) α A n m m = α R : α j 0; j = 1, m; α j = 1 i= 1 n Log-likelihood log PF ( Ri ) strictly concave in P ( F R ). i= 1 Thus, MLE estimates the probabilities P ( 1 ),, F R PF ( Rn ) of the observation rectangles uniquely. Proof: cf. Blackboard
55 Existenceand(non-)uniquenessofthe Remarks MLE Log-likelihood (not strictly) concave in F two different functions vector ( ) ( ) ( P R P R ) F F n 1,, F1, F2 F can yield same The estimation of F is not necessarily unique. Same holds for α (mixture non-uniqueness)
 { } = max log log log l + 1 4 1 2 2 3 3 4 α1 + α2 + α3 + α4 = 1 ˆα not unique!")
56 (Non-)uniquenessoftheMLE Example max α R 4 4 i= 1 log subject to P α Solution: α 0, j = 1,,4 j ( R ) i ( α + α ) + ( α + α ) + ( α + α ) + og ( α α ) { } = max log log log l α1 + α2 + α3 + α4 = 1 ˆα not unique! ˆ ˆ 1 ˆ ˆ 1 α1 = α3 = x, α2 = α4 = x, for some x 0, 2 2
57 Non-uniqueness of the MLE Representational non-uniqueness where to put the masses in the maximal intersections Mixture non-uniqueness how to assign masses to the intersections
58 (Non-)uniqueness of the MLE Handling the representational nonuniqueness Lower bound for MLE by assigning all mass to the upper right corners of the maximal intersections Upper bound for MLE by assigning all mass to the lower left corners of the maximal intersections
59 Sufficient condition for mixture uniqueness Theorem 3.3 ˆα The MLE is unique if the clique matrix C has rank m. Proof: cf. Blackboard.
60 Basic Characterization of the MLE CURRENT STATUS DATA
61 Problem Setting Recall 1. X: failure time X ~ F 2. T: observation time T ~ G 3. Xindependent of T 4. n observations: iid copies of ( T ) ( T ),,1 { X T } Goal: Estimate distribution function F( x) = P[ X x]
62 Notation T (1) ( ) Problem Setting,, T : order statistics of T n 1, T,, : corresponding values, n (1) ( ), n i.e. Recall = if T = T ( i) j ( i) j. n i n = i i i= 1 n L ( F) F( T ) (1 F( T )) 1 l ( F) = log F( T ) + (1 )log(1 F( T )) n i i i i i= 1 i
63 Basic Characterization Let n Y = { y R : 0 < y y < 1} 1 n ŷ Define by setting yˆ Fˆ. ( T ) ( ) i n i an estimator of F
64 Basic Characterization Corollary 1.2 ŷ The vector is the MLE iff j {, n} { ˆ } ( i) yi 1, : 0. i< j If yˆ > yˆ (with yˆ = 0, yˆ = 1) : j j 1 0 n+ 1 { } ( i) yi i< j ˆ = 0
65 Basic Characterization Proposition 1.3 P = Pi = i, ( j), i = 0,, n j i H greatest convex minorant of P. ŷ is MLE iff i = 1, n : y equals the left derivative of H at. ˆi Definition His called greatest convex minorantof V, if - His a convex function such that - H ( t) = V ( t) holds if Hhas a change of slope. H ( t) V ( t), t, i
66 Asymptotic Theory Consistency: «Does the MLE converge to the actual distribution?» Rate of convergence: «How fast does converge?» Limiting distribution: «What does converge to?»
67 Global and local consistency of our estimator CONSISTENCY
68 Consistency «Does the MLE converge to the actual distribution?» Definition An estimator of parameter is said to be consistent if
69 Consistency Global Consistency Local Consistency
70 Global Consistency For current status data one can show ( ) consistency:.. 0 Why global? Role of?
71 LocalConsistency From the global consistency one can derive: Proposition continuous at G continuously differentiable at with strictly positive derivative Then we can choose >0 such that: sup [, ] ( ).. 0
72 Consistency «DoestheMLE convergetotheactual distribution?» «Yes, convergesto globallyand locally»
73 Global and local rate of convergence of our estimator RATE OFCONVERGENCE
74 Rate OfConvergence «Howfast does converge?»
75 Rate OfConvergence Global rate of convergence Local rate of convergence
76 Global Rate OfConvergence For current status data one can show: = (1) global rate is /! Definition A sequenceofr.v.,,,issaidtobeoforder 1 if: >0, such that > < forall >
77 LocalRate OfConvergence Theorem 0< <1 and continuously differentiable at with positive derivatives ( )resp. Then local rate is! ( ) = 1
78 Rate OfConvergence «Howfast does converge?» «Itconvergesatrate, globallyand locally»
79 The limiting distribution of the MLE LOCALLIMITINGDISTRIBUTION
80 LocalLimitingDistribution «What does converge to?»
81 LocalLimitingDistribution Definition two sided BM with mean 0 and variance = 1 >0 1 / ( ) + ( ) greatest convex minorantof (see blackboard) Definition A Brownian Motion ( )is a stochastic process with: =0 continuous a.s. has independent increments with ~ (0, )
82 Local Limiting Distribution Theorem 0< <1 and continuously differentiable at withcontinuous derivatives ( )resp. ( ) Then ( ) (0)
83 Local Limiting Distribution «What does converge to?» «To the slope of the convex minorantof a Brownian motion process plus a parabola»
84 Likelihood ratio test LR-test 2 2 ~ D = ( S ( t) S0 ( t)) dt. S: slope process of greatest convex minorantof a two-sided Brownian motion plus a parabola S 0 : slope process of greatest convex minorantof a two-sided Brownian motion plus a parabola under the constraints: slopes Slopes 0, for t > 0, 0, for t < 0.
85 Likelihood ratio test Remarks 2 Not a χ distribution Depends on the slope process of a Brownian motion Independent of the parameters of the problem
86 Pointwise confidence intervals LR-test denoted by For H0 : F( t0) = θ H : F( t ) θ. 1 0 testing Approximate 1 α confidence set: C { θ λ θ d } It can be shown: (0,1) if λ ( ) n θ 0 < α < 1: let d s.t. P( D > d ) = α n α α, : 2log n( ) Cn, α X < t and T > t. 0 0 α α are closed intervals in
87 Pointwise confidence intervals Proposition 4.1 Fand Ghave densities fand g, both positive, continuous in a neighborhood of t. 0 Then, for n : ( ) ( ) P F t C P D d F, G ( 0 ) n, α α = 1 α.
88 Thank you for your attention!
Nonparametric estimation for current status data with competing risks
 Nonparametric estimation for current status data with competing risks Marloes Henriëtte Maathuis A dissertation submitted in partial fulfillment of the requirements for the degree of Doctor of Philosophy
Maximum likelihood estimation of a log-concave density based on censored data
 Maximum likelihood estimation of a log-concave density based on censored data Dominic Schuhmacher Institute of Mathematical Statistics and Actuarial Science University of Bern Joint work with Lutz Dümbgen
Review and continuation from last week Properties of MLEs
 Review and continuation from last week Properties of MLEs As we have mentioned, MLEs have a nice intuitive property, and as we have seen, they have a certain equivariance property. We will see later that
Lecture 32: Asymptotic confidence sets and likelihoods
 Lecture 32: Asymptotic confidence sets and likelihoods Asymptotic criterion In some problems, especially in nonparametric problems, it is difficult to find a reasonable confidence set with a given confidence
Chapter 7 Fall Chapter 7 Hypothesis testing Hypotheses of interest: (A) 1-sample
 1-sample") Bios 323: Applied Survival Analysis Qingxia (Cindy) Chen Chapter 7 Fall 2012 Chapter 7 Hypothesis testing Hypotheses of interest: (A) 1-sample H 0 : S(t) = S 0 (t), where S 0 ( ) is known survival function,
Bios 323: Applied Survival Analysis Qingxia (Cindy) Chen Chapter 7 Fall 2012 Chapter 7 Hypothesis testing Hypotheses of interest: (A) 1-sample H 0 : S(t) = S 0 (t), where S 0 ( ) is known survival function,
Statistical Methods for Handling Incomplete Data Chapter 2: Likelihood-based approach
 Statistical Methods for Handling Incomplete Data Chapter 2: Likelihood-based approach Jae-Kwang Kim Department of Statistics, Iowa State University Outline 1 Introduction 2 Observed likelihood 3 Mean Score
Lecture 3. Truncation, length-bias and prevalence sampling
 Lecture 3. Truncation, length-bias and prevalence sampling 3.1 Prevalent sampling Statistical techniques for truncated data have been integrated into survival analysis in last two decades. Truncation in
Semiparametric Regression Analysis of Bivariate Interval-Censored Data
 University of South Carolina Scholar Commons Theses and Dissertations 12-15-2014 Semiparametric Regression Analysis of Bivariate Interval-Censored Data Naichen Wang University of South Carolina - Columbia
Simple techniques for comparing survival functions with interval-censored data
 Simple techniques for comparing survival functions with interval-censored data Jinheum Kim, joint with Chung Mo Nam jinhkim@suwon.ac.kr Department of Applied Statistics University of Suwon Comparing survival
Additive Isotonic Regression
 Additive Isotonic Regression Enno Mammen and Kyusang Yu 11. July 2006 INTRODUCTION: We have i.i.d. random vectors (Y 1, X 1 ),..., (Y n, X n ) with X i = (X1 i,..., X d i ) and we consider the additive
4.1 Analysis of functions I: Increase, decrease and concavity
 4.1 Analysis of functions I: Increase, decrease and concavity Definition Let f be defined on an interval and let x 1 and x 2 denote points in that interval. a) f is said to be increasing on the interval
with Current Status Data
 Estimation and Testing with Current Status Data Jon A. Wellner University of Washington Estimation and Testing p. 1/4 joint work with Moulinath Banerjee, University of Michigan Talk at Université Paul
STAT331. Cox s Proportional Hazards Model
 STAT331 Cox s Proportional Hazards Model In this unit we introduce Cox s proportional hazards (Cox s PH) model, give a heuristic development of the partial likelihood function, and discuss adaptations
(Y; I[X Y ]), where I[A] is the indicator function of the set A. Examples of the current status data are mentioned in Ayer et al. (1955), Keiding (199
![(Y; I[X Y ]), where I[A] is the indicator function of the set A. Examples of the current status data are mentioned in Ayer et al. (1955), Keiding (199](/thumbs/92/111040538.jpg "(Y; I[X Y ]), where I[A] is the indicator function of the set A. Examples of the current status data are mentioned in Ayer et al. (1955), Keiding (199") CONSISTENCY OF THE GMLE WITH MIXED CASE INTERVAL-CENSORED DATA By Anton Schick and Qiqing Yu Binghamton University April 1997. Revised December 1997, Revised July 1998 Abstract. In this paper we consider
CONSISTENCY OF THE GMLE WITH MIXED CASE INTERVAL-CENSORED DATA By Anton Schick and Qiqing Yu Binghamton University April 1997. Revised December 1997, Revised July 1998 Abstract. In this paper we consider
Pairwise rank based likelihood for estimating the relationship between two homogeneous populations and their mixture proportion
 Pairwise rank based likelihood for estimating the relationship between two homogeneous populations and their mixture proportion Glenn Heller and Jing Qin Department of Epidemiology and Biostatistics Memorial
the long tau-path for detecting monotone association in an unspecified subpopulation
 the long tau-path for detecting monotone association in an unspecified subpopulation Joe Verducci Current Challenges in Statistical Learning Workshop Banff International Research Station Tuesday, December
Models for Multivariate Panel Count Data
 Semiparametric Models for Multivariate Panel Count Data KyungMann Kim University of Wisconsin-Madison kmkim@biostat.wisc.edu 2 April 2015 Outline 1 Introduction 2 3 4 Panel Count Data Motivation Previous
Introduction to Empirical Processes and Semiparametric Inference Lecture 01: Introduction and Overview
 Introduction to Empirical Processes and Semiparametric Inference Lecture 01: Introduction and Overview Michael R. Kosorok, Ph.D. Professor and Chair of Biostatistics Professor of Statistics and Operations
Multivariate Survival Analysis
 Multivariate Survival Analysis Previously we have assumed that either (X i, δ i ) or (X i, δ i, Z i ), i = 1,..., n, are i.i.d.. This may not always be the case. Multivariate survival data can arise in
NONPARAMETRIC CONFIDENCE INTERVALS FOR MONOTONE FUNCTIONS. By Piet Groeneboom and Geurt Jongbloed Delft University of Technology
 NONPARAMETRIC CONFIDENCE INTERVALS FOR MONOTONE FUNCTIONS By Piet Groeneboom and Geurt Jongbloed Delft University of Technology We study nonparametric isotonic confidence intervals for monotone functions.
ASYMPTOTIC EQUIVALENCE OF DENSITY ESTIMATION AND GAUSSIAN WHITE NOISE. By Michael Nussbaum Weierstrass Institute, Berlin
 The Annals of Statistics 1996, Vol. 4, No. 6, 399 430 ASYMPTOTIC EQUIVALENCE OF DENSITY ESTIMATION AND GAUSSIAN WHITE NOISE By Michael Nussbaum Weierstrass Institute, Berlin Signal recovery in Gaussian
Empirical Likelihood
 Empirical Likelihood Patrick Breheny September 20 Patrick Breheny STA 621: Nonparametric Statistics 1/15 Introduction Empirical likelihood We will discuss one final approach to constructing confidence
Cherry Blossom run (1) The credit union Cherry Blossom Run is a 10 mile race that takes place every year in D.C. In 2009 there were participants
 The credit union Cherry Blossom Run is a 10 mile race that takes place every year in D.C. In 2009 there were participants") 18.650 Statistics for Applications Chapter 5: Parametric hypothesis testing 1/37 Cherry Blossom run (1) The credit union Cherry Blossom Run is a 10 mile race that takes place every year in D.C. In 2009
18.650 Statistics for Applications Chapter 5: Parametric hypothesis testing 1/37 Cherry Blossom run (1) The credit union Cherry Blossom Run is a 10 mile race that takes place every year in D.C. In 2009
Multistate models and recurrent event models
 Multistate models Multistate models and recurrent event models Patrick Breheny December 10 Patrick Breheny Survival Data Analysis (BIOS 7210) 1/22 Introduction Multistate models In this final lecture,
STATISTICAL ANALYSIS OF MULTIVARIATE INTERVAL-CENSORED FAILURE TIME DATA. A Dissertation Presented. the Faculty of the Graduate School
 STATISTICAL ANALYSIS OF MULTIVARIATE INTERVAL-CENSORED FAILURE TIME DATA A Dissertation Presented to the Faculty of the Graduate School University of Missouri-Columbia In Partial Fulfillment Of the Requirements
arxiv:math/ v2 [math.st] 17 Jun 2008
![arxiv:math/ v2 [math.st] 17 Jun 2008](/thumbs/71/65801804.jpg "arxiv:math/ v2 [math.st] 17 Jun 2008") The Annals of Statistics 2008, Vol. 36, No. 3, 1031 1063 DOI: 10.1214/009053607000000974 c Institute of Mathematical Statistics, 2008 arxiv:math/0609020v2 [math.st] 17 Jun 2008 CURRENT STATUS DATA WITH
The Annals of Statistics 2008, Vol. 36, No. 3, 1031 1063 DOI: 10.1214/009053607000000974 c Institute of Mathematical Statistics, 2008 arxiv:math/0609020v2 [math.st] 17 Jun 2008 CURRENT STATUS DATA WITH
STAT 526 Spring Final Exam. Thursday May 5, 2011
 STAT 526 Spring 2011 Final Exam Thursday May 5, 2011 Time: 2 hours Name (please print): Show all your work and calculations. Partial credit will be given for work that is partially correct. Points will
STATISTICAL ANALYSIS OF MULTIVARIATE INTERVAL-CENSORED FAILURE TIME DATA
 STATISTICAL ANALYSIS OF MULTIVARIATE INTERVAL-CENSORED FAILURE TIME DATA A Dissertation Presented to the Faculty of the Graduate School University of Missouri-Columbia In Partial Fulfillment Of the Requirements
The International Journal of Biostatistics
 The International Journal of Biostatistics Volume 1, Issue 1 2005 Article 3 Score Statistics for Current Status Data: Comparisons with Likelihood Ratio and Wald Statistics Moulinath Banerjee Jon A. Wellner
Maximum Likelihood Estimation under Shape Constraints
 Maximum Likelihood Estimation under Shape Constraints Hanna K. Jankowski June 2 3, 29 Contents 1 Introduction 2 2 The MLE of a decreasing density 3 2.1 Finding the Estimator..............................
β j = coefficient of x j in the model; β = ( β1, β2,
 Regression Modeling of Survival Time Data Why regression models? Groups similar except for the treatment under study use the nonparametric methods discussed earlier. Groups differ in variables (covariates)
Unit 14: Nonparametric Statistical Methods
 Unit 14: Nonparametric Statistical Methods Statistics 571: Statistical Methods Ramón V. León 8/8/2003 Unit 14 - Stat 571 - Ramón V. León 1 Introductory Remarks Most methods studied so far have been based
7 Influence Functions
 7 Influence Functions The influence function is used to approximate the standard error of a plug-in estimator. The formal definition is as follows. 7.1 Definition. The Gâteaux derivative of T at F in the
BIOS 2083 Linear Models c Abdus S. Wahed
 Chapter 5 206 Chapter 6 General Linear Model: Statistical Inference 6.1 Introduction So far we have discussed formulation of linear models (Chapter 1), estimability of parameters in a linear model (Chapter
Complexity Theory VU , SS The Polynomial Hierarchy. Reinhard Pichler
 Complexity Theory Complexity Theory VU 181.142, SS 2018 6. The Polynomial Hierarchy Reinhard Pichler Institut für Informationssysteme Arbeitsbereich DBAI Technische Universität Wien 15 May, 2018 Reinhard
Outline. Complexity Theory EXACT TSP. The Class DP. Definition. Problem EXACT TSP. Complexity of EXACT TSP. Proposition VU 181.
 Complexity Theory Complexity Theory Outline Complexity Theory VU 181.142, SS 2018 6. The Polynomial Hierarchy Reinhard Pichler Institut für Informationssysteme Arbeitsbereich DBAI Technische Universität
Analogy Principle. Asymptotic Theory Part II. James J. Heckman University of Chicago. Econ 312 This draft, April 5, 2006
 Analogy Principle Asymptotic Theory Part II James J. Heckman University of Chicago Econ 312 This draft, April 5, 2006 Consider four methods: 1. Maximum Likelihood Estimation (MLE) 2. (Nonlinear) Least
Multistate models and recurrent event models
 and recurrent event models Patrick Breheny December 6 Patrick Breheny University of Iowa Survival Data Analysis (BIOS:7210) 1 / 22 Introduction In this final lecture, we will briefly look at two other
Review 6. n 1 = 85 n 2 = 75 x 1 = x 2 = s 1 = 38.7 s 2 = 39.2
 Review 6 Use the traditional method to test the given hypothesis. Assume that the samples are independent and that they have been randomly selected ) A researcher finds that of,000 people who said that
Prediction of New Observations
 Statistic Seminar: 6 th talk ETHZ FS2010 Prediction of New Observations Martina Albers 12. April 2010 Papers: Welham (2004), Yiang (2007) 1 Content Introduction Prediction of Mixed Effects Prediction of
Multi-state Models: An Overview
 Multi-state Models: An Overview Andrew Titman Lancaster University 14 April 2016 Overview Introduction to multi-state modelling Examples of applications Continuously observed processes Intermittently observed
If g is also continuous and strictly increasing on J, we may apply the strictly increasing inverse function g 1 to this inequality to get
 18:2 1/24/2 TOPIC. Inequalities; measures of spread. This lecture explores the implications of Jensen s inequality for g-means in general, and for harmonic, geometric, arithmetic, and related means in
Notes, March 4, 2013, R. Dudley Maximum likelihood estimation: actual or supposed
 18.466 Notes, March 4, 2013, R. Dudley Maximum likelihood estimation: actual or supposed 1. MLEs in exponential families Let f(x,θ) for x X and θ Θ be a likelihood function, that is, for present purposes,
Statistics 262: Intermediate Biostatistics Non-parametric Survival Analysis
 Statistics 262: Intermediate Biostatistics Non-parametric Survival Analysis Jonathan Taylor & Kristin Cobb Statistics 262: Intermediate Biostatistics p.1/?? Overview of today s class Kaplan-Meier Curve
CIMAT Taller de Modelos de Capture y Recaptura Known Fate Survival Analysis
 CIMAT Taller de Modelos de Capture y Recaptura 2010 Known Fate urvival Analysis B D BALANCE MODEL implest population model N = λ t+ 1 N t Deeper understanding of dynamics can be gained by identifying variation
Product-limit estimators of the survival function with left or right censored data
 Product-limit estimators of the survival function with left or right censored data 1 CREST-ENSAI Campus de Ker-Lann Rue Blaise Pascal - BP 37203 35172 Bruz cedex, France (e-mail: patilea@ensai.fr) 2 Institut
Likelihood Construction, Inference for Parametric Survival Distributions
 Week 1 Likelihood Construction, Inference for Parametric Survival Distributions In this section we obtain the likelihood function for noninformatively rightcensored survival data and indicate how to make
COMPUTATION OF THE EMPIRICAL LIKELIHOOD RATIO FROM CENSORED DATA. Kun Chen and Mai Zhou 1 Bayer Pharmaceuticals and University of Kentucky
 COMPUTATION OF THE EMPIRICAL LIKELIHOOD RATIO FROM CENSORED DATA Kun Chen and Mai Zhou 1 Bayer Pharmaceuticals and University of Kentucky Summary The empirical likelihood ratio method is a general nonparametric
Two-stage Adaptive Randomization for Delayed Response in Clinical Trials
 Two-stage Adaptive Randomization for Delayed Response in Clinical Trials Guosheng Yin Department of Statistics and Actuarial Science The University of Hong Kong Joint work with J. Xu PSI and RSS Journal
Spring 2012 Math 541B Exam 1
 Spring 2012 Math 541B Exam 1 1. A sample of size n is drawn without replacement from an urn containing N balls, m of which are red and N m are black; the balls are otherwise indistinguishable. Let X denote
Comparison of Two Population Means
 Comparison of Two Population Means Esra Akdeniz March 15, 2015 Independent versus Dependent (paired) Samples We have independent samples if we perform an experiment in two unrelated populations. We have
COMPUTE CENSORED EMPIRICAL LIKELIHOOD RATIO BY SEQUENTIAL QUADRATIC PROGRAMMING Kun Chen and Mai Zhou University of Kentucky
 COMPUTE CENSORED EMPIRICAL LIKELIHOOD RATIO BY SEQUENTIAL QUADRATIC PROGRAMMING Kun Chen and Mai Zhou University of Kentucky Summary Empirical likelihood ratio method (Thomas and Grunkmier 975, Owen 988,
Pubh 8482: Sequential Analysis
 Pubh 8482: Sequential Analysis Joseph S. Koopmeiners Division of Biostatistics University of Minnesota Week 8 P-values When reporting results, we usually report p-values in place of reporting whether or
Prediction. Prediction MIT Dr. Kempthorne. Spring MIT Prediction
 MIT 18.655 Dr. Kempthorne Spring 2016 1 Problems Targets of Change in value of portfolio over fixed holding period. Long-term interest rate in 3 months Survival time of patients being treated for cancer
Score Statistics for Current Status Data: Comparisons with Likelihood Ratio and Wald Statistics
 Score Statistics for Current Status Data: Comparisons with Likelihood Ratio and Wald Statistics Moulinath Banerjee 1 and Jon A. Wellner 2 1 Department of Statistics, Department of Statistics, 439, West
Application of Time-to-Event Methods in the Assessment of Safety in Clinical Trials
 Application of Time-to-Event Methods in the Assessment of Safety in Clinical Trials Progress, Updates, Problems William Jen Hoe Koh May 9, 2013 Overview Marginal vs Conditional What is TMLE? Key Estimation
Statistics 135 Fall 2008 Final Exam
 Name: SID: Statistics 135 Fall 2008 Final Exam Show your work. The number of points each question is worth is shown at the beginning of the question. There are 10 problems. 1. [2] The normal equations
ENSC327 Communications Systems 19: Random Processes. Jie Liang School of Engineering Science Simon Fraser University
 ENSC327 Communications Systems 19: Random Processes Jie Liang School of Engineering Science Simon Fraser University 1 Outline Random processes Stationary random processes Autocorrelation of random processes
General Linear Model: Statistical Inference
 Chapter 6 General Linear Model: Statistical Inference 6.1 Introduction So far we have discussed formulation of linear models (Chapter 1), estimability of parameters in a linear model (Chapter 4), least
Survival Analysis. Lu Tian and Richard Olshen Stanford University
 1 Survival Analysis Lu Tian and Richard Olshen Stanford University 2 Survival Time/ Failure Time/Event Time We will introduce various statistical methods for analyzing survival outcomes What is the survival
Analysis of Gamma and Weibull Lifetime Data under a General Censoring Scheme and in the presence of Covariates
 Communications in Statistics - Theory and Methods ISSN: 0361-0926 (Print) 1532-415X (Online) Journal homepage: http://www.tandfonline.com/loi/lsta20 Analysis of Gamma and Weibull Lifetime Data under a
SEMI-PARAMETRIC REGRESSION ANALYSIS OF INTERVAL-CENSORED FAILURE TIME DATA
 SEMI-PARAMETRIC REGRESSION ANALYSIS OF INTERVAL-CENSORED FAILURE TIME DATA A Dissertation presented to the Faculty of the Graduate School at the University of Missouri In Partial Fulfillment of the Requirements
 Goodness-of-Fit Tests With Right-Censored Data by Edsel A. Pe~na Department of Statistics University of South Carolina Colloquium Talk August 31, 2 Research supported by an NIH Grant 1 1. Practical Problem
Master s Written Examination - Solution
 Master s Written Examination - Solution Spring 204 Problem Stat 40 Suppose X and X 2 have the joint pdf f X,X 2 (x, x 2 ) = 2e (x +x 2 ), 0 < x < x 2
Lecture 3. Inference about multivariate normal distribution
 Lecture 3. Inference about multivariate normal distribution 3.1 Point and Interval Estimation Let X 1,..., X n be i.i.d. N p (µ, Σ). We are interested in evaluation of the maximum likelihood estimates
Master s Written Examination
 Master s Written Examination Option: Statistics and Probability Spring 05 Full points may be obtained for correct answers to eight questions Each numbered question (which may have several parts) is worth
Information in Data. Sufficiency, Ancillarity, Minimality, and Completeness
 Information in Data Sufficiency, Ancillarity, Minimality, and Completeness Important properties of statistics that determine the usefulness of those statistics in statistical inference. These general properties
Lecture 01: Introduction
 Lecture 01: Introduction Dipankar Bandyopadhyay, Ph.D. BMTRY 711: Analysis of Categorical Data Spring 2011 Division of Biostatistics and Epidemiology Medical University of South Carolina Lecture 01: Introduction
STAT 6385 Survey of Nonparametric Statistics. Order Statistics, EDF and Censoring
 STAT 6385 Survey of Nonparametric Statistics Order Statistics, EDF and Censoring Quantile Function A quantile (or a percentile) of a distribution is that value of X such that a specific percentage of the
MA 575 Linear Models: Cedric E. Ginestet, Boston University Midterm Review Week 7
 MA 575 Linear Models: Cedric E. Ginestet, Boston University Midterm Review Week 7 1 Random Vectors Let a 0 and y be n 1 vectors, and let A be an n n matrix. Here, a 0 and A are non-random, whereas y is
Dynamic Prediction of Disease Progression Using Longitudinal Biomarker Data
 Dynamic Prediction of Disease Progression Using Longitudinal Biomarker Data Xuelin Huang Department of Biostatistics M. D. Anderson Cancer Center The University of Texas Joint Work with Jing Ning, Sangbum
Implementing Response-Adaptive Randomization in Multi-Armed Survival Trials
 Implementing Response-Adaptive Randomization in Multi-Armed Survival Trials BASS Conference 2009 Alex Sverdlov, Bristol-Myers Squibb A.Sverdlov (B-MS) Response-Adaptive Randomization 1 / 35 Joint work
Likelihood Based Inference for Monotone Response Models
 Likelihood Based Inference for Monotone Response Models Moulinath Banerjee University of Michigan September 5, 25 Abstract The behavior of maximum likelihood estimates (MLE s) the likelihood ratio statistic
Maximum likelihood: counterexamples, examples, and open problems
 Maximum likelihood: counterexamples, examples, and open problems Jon A. Wellner University of Washington visiting Vrije Universiteit, Amsterdam Talk at BeNeLuxFra Mathematics Meeting 21 May, 2005 Email:
Lecture Quantitative Finance Spring Term 2015
 on bivariate Lecture Quantitative Finance Spring Term 2015 Prof. Dr. Erich Walter Farkas Lecture 07: April 2, 2015 1 / 54 Outline on bivariate 1 2 bivariate 3 Distribution 4 5 6 7 8 Comments and conclusions
Parametric Maximum Likelihood Estimation of Cure Fraction Using Interval-Censored Data
 Columbia International Publishing Journal of Advanced Computing (2013) 1: 43-58 doi:107726/jac20131004 Research Article Parametric Maximum Likelihood Estimation of Cure Fraction Using Interval-Censored
Mathematics 530. Practice Problems. n + 1 }
 Department of Mathematical Sciences University of Delaware Prof. T. Angell October 19, 2015 Mathematics 530 Practice Problems 1. Recall that an indifference relation on a partially ordered set is defined
e 4β e 4β + e β ˆβ =0.765
 SIMPLE EXAMPLE COX-REGRESSION i Y i x i δ i 1 5 12 0 2 10 10 1 3 40 3 0 4 80 5 0 5 120 3 1 6 400 4 1 7 600 1 0 Model: z(t x) =z 0 (t) exp{βx} Partial likelihood: L(β) = e 10β e 10β + e 3β + e 5β + e 3β
Chapter 7. Confidence Sets Lecture 30: Pivotal quantities and confidence sets
 Chapter 7. Confidence Sets Lecture 30: Pivotal quantities and confidence sets Confidence sets X: a sample from a population P P. θ = θ(p): a functional from P to Θ R k for a fixed integer k. C(X): a confidence
CTDL-Positive Stable Frailty Model
 CTDL-Positive Stable Frailty Model M. Blagojevic 1, G. MacKenzie 2 1 Department of Mathematics, Keele University, Staffordshire ST5 5BG,UK and 2 Centre of Biostatistics, University of Limerick, Ireland
ST495: Survival Analysis: Hypothesis testing and confidence intervals
 ST495: Survival Analysis: Hypothesis testing and confidence intervals Eric B. Laber Department of Statistics, North Carolina State University April 3, 2014 I remember that one fateful day when Coach took
Convex analysis and profit/cost/support functions
 Division of the Humanities and Social Sciences Convex analysis and profit/cost/support functions KC Border October 2004 Revised January 2009 Let A be a subset of R m Convex analysts may give one of two
Package ICBayes. September 24, 2017
 Package ICBayes September 24, 2017 Title Bayesian Semiparametric Models for Interval-Censored Data Version 1.1 Date 2017-9-24 Author Chun Pan, Bo Cai, Lianming Wang, and Xiaoyan Lin Maintainer Chun Pan
Multistate Modeling and Applications
 Multistate Modeling and Applications Yang Yang Department of Statistics University of Michigan, Ann Arbor IBM Research Graduate Student Workshop: Statistics for a Smarter Planet Yang Yang (UM, Ann Arbor)
Theory of Maximum Likelihood Estimation. Konstantin Kashin
 Gov 2001 Section 5: Theory of Maximum Likelihood Estimation Konstantin Kashin February 28, 2013 Outline Introduction Likelihood Examples of MLE Variance of MLE Asymptotic Properties What is Statistical
Generalized Linear Model under the Extended Negative Multinomial Model and Cancer Incidence
 Generalized Linear Model under the Extended Negative Multinomial Model and Cancer Incidence Sunil Kumar Dhar Center for Applied Mathematics and Statistics, Department of Mathematical Sciences, New Jersey
Lecture Notes March 11, 2015
 18.156 Lecture Notes March 11, 2015 trans. Jane Wang Recall that last class we considered two different PDEs. The first was u ± u 2 = 0. For this one, we have good global regularity and can solve the Dirichlet
Lecture 2 Simple Linear Regression STAT 512 Spring 2011 Background Reading KNNL: Chapter 1
 Lecture Simple Linear Regression STAT 51 Spring 011 Background Reading KNNL: Chapter 1-1 Topic Overview This topic we will cover: Regression Terminology Simple Linear Regression with a single predictor
Game Theory and its Applications to Networks - Part I: Strict Competition
 Game Theory and its Applications to Networks - Part I: Strict Competition Corinne Touati Master ENS Lyon, Fall 200 What is Game Theory and what is it for? Definition (Roger Myerson, Game Theory, Analysis
Censoring mechanisms
 Censoring mechanisms Patrick Breheny September 3 Patrick Breheny Survival Data Analysis (BIOS 7210) 1/23 Fixed vs. random censoring In the previous lecture, we derived the contribution to the likelihood
Hybrid Censoring Scheme: An Introduction
 Department of Mathematics & Statistics Indian Institute of Technology Kanpur August 19, 2014 Outline 1 2 3 4 5 Outline 1 2 3 4 5 What is? Lifetime data analysis is used to analyze data in which the time
Comparing two independent samples
 In many applications it is necessary to compare two competing methods (for example, to compare treatment effects of a standard drug and an experimental drug). To compare two methods from statistical point
Composite Hypotheses and Generalized Likelihood Ratio Tests
 Composite Hypotheses and Generalized Likelihood Ratio Tests Rebecca Willett, 06 In many real world problems, it is difficult to precisely specify probability distributions. Our models for data may involve
Approximation of Survival Function by Taylor Series for General Partly Interval Censored Data
 Malaysian Journal of Mathematical Sciences 11(3): 33 315 (217) MALAYSIAN JOURNAL OF MATHEMATICAL SCIENCES Journal homepage: http://einspem.upm.edu.my/journal Approximation of Survival Function by Taylor
AN OPTIMAL STRATEGY FOR SEQUENTIAL CLASSIFICATION ON PARTIALLY ORDERED SETS. Abstract
 AN OPTIMAL STRATEGY FOR SEQUENTIAL CLASSIFICATION ON PARTIALLY ORDERED SETS Thomas S. Ferguson Department of Mathematics UCLA Los Angeles, CA 90095, USA Curtis Tatsuoka 1,2 Department of Statistics The
n =10,220 observations. Smaller samples analyzed here to illustrate sample size effect.
 Chapter 7 Parametric Likelihood Fitting Concepts: Chapter 7 Parametric Likelihood Fitting Concepts: Objectives Show how to compute a likelihood for a parametric model using discrete data. Show how to compute
Semiparametric Mixed Effects Models with Flexible Random Effects Distribution
 Semiparametric Mixed Effects Models with Flexible Random Effects Distribution Marie Davidian North Carolina State University davidian@stat.ncsu.edu www.stat.ncsu.edu/ davidian Joint work with A. Tsiatis,
1. Introduction In many biomedical studies, the random survival time of interest is never observed and is only known to lie before an inspection time
 ASYMPTOTIC PROPERTIES OF THE GMLE WITH CASE 2 INTERVAL-CENSORED DATA By Qiqing Yu a;1 Anton Schick a, Linxiong Li b;2 and George Y. C. Wong c;3 a Dept. of Mathematical Sciences, Binghamton University,
Covariance function estimation in Gaussian process regression
 Covariance function estimation in Gaussian process regression François Bachoc Department of Statistics and Operations Research, University of Vienna WU Research Seminar - May 2015 François Bachoc Gaussian
Long-Run Covariability
 Long-Run Covariability Ulrich K. Müller and Mark W. Watson Princeton University October 2016 Motivation Study the long-run covariability/relationship between economic variables great ratios, long-run Phillips