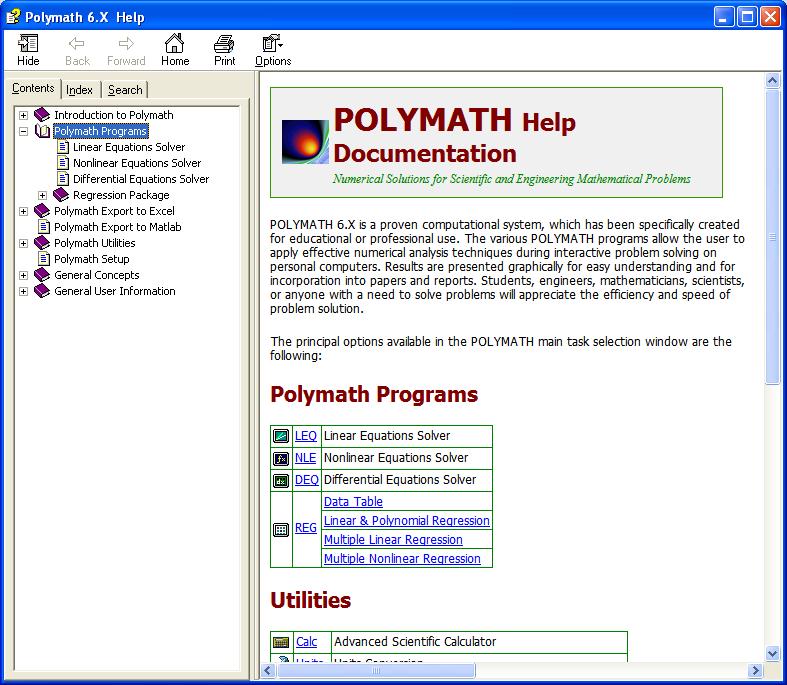
1. Open polymath: 2. Go to Help, Contents F1 or Press F1
|
|
|
- Bernice Ball
- 6 years ago
- Views:
Transcription


1 Polymath Tutorial Process Fluid Transport 1. Open polymath: 2. Go to Help, Contents F1 or Press F1 1

2 3. Read the section titled Introduction to Polymath both getting started and Variables and expressions and answer the following questions typed into a word document to be submitted at the end of the tutorial: 1. How many simultaneous ordinary differential equations can be simultaneously solved using the educational version of POLYMATH? 2. How many explicit equations can be solved using the POLYMATH ode solver? 3. What does NLE represent? 4. What symbol on the tool bar represents the unit conversion calculator? Using the polymath unit conversion calculator convert 1 hp (international) to J/s. (AS OF 1/23/08 first floor lab computers had problems with this portion.) 5. What symbol on the tool bar represents the polymath scientific constants menu? Give the value of pi to an accuracy of 12 digits using polymath scientific constants. 6. How would you have polymath give you the absolute value of a number? 7. Have polymath, using the calculator give you the cosine of 30 degrees. What did you type? 2
3 3


4 4. Start the Differential Equations Solver by selecting Program, DEQ Differential Equations and keep the help window open 5. Choose the Differential Equations solver in the help menu 6. Enter the 3 differential Equations and supporting explicit algebraic equations. To do this and learn about POLYMATH, I suggest that you read through the POLYMATH help file starting with the Overview section. After entering the equations and running the program return to step 7. 4


5 7. Sort the equation by using the button 8. Now enter a problem title by selecting Edit, Enter Problem Title 5


6 9. Add a graph to the output by clicking the box and rerun the program Graph 10. Edit the POLYMATH produced graph by doing the following: a. Open the Design or Graph properties window by clicking on the paint brush Increase the width of the lines to a 2 b. Add a title c. Change the x,y axis to a decimal with 2 digits showing Design or Graph Properties 6


7 d. Open the Curves and Functions menu and edit the x-axis by selecting the Label button. The x-axis should have a label: time (s). Always give units on labels. Please note that the SI abbreviation for seconds is s. Curves and Functions e. The only part missing is the y-axis which will be entered later. You can do this either by writing on the paper or adding text as shown next. 11. Now prepare this polymath program results to be handed in for a homework assignment. This is what you will do for all homework assignments involving POLYMATH. a. Select the Differential Equations Solution output screen, click on the text and then choose Edit, Select All. Then paste this into a word document. b. Copy the graph (you can use the copy button, Ctrl + C etc.) c. In word select the graph and use text wrapping so that the output will fit on one page. d. Now add a y-axis using the textbox tool. Concentration (mol/m 3 ) 7
8 POLYMATH Report Ordinary Differential Equations Calculated values of DEQ variables Variable Initial value Minimal value Maximal value Final value 1 A B C k k t Differential equations 1 d(a)/d(t) = -k1*a Concentration of component A 2 d(c)/d(t) = k2*b Concentration of component C 3 d(b)/d(t) = k1*a-k2*b Concentration of Component B Explicit equations 1 k2 = 2 Reaction rate constant with respect to A 2 k1 = 1 Reaction rate constant with respect to A General Total number of equations 5 Number of differential equations 3 Number of explicit equations 2 Elapsed time sec Solution method RKF_45 Step size guess. h Truncation error tolerance. eps Concentration Profile of Series Reaction 22-Jan-2008 Concentration mol/m 3 Figure 1: Concentration Profile of a Series Reaction 8

 f. Paste this into an excel spreadsheet and produce a graph with all titles given and labels.")
9 12. The above was probably too much work for a graph. An alternative method which I prefer is to use excel to produce the graph. In this case you should do the following a. Select the Table output button b. Run the program again c. Select the table d. Click on the upper left corner of the table (similar to excel) Copy with Headers Upper left Corner Selects all e. Then select Edit, Copy With Headers. (This will copy the names of the variables as well as the numbers) f. Paste this into an excel spreadsheet and produce a graph with all titles given and labels. Notice that for computer generated data, no markers are used. Draw this data using a line and not markers. 9
10 POLYMATH Report Ordinary Differential Equations Calculated values of DEQ variables Variable Initial value Minimal value Maximal value Final value 1 A B C k k t Differential equations 1 d(a)/d(t) = -k1*a Concentration of component A 2 d(c)/d(t) = k2*b Concentration of component C 3 d(b)/d(t) = k1*a-k2*b Concentration of Component B Explicit equations 1 k2 = 2 Reaction rate constant with respect to A 2 k1 = 1 Reaction rate constant with respect to A General Total number of equations 5 Number of differential equations 3 Number of explicit equations 2 Elapsed time sec Solution method RKF_45 Step size guess. h Truncation error tolerance. eps Concentration Profile of Series Reaction 22-Jan Concentration (mol/m 3 ) A C B Time (s) Figure 2: Concentration Profile of a Series Reaction 10

11 Excel Hint: Did you know that one way to select a column of data is to hold the shift key down and double click on the lower line? For example to select the Column C data go to cell C1 and double click on the line between rows 1 and 2. Similarly if you want to move to the bottom of a data set you can just double click on the lower dark black line without holding the shift key. Holding the shift key; double click on the lower dark black line 11

12 Now review the Non linear Equations solver: Following Example 1 and Example 2 given in the Polymath program tutorial solve the following problem. This is taken from the Cutlip and Shacham text book titled, Problem solving in Chemical Engineering with Numerical Methods. The van der Waals equation of state is given by a P + ( V b) = RT V 2 (1) Where 2 27 R T a = 64 Pc 2 c (2) And b RT 8P c = (3) c The variables are defined as: 12
13 P = pressure in atm V = molar volume in L/gmol T = temperature in K R = atm L/ T c c ( gmol K) = 405.5K for ammonia P = atm for ammonia The reduced pressure is defined as P P r = (4) P c And the compressibility factor is given by PV Z = (5) RT Calculate the molar volume and compressibility factor for gaseous ammonia at a pressure of 56 atm and a temperature of 450 K using the van der Waals equation of state. In presenting the solution do the following: 1. Write the program. 2. Estimate the volume using the ideal gas law. 3. Write this calculation on engineering paper as well your hand calculations with units for equations 1, 2, 3, and 5. Note that for equation 1, this should be a sample calculation using your initial guess. Show all of the necessary units. 4. Select the option to produce a graph 5. Solve it using POLYMATH. 6. Then use select all and cut and paste the POLYMATH report into a word document as shown below as well as the graph. 7. You will need to edit the graph to label the axis to produce what is shown below. You can either hand write the units to the axis or use the Microsoft drawing tools to add the units. 8. produce the printout found on the following page 13
14 POLYMATH Report Nonlinear Equation Calculated values of NLE variables Variable Value f(x) Initial Guess 1 V E- 13 Variable Value 1 a b P Pc Pr R T Tc Z Nonlinear equations 1 f(v) = (P+a/(V^2))*(V-b)-R*T = 0 Explicit equations 1 P = 56 2 R = T = Tc = Pc = Pr = P/Pc 7 a = 27*(R^2*Tc^2/Pc)/64 8 b = R*Tc/(8*Pc) 9 Z = P*V/(R*T) General Settings Total number of equations 10 Number of implicit equations 1 Number of explicit equations 9 Elapsed time Solution method Max iterations (a) MOLAR VOLUME AND COMPRESSIBILITY FACTOR FROM VAN DER WAALS EQUATION 22-Jan sec SAFENEWT Tolerance F Tolerance X Use the ideal gas law to obtain a good guess! Show this hand calculation on a separate page! Tolerance min Data file: k:\heskethdrive\courses\reaction engineering\lectures&examples\p2-01a.pol 14
15 f(v) L/gmol L/gmol Figure 3 Polymath Plot for Van der Waals Problem in Cutlip and Shacham Book 2.1 (a) 15
Computer simulation of radioactive decay
 Computer simulation of radioactive decay y now you should have worked your way through the introduction to Maple, as well as the introduction to data analysis using Excel Now we will explore radioactive
Aspen Plus PFR Reactors Tutorial using Styrene with Pressure Drop Considerations By Robert P. Hesketh and Concetta LaMarca Spring 2005
 Aspen Plus PFR Reactors Tutorial using Styrene with Pressure Drop Considerations By Robert P. Hesketh and Concetta LaMarca Spring 2005 In this laboratory we will incorporate pressure-drop calculations
Lab #10 Atomic Radius Rubric o Missing 1 out of 4 o Missing 2 out of 4 o Missing 3 out of 4
 Name: Date: Chemistry ~ Ms. Hart Class: Anions or Cations 4.7 Relationships Among Elements Lab #10 Background Information The periodic table is a wonderful source of information about all of the elements
M61 1 M61.1 PC COMPUTER ASSISTED DETERMINATION OF ANGULAR ACCELERATION USING TORQUE AND MOMENT OF INERTIA
 M61 1 M61.1 PC COMPUTER ASSISTED DETERMINATION OF ANGULAR ACCELERATION USING TORQUE AND MOMENT OF INERTIA PRELAB: Before coming to the lab, you must write the Object and Theory sections of your lab report
Enabling Advanced Problem Solving in Spreadsheets with Access to Physical Property Data
 Enabling Advanced Problem Solving in Spreadsheets with Access to Physical Property Data Michael B. Cutlip, Professor of Chemical Engineering, University of Connecticut (speaker) michael.cutlip@uconn.edu
DISCRETE RANDOM VARIABLES EXCEL LAB #3
 DISCRETE RANDOM VARIABLES EXCEL LAB #3 ECON/BUSN 180: Quantitative Methods for Economics and Business Department of Economics and Business Lake Forest College Lake Forest, IL 60045 Copyright, 2011 Overview
Exam 1 Chemical Reaction Engineering 26 February 2001 Closed Book and Notes
 Exam 1 Chemical Reaction Engineering 26 February 21 Closed Book and Notes (2%) 1. Derive the unsteady-state mole balance for a chemical species A for a packed bed reactor using the following steps: a)
DIPPR (Design Institute for Physical Property Data) Physical Properties Database Revised January 2007
 Physical Properties Database Revised January 2007") DIPPR (Design Institute for Physical Property Data) Physical Properties Database Revised January 007 This database contains 33 fixed-value properties and 15 temperature-dependent properties of approximately
DIPPR (Design Institute for Physical Property Data) Physical Properties Database Revised January 007 This database contains 33 fixed-value properties and 15 temperature-dependent properties of approximately
I. Pre-Lab Introduction
 I. Pre-Lab Introduction Please complete the following pages before the lab by filling in the requested items. A. Atomic notation: Atoms are composed of a nucleus containing neutrons and protons surrounded
Purpose: Materials: WARNING! Section: Partner 2: Partner 1:
 Partner 1: Partner 2: Section: PLEASE NOTE: You will need this particular lab report later in the semester again for the homework of the Rolling Motion Experiment. When you get back this graded report,
Experiment: Oscillations of a Mass on a Spring
 Physics NYC F17 Objective: Theory: Experiment: Oscillations of a Mass on a Spring A: to verify Hooke s law for a spring and measure its elasticity constant. B: to check the relationship between the period
Linear Motion with Constant Acceleration
 Linear Motion 1 Linear Motion with Constant Acceleration Overview: First you will attempt to walk backward with a constant acceleration, monitoring your motion with the ultrasonic motion detector. Then
Lab 1 Uniform Motion - Graphing and Analyzing Motion
 Lab 1 Uniform Motion - Graphing and Analyzing Motion Objectives: < To observe the distance-time relation for motion at constant velocity. < To make a straight line fit to the distance-time data. < To interpret
Experiment 1 Introduction to 191 Lab
 PHY191 Experiment 1: Computing and Graphing 8/30/2017 Page 1 1. Introduction Experiment 1 Introduction to 191 Lab In Physics 191 we will make extensive use of Kaleidagraph [Kgraph], a software package
4.5 COMPLEX CHEMICAL EQUILIBRIUM BY GIBBS ENERGY MINIMIZATION
 4.5 COMPLEX CHEMICAL EQUILIBRIUM BY GIBBS ENERGY MINIMIZATION 445 4.5 COMPLEX CHEMICAL EQUILIBRIUM BY GIBBS ENERGY MINIMIZATION 4.5.1 Concepts Demonstrated Formulation of a chemical equilibrium problem
Richter Scale and Logarithms
 activity 7.1 Richter Scale and Logarithms In this activity, you will investigate earthquake data and explore the Richter scale as a measure of the intensity of an earthquake. You will consider how numbers
Using Microsoft Excel
 Using Microsoft Excel Objective: Students will gain familiarity with using Excel to record data, display data properly, use built-in formulae to do calculations, and plot and fit data with linear functions.
Experiment 0 ~ Introduction to Statistics and Excel Tutorial. Introduction to Statistics, Error and Measurement
 Experiment 0 ~ Introduction to Statistics and Excel Tutorial Many of you already went through the introduction to laboratory practice and excel tutorial in Physics 1011. For that reason, we aren t going
α m ! m or v T v T v T α m mass
 FALLING OBJECTS (WHAT TO TURN IN AND HOW TO DO SO) In the real world, because of air resistance, objects do not fall indefinitely with constant acceleration. One way to see this is by comparing the fall
Chem 1 Kinetics. Objectives. Concepts
 Chem 1 Kinetics Objectives 1. Learn some basic ideas in chemical kinetics. 2. Understand how the computer visualizations can be used to benefit the learning process. 3. Understand how the computer models
Conformational Analysis of n-butane
 Conformational Analysis of n-butane In this exercise you will calculate the Molecular Mechanics (MM) single point energy of butane in various conformations with respect to internal rotation around the
1 M62 M62.1 CONSERVATION OF ANGULAR MOMENTUM FOR AN INELASTIC COLLISION
 1 M62 M62.1 CONSERVATION OF ANGULAR MOMENTUM FOR AN INELASTIC COLLISION PRELAB: Before coming to the lab, you must write the Object and Theory sections of your lab report and include the Data Tables. You
1 The relation between a second order linear ode and a system of two rst order linear odes
 Math 1280 Spring, 2010 1 The relation between a second order linear ode and a system of two rst order linear odes In Chapter 3 of the text you learn to solve some second order linear ode's, such as x 00
Quality Measures (QM) Report. Self Guided Tutorial
 Report. Self Guided Tutorial") Quality Measures (QM) Report Self Guided Tutorial 1 Tutorial Contents Overview of the QM Online Report Facility Summary Report Resident Drill down Monthly Trend Report Resident Roster Report Printing Reports/Export
Quality Measures (QM) Report Self Guided Tutorial 1 Tutorial Contents Overview of the QM Online Report Facility Summary Report Resident Drill down Monthly Trend Report Resident Roster Report Printing Reports/Export
WEATHER AND CLIMATE COMPLETING THE WEATHER OBSERVATION PROJECT CAMERON DOUGLAS CRAIG
 WEATHER AND CLIMATE COMPLETING THE WEATHER OBSERVATION PROJECT CAMERON DOUGLAS CRAIG Introduction The Weather Observation Project is an important component of this course that gets you to look at real
August 7, 2007 NUMERICAL SOLUTION OF LAPLACE'S EQUATION
 August 7, 007 NUMERICAL SOLUTION OF LAPLACE'S EQUATION PURPOSE: This experiment illustrates the numerical solution of Laplace's Equation using a relaxation method. The results of the relaxation method
Reactor Design within Excel Enabled by Rigorous Physical Properties and an Advanced Numerical Computation Package
 Reactor Design within Excel Enabled by Rigorous Physical Properties and an Advanced Numerical Computation Package Mordechai Shacham Department of Chemical Engineering Ben Gurion University of the Negev
Titrator 3.0 Tutorial: Calcite precipitation
 Titrator 3.0 Tutorial: Calcite precipitation November 2008 Steve Cabaniss A. Introduction This brief tutorial is intended to acquaint you with some of the features of the program Titrator. It assumes that
Motion II. Goals and Introduction
 Motion II Goals and Introduction As you have probably already seen in lecture or homework, and if you ve performed the experiment Motion I, it is important to develop a strong understanding of how to model
Polymath Examples: Nonlinear Algebraic Equation and Regression Problems
 Polymath Examples: Nonlinear Algebraic Equation and Regression Problems Problem Flash evaporation of an ideal multicomponent mixture Concept Calculation of bubble point and dew point temperatures and associated
In this activity, students will compare weather data from to determine if there is a warming trend in their community.
 Overview: In this activity, students will compare weather data from 1910-2000 to determine if there is a warming trend in their community. Objectives: The student will: use the Internet to locate scientific
Lab 11 Simple Harmonic Motion A study of the kind of motion that results from the force applied to an object by a spring
 Lab 11 Simple Harmonic Motion A study of the kind of motion that results from the force applied to an object by a spring Print Your Name Print Your Partners' Names Instructions April 20, 2016 Before lab,
Introduction to Computer Tools and Uncertainties
 Experiment 1 Introduction to Computer Tools and Uncertainties 1.1 Objectives To become familiar with the computer programs and utilities that will be used throughout the semester. To become familiar with
Computational Study of Chemical Kinetics (GIDES)
") Computational Study of Chemical Kinetics (GIDES) Software Introduction Berkeley Madonna (http://www.berkeleymadonna.com) is a dynamic modeling program in which relational diagrams are created using a graphical
Computational Study of Chemical Kinetics (GIDES) Software Introduction Berkeley Madonna (http://www.berkeleymadonna.com) is a dynamic modeling program in which relational diagrams are created using a graphical
REPLACE DAMAGED OR MISSING TEXTBOOK BARCODE LABEL
 Destiny Textbook Manager allows users to create and print replacement barcode labels for textbooks. In this tutorial you will learn how to: Replace damaged textbook barcode label(s) Replace missing textbook
41. Sim Reactions Example
 HSC Chemistry 7.0 41-1(6) 41. Sim Reactions Example Figure 1: Sim Reactions Example, Run mode view after calculations. General This example contains instruction how to create a simple model. The example
ICM-Chemist How-To Guide. Version 3.6-1g Last Updated 12/01/2009
 ICM-Chemist How-To Guide Version 3.6-1g Last Updated 12/01/2009 ICM-Chemist HOW TO IMPORT, SKETCH AND EDIT CHEMICALS How to access the ICM Molecular Editor. 1. Click here 2. Start sketching How to sketch
How Do I Create a Hubble Diagram to show the expanding universe?
 How Do I Create a Hubble Diagram to show the expanding universe? An extremely important topic in astronomy is the expansion of the universe. Although the expanding universe is nearly always discussed in
MoLE Gas Laws Activities *
 MoLE Gas Laws Activities * To begin this assignment you must be able to log on to the Internet using Internet Explorer (Microsoft) 4.5 or higher. If you do not have the current version of the browser,
POLYMATH SOLUTIONS TO THE CHEMICAL ENGINEERING DEMONSTRATION PROBLEM SET
 Sessions 16 and 116 POLYMATH SOLUTIONS TO THE CHEMICAL ENGINEERING DEMONSTRATION PROBLEM SET Mathematical Software - Sessions 16 and 116* Michael B. Cutlip, Department of Chemical Engineering, Box U-3222,
A Web based Library for Testing Performance of Numerical Software for Solving Nonlinear Algebraic Equations
 A Web based Library for Testing Performance of Numerical Software for Solving Nonlinear Algebraic Equations M. Shacham a, N. Brauner b and M. B. Cutlip c a Dept. of Chemical Engineering, Ben Gurion University
Appendix F. + 1 Ma 1. 2 Ma Ma Ma ln + K = 0 (4-173)
") 5:39p.m. Page:949 Trimsize:8.5in 11in Appendix F F.1 MICROSOFT EXCEL SOLVER FOR NON-LINEAR EQUATIONS The Solver is an optimization package that finds a maximum, minimum, or specified value of a target
5:39p.m. Page:949 Trimsize:8.5in 11in Appendix F F.1 MICROSOFT EXCEL SOLVER FOR NON-LINEAR EQUATIONS The Solver is an optimization package that finds a maximum, minimum, or specified value of a target
Lab 1: Dynamic Simulation Using Simulink and Matlab
 Lab 1: Dynamic Simulation Using Simulink and Matlab Objectives In this lab you will learn how to use a program called Simulink to simulate dynamic systems. Simulink runs under Matlab and uses block diagrams
A Scientific Model for Free Fall.
 A Scientific Model for Free Fall. I. Overview. This lab explores the framework of the scientific method. The phenomenon studied is the free fall of an object released from rest at a height H from the ground.
Lab Activity: The Central Limit Theorem
 Lab Activity: The Central Limit Theorem In this lab activity, you will explore the properties of the Central Limit Theorem. Student Learning Outcomes By the end of this chapter, you should be able to do
An area chart emphasizes the trend of each value over time. An area chart also shows the relationship of parts to a whole.
 Excel 2003 Creating a Chart Introduction Page 1 By the end of this lesson, learners should be able to: Identify the parts of a chart Identify different types of charts Create an Embedded Chart Create a
If you like us, please share us on social media. The latest UCD Hyperlibrary newsletter is now complete, check it out.
 Sign In Forgot Password Register username username password password Sign In If you like us, please share us on social media. The latest UCD Hyperlibrary newsletter is now complete, check it out. ChemWiki
PHY 221 Lab 2. Acceleration and Uniform Motion
 PHY 221 Lab 2 Name: Partner: Partner: Acceleration and Uniform Motion Introduction: Recall the previous lab During Lab 1, you were introduced to computer aided data acquisition. You used a device called
Boyle s Law: A Multivariable Model and Interactive Animated Simulation
 Boyle s Law: A Multivariable Model and Interactive Animated Simulation Using tools available in Excel, we will turn a multivariable model into an interactive animated simulation. Projectile motion, Boyle's
Calculating the Mean Absolute Deviation Using Microsoft Excel
 In this Microsoft Excel tutorial we will review how to calculate the Mean Absolute Deviation. The video displays the title page. Edward Volchok, PhD Page 1 of 24 MAD_Transcript.docx The Mean Absolute Deviation
Skyline Small Molecule Targets
 Skyline Small Molecule Targets The Skyline Targeted Proteomics Environment provides informative visual displays of the raw mass spectrometer data you import into your Skyline documents. Originally developed
Ligand Scout Tutorials
 Ligand Scout Tutorials Step : Creating a pharmacophore from a protein-ligand complex. Type ke6 in the upper right area of the screen and press the button Download *+. The protein will be downloaded and
Intermediate Algebra Summary - Part I
 Intermediate Algebra Summary - Part I This is an overview of the key ideas we have discussed during the first part of this course. You may find this summary useful as a study aid, but remember that the
EXCELLING WITH BIOLOGICAL MODELS FROM THE CLASSROOM T0 RESEARCH
 EXCELLING WITH BIOLOGICAL MODELS FROM THE CLASSROOM T0 RESEARCH Timothy D. Comar Benedictine University Department of Mathematics 5700 College Road Lisle, IL 60532 tcomar@ben.edu Introduction Computer
BASIC TECHNOLOGY Pre K starts and shuts down computer, monitor, and printer E E D D P P P P P P P P P P
 BASIC TECHNOLOGY Pre K 1 2 3 4 5 6 7 8 9 10 11 12 starts and shuts down computer, monitor, and printer P P P P P P practices responsible use and care of technology devices P P P P P P opens and quits an
Microsoft Excel Directions
 Microsoft Excel Directions 1. Working in groups of two, log onto a computer. 2. Create a folder on the desktop a. Right click anywhere on the desktop new folder Name the folder Chemistry 3. Open MS Excel
WISE Regression/Correlation Interactive Lab. Introduction to the WISE Correlation/Regression Applet
 WISE Regression/Correlation Interactive Lab Introduction to the WISE Correlation/Regression Applet This tutorial focuses on the logic of regression analysis with special attention given to variance components.
MoLE Gas Laws Activities
 MoLE Gas Laws Activities To begin this assignment you must be able to log on to the Internet using Internet Explorer (Microsoft) 4.5 or higher. If you do not have the current version of the browser, go
Contents. 13. Graphs of Trigonometric Functions 2 Example Example
 Contents 13. Graphs of Trigonometric Functions 2 Example 13.19............................... 2 Example 13.22............................... 5 1 Peterson, Technical Mathematics, 3rd edition 2 Example 13.19
Photometry of Supernovae with Makali i
 Photometry of Supernovae with Makali i How to perform photometry specifically on supernovae targets using the free image processing software, Makali i This worksheet describes how to use photometry to
Calculating Bond Enthalpies of the Hydrides
 Proposed Exercise for the General Chemistry Section of the Teaching with Cache Workbook: Calculating Bond Enthalpies of the Hydrides Contributed by James Foresman, Rachel Fogle, and Jeremy Beck, York College
Historical Perspective on Numerical Problem Solving
 Historical Perspective on Numerical Problem Solving Mordechai Shacham Department of Chemical Engineering Ben Gurion University of the Negev Beer-Sheva, Israel Michael B. Cutlip Department of Chemical Engineering
GEO165 LAB EXERCISE #3
 GEO165 LAB EXERCISE #3 Tools of the Meteorologist Part 2: Fronts Introduction 1. A front is the leading edge of a new air mass invading a region. Because Vilhelm Bjerknes was reminded of the bloody battle
How to Make or Plot a Graph or Chart in Excel
 This is a complete video tutorial on How to Make or Plot a Graph or Chart in Excel. To make complex chart like Gantt Chart, you have know the basic principles of making a chart. Though I have used Excel
1-D Convection-Diffusion Lab
 Computational Fluid Dynamics -D Convection-Diffusion Lab The lab. uses scientificworkplace symbolic calculus and maths editor software (SWP) This file Concevtion-Diffusion-Lab is available from Blackboard
ChemSep TM - Extracting Property Data to Excel
 ChemSep TM - Extracting Property Data to Excel New with Release 6.6 (April 2010) Harry Kooijman and Ross Taylor We have extended the databank manager that comes with ChemSep so that it is possible to extract
module, with the exception that the vials are larger and you only use one initial population size.
 Population Dynamics and Space Availability (http://web.as.uky.edu/biology/faculty/cooper/population%20dynamics%20examples%2 0with%20fruit%20flies/TheAmericanBiologyTeacher- PopulationDynamicsWebpage.html
How many states. Record high temperature
 Record high temperature How many states Class Midpoint Label 94.5 99.5 94.5-99.5 0 97 99.5 104.5 99.5-104.5 2 102 102 104.5 109.5 104.5-109.5 8 107 107 109.5 114.5 109.5-114.5 18 112 112 114.5 119.5 114.5-119.5
The View Data module
 The module Use to examine stored compound data (H, S, C p (T), G, etc.) in Compound type databases and list solutions and their constituents in Solution type databases. Table of contents Section 1 Section
LAB Exercise #4 - Answers The Traction Vector and Stress Tensor. Introduction. Format of lab. Preparation reading
 LAB Exercise #4 - Answers The Traction Vector and Stress Tensor Due: Thursday, 26 February 2009 (Special Thanks to D.D. Pollard who pioneered this exercise in 1991) Introduction Stress concentrations in
ISIS/Draw "Quick Start"
 ISIS/Draw "Quick Start" Click to print, or click Drawing Molecules * Basic Strategy 5.1 * Drawing Structures with Template tools and template pages 5.2 * Drawing bonds and chains 5.3 * Drawing atoms 5.4
Taguchi Method and Robust Design: Tutorial and Guideline
 Taguchi Method and Robust Design: Tutorial and Guideline CONTENT 1. Introduction 2. Microsoft Excel: graphing 3. Microsoft Excel: Regression 4. Microsoft Excel: Variance analysis 5. Robust Design: An Example
Typical kinetics Time. 1. What happens to the concentration of A over time? a. Increases b. Decreases c.
 Cheryl Coolidge Guided Inquiry Activity Enzyme Kinetics, Part One Why? Understanding the rate behavior of enzyme catalyzed reactions can help to explain how these biologically important reactions are controlled
Stoichiometric Reactor Simulation Robert P. Hesketh and Concetta LaMarca Chemical Engineering, Rowan University (Revised 4/8/09)
") Stoichiometric Reactor Simulation Robert P. Hesketh and Concetta LaMarca Chemical Engineering, Rowan University (Revised 4/8/09) In this session you will learn how to create a stoichiometric reactor model
Stoichiometric Reactor Simulation Robert P. Hesketh and Concetta LaMarca Chemical Engineering, Rowan University (Revised 4/8/09) In this session you will learn how to create a stoichiometric reactor model
MATLAB Ordinary Differential Equation (ODE) solver for a simple example 1. Introduction
 solver for a simple example 1. Introduction") MATLAB Ordinary Differential Equation (ODE) solver for a simple example 1. Introduction Differential equations are a convenient way to express mathematically a change of a dependent variable (e.g. concentration
MATLAB Ordinary Differential Equation (ODE) solver for a simple example 1. Introduction Differential equations are a convenient way to express mathematically a change of a dependent variable (e.g. concentration
Finite Element Modules for Enhancing Undergraduate Transport Courses: Application to Fuel Cell Fundamentals
 Finite Element Modules for Enhancing Undergraduate Transport Courses: Application to Fuel Cell Fundamentals Originally published in 007 American Society for Engineering Education Conference Proceedings
Combining Numerical Problem Solving with Access to Physical Property Data a New Paradigm in ChE Education
 Combining Numerical Problem Solving with Access to Physical Property Data a New Paradigm in ChE Education Michael B. Cutlip, Mordechai Shacham, and Michael Elly Dept. of Chemical Engineering, University
Lab 3 Momentum Change and Impulse
 Lab 3 Momentum Change and Impulse Objectives: < To measure the change in momentum of a cart in a collision and the impulse acting on it during the collision and to compare these values as a test of the
Problem 1 (10 points)
") y x CHEN 1703 - HOMEWORK 4 Submit your MATLAB solutions via the course web site. Be sure to include your name and UNID in your m-file. Submit each solution seperately. Also be sure to document your solutions
y x CHEN 1703 - HOMEWORK 4 Submit your MATLAB solutions via the course web site. Be sure to include your name and UNID in your m-file. Submit each solution seperately. Also be sure to document your solutions
Assignment 1 Physics/ECE 176
 Assignment 1 Physics/ECE 176 Made available: Thursday, January 13, 211 Due: Thursday, January 2, 211, by the beginning of class. Overview Before beginning this assignment, please read carefully the part
D.T.M: TRANSFER TEXTBOOKS FROM ONE SCHOOL TO ANOTHER
 Destiny Textbook Manager allows users with full access to transfer Textbooks from one school site to another and receive transfers from the warehouse In this tutorial you will learn how to: Requirements:
Geography 281 Map Making with GIS Project Four: Comparing Classification Methods
 Geography 281 Map Making with GIS Project Four: Comparing Classification Methods Thematic maps commonly deal with either of two kinds of data: Qualitative Data showing differences in kind or type (e.g.,
First Order Rate Laws and the Kinetics Mechanism Simulation Program
 First Order Rate Laws and the Kinetics Mechanism Simulation Program The Kinetics Mechanism Simulation program (kine.html) is useful for building models in a wide variety of areas, including population
Newton's 2 nd Law. . Your end results should only be interms of m
 Newton's nd Law Introduction: In today's lab you will demonstrate the validity of Newton's Laws in predicting the motion of a simple mechanical system. The system that you will investigate consists of
1. What is the value of the quantity PV for one mole of an ideal gas at 25.0 C and one atm?
 Real Gases Thought Question: How does the volume of one mole of methane gas (CH4) at 300 Torr and 298 K compare to the volume of one mole of an ideal gas at 300 Torr and 298 K? a) the volume of methane
Module 2A Turning Multivariable Models into Interactive Animated Simulations
 Module 2A Turning Multivariable Models into Interactive Animated Simulations Using tools available in Excel, we will turn a multivariable model into an interactive animated simulation. Projectile motion,
AP Physics 1 Summer Assignment Packet
 AP Physics 1 Summer Assignment Packet 2017-18 Welcome to AP Physics 1 at David Posnack Jewish Day School. The concepts of physics are the most fundamental found in the sciences. By the end of the year,
Investigating Factors that Influence Climate
 Investigating Factors that Influence Climate Description In this lesson* students investigate the climate of a particular latitude and longitude in North America by collecting real data from My NASA Data
Center of Mass. Evaluation copy
 Center of Mass Experiment 19 INTRODUCTION In the most of the previous experiments you have examined the motion of a single object as it underwent a variety of motions. You learned that an object subject
Assignment 1: Molecular Mechanics (PART 1 25 points)
") Chemistry 380.37 Fall 2015 Dr. Jean M. Standard August 19, 2015 Assignment 1: Molecular Mechanics (PART 1 25 points) In this assignment, you will perform some molecular mechanics calculations using the
Chemistry 380.37 Fall 2015 Dr. Jean M. Standard August 19, 2015 Assignment 1: Molecular Mechanics (PART 1 25 points) In this assignment, you will perform some molecular mechanics calculations using the
Astron 104 Laboratory #6 The Speed of Light and the Moons of Jupiter
 Name: Date: Section: Astron 104 Laboratory #6 The Speed of Light and the Moons of Jupiter Section 1.2, 8.1 This lab is based on Project CLEA, http://www3.gettysburg.edu/ marschal/clea/cleahome.html. You
Properties of Continuous Probability Distributions The graph of a continuous probability distribution is a curve. Probability is represented by area
 Properties of Continuous Probability Distributions The graph of a continuous probability distribution is a curve. Probability is represented by area under the curve. The curve is called the probability
AMS 27L LAB #6 Winter 2009
 AMS 27L LAB #6 Winter 2009 Symbolically Solving Differential Equations Objectives: 1. To learn about the MATLAB Symbolic Solver 2. To expand knowledge of solutions to Diff-EQs 1 Symbolically Solving Differential
Electric Fields and Equipotentials
 OBJECTIVE Electric Fields and Equipotentials To study and describe the two-dimensional electric field. To map the location of the equipotential surfaces around charged electrodes. To study the relationship
HSC Chemistry 7.0 User's Guide
 HSC Chemistry 7.0 47-1 HSC Chemistry 7.0 User's Guide Sim Flowsheet Module Experimental Mode Pertti Lamberg Outotec Research Oy Information Service P.O. Box 69 FIN - 28101 PORI, FINLAND Fax: +358-20 -
Simple Harmonic Motion
 Physics Topics Simple Harmonic Motion If necessary, review the following topics and relevant textbook sections from Serway / Jewett Physics for Scientists and Engineers, 9th Ed. Hooke s Law (Serway, Sec.
15. Exergy Balance Module
 14010-ORC-J 1 (6) 15. Exergy Balance Module 15.1. Introduction This module allows the user to calculate exergy, mass and heat balance for a system where there can be multiple input and output streams with
Lab 15 Taylor Polynomials
 Name Student ID # Instructor Lab Period Date Due Lab 15 Taylor Polynomials Objectives 1. To develop an understanding for error bound, error term, and interval of convergence. 2. To visualize the convergence
To Create a Simple Formula using the Point and Click Method:
 To Create a Simple Formula that Adds Two Numbers: Click the cell where the formula will be defined (C5, for example). Type the equal sign (=) to let Excel know a formula is being defined. Type the first
PHY191 Experiment 1: Introduction 1/19/2009 Page 1
 PHY191 Experiment 1: Introduction 1/19/2009 Page 1 Finishing up: As you exit Kaleidagraph, select "None" in the dialogue box when you are asked whether you want to save changes. It is advisable to back