Uncertainties in AH Physics
|
|
|
- Mervyn Bryant
- 6 years ago
- Views:
Transcription


1 Advanced Higher Physics
2 Contents This booklet is one of a number that have been written to support investigative work in Higher and Advanced Higher Physics. It develops the skills associated with handling uncertainties. Uncertainties were introduced in the booklet Precision, accuracy and uncertainty, written to support Higher Sciences. This booklet includes much of the material in the higher booklet and extends this as appropriate for use at Advanced Higher. Content specific to Advanced Higher is identified below. Contents Page 3 Page 4 Page 5 Page 6 Page 7 Page 8 Page 9 Page 10 Precision and accuracy A closer look at accuracy A closer look at precision Precision and accuracy Uncertainty - introduction A closer look at random uncertainty A closer look at scale reading uncertainty A closer look at calibration and systematic uncertainty Page 11 Absolute and percentage uncertainty Advanced Higher Page 1 Combining uncertainties in a measurement Advanced Higher Page 13 Combining uncertainties the rules Advanced Higher Page 14 Combining uncertainties examples 1 and Advanced Higher Page 15 Combining uncertainties example 3 Advanced Higher Page 16 Error bars Advanced Higher Page 17 Uncertainty in a gradient Advanced Higher Page 18 Uncertainty in a gradient - worst and best fit lines Advanced Higher Page 19 Uncertainty in a gradient - parallelogram method Advanced Higher Page 0 Uncertainty in a gradient - LINEST method Advanced Higher Page
3 Precision and Accuracy Precision and Accuracy When we carry out investigations, it is important that the measurements we take are accurate and precise. Do these two words mean the same thing? Certainly most people use the words interchangeably. However, in physics, the words have different meanings. In summary, the difference between accuracy and precision is as follows: The accuracy of a measurement tells you how close the measurement is to the true or accepted value. The precision of a measurement tells you something about the number of significant figures in the measurement. A Measuring temperature The thermometer I have used to measure the temperature has a scale that reads to the nearest 0.1 o C. Because of this, my measurement is likely to be accurate. B Measuring mass The balance I have used to measure the mass of the block is very high quality and has been calibrated against known masses. Because of this, my measurement is likely to be precise. Activity True or false? The examples opposite illustrate measurements that are commonly made in physics. A student has made a comment about each measurement. Consider each statement. Is it true or false? The answers and comments are on page 6. You may like to read through the next two pages before checking your answers. You may even change your mind! C Measuring time I have used a stopwatch to measure the period of a pendulum. I have repeated the measurement and found an average. This gives me a more precise answer. Page 3

4 A closer look at accuracy Accuracy When we measure something in a physics investigation, we are trying to find the actual or true value of the property being measured. If the temperature of a liquid is actually 0 O C, then we would hope our thermometer gives us a value as close to 0 O C as possible. A thermometer that reads 15 O C say is not very good. The accuracy of a measurement is how close it is to the true value. Our thermometer that reads 15 O C instead of 0 O C is certainly not very accurate. Technical specification data Manufacturers of scientific instruments often supply data sheets that specify how accurate the instrument is. The instruments have been tested against very accurate standard instruments and the results are shown on the data sheet. As you might expect, instruments that are guaranteed to be more accurate are usually more expensive. Whatever we are measuring, the accuracy of our measurement depends on the quality of the measuring device we are using. If you wish to measure your own weight you (probably) want the scales to read your true weight. However, many bathroom scales under read or over read. How can you know how close your scales are to the true value? Well, you can repeat the measurement using a higher quality scale - but even so, how can you be sure that this is more accurate? Ultimately, we can never measure a true value with 100% confidence. Despite this, we should still try to ensure that all our measurements are as accurate as possible. As a student experimenter, you may be restricted in the equipment you will use. Nevertheless, there are things that you can do to improve the accuracy of your measurements. A good start is to ensure the instrument is zeroed and used correctly! Page 4


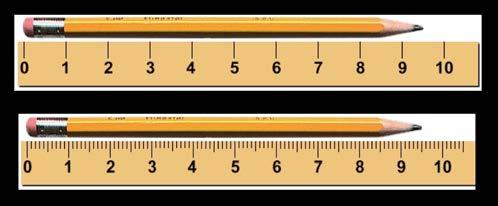
5 A closer look at precision Precision A precise measurement is one that is more exact than one that is not precise. Suppose someone describes themselves as being in their teens and about m tall. Based on this, you don t know much about them. The description is not very precise. However, a more precise description might have stated an age of 17 years and months and a height of 1.97 m. A selection of instruments is shown. Which are likely to enable precise measurements to be taken? Where possible, measurements in science should be precise. To make precise measurements requires suitable instruments. Consider the two rules being used to measure the length of the same pencil. The lower rule allows a more precise measurement to be taken. The length of the pencil as measured by the upper rule is somewhere between 9 cm and 10 cm. We might guess and say 9.5 cm but the decimal place is just a guess. The smallest unit on this rule is 1 cm. With the lower rule the length is measured to be 9.5 cm and we might guess at 9.51 cm. The smallest unit on this rule is 1 mm. The measurement using the lower rule is more precise because it uses a smaller unit to measure with. Page 5

6 Precision and Accuracy A measurement can be precise that is, it may have lots of decimal places but it can be quite inaccurate. Just because we use a measuring device that has very small smallest divisions doesn t mean that that we can necessarily be confident that we have found the true value of the property we are measuring. For example, if we might measure the resistance of a resistor to be 5.14 Ω. However, if the real value is 6.1 Ω. then our measurement may be precise, but it is inaccurate. When we make measurements in our physics investigations, we should try to ensure that the measurements are precise and accurate. To ensure our measurements are as accurate as possible, we mostly rely on the quality of the instrument we are using. Is it possible to take measurements that are completely accurate? This is an interesting question that can lead to some philosophical thoughts. It can be argued that we can never measure something with 100% accuracy. Even if we use the very best instrument that is available, that is as accurate and precise as possible, we can never be sure that our measurement is 100% correct. There will always be a certain amount of uncertainty in our measurement. Activity group discussion Answers to the questions on page 3 A Measuring temperature The statement is false. The thermometer may be calibrated incorrectly so that readings are precise but inaccurate (i.e. wrong). B Measuring the mass The statement is false. A high quality, well calibrated balance is likely to be accurate i.e. the value is close to the true value. However, it may or may not be precise. This depends on the number of decimal places displayed. C Measuring time The statement is false. Repeating measurements is always good practice in physics investigations. By repeating the measurements and finding a mean, it is likely that value will be found that is closer to the true value i.e. the mean improves the accuracy. Discuss examples of measurements that have high accuracy but low precision. Discuss examples of measurements that have high precision but low accuracy. Page 6


.")


7 Uncertainties - introduction Measurement and uncertainty It is impossible to measure anything with 100% accuracy. No matter how good our measuring device, and no matter how small the smallest unit on our measuring scale, there will always be an uncertainty in any measurement we make. One of the tasks of a good physicist when they carry out experiments is to make sure they have a good understanding of the uncertainties involved in measurements. Activities 1. Work with a group of students using a rule to measure the width of say a laboratory bench. Each student should measure the width on their own, aiming for as precise measurement as they can. Don t look at each other s measurements until all have competed the task. How similar or different were the measurements? Can anyone claim their measurement is correct? There are a number of ways in which uncertainties can arise in any measurement. These are summarised below and are discussed in detail in the following pages. Random uncertainties occur when an experiment is repeated and slight variations occur. Random uncertainties can be reduced by taking repeated measurements.. Look at the two tachometers. (Tachometers measure revolutions per minute). Which one would have the largest scale reading uncertainty? Scale reading uncertainty is a measure of how well an instrument scale can be read. In general, instruments with small unit divisions have a reduced uncertainty. Calibration uncertainty is a measure of how accurately an instrument has been calibrated against a known standard. Manufacturers often state the accuracy of their instrument. However, this accuracy may reduce with age. Systematic uncertainties occur when readings taken are all either too small or all too large. They can arise because of a calibration error or poor experimental design or procedure. Is the tachometer that allows the most precise measurement to be made necessarily the most accurate? 3. Gather a selection of rulers from different manufacturers. Compare their lengths. Are they all identical? Is there any way of knowing which ruler is best (most accurate)? Page 7

8 A closer look at random uncertainty Random effects If a measurement is repeated many times, the result may not be the same each time. Small variations in the experimental conditions or differences in readings taken may result in different values being recorded. Examples of where random uncertainty occur include: Using a stopwatch to measure the period of a pendulum. The reaction time of the person doing the timing may vary slightly each time. Measuring a force. The force applied may change slightly each time it is applied. Measuring the irradiance of light at distances away from the source. The distance from the light source may be measured slightly differently each time. Random uncertainty in a mean value Random uncertainties are equally likely to make measurements higher or lower than the true value. By repeating the measurements, the random uncertainties can be cancelled out by calculating the mean of the readings. Suppose an experiment to determine the period of a pendulum has been repeated a number of times. Period in seconds: 0.63, 0.59, 0.57, 0.60, 0.6, 0.59 Mean period = Mean period = = 0.60 s The uncertainty in this value is: uncertainty = uncertainty = max - min n = = 0.01 IMPORTANT The final result is: Period = 0.60 ± 0.01 s Activity Roll a marble or ball bearing down a slope so that it collides with a polystyrene cup that has a slot cut in it. The cup gets pushed horizontally. Mark the position that the cup gets pushed to by making a cross next to the nearest line. Repeat this until a pattern of crosses is seen. The spread of distances moved by the cup should be visible. Use the pattern to find the mean distance travelled. The maximum and minimum can be used to find the random uncertainty in this value. Page 8


9 A closer look at scale reading uncertainty The digital meter shown on the right displays a voltage. What is the uncertainty in this reading? As a general rule, the uncertainty is taken as the smallest change that would alter the display. Usually this is the same as saying the uncertainty is 1 in the last digit of the display. On the voltmeter shown, the display reads 1.88 V. A change of 0.01 V would change the display, so this is the uncertainty in the reading. The voltage is 1.88 ± 0.01 V The analogue ammeter shown on the right displays a current. What is the uncertainty in this reading? As a general rule, the uncertainty is taken as half of the smallest division on the scale. On this ammeter, the needle is between 1.6 and 1.7 so we might reasonably estimate the current to be 1.65 A. The smallest division is 0.1 A. Half of this is 0.05 A so this is the uncertainty in the reading. The current is 1.65 ± 0.05 A Activity Look at each of the scales and state the reading as a value ± uncertainty. Page 9

10 A closer look at calibration and systematic uncertainty Systematic uncertainty in experimental procedures Systematic uncertainty occurs when there are faults in the system you use to carry out the experiment. They can be hard to spot and sometimes you may only realize that there are systematic uncertainties in your procedure when you complete your experiment. A good way of understanding how systematic uncertainty may occur in experiments is to consider a number of examples. 1. Determining resistance. The voltmeter in the circuit shown measures the voltage across the supply rather than the voltage across R. The value of R determined by calculating V/I will not be the true resistance of the resistor.. Determining the speed of sound in air. A loudspeaker, microphone and a computer can be used to measure the speed of sound in air. However, in the set up shown, it is likely that the sound will travel through the bench. Sound travels more quickly through a solid, so an incorrect time will be recorded by the computer. One example of systematic uncertainty in an experiment is using a measuring device that is not calibrated correctly. This is calibration uncertainty. Examples include: A meter rule that is not exactly one meter in length. A balance that under or over-reads mass. An analogue ammeter that has not had the zero correctly set will consistently read incorrectly. A timer that runs slowly. Although it is true that you will occasionally use measuring devices that introduce calibration uncertainty into your results, it is much more likely that other factors have a greater effect. When evaluating your experimental procedures, try not to fall into the trap of simply stating that the experiment could have been improved by using better equipment. Detecting systematic uncertainty Systematic uncertainty may show up on a graph of results. If you expect that the graph should go through the origin and it doesn t, then this is a sign that you have something wrong with your experimental setup and you have systematic uncertainty. 3. Determining the refractive index of a material The refractive index of a material can be found by measuring angles of incidence and angles of refraction. These angles are measured from a line drawn at right angles to the surface of the material. If this line (the normal) is not drawn correctly, then all the measured angles will have a systematic uncertainty. Page 10
11 Absolute and percentage uncertainty Absolute uncertainty The aim of all physics investigations is to draw a valid conclusion. Before any conclusion can be considered to be valid, the uncertainty in measurements needs to be considered. If the uncertainty is large, then it is impossible to have much confidence in our results. It is important, particularly at Advanced Higher level, to have a clear understanding of what the uncertainty is in all measurements. The initial statement of the uncertainty in a measurement is in an absolute form. This means that the value is stated with a plus or minus indicating the range of possible values that would be possible using the instruments and techniques used in the experiment. Examples of absolute uncertainties include: V = 4. ± 0.1 V t = 5. ± 0. s m = 15.3 x 10 3 ± 0.05 kg Fractional and percentage uncertainty The absolute uncertainty in a measurement does not allow us to easily compare the relative size of the uncertainties in a number of measurements. The next few pages will consider how to combine uncertainties. Before that, it is important to be able to convert absolute uncertainty into percentage uncertainty. In order to do this, it is first necessary to find the uncertainty as a fraction of the value that is measured. In the example V = 4. ± 0.1 V, the fractional uncertainty is 0.1 which is 0.09 ( sig figs) is the fractional uncertainty in the value of the potential difference V. Fractional uncertainties are used when combining uncertainties. In general, fractional uncertainty is given by x x where x is the absolute uncertainty in the value x. To easily compare the magnitude of uncertainties, it is best to convert to percentage uncertainty. The percentage uncertainty is given by x x 100 The percentage uncertainty in the value of the potential difference is.9%. Activity State the absolute, fractional and percentage uncertainty in each of the following: I = 1.3 ± 0. A, T = 8.4 ± 0.1 o C, C = 100 ± 10 μf, r = ± mm, d = 1.4 x 10 9 ± 0.1 x 10 9 m Which measurement has the largest percentage uncertainty? Page 11
12 Combining uncertainties in a measurement Combining random, calibration and reading uncertainties Each measurement we take is subject to a number of uncertainties. These are random, calibration and reading uncertainties. Each may have a large, small or negligible effect on the overall uncertainty in the value. They need to be added together in some way to allow a single estimate of the uncertainty in a value. When combining random, calibration and reading uncertainties, it is not necessary to convert to fractional or percentage uncertainties. To find the combined uncertainty find the square root of the sum of the squares of each of the uncertainties. So, w = x + y + z where x, y, z are the uncertainties in the values x, y, and z and w is the combined uncertainty This is best illustrated with a number of examples. Example 1 The mass of a metal block is measured with a digital balance which has a smallest reading of 0.01 grams. The display reads 10.4 g and the manufacturer claims the balance is accurate to within g. One reading only is taken. Random uncertainty = not known as only one reading has been taken. Calibration uncertainty = 0.005g Reading uncertainty = 0.01 g w = x + y so w = and w = 0.0 ( to 1 sig fig) The mass is 10.4 ± 0.0 g (Notice that the uncertainty in the final result is given to one significant figure. Remember, uncertainties are estimates and there is no point is including meaningless significant figures) Example The period of a pendulum is measured five times and the mean period is found to be.1 s. The random uncertainty is calculated to be 0.01 s. The stopwatch used to time the period has an estimated calibration uncertainty of 0.05 s and the reading uncertainty is estimated at half of the smallest division which is 0.1 s. Random uncertainty = 0.01 s Calibration uncertainty = 0.05 s Reading uncertainty = 0.05 s w = x + y + z w = w = 0.07 The period is.1 ± 0.07 s Example 3 The length of a pendulum is measured using a steel ruler. The calibration uncertainty is 0.1 mm and the reading uncertainty is half of the smallest division which is 1 mm. The combined uncertainty w is given by: w = x + y where x = 0.1 and y = 0.5 Notice that in this case, one uncertainty is significantly larger than the other. Its effect swamps the effect of the smaller and in this case, the smaller uncertainty can be ignored. The uncertainty in the length of the pendulum is ± 0.5 mm In general, if one uncertainty is one third or less than the largest, it can be ignored. Page 1
13 Combining uncertainties the rules Uncertainties in a final result When the measurements of an investigation are used in a calculation to find a final result, it is necessary to consider the effect of the uncertainty in each value on the final result. Values can be added, multiplied, divided or raised to a power, or a combination of these, to find a final result. The following describes the way each arithmetic operation is handled. Adding or subtracting values The method for combining uncertainties for values that are added or subtracted is the same as for combining random, calibration and reading uncertainties for a single value. The absolute uncertainty is the square root of the sum of the squares of each of the uncertainties. That is w = x + y + z where x, y, z are the uncertainties in the values x, y, and z and w is the combined uncertainty. Raising to a power When raising a value by a power it is best to work with percentage uncertainties. The percentage uncertainty in x n is n x x 100 where x is the uncertainty in the value x and n is the power to which x is raised. Once this percentage uncertainty is found, it can be converted back to absolute uncertainty. Multiplying or dividing values The fractional uncertainty of a result that is calculated by multiplying or dividing values is found by w x y z = + + w x y z where x, y, z are the uncertainties in the values x, y, and z. w is the calculated value and w is the combined uncertainty. Uncertainties in trigonometric functions When an angle is measured in an investigation, it is quite common to find the sin, cos or tan of the angle. If the uncertainty in the angle is say ± 5 o, what is the uncertainty in the sin of the angle? Trigonometric functions are non-linear i.e. doubling the angle does not double the sin of the angle. There are rigourous approaches to working with uncertainties of trigonometric functions. However, it is sufficient at AH level to simply state that the percentage uncertainty in the sin of an angle is the same as the percentage uncertainty in the angle. It is worthwhile remembering (and stating in an investigation report) that this is an approximation. Other non-linear funtions (1/x, log, ln, exp) may be treated in the same way. Page 13
14 Combining uncertainties examples 1 and Example 1 uncertainty in a sum The temperature of a liquid is measured to rise from T 1 = 17.5 o C to T = 4.5 o C. The thermometer has a reading uncertainty of 0.5 o C and an unknown calibration uncertainty. Find the uncertainty in the temperature rise T - T 1. In this case, there is no random uncertainty because each temperature has only been measured once. Each temperature value is likely to have a calibration uncertainty. However, it is reasonable to assume that the two values of temperaure will have the same calibration uncertainty so when the values are subtracted, the two calibration uncertainties will cancel out. This means that we only need to consider reading uncertainties. T 1 = 17.5 ± 0.5 o C T = 4.5 ± 0.5 o C T = T 1 + T T = Example uncertainty in a value raised to a power The speed v of a rotating object is measured to be.51 ± 0.01 m s -1. Find the uncertainty in v. v = 6.30 m To find the uncertainty in v use the relationship: uncertainty = n v v 100 uncertainty = uncertainty = 0.8% This is a percentage uncertainty. To convert to an absolute uncertainty, find 0.8% of This is v = 6.30 ± 0.05 m s - T = 0.7 o C The temperature rise is 7.0 ± 0.7 o C (Notice that this corresponds to a 10% uncertainty in the result. This is high and is likely to make it difficult to draw a valid conclusion from this investigation. It would be better to repeat the measurements with a thermometer that had a smaller reading uncertainty.) Page 14
15 Combining uncertainties example 3 Example 3 uncertainty when multiplying or dividing values The centripetal force F can be found using the relationship F = mv where m is the mass of the r rotating object, v is the speed and r is the radius. The following values have been measured: To find the uncertainty in the value of F value use the relationship F F = m m v + v r + r m = ± kg v =.51 ± 0.01 m s -1 r = 0.84 ± 0.00 m F F = Calculate the force F and determine the uncertainty in this value. F F = = First we need to find v and the uncertainty in v. See example on the previous page. v = 6.30 ± 0.05 m s - Next find F F = mv = r = 0.35 N The fractional uncertainty is The uncertainty in F is therefore = 0.003N Finally we can write the value of the force F together with the uncertainty F = 0.35 ± N (Notice the significant figures in the value and the uncertainty) Page 15

. When a trendline is drawn, it may not go through any of the points on a graph.")

16 Error bars Representing uncertainty on a graph It is very common in physics to plot graphs of variables. When the uncertainties have been estimated, it is sensible to include this information on the graph. This is done using error bars. An error bar is a way of visually representing an uncertainty in a measurement. It is drawn so that so that the maximum and minimum values that the measurement lies within can be seen. Error bars are useful when a graph includes a trendline (line of best fit). When a trendline is drawn, it may not go through any of the points on a graph. However, it should go through all the error bar lines. The graph below shows a trendline which goes through all the error bars except one. This suggests that something is wrong. The point could be plotted incorrectly, or a mistake was made in making the measurement. Alternatively, if the point is plotted correctly, then there is likely to be something worth investigating at the values that do not lie on the line. Error bars can be drawn to represent uncertainty in only one axis as shown, or they can represent uncertainty in both axes. The length of the two error bars may be different as shown below. Error bars may be drawn by hand or can be generated using a spreadsheet. The graph below has been produced using Microsoft Excel and error bars have been included. The values of voltage have an uncertainty of ± 0.1 V and current has an uncertainty of ± 0 ma. To include error bars on a graph produced by Microsoft Excel, click on the Chart Tools tab, select the Layout sub-tab and choose Error Bars. The term error bar is slightly unfortunate. In physics we try to avoid the use of the word error when we refer to uncertainties. An error is a mistake. It is something that we have done wrong. On the other hand, an uncertainty is an inevitable consequence of making a measurement. We do our best to reduce uncertainties. Despite this, the term error bar is commonly used and to put it bluntly, we are stuck with it. It may be useful to think that an error bar is a visual representation on a graph of the uncertainties in our measurements. Page 16

17 Uncertainty in a gradient The equation of a straight line Finding the gradient of a line of best fit is a very powerful technique in physics. For example, the gradient of a graph of voltage against current is resistance. Also, the gradient of a velocity/time graph is the acceleration. The gradient of a straight line graph can be found using the formula m = y y 1 x x 1. Alternatively, if a graph has been drawn using Microsoft Excel, displaying the equation of the line is one of the options when a trendline is selected. The graph below displays the equation of the line. The gradient of the graph is We can conclude that the acceleration of the object is 0.5 m s - ( sig figs). The equation also indicates the point at which the graph cuts the y axis. This may be helpful in identifying systematic uncertainty. Uncertainty in a gradient - introduction The gradient of a graph is often used to determine a final result. The values used to plot the graph will likely have uncertainties associated with them. It therefore makes sense to consider what the uncertainty in a gradient is. Before looking at techniques to find the uncertainty in a gradient it is necessary to consider what is meant by an uncertainty. First, an uncertainty is an estimate. To state that the length of something is say 0.49 ± 0.1 m does not mean we are completely sure that the length is between 0.48 m and 0.50 m. There is still a chance that the true value of the length is outwith these values. However, the chance of this is small. In more advanced treatments of uncertainties, it is possible to quantify the chance of a result lying within the uncertainty. A statistical treatment allows results to be declared to be within a certain number of standard deviations (sigma). For example, the discovery of the Higgs Boson was declared to five sigma. This means that physicists could be confident of their result with % certainty. It is important to recognize that there is no such thing as an absolute or true value of uncertainty. In relation to finding the uncertainty in a gradient, all we can do is apply techniques to estimate the uncertainty. The following pages describe three of these techniques. The first two have a basis in a graphical interpretation. The third is based on statistics. Page 17
18 Uncertainty in a gradient worst and best fit lines Use the error bars Consider the following sketch of a graph. It appears that there is a linear relationship between y and x. Furthermore the constant of proportionality is the gradient. A line of best fit is included below. The line of best fit in the graph (at the bottom of the left column) passes through all the error bars. It is possible to draw further lines that just pass the error bars. Two lines have been added to the graph. The line with gradient m 1 shows the minimum gradient that still passes through all the error bars. The line with gradient m shows the maximum gradient. By finding the gradients m 1 and m, the uncertainty in the gradient of the line of best fit can be estimated. The line of best fit has been drawn by attempting to ensure that there are an equal number of points either side of the line. The gradient m can be found using m = y y 1 x x 1 One way of estimating the uncertainty in the gradient is to draw error bars on the graph. The graph is drawn again with these in position. This method for estimating the uncertainty in a gradient has merit. However, there are several disadvantages. First, it is sometimes difficult to draw lines that pass through all the error bars, especially if error bars have been drawn in both the horizontal and vertical axes. It is also possible that the difference between the gradient of the line of best fit and m 1, and between the gradient of the line of best fit and m are not equal. Page 18
19 Uncertainty in a gradient parallelogram method Find the centroid The points on a graph can be imagined to be like masses placed on a see-saw. There is a point, called the centroid, which acts like a centre of mass. The points lie equally distributed to the left and right of the centroid. Similarly, the points are distributed equally above and below the centroid. It is useful to find the centroid because the line of best fit will pass through it. The centroid is found by finding the mean of all the x values of the points. This is its x coordinate. The y co-ordinate is found by finding the mean of all the y values. The centroid and line of best fit are shown below. One way of estimating the uncertainty in the gradient is to draw lines parallel to the line of best fit, one above and passing through the highest point, and one below, passing through the lowest point. These have been included in the graph below. The lines can be joined as shown to form a parallelogram. This is shown below and the corners of the parallelogram have been labelled. The diagonals of the parallelogram can be joined and these can be used to estimate the uncertainty in the gradient. To do this, first find the co-ordinates of the points A, B, C and D by reading off the x and y values on the graph. Next find the gradient of the diagonals AC and BD using m = y y 1. x x 1 The gradients m(ac) and m(bd) can be used to find the uncertainty m in the gradient m of the graph simply by finding the difference in the gradients of the two diagonals and dividing by two. m(b ) m(ac) m = However, there is a better way of calculating the uncertainty and that is to recognise that the number of points that are plotted influences the uncertainty in the gradient. Generally, the more points that are included, the smaller is the uncertainty. This can be taken into account by using the following equation that is derived using a statistical approach. In the equation, n is the number of data points plotted on the graph. m(b ) m(ac) m = n ( ) Page 19
20 Uncertainty in a gradient LINEST function Statistics and Microsoft Excel Microsoft Excel is a spreadsheet program that is commonly used to produce graphs in physics. The data that has been collected is first entered into cells to make a table of results. One of the powerful features of a spreadsheet program is that functions can be used to process the values entered into the cells. For example, the sum of a column of values can easily be found using the function SUM. Other functions include AVERAGE, MAX and MIN. There are many other functions that can carry out statistical calculations on a table of results. One that can be used to allow us to estimate the uncertainty in a gradient is LINEST. To learn how to use LINEST, consider the following table of results which have been entered into a spreadsheet. Current/mA Voltage/V The gradient of the graph of voltage against current is V/I, which is the resistance R. LINEST can be used to determine the gradient of the line of best fit and to estimate the uncertainty in this gradient. If the LINEST function is applied to the two columns of values, it will display four values. 1 The gradient of the line. The point at which the line intercepts the y-axis. 3 The uncertainty in the gradient. 4 The uncertainty in the intercept. To display the four values using LINEST, carry out the following steps: The name of the function 1 Select four empty cells below the table of results (or any convenient four cells). Make sure all four cells are highlighted. Navigate to the LINEST function. There are a number of ways to do this. a) The simplest is to use the formula builder window if it is available on your version of Excel. b) Alternatively, select Insert from the Tools bar, followed by Function. 3 Either type in the following or use the formula builder to enter it. The cell labels for the y values. =LINEST(B:B9,A:A9,TRUE,TRUE) Setting this to TRUE ensures the uncertainty in the gradient and intercept are displayed. The cell labels for the x values. Setting this to TRUE forces the software to work out the y-axis intercept. Notice that the formula has to be typed in exactly as shown above. When this has been done, hold down CTRL and SHIFT and press ENTER. (CMD +SHIFT on Apple computers). With a bit of luck (!) four values will be displayed in the four highlighted cells. Gradient Uncertainty in gradient y-axis intercept Uncertainty in y-axis intercept Taking into account significant figures, the resistance is 6.7 ± 0. Ω. Page 0
SPH3U1 Lesson 03 Introduction. 6.1 Expressing Error in Measurement
 SIGNIFICANT DIGITS AND SCIENTIFIC NOTATION LEARNING GOALS Students will: 6 ERROR Describe the difference between precision and accuracy Be able to compare values quantitatively Understand and describe
Physics: Uncertainties - Student Material (AH) 1
 1") UNCERTAINTIES Summary of the Basic Theory associated with Uncertainty It is important to realise that whenever a physical quantity is being measured there will always be a degree of inaccuracy associated
UNCERTAINTIES Summary of the Basic Theory associated with Uncertainty It is important to realise that whenever a physical quantity is being measured there will always be a degree of inaccuracy associated
PHY 123 Lab 1 - Error and Uncertainty and the Simple Pendulum
 To print higher-resolution math symbols, click the Hi-Res Fonts for Printing button on the jsmath control panel. PHY 13 Lab 1 - Error and Uncertainty and the Simple Pendulum Important: You need to print
Conservation of Momentum
 Learning Goals Conservation of Momentum After you finish this lab, you will be able to: 1. Use Logger Pro to analyze video and calculate position, velocity, and acceleration. 2. Use the equations for 2-dimensional
Measurement: The Basics
 I. Introduction Measurement: The Basics Physics is first and foremost an experimental science, meaning that its accumulated body of knowledge is due to the meticulous experiments performed by teams of
Experiment 0 ~ Introduction to Statistics and Excel Tutorial. Introduction to Statistics, Error and Measurement
 Experiment 0 ~ Introduction to Statistics and Excel Tutorial Many of you already went through the introduction to laboratory practice and excel tutorial in Physics 1011. For that reason, we aren t going
Measurements and Data Analysis
 Measurements and Data Analysis 1 Introduction The central point in experimental physical science is the measurement of physical quantities. Experience has shown that all measurements, no matter how carefully
Experimental Uncertainty (Error) and Data Analysis
 and Data Analysis") Experimental Uncertainty (Error) and Data Analysis Advance Study Assignment Please contact Dr. Reuven at yreuven@mhrd.org if you have any questions Read the Theory part of the experiment (pages 2-14) and
Experimental Uncertainty (Error) and Data Analysis Advance Study Assignment Please contact Dr. Reuven at yreuven@mhrd.org if you have any questions Read the Theory part of the experiment (pages 2-14) and
Please bring the task to your first physics lesson and hand it to the teacher.
 Pre-enrolment task for 2014 entry Physics Why do I need to complete a pre-enrolment task? This bridging pack serves a number of purposes. It gives you practice in some of the important skills you will
Using Microsoft Excel
 Using Microsoft Excel Objective: Students will gain familiarity with using Excel to record data, display data properly, use built-in formulae to do calculations, and plot and fit data with linear functions.
Meas ure ment: Uncertainty and Error in Lab Measurements
 Meas ure ment: Uncertainty and Error in Lab Measurements Measurement is at the heart of science. In order to do science, we must be able to measure quantities such as time, distance, and mass. As famous
Introduction to Uncertainty and Treatment of Data
 Introduction to Uncertainty and Treatment of Data Introduction The purpose of this experiment is to familiarize the student with some of the instruments used in making measurements in the physics laboratory,
Appendix B: Accuracy, Precision and Uncertainty
 Appendix B: Accuracy, Precision and Uncertainty How tall are you? How old are you? When you answered these everyday questions, you probably did it in round numbers such as "five foot, six inches" or "nineteen
Uncertainty, Error, and Precision in Quantitative Measurements an Introduction 4.4 cm Experimental error
 Uncertainty, Error, and Precision in Quantitative Measurements an Introduction Much of the work in any chemistry laboratory involves the measurement of numerical quantities. A quantitative measurement
1 Random and systematic errors
 1 ESTIMATION OF RELIABILITY OF RESULTS Such a thing as an exact measurement has never been made. Every value read from the scale of an instrument has a possible error; the best that can be done is to say
PHYS 281 General Physics Laboratory
 King Abdul-Aziz University Faculty of Science Physics Department PHYS 281 General Physics Laboratory Student Name: ID Number: Introduction Advancement in science and engineering has emphasized the microscopic
A Scientific Model for Free Fall.
 A Scientific Model for Free Fall. I. Overview. This lab explores the framework of the scientific method. The phenomenon studied is the free fall of an object released from rest at a height H from the ground.
IB Physics (HL) Student Guide for Measurement Error and Uncertainty Analysis. Ballston Spa High School
 Student Guide for Measurement Error and Uncertainty Analysis. Ballston Spa High School") IB Physics (HL) Student Guide for Measurement Error and Uncertainty Analysis Ballston Spa High School Error & Uncertainty No measurement is ever perfectly exact or perfectly correct; every measurement
IB Physics (HL) Student Guide for Measurement Error and Uncertainty Analysis Ballston Spa High School Error & Uncertainty No measurement is ever perfectly exact or perfectly correct; every measurement
5-Sep-15 PHYS101-2 GRAPHING
 GRAPHING Objectives 1- To plot and analyze a graph manually and using Microsoft Excel. 2- To find constants from a nonlinear relation. Exercise 1 - Using Excel to plot a graph Suppose you have measured
Falling Bodies (last
 Dr. Larry Bortner Purpose Falling Bodies (last edited ) To investigate the motion of a body under constant acceleration, specifically the motion of a mass falling freely to Earth. To verify the parabolic
Introduction to Computer Tools and Uncertainties
 Experiment 1 Introduction to Computer Tools and Uncertainties 1.1 Objectives To become familiar with the computer programs and utilities that will be used throughout the semester. To become familiar with
Graphical Data Analysis Minneapolis Community and Tech. College v Experimental Measurements. Graphical Analysis and Straight lines
 Graphical Data Analysis Minneapolis Community and Tech. College v.8.08 Experimental Measurements All experimentally measured numbers consist of one or more exact numbers that contain no uncertainty and
UNIT 1 - STANDARDS AND THEIR MEASUREMENT: Units of Measurement: Base and derived units: Multiple and submultiples of the units: 1
 AS Physics 9702 unit 1: Standards and their Measurements 1 UNIT 1 - STANDARDS AND THEIR MEASUREMENT: This unit includes topic 1 and 2 from the CIE syllabus for AS course. Units of Measurement: Measuring
1 Measurement Uncertainties
 1 Measurement Uncertainties (Adapted stolen, really from work by Amin Jaziri) 1.1 Introduction No measurement can be perfectly certain. No measuring device is infinitely sensitive or infinitely precise.
Error Analysis in Experimental Physical Science Mini-Version
 Error Analysis in Experimental Physical Science Mini-Version by David Harrison and Jason Harlow Last updated July 13, 2012 by Jason Harlow. Original version written by David M. Harrison, Department of
ACCESS TO SCIENCE, ENGINEERING AND AGRICULTURE: MATHEMATICS 1 MATH00030 SEMESTER / Lines and Their Equations
 ACCESS TO SCIENCE, ENGINEERING AND AGRICULTURE: MATHEMATICS 1 MATH00030 SEMESTER 1 017/018 DR. ANTHONY BROWN. Lines and Their Equations.1. Slope of a Line and its y-intercept. In Euclidean geometry (where
Using Scientific Measurements
 Section 3 Main Ideas Accuracy is different from precision. Significant figures are those measured precisely, plus one estimated digit. Scientific notation is used to express very large or very small numbers.
Graphs. 1. Graph paper 2. Ruler
 Graphs Objective The purpose of this activity is to learn and develop some of the necessary techniques to graphically analyze data and extract relevant relationships between independent and dependent phenomena,
Methods and Tools of Physics
 Methods and Tools of Physics Order of Magnitude Estimation: Essential idea: Scientists aim towards designing experiments that can give a true value from their measurements, but due to the limited precision
Reference Guide. Science Reference 9/25/ Copyright 1996 Gary Lewis Revisions 2007 by John Pratte
 Reference Guide Contents...1 1. General Scientific Terminology...2 2. Types of Errors...3 3. Scientific Notation...4 4. Significant Figures...6 5. Graphs...7 6. Making Measurements...8 7. Units...9 8.
Appendix C: Accuracy, Precision, and Uncertainty
 Appendix C: Accuracy, Precision, and Uncertainty How tall are you? How old are you? When you answered these everyday questions, you probably did it in round numbers such as "five foot, six inches" or "nineteen
Notes: Unit 1: Math and Measurement
 Name: Regents Chemistry: Notes: Unit 1: Math and Measurement www.chempride.weebly.com Key Ideas Major Understandings: o Chemistry is the study of matter: Matter takes up space and has mass. (K- 4, 3.1a)
Notes: Unit 1: Math and Measurement
 Name: Regents Chemistry: Notes: Unit 1: Math and Measurement www.chempride.weebly.com Key Ideas Major Understandings: o Chemistry is the study of matter: Matter takes up space and has mass. (K- 4, 3.1a)
Purpose: Materials: WARNING! Section: Partner 2: Partner 1:
 Partner 1: Partner 2: Section: PLEASE NOTE: You will need this particular lab report later in the semester again for the homework of the Rolling Motion Experiment. When you get back this graded report,
PHYSICS 15a, Fall 2006 SPEED OF SOUND LAB Due: Tuesday, November 14
 PHYSICS 15a, Fall 2006 SPEED OF SOUND LAB Due: Tuesday, November 14 GENERAL INFO The goal of this lab is to determine the speed of sound in air, by making measurements and taking into consideration the
Gravity Pre-Lab 1. Why do you need an inclined plane to measure the effects due to gravity?
 Lab Exercise: Gravity (Report) Your Name & Your Lab Partner s Name Due Date Gravity Pre-Lab 1. Why do you need an inclined plane to measure the effects due to gravity? 2. What are several advantage of
BRIDGE CIRCUITS EXPERIMENT 5: DC AND AC BRIDGE CIRCUITS 10/2/13
 EXPERIMENT 5: DC AND AC BRIDGE CIRCUITS 0//3 This experiment demonstrates the use of the Wheatstone Bridge for precise resistance measurements and the use of error propagation to determine the uncertainty
EXPERIMENT 30A1: MEASUREMENTS. Learning Outcomes. Introduction. Experimental Value - True Value. 100 True Value
 1 Learning Outcomes EXPERIMENT 30A1: MEASUREMENTS Upon completion of this lab, the student will be able to: 1) Use various common laboratory measurement tools such as graduated cylinders, volumetric flask,
Course Project. Physics I with Lab
 COURSE OBJECTIVES 1. Explain the fundamental laws of physics in both written and equation form 2. Describe the principles of motion, force, and energy 3. Predict the motion and behavior of objects based
USING THE EXCEL CHART WIZARD TO CREATE CURVE FITS (DATA ANALYSIS).
.") USING THE EXCEL CHART WIZARD TO CREATE CURVE FITS (DATA ANALYSIS). Note to physics students: Even if this tutorial is not given as an assignment, you are responsible for knowing the material contained
USING THE EXCEL CHART WIZARD TO CREATE CURVE FITS (DATA ANALYSIS). Note to physics students: Even if this tutorial is not given as an assignment, you are responsible for knowing the material contained
Assessment Report. Level 2, Mathematics
 Assessment Report Level 2, 2006 Mathematics Manipulate algebraic expressions and solve equations (90284) Draw straightforward non-linear graphs (90285) Find and use straightforward derivatives and integrals
Electromagnetism lab project
 Electromagnetism lab project Contents 1. Overview of the course 2. How to analyse errors in measurements 3. How to make graphical representations (plots) Overview Four lab experiments Biot Savart s law
PHYS 212 PAGE 1 OF 6 ERROR ANALYSIS EXPERIMENTAL ERROR
 PHYS 212 PAGE 1 OF 6 ERROR ANALYSIS EXPERIMENTAL ERROR Every measurement is subject to errors. In the simple case of measuring the distance between two points by means of a meter rod, a number of measurements
Introduction to Measurements of Physical Quantities
 1 Goal Introduction to Measurements of Physical Quantities Content Discussion and Activities PHYS 104L The goal of this week s activities is to provide a foundational understanding regarding measurements
Physics Assessment Unit AS 3
 New Specification Centre Number 71 Candidate Number ADVANCED SUBSIDIARY (AS) General Certificate of Education 2009 Physics Assessment Unit AS 3 assessing Practical Techniques (Internal Assessment) Session
The measurements you make in the science laboratory, whether for time,
 Measuring Up Middle Grades Science Middle Grades Measuring Science Up Exploring Experimental Error through Measurement MATERIALS balance beaker, 250 ml copy of Nick and Nack template graduated cylinder,
Experiment IV. To find the velocity of waves on a string by measuring the wavelength and frequency of standing waves.
 Experiment IV The Vibrating String I. Purpose: To find the velocity of waves on a string by measuring the wavelength and frequency of standing waves. II. References: Serway and Jewett, 6th Ed., Vol., Chap.
Free Fall. v gt (Eq. 4) Goals and Introduction
 Goals and Introduction") Free Fall Goals and Introduction When an object is subjected to only a gravitational force, the object is said to be in free fall. This is a special case of a constant-acceleration motion, and one that
Free Fall Goals and Introduction When an object is subjected to only a gravitational force, the object is said to be in free fall. This is a special case of a constant-acceleration motion, and one that
Uncertainty and Graphical Analysis
 Uncertainty and Graphical Analysis Introduction Two measures of the quality of an experimental result are its accuracy and its precision. An accurate result is consistent with some ideal, true value, perhaps
Fundamentals of data, graphical, and error analysis
 Fundamentals of data, graphical, and error analysis. Data measurement and Significant Figures UTC - Physics 030L/040L Whenever we take a measurement, there are limitations to the data and how well we can
farads or 10 µf. The letter indicates the part tolerance (how close should the actual value be to the marking).
.") p1 EE1050/60 Capacitors Lab University of Utah Electrical Engineering Department EE1050/1060 Capacitors A. Stolp, 10/4/99 rev 3/17/01 Objectives 1.) Observe charging and discharging of a capacitor. 2.)
p1 EE1050/60 Capacitors Lab University of Utah Electrical Engineering Department EE1050/1060 Capacitors A. Stolp, 10/4/99 rev 3/17/01 Objectives 1.) Observe charging and discharging of a capacitor. 2.)
Uncertainty in Physical Measurements: Module 5 Data with Two Variables
 : Module 5 Data with Two Variables Often data have two variables, such as the magnitude of the force F exerted on an object and the object s acceleration a. In this Module we will examine some ways to
Principles and Problems. Chapter 1: A Physics Toolkit
 PHYSICS Principles and Problems Chapter 1: A Physics Toolkit CHAPTER 1 A Physics Toolkit BIG IDEA Physicists use scientific methods to investigate energy and matter. CHAPTER 1 Table Of Contents Section
Chapter 1. A Physics Toolkit
 Chapter 1 A Physics Toolkit Chapter 1 A Physics Toolkit In this chapter you will: Use mathematical tools to measure and predict. Apply accuracy and precision when measuring. Display and evaluate data graphically.
Conceptual Explanations: Simultaneous Equations Distance, rate, and time
 Conceptual Explanations: Simultaneous Equations Distance, rate, and time If you travel 30 miles per hour for 4 hours, how far do you go? A little common sense will tell you that the answer is 120 miles.
Experimental Uncertainty (Error) and Data Analysis
 and Data Analysis") E X P E R I M E N T 1 Experimental Uncertainty (Error) and Data Analysis INTRODUCTION AND OBJECTIVES Laboratory investigations involve taking measurements of physical quantities, and the process of taking
E X P E R I M E N T 1 Experimental Uncertainty (Error) and Data Analysis INTRODUCTION AND OBJECTIVES Laboratory investigations involve taking measurements of physical quantities, and the process of taking
Physics 2020 Laboratory Manual
 Physics 00 Laboratory Manual Department of Physics University of Colorado at Boulder Spring, 000 This manual is available for FREE online at: http://www.colorado.edu/physics/phys00/ This manual supercedes
4.2 Graphs of Rational Functions
 4.2. Graphs of Rational Functions www.ck12.org 4.2 Graphs of Rational Functions Learning Objectives Compare graphs of inverse variation equations. Graph rational functions. Solve real-world problems using
Physics 201 Lab 2 Air Drag Simulation
 Physics 201 Lab 2 Air Drag Simulation Jan 28, 2013 Equipment Initial Set Up Type the data from Table 1 into the appropriate cells. By preceding the content of the cell with an equal sign (as in cell A6)
EXPERIMENTAL UNCERTAINTY
 3 EXPERIMENTAL UNCERTAINTY I am no matchmaker, as you well know, said Lady Russell, being much too aware of the uncertainty of all human events and calculations. --- Persuasion 3.1 UNCERTAINTY AS A 95%
Error Analysis, Statistics and Graphing Workshop
 Error Analysis, Statistics and Graphing Workshop Percent error: The error of a measurement is defined as the difference between the experimental and the true value. This is often expressed as percent (%)
Measurements and Data Analysis An Introduction
 Measurements and Data Analysis An Introduction Introduction 1. Significant Figures 2. Types of Errors 3. Deviation from the Mean 4. Accuracy & Precision 5. Expressing Measurement Errors and Uncertainty
University of Massachusetts Boston - Chemistry Department Physical Chemistry Laboratory Introduction to Maximum Probable Error
 University of Massachusetts Boston - Chemistry Department Physical Chemistry Laboratory Introduction to Maximum Probable Error Statistical methods describe random or indeterminate errors in experimental
Uncertainty: A Reading Guide and Self-Paced Tutorial
 Uncertainty: A Reading Guide and Self-Paced Tutorial First, read the description of uncertainty at the Experimental Uncertainty Review link on the Physics 108 web page, up to and including Rule 6, making
Experiment 1 - Mass, Volume and Graphing
 Experiment 1 - Mass, Volume and Graphing In chemistry, as in many other sciences, a major part of the laboratory experience involves taking measurements and then calculating quantities from the results
Multi-loop Circuits and Kirchoff's Rules
 1 of 8 01/21/2013 12:50 PM Multi-loop Circuits and Kirchoff's Rules 7-13-99 Before talking about what a multi-loop circuit is, it is helpful to define two terms, junction and branch. A junction is a point
IB Physics STUDENT GUIDE 13 and Processing (DCP)
") IB Physics STUDENT GUIDE 13 Chapter Data collection and PROCESSING (DCP) Aspect 1 Aspect Aspect 3 Levels/marks Recording raw data Processing raw data Presenting processed data Complete/ Partial/1 Not at
IB Physics STUDENT GUIDE 13 Chapter Data collection and PROCESSING (DCP) Aspect 1 Aspect Aspect 3 Levels/marks Recording raw data Processing raw data Presenting processed data Complete/ Partial/1 Not at
Revision Guide for Chapter 8
 Revision Guide for Chapter 8 Contents Revision Checklist Revision Notes Scalar quantity...4 Vectors...4 Vector components...5 Displacement...5 Velocity and speed...6 Vector addition...7 Distance time graph...7
Introduction to Determining Power Law Relationships
 1 Goal Introduction to Determining Power Law Relationships Content Discussion and Activities PHYS 104L The goal of this week s activities is to expand on a foundational understanding and comfort in modeling
11.1 Uncertainty and error in measurement (1 Hour) 11.2 Uncertainties in calculated results (0.5 Hour) 11.3 Graphical techniques (0.
 11.2 Uncertainties in calculated results (0.5 Hour) 11.3 Graphical techniques (0.") Chapter 11 Measurement and Data Processing Page 1 Students are to read and complete any part that requires answers and will submit this assignment on the first day of class. You may use internet sources
Chapter 11 Measurement and Data Processing Page 1 Students are to read and complete any part that requires answers and will submit this assignment on the first day of class. You may use internet sources
A-Level Notes CORE 1
 A-Level Notes CORE 1 Basic algebra Glossary Coefficient For example, in the expression x³ 3x² x + 4, the coefficient of x³ is, the coefficient of x² is 3, and the coefficient of x is 1. (The final 4 is
IB Physics HL Year 1 First Assignment
 IB Physics HL Year 1 First Assignment Welcome to Mrs. Terzella s IB Physics HL year 1 course! I am thrilled that you are here and I am fully prepared to take you on a journey to learn concepts that are
Introduction to Measurement
 Units and Measurement Introduction to Measurement One of the most important steps in applying the scientific method is experiment: testing the prediction of a hypothesis. Typically we measure simple quantities
Alex s Guide to Word Problems and Linear Equations Following Glencoe Algebra 1
 Alex s Guide to Word Problems and Linear Equations Following Glencoe Algebra 1 What is a linear equation? It sounds fancy, but linear equation means the same thing as a line. In other words, it s an equation
Calculating Uncertainty For the Analog Ohmmeter
 Calculating Uncertainty For the Analog Ohmmeter K. M. Westerberg (2/2003) The Radio Shack VOM is an analog multimeter which can be used to measure voltage, current, and resistance. Determining the uncertainty
A velocity of 5 m s 1 can be resolved along perpendicular directions XY and XZ.
 T1 [154 marks] 1. A velocity of 5 m s 1 can be resolved along perpendicular directions XY and XZ. The component of the velocity in the direction XY is of magnitude 4 m s 1. What is the magnitude of the
EXPERIMENT 7: ANGULAR KINEMATICS AND TORQUE (V_3)
") TA name Lab section Date TA Initials (on completion) Name UW Student ID # Lab Partner(s) EXPERIMENT 7: ANGULAR KINEMATICS AND TORQUE (V_3) 121 Textbook Reference: Knight, Chapter 13.1-3, 6. SYNOPSIS In
TA name Lab section Date TA Initials (on completion) Name UW Student ID # Lab Partner(s) EXPERIMENT 7: ANGULAR KINEMATICS AND TORQUE (V_3) 121 Textbook Reference: Knight, Chapter 13.1-3, 6. SYNOPSIS In
Experiment 1: The Same or Not The Same?
 Experiment 1: The Same or Not The Same? Learning Goals After you finish this lab, you will be able to: 1. Use Logger Pro to collect data and calculate statistics (mean and standard deviation). 2. Explain
Errors: What they are, and how to deal with them
 Errors: What they are, and how to deal with them A series of three lectures plus exercises, by Alan Usher Room 111, a.usher@ex.ac.uk Synopsis 1) Introduction ) Rules for quoting errors 3) Combining errors
Systematic Uncertainty Max Bean John Jay College of Criminal Justice, Physics Program
 Systematic Uncertainty Max Bean John Jay College of Criminal Justice, Physics Program When we perform an experiment, there are several reasons why the data we collect will tend to differ from the actual
Practical Investigation
 colinhop@bigpond.net.au Physics Revision 2017 333 Practical Investigation independent, dependent and controlled variables Definitions Independent, dependent and controlled variables The independent variable
2 Foundations of physics Calculation sheet. OCR Physics A. Determining uncertainty. Specification references. Learning outcomes
 Determining uncertainty Specification references 2.2.1 c) M0.3 Use ratios, fractions, and percentages M1.5 Identify uncertainties in measurements and use simple techniques to determine uncertainty when
AS and A Level Physics Cambridge University Press Tackling the examination. Tackling the examination
 Tackling the examination You have done all your revision and now you are in the examination room. This is your chance to show off your knowledge. Keep calm, take a few deep breaths, and try to remember
experiment3 Introduction to Data Analysis
 63 experiment3 Introduction to Data Analysis LECTURE AND LAB SKILLS EMPHASIZED Determining what information is needed to answer given questions. Developing a procedure which allows you to acquire the needed
CHAPTER ONE FUNCTIONS AND GRAPHS. In everyday life, many quantities depend on one or more changing variables eg:
 CHAPTER ONE FUNCTIONS AND GRAPHS 1.0 Introduction to Functions In everyday life, many quantities depend on one or more changing variables eg: (a) plant growth depends on sunlight and rainfall (b) speed
Length & Time Question Paper 2
 Length & Time Question Paper 2 Level IGCSE Subject Physics Exam Board CIE Topic General Physics Sub-Topic Length & Time Paper Type Alternative to Practical Booklet Question Paper 2 Time Allowed: 60 minutes
Key Facts and Methods
 Intermediate Maths Key Facts and Methods Use this (as well as trying questions) to revise by: 1. Testing yourself. Asking a friend or family member to test you by reading the questions (on the lefthand
Physics. Nov Title: Nov 3 8:52 AM (1 of 45)
") Physics Nov 3 2008 Title: Nov 3 8:52 AM (1 of 45) Physics Nov 3 2008 Physics is the branch of science that studies matter and energy, how they are related and how they interact. Physics covers everything
Physics Nov 3 2008 Title: Nov 3 8:52 AM (1 of 45) Physics Nov 3 2008 Physics is the branch of science that studies matter and energy, how they are related and how they interact. Physics covers everything
1 Measurement Uncertainties
 1 Measurement Uncertainties (Adapted stolen, really from work by Amin Jaziri) 1.1 Introduction No measurement can be perfectly certain. No measuring device is infinitely sensitive or infinitely precise.
Gravity: How fast do objects fall? Teacher Advanced Version (Grade Level: 8 12)
") Gravity: How fast do objects fall? Teacher Advanced Version (Grade Level: 8 12) *** Experiment with Audacity and Excel to be sure you know how to do what s needed for the lab*** Kinematics is the study
Gravity: How fast do objects fall? Teacher Advanced Version (Grade Level: 8 12) *** Experiment with Audacity and Excel to be sure you know how to do what s needed for the lab*** Kinematics is the study
ABE Math Review Package
 P a g e ABE Math Review Package This material is intended as a review of skills you once learned and wish to review before your assessment. Before studying Algebra, you should be familiar with all of the
Measurement Error PHYS Introduction
 PHYS 1301 Measurement Error Introduction We have confidence that a particular physics theory is telling us something interesting about the physical universe because we are able to test quantitatively its
MEI Core 1. Basic Algebra. Section 1: Basic algebraic manipulation and solving simple equations. Manipulating algebraic expressions
 MEI Core Basic Algebra Section : Basic algebraic manipulation and solving simple equations Notes and Examples These notes contain subsections on Manipulating algebraic expressions Collecting like terms
Supplemental Activity: Vectors and Forces
 Supplemental Activity: Vectors and Forces Objective: To use a force table to test equilibrium conditions. Required Equipment: Force Table, Pasco Mass and Hanger Set, String, Ruler, Polar Graph Paper, Protractor,
Year 12 Physics INDUCTION WORK XKCD. Student. Class 12 A / B / C / D / E Form
 Year 12 Physics 2018-19 INDUCTION WORK XKCD Student Class 12 A / B / C / D / E Form DYP 2018 1. Physical Quantities Maths and Physics have an important but overlooked distinction by students. Numbers in
Physics Unit 3 Investigative and Practical Skills in AS Physics PHY3T/P09/test
 Surname Other Names Leave blank Centre Number Candidate Number Candidate Signature General Certificate of Education June 2009 Advanced Subsidiary Examination Physics Unit 3 Investigative and Practical
A-level PHYSICS (7408/3A)
") SPECIMEN MATERIAL A-level PHYSICS (7408/3A) Paper 3 Section A Specimen 2014 Morning Time allowed: 2 hours Materials For this paper you must have: a pencil a ruler a calculator a data and formulae booklet
SPECIMEN MATERIAL A-level PHYSICS (7408/3A) Paper 3 Section A Specimen 2014 Morning Time allowed: 2 hours Materials For this paper you must have: a pencil a ruler a calculator a data and formulae booklet
Partner s Name: EXPERIMENT MOTION PLOTS & FREE FALL ACCELERATION
 Name: Partner s Name: EXPERIMENT 500-2 MOTION PLOTS & FREE FALL ACCELERATION APPARATUS Track and cart, pole and crossbar, large ball, motion detector, LabPro interface. Software: Logger Pro 3.4 INTRODUCTION
INTRODUCTION TO LABORATORY EXPERIMENT AND MEASUREMENT
 INTRODUCTION TO LABORATORY EXPERIMENT AND MEASUREMENT Purpose Theory a. To take some simple measurements to use for statistical analysis b. To learn how to use a Vernier caliper and a micrometer screw
Achievement Standard (Physics 2.1)
") Achievement Standard 91168 (Physics 2.1) Guidelines What follows is an interpretation of the standard. It has not been approved by the NZQA. Aim Aim The aim of the experiment will be to find the relationship
Achievement Standard 91168 (Physics 2.1) Guidelines What follows is an interpretation of the standard. It has not been approved by the NZQA. Aim Aim The aim of the experiment will be to find the relationship