Kernel density estimation for heavy-tailed distributions...
|
|
|
- Ernest Carpenter
- 6 years ago
- Views:
Transcription
1 Kernel density estimation for heavy-tailed distributions using the Champernowne transformation Buch-Larsen, Nielsen, Guillen, Bolance, Kernel density estimation for heavy-tailed distributions using the Champernowne transformation, Statistics, Vol. 39, No. 6, December 2005, Tine Buch-Kromann
2 Limitations of the kernel density estimator Simulated lognormal data set Kernel density estimator Density True, (lognormal) Kernel density est X
3 Limitations of the kernel density estimator Simulated lognormal data set Kernel density estimator Density True, (lognormal) Kernel density est X
4 Motivation Combine the advantages of non-parametric and parametric statistics. Non-parametric statistics: + No assumptions of the shape of the distribution. The estimation of the distribution is uncertain when few data. Parametric statistics: + The estimated distribution converge faster to the true distribution than the non-parametric distribution. The distribution assumption might be wrong.
5 Characteristics Non par. model Method Par. model Few data A lot of data When data are few, the method should be close to a parametric model, When the amount of data increases, the method should become more non-parametric.
6 The Champernowne distribution The Champernowne distribution: The Champernowne cdf is defined for x 0 and has the form T α,m (x) = x α x α + M α x R + with parameters α > 0 and M > 0 and density t α,m (x) = αmα x α 1 (x α + M α ) 2 x R +
7 The Champernowne distribution The Champernowne distribution converges to a Pareto distribution: t α,m (x) αmα x α+1 as x Notice that the Champernowne distribution is defined on [0, ) in contrast to the Pareto distribution ( ) M α G(x) = 1 x with density g(x) = αmα, α > 0, M > 0 x α+1 which is only defined for x [M, ). This makes the Pareto distribution inappropriate as an underlying parametric distribution.
8 The Champernowne distribution The tail of the Champernowne distribution is advantageous because it is heavy. However the shape near 0 is unfortunately quite inflexible: α < 1 1 t α,m (0) = M α = 1 0 α > 1
9 The Champernowne distribution The effect of the parameter α For α < α : T α,m (x) > T α,m(x) T α,m (x) = T α,m(x) T α,m (x) < T α,m(x) if 0 x < M if x = M if M < x < α is not at scale parameter, but it has some properties which are similar to a scale parameter s: α > 1: Increasing α results in a more steep derivation of the cdf in the value M. (Scale parameter effect: To narrow the density. Moreover, the mode moves to the right, and the tail becomes ligher.) α < 1, increasing α results in a less steep shape of the density near 0.
10 The Champernowne distribution The effect of the parameter M For M < M : T α,m (x) > T α,m (x) x R + Increasing M results in decreasing cdf. α > 1: The mode of the density moves to the right and becomes lower.
11 The Modified Champernowne distribution The Champernowne heavy tailed distribution, but the shape near 0 is inflexible and depends on α which also determines the tail. The modifiend Champernowne cdf is defined for x 0 and has the form T α,m,c (x) = (x + c) α c α (x + c) α + (M + c) α 2c α x R + with parameters α > 0, M > 0 and c 0 and density t α,m,c (x) = α(x + c)α 1 ((M + c) α c α ) ((x + c) α + (M + c) α 2c α ) 2 x R +
12 The Modified Champernowne distribution The modified Champernowne distribution converges to Pareto distribution: t α,m,c (x) α ( ((M + c) α c α ) 1/α) α x α+1 x Note that the modified Champernowne distribution is defined for on [0, ) in contrast to the Pareto distribution ( ) α ((M + c) α c α ) 1/α G(x) = 1 x with density g(x) = α((m + c)α c α ) x α+1 which is only defined for x [((M + c) α c α ) 1/α, ).
13 The Modified Champernowne distribution The effect of the parameter c For c < c and α > 1 T α,m,c (x) < T α,m,c (x) T α,m,c (x) = T α,m,c (x) T α,m,c (x) > T α,m,c (x) if 0 x < M if x = M if M < x < for α < 1 T α,m,c (x) > T α,m,c (x) T α,m,c (x) = T α,m,c (x) T α,m,c (x) < T α,m,c (x) if 0 x < M if x = M if M < x <
14 The Modified Champernowne distribution When α 1, then c has some scale parameter properties : c changes the density in the tail. α < 1 increasing c results in lighter tails. Opposite when α > 1. c changes the density in 0. Positive c s give a positive finite density in 0. c moves the mode. α > 1 increasing c shift the mode to the left. When α = 1: c has no effect.
15 Parameter estimation Almost maximum-likelihood parameters Notice: T α,m,c (M) = 0.5 Therefore estimate M as the empirical median Sub-optimal parameters (but close to the optimal parameters), Simplify the computations, Robust estimator, especially for heavy-tailed distributions. Estimate (α, c) by maximizing the log likelihood function: l = N log α + N log((m + c) α c α ) + (α 1) 2 N log((x i + c) α + (M + c) α 2c α ) i=1 For fixed M the likelihood function is concave and has a maximum. N log(x i + c) i=1
16 The semiparametric transformation kernel density estimator Step 1: Original data Density True Mod. Champ Data set: (X 1,..., X n ) with unknown cdf F (x) and density f (x). Parameter estimation of the mod. Champ.: Estimate (α, M, c) of the mod. Champ.: T (x). X
17 The semiparametric transformation kernel density estimator Step 2: Transformed data Density Transformation: Transform (X 1,..., X n ) into (Z 1,..., Z n ) using Z i = T (X i ) Z
18 The semiparametric transformation kernel density estimator Step 3: Density Transformed data Ker. den. (no boundary corr.) Z Correction: Compute a correction estimator by means of a kernel density estimator ˆf t (z) = 1 n n K b (z Z i ) i=1 where K b (z) is the Epanechnikov kernel function and b = 0.2 is the bandwidth.
19 The semiparametric transformation kernel density estimator Step 3: Transformed data Density Ker. den. (no boundary corr.) Ker. den. (with boundary corr.) Correction: Compute a correction estimator by means of a kernel density estimator ˆf t (z) = 1 n k(z) n K b (z Z i ) i=1 where k ( z) is the boundary correction. Z ĝ(z): The final estimator on the tranformed axis.
20 The semiparametric transformation kernel density estimator Step 4: Density Original data True Mod. Champ. KMCE Inverse tranformation: The final estimator of (X 1,..., X n ) on the original axis is obtained by an inverse transformation, such that ˆf t (T (x)) ˆf (x) = (T 1 ) (T (x)) X Summarized formula: ˆf (x) = 1 n k(t (x)) n i=1 K b (T (x) T (X i )) T (x)
21 Asymptotic theory Let X 1,..., X n be iid var. with density f. Let ˆf (x) be the transf. kernel density est. of f ˆf (x) = 1 n n K b (T (x) T (X i ))T (x) i=1 where T ( ) is the transf. fct. Then bias and variance of ˆf (x) are given by E[ˆf (x)] f (x) = 1 (( ) f (x) 2 µ 2(K)b 2 1 T (X ) V[ˆf (x)] = 1 nb R(K)T (x)f (x) + o T (x) ( ) 1 nb ) + o(b 2 ) as n, where µ 2 (K) = u 2 K(u) du and R(K) = K 2 (u) du
22 Simulation study Simulation study setup: Simulated from four distributions: Lognormal Mixture of lognormal and Pareto Weibull Truncated logitic Number of observations: n = {50, 100, 500, 1000} 2000 repetition. Epanechnikov kernel function. Bandwidth selection: Silverman s Rule-of-Thumb.
23 Simulation study Distributions: Lognormal Lognormal(0.7) Pareto(0.3) Lognormal(0.3) Pareto(0.7) Weibull Normal Truncated logistic
24 Simulation study Error measures: L 1 norm L 2 norm L 1 = 0 ˆf (x) f (x) dx L 2 = 0 ) 2 (ˆf (x) f (x) dx L 1 and L 2 measures the errors near 0 and in the tail equally.
25 Simulation study WISE ) 2 WISE = (ˆf (x) f (x) x 2 dx 0 E (mean excess fuctions) E = = (ê(x) e(x)) 2 f (x) dx 0 ( 2 u(f (u) ˆf (u)) du) f (x) dx 0 x WISE and E is error measures that emphasizes the tail of the distribution.
26 Simulation study Benchmark estimators: BGN: Transf. kernel density est. with the shifted power transf. { (x + λ1 ) y = λ 2 λ 2 0 ln(x + λ 1 ) λ 2 = 0 Aim: Transformed data symmetric. CHL: Transf. kernel density est. with the Mobius-like transf. y = x α R α x α + R α Champernowne transformation with another parameter estimation method.
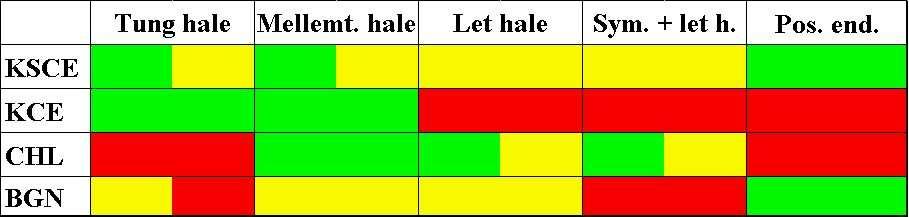
27 Simulation study Results:
28 Application: Automobile claims Spanish automobile accidents: Spanish automobile accidents: Bodily injury from 1997; Data divided into two age groups: young drives (less than 30 years) and old drives (above 30 years); Young: 1061 obs. in the inverval [1;126000] with mean value 402.7, Old: 4061 obs. in the inverval [1;17000] with mean value 243.1,
29 Application: Automobile claims Spanish automobile accidents: Young: Estimated mod. Champ. par.: ˆα 1 = 1.116, ˆM1 = 66, ĉ 1 = Old: Estimated mod. Champ. par.: ˆα 2 = 1.145, ˆM2 = 68, ĉ 2 = Bandwidths: b 1 = and b 2 = Notice that ˆα 1 < ˆα 2, ie. young drivers has a heavier tail.
30 Application: Automobile claims Spanish automobile claims on the transformed axis <30 years old >30 years old Kernel est Kernel est
31 Application: Automobile claims Spanish automobile claims and the resulting KSCE estimate Small claims, <30 years old Small claims, >30 years old e+00 1 e 05 2 e 05 3 e 05 4 e 05 0 e+00 1 e 05 2 e 05 3 e 05 4 e 05 Moderately size claims, <30 years old Moderately size claims, >30 years old e+00 1 e 07 2 e 07 3 e 07 4 e 07 0 e+00 1 e 07 2 e 07 3 e 07 4 e 07 Extreme claims, <30 years old Extreme claims, >30 years old
32 Application: Automobile claims Quotient between the KSCE estimates of <30 years old and >30 years old Small claims KSCEyoung KSCEold Moderately size claims KSCEyoung KSCEold Extreme claims KSCEyoung KSCEold Conclusion: The young drivers has a heavier tail than the old drivers.
33 Application: Employer s liability Employer s liability claims: 2522 claims (Irish insurance company), Estimated mod. Champ. par.: ˆα = 1.955, ˆM = 32379, ĉ = Estimated Champ. par.(c = 0): ˆα = 0.954, ˆM = What is the effect of not including c???
34 Application: Automobile claims
35 Application: Automobile claims Conclusion: Nearly identical for small and moderate claims whereas the KCE overestimates the tail. This shows the importance of the modified Champernowne distribution.
36 Conclusion Estimating loss distributions, Introduced the semiparametric transformation kernel density estimator: Based on a parametric estimator that is subsequently corrected with a nonparametric estimator Lot of information close to a nonparametric estimator, Little information close to a parametric estimator. Introduced the Champernowne distribution (heavy-tailed), Generalized to the modified Champernowne distribution (flexible and heavy-tailed)
Kernel density estimation for heavy-tailed distributions using the champernowne transformation
 Statistics, Vol. 39, No. 6, December 2005, 503 518 Kernel density estimation for heavy-tailed distributions using the champernowne transformation TINE BUCH-LARSEN, JENS PERCH NIELSEN, MONTSERRAT GUILLÉN*
Histogram Härdle, Müller, Sperlich, Werwatz, 1995, Nonparametric and Semiparametric Models, An Introduction
 Härdle, Müller, Sperlich, Werwatz, 1995, Nonparametric and Semiparametric Models, An Introduction Tine Buch-Kromann Construction X 1,..., X n iid r.v. with (unknown) density, f. Aim: Estimate the density
Local Transformation Kernel Density Estimation of Loss Distributions
 Local Transformation Kernel Density Estimation of Loss Distributions J. Gustafsson a M. Hagmann b J.P. Nielsen c O. Scaillet d Revised version: June 2007 Abstract We develop a tailor made semiparametric
Nonparametric Density Estimation (Multidimension)
") Nonparametric Density Estimation (Multidimension) Härdle, Müller, Sperlich, Werwarz, 1995, Nonparametric and Semiparametric Models, An Introduction Tine Buch-Kromann February 19, 2007 Setup One-dimensional
Nonparametric Density Estimation (Multidimension) Härdle, Müller, Sperlich, Werwarz, 1995, Nonparametric and Semiparametric Models, An Introduction Tine Buch-Kromann February 19, 2007 Setup One-dimensional
Multivariate density estimation using dimension reducing information and tail flattening transformations for truncated or censored data
 Ann Inst Stat Math (2012) 64:167 192 DOI 10.1007/s10463-010-0313-6 Multivariate density estimation using dimension reducing information and tail flattening transformations for truncated or censored data
A Bayesian approach to parameter estimation for kernel density estimation via transformations
 A Bayesian approach to parameter estimation for kernel density estimation via transformations Qing Liu,, David Pitt 2, Xibin Zhang 3, Xueyuan Wu Centre for Actuarial Studies, Faculty of Business and Economics,
Nonparametric estimation of Value-at-Risk
 DOCUMENT DE TREBALL XREAP2012-19 Nonparametric estimation of Value-at-Risk Ramon Alemany (RFA-IREA, XREAP) Catalina Bolancé (RFA-IREA, XREAP) Montserrat Guillén (RFA-IREA, XREAP) Nonparametric estimation
Nonparametric Methods
 Nonparametric Methods Michael R. Roberts Department of Finance The Wharton School University of Pennsylvania July 28, 2009 Michael R. Roberts Nonparametric Methods 1/42 Overview Great for data analysis
Additive Isotonic Regression
 Additive Isotonic Regression Enno Mammen and Kyusang Yu 11. July 2006 INTRODUCTION: We have i.i.d. random vectors (Y 1, X 1 ),..., (Y n, X n ) with X i = (X1 i,..., X d i ) and we consider the additive
Model Fitting. Jean Yves Le Boudec
 Model Fitting Jean Yves Le Boudec 0 Contents 1. What is model fitting? 2. Linear Regression 3. Linear regression with norm minimization 4. Choosing a distribution 5. Heavy Tail 1 Virus Infection Data We
Spatially Smoothed Kernel Density Estimation via Generalized Empirical Likelihood
 Spatially Smoothed Kernel Density Estimation via Generalized Empirical Likelihood Kuangyu Wen & Ximing Wu Texas A&M University Info-Metrics Institute Conference: Recent Innovations in Info-Metrics October
ESTIMATORS IN THE CONTEXT OF ACTUARIAL LOSS MODEL A COMPARISON OF TWO NONPARAMETRIC DENSITY MENGJUE TANG A THESIS MATHEMATICS AND STATISTICS
 A COMPARISON OF TWO NONPARAMETRIC DENSITY ESTIMATORS IN THE CONTEXT OF ACTUARIAL LOSS MODEL MENGJUE TANG A THESIS IN THE DEPARTMENT OF MATHEMATICS AND STATISTICS PRESENTED IN PARTIAL FULFILLMENT OF THE
STAT 6350 Analysis of Lifetime Data. Probability Plotting
 STAT 6350 Analysis of Lifetime Data Probability Plotting Purpose of Probability Plots Probability plots are an important tool for analyzing data and have been particular popular in the analysis of life
Nonparametric Econometrics
 Applied Microeconometrics with Stata Nonparametric Econometrics Spring Term 2011 1 / 37 Contents Introduction The histogram estimator The kernel density estimator Nonparametric regression estimators Semi-
Severity Models - Special Families of Distributions
 Severity Models - Special Families of Distributions Sections 5.3-5.4 Stat 477 - Loss Models Sections 5.3-5.4 (Stat 477) Claim Severity Models Brian Hartman - BYU 1 / 1 Introduction Introduction Given that
Method of Moments. which we usually denote by X or sometimes by X n to emphasize that there are n observations.
 Method of Moments Definition. If {X 1,..., X n } is a sample from a population, then the empirical k-th moment of this sample is defined to be X k 1 + + Xk n n Example. For a sample {X 1, X, X 3 } the
Statistics: Learning models from data
 DS-GA 1002 Lecture notes 5 October 19, 2015 Statistics: Learning models from data Learning models from data that are assumed to be generated probabilistically from a certain unknown distribution is a crucial
Empirical Likelihood
 Empirical Likelihood Patrick Breheny September 20 Patrick Breheny STA 621: Nonparametric Statistics 1/15 Introduction Empirical likelihood We will discuss one final approach to constructing confidence
Introduction to Nonparametric and Semiparametric Estimation. Good when there are lots of data and very little prior information on functional form.
 1 Introduction to Nonparametric and Semiparametric Estimation Good when there are lots of data and very little prior information on functional form. Examples: y = f(x) + " (nonparametric) y = z 0 + f(x)
Analysis methods of heavy-tailed data
 Institute of Control Sciences Russian Academy of Sciences, Moscow, Russia February, 13-18, 2006, Bamberg, Germany June, 19-23, 2006, Brest, France May, 14-19, 2007, Trondheim, Norway PhD course Chapter
Nonparametric Model Construction
 Nonparametric Model Construction Chapters 4 and 12 Stat 477 - Loss Models Chapters 4 and 12 (Stat 477) Nonparametric Model Construction Brian Hartman - BYU 1 / 28 Types of data Types of data For non-life
Density estimation Nonparametric conditional mean estimation Semiparametric conditional mean estimation. Nonparametrics. Gabriel Montes-Rojas
 0 0 5 Motivation: Regression discontinuity (Angrist&Pischke) Outcome.5 1 1.5 A. Linear E[Y 0i X i] 0.2.4.6.8 1 X Outcome.5 1 1.5 B. Nonlinear E[Y 0i X i] i 0.2.4.6.8 1 X utcome.5 1 1.5 C. Nonlinearity
Economics 620, Lecture 19: Introduction to Nonparametric and Semiparametric Estimation
 Economics 620, Lecture 19: Introduction to Nonparametric and Semiparametric Estimation Nicholas M. Kiefer Cornell University Professor N. M. Kiefer (Cornell University) Lecture 19: Nonparametric Analysis
Financial Econometrics and Volatility Models Extreme Value Theory
 Financial Econometrics and Volatility Models Extreme Value Theory Eric Zivot May 3, 2010 1 Lecture Outline Modeling Maxima and Worst Cases The Generalized Extreme Value Distribution Modeling Extremes Over
Nonparametric Density Estimation
 Nonparametric Density Estimation Econ 690 Purdue University Justin L. Tobias (Purdue) Nonparametric Density Estimation 1 / 29 Density Estimation Suppose that you had some data, say on wages, and you wanted
Minimum Hellinger Distance Estimation in a. Semiparametric Mixture Model
 Minimum Hellinger Distance Estimation in a Semiparametric Mixture Model Sijia Xiang 1, Weixin Yao 1, and Jingjing Wu 2 1 Department of Statistics, Kansas State University, Manhattan, Kansas, USA 66506-0802.
A Novel Nonparametric Density Estimator
 A Novel Nonparametric Density Estimator Z. I. Botev The University of Queensland Australia Abstract We present a novel nonparametric density estimator and a new data-driven bandwidth selection method with
Density estimators for the convolution of discrete and continuous random variables
 Density estimators for the convolution of discrete and continuous random variables Ursula U Müller Texas A&M University Anton Schick Binghamton University Wolfgang Wefelmeyer Universität zu Köln Abstract
Analysis methods of heavy-tailed data
 Institute of Control Sciences Russian Academy of Sciences, Moscow, Russia February, 13-18, 2006, Bamberg, Germany June, 19-23, 2006, Brest, France May, 14-19, 2007, Trondheim, Norway PhD course Chapter
Correlation: Copulas and Conditioning
 Correlation: Copulas and Conditioning This note reviews two methods of simulating correlated variates: copula methods and conditional distributions, and the relationships between them. Particular emphasis
Introduction. Linear Regression. coefficient estimates for the wage equation: E(Y X) = X 1 β X d β d = X β
 = X 1 β X d β d = X β") Introduction - Introduction -2 Introduction Linear Regression E(Y X) = X β +...+X d β d = X β Example: Wage equation Y = log wages, X = schooling (measured in years), labor market experience (measured
Introduction - Introduction -2 Introduction Linear Regression E(Y X) = X β +...+X d β d = X β Example: Wage equation Y = log wages, X = schooling (measured in years), labor market experience (measured
Quantitative Economics for the Evaluation of the European Policy. Dipartimento di Economia e Management
 Quantitative Economics for the Evaluation of the European Policy Dipartimento di Economia e Management Irene Brunetti 1 Davide Fiaschi 2 Angela Parenti 3 9 ottobre 2015 1 ireneb@ec.unipi.it. 2 davide.fiaschi@unipi.it.
Overview of Extreme Value Theory. Dr. Sawsan Hilal space
 Overview of Extreme Value Theory Dr. Sawsan Hilal space Maths Department - University of Bahrain space November 2010 Outline Part-1: Univariate Extremes Motivation Threshold Exceedances Part-2: Bivariate
L. Brown. Statistics Department, Wharton School University of Pennsylvania
 Non-parametric Empirical Bayes and Compound Bayes Estimation of Independent Normal Means Joint work with E. Greenshtein L. Brown Statistics Department, Wharton School University of Pennsylvania lbrown@wharton.upenn.edu
Log-transform kernel density estimation of income distribution
 Log-transform kernel density estimation of income distribution by Arthur Charpentier Université du Québec à Montréal CREM & GERAD Département de Mathématiques 201, av. Président-Kennedy, PK-5151, Montréal,
1 Degree distributions and data
 1 Degree distributions and data A great deal of effort is often spent trying to identify what functional form best describes the degree distribution of a network, particularly the upper tail of that distribution.
Log-Transform Kernel Density Estimation of Income Distribution
 Log-Transform Kernel Density Estimation of Income Distribution Arthur Charpentier, Emmanuel Flachaire To cite this version: Arthur Charpentier, Emmanuel Flachaire. Log-Transform Kernel Density Estimation
Approximating the Integrated Tail Distribution
 Approximating the Integrated Tail Distribution Ants Kaasik & Kalev Pärna University of Tartu VIII Tartu Conference on Multivariate Statistics 26th of June, 2007 Motivating example Let W be a steady-state
Quantile-quantile plots and the method of peaksover-threshold
 Problems in SF2980 2009-11-09 12 6 4 2 0 2 4 6 0.15 0.10 0.05 0.00 0.05 0.10 0.15 Figure 2: qqplot of log-returns (x-axis) against quantiles of a standard t-distribution with 4 degrees of freedom (y-axis).
Exam C Solutions Spring 2005
 Exam C Solutions Spring 005 Question # The CDF is F( x) = 4 ( + x) Observation (x) F(x) compare to: Maximum difference 0. 0.58 0, 0. 0.58 0.7 0.880 0., 0.4 0.680 0.9 0.93 0.4, 0.6 0.53. 0.949 0.6, 0.8
Bayesian Semiparametric GARCH Models
 Bayesian Semiparametric GARCH Models Xibin (Bill) Zhang and Maxwell L. King Department of Econometrics and Business Statistics Faculty of Business and Economics xibin.zhang@monash.edu Quantitative Methods
Bayesian Semiparametric GARCH Models
 Bayesian Semiparametric GARCH Models Xibin (Bill) Zhang and Maxwell L. King Department of Econometrics and Business Statistics Faculty of Business and Economics xibin.zhang@monash.edu Quantitative Methods
12 - Nonparametric Density Estimation
 ST 697 Fall 2017 1/49 12 - Nonparametric Density Estimation ST 697 Fall 2017 University of Alabama Density Review ST 697 Fall 2017 2/49 Continuous Random Variables ST 697 Fall 2017 3/49 1.0 0.8 F(x) 0.6
Motivational Example
 Motivational Example Data: Observational longitudinal study of obesity from birth to adulthood. Overall Goal: Build age-, gender-, height-specific growth charts (under 3 year) to diagnose growth abnomalities.
Parameter Estimation
 Parameter Estimation Chapters 13-15 Stat 477 - Loss Models Chapters 13-15 (Stat 477) Parameter Estimation Brian Hartman - BYU 1 / 23 Methods for parameter estimation Methods for parameter estimation Methods
Robustness to Parametric Assumptions in Missing Data Models
 Robustness to Parametric Assumptions in Missing Data Models Bryan Graham NYU Keisuke Hirano University of Arizona April 2011 Motivation Motivation We consider the classic missing data problem. In practice
Estimation of Quantiles
 9 Estimation of Quantiles The notion of quantiles was introduced in Section 3.2: recall that a quantile x α for an r.v. X is a constant such that P(X x α )=1 α. (9.1) In this chapter we examine quantiles
Computational treatment of the error distribution in nonparametric regression with right-censored and selection-biased data
 Computational treatment of the error distribution in nonparametric regression with right-censored and selection-biased data Géraldine Laurent 1 and Cédric Heuchenne 2 1 QuantOM, HEC-Management School of
Tail negative dependence and its applications for aggregate loss modeling
 Tail negative dependence and its applications for aggregate loss modeling Lei Hua Division of Statistics Oct 20, 2014, ISU L. Hua (NIU) 1/35 1 Motivation 2 Tail order Elliptical copula Extreme value copula
ASTIN Colloquium 1-4 October 2012, Mexico City
 ASTIN Colloquium 1-4 October 2012, Mexico City Modelling and calibration for non-life underwriting risk: from empirical data to risk capital evaluation Gian Paolo Clemente Dept. Mathematics, Finance Mathematics
Nonparametric Function Estimation with Infinite-Order Kernels
 Nonparametric Function Estimation with Infinite-Order Kernels Arthur Berg Department of Statistics, University of Florida March 15, 2008 Kernel Density Estimation (IID Case) Let X 1,..., X n iid density
Bootstrap, Jackknife and other resampling methods
 Bootstrap, Jackknife and other resampling methods Part III: Parametric Bootstrap Rozenn Dahyot Room 128, Department of Statistics Trinity College Dublin, Ireland dahyot@mee.tcd.ie 2005 R. Dahyot (TCD)
Math 494: Mathematical Statistics
 Math 494: Mathematical Statistics Instructor: Jimin Ding jmding@wustl.edu Department of Mathematics Washington University in St. Louis Class materials are available on course website (www.math.wustl.edu/
Stat 5101 Lecture Notes
 Stat 5101 Lecture Notes Charles J. Geyer Copyright 1998, 1999, 2000, 2001 by Charles J. Geyer May 7, 2001 ii Stat 5101 (Geyer) Course Notes Contents 1 Random Variables and Change of Variables 1 1.1 Random
The Fundamentals of Heavy Tails Properties, Emergence, & Identification. Jayakrishnan Nair, Adam Wierman, Bert Zwart
 The Fundamentals of Heavy Tails Properties, Emergence, & Identification Jayakrishnan Nair, Adam Wierman, Bert Zwart Why am I doing a tutorial on heavy tails? Because we re writing a book on the topic Why
On the Choice of Parametric Families of Copulas
 On the Choice of Parametric Families of Copulas Radu Craiu Department of Statistics University of Toronto Collaborators: Mariana Craiu, University Politehnica, Bucharest Vienna, July 2008 Outline 1 Brief
Variable inspection plans for continuous populations with unknown short tail distributions
 Variable inspection plans for continuous populations with unknown short tail distributions Wolfgang Kössler Abstract The ordinary variable inspection plans are sensitive to deviations from the normality
Survival Analysis: Weeks 2-3. Lu Tian and Richard Olshen Stanford University
 Survival Analysis: Weeks 2-3 Lu Tian and Richard Olshen Stanford University 2 Kaplan-Meier(KM) Estimator Nonparametric estimation of the survival function S(t) = pr(t > t) The nonparametric estimation
Time Series and Forecasting Lecture 4 NonLinear Time Series
 Time Series and Forecasting Lecture 4 NonLinear Time Series Bruce E. Hansen Summer School in Economics and Econometrics University of Crete July 23-27, 2012 Bruce Hansen (University of Wisconsin) Foundations
Nonparametric Regression Härdle, Müller, Sperlich, Werwarz, 1995, Nonparametric and Semiparametric Models, An Introduction
 Härdle, Müller, Sperlich, Werwarz, 1995, Nonparametric and Semiparametric Models, An Introduction Tine Buch-Kromann Univariate Kernel Regression The relationship between two variables, X and Y where m(
New mixture models and algorithms in the mixtools package
 New mixture models and algorithms in the mixtools package Didier Chauveau MAPMO - UMR 6628 - Université d Orléans 1ères Rencontres BoRdeaux Juillet 2012 Outline 1 Mixture models and EM algorithm-ology
A Conditional Approach to Modeling Multivariate Extremes
 A Approach to ing Multivariate Extremes By Heffernan & Tawn Department of Statistics Purdue University s April 30, 2014 Outline s s Multivariate Extremes s A central aim of multivariate extremes is trying
Introduction to Rare Event Simulation
 Introduction to Rare Event Simulation Brown University: Summer School on Rare Event Simulation Jose Blanchet Columbia University. Department of Statistics, Department of IEOR. Blanchet (Columbia) 1 / 31
Teruko Takada Department of Economics, University of Illinois. Abstract
 Nonparametric density estimation: A comparative study Teruko Takada Department of Economics, University of Illinois Abstract Motivated by finance applications, the objective of this paper is to assess
Spline Density Estimation and Inference with Model-Based Penalities
 Spline Density Estimation and Inference with Model-Based Penalities December 7, 016 Abstract In this paper we propose model-based penalties for smoothing spline density estimation and inference. These
A tailor made nonparametric density estimate
 A tailor made nonparametric density estimate Daniel Carando 1, Ricardo Fraiman 2 and Pablo Groisman 1 1 Universidad de Buenos Aires 2 Universidad de San Andrés School and Workshop on Probability Theory
Kernel density estimation of reliability with applications to extreme value distribution
 University of South Florida Scholar Commons Graduate Theses and Dissertations Graduate School 2008 Kernel density estimation of reliability with applications to extreme value distribution Branko Miladinovic
Non-parametric Inference and Resampling
 Non-parametric Inference and Resampling Exercises by David Wozabal (Last update 3. Juni 2013) 1 Basic Facts about Rank and Order Statistics 1.1 10 students were asked about the amount of time they spend
Local Multiplicative Bias Correction for Asymmetric Kernel Density Estimators
 Local Multiplicative Bias Correction for Asymmetric Kernel Density Estimators Matthias HAGMANN HEC-University of Lausanne and FAME Olivier SCAILLET HEC-University of Geneva and FAME Research Paper N 91
Finite Sample Performance of Semiparametric Binary Choice Estimators
 University of Colorado, Boulder CU Scholar Undergraduate Honors Theses Honors Program Spring 2012 Finite Sample Performance of Semiparametric Binary Choice Estimators Sean Grover University of Colorado
Semiparametric Generalized Linear Models
 Semiparametric Generalized Linear Models North American Stata Users Group Meeting Chicago, Illinois Paul Rathouz Department of Health Studies University of Chicago prathouz@uchicago.edu Liping Gao MS Student
Inverse Statistical Learning
 Inverse Statistical Learning Minimax theory, adaptation and algorithm avec (par ordre d apparition) C. Marteau, M. Chichignoud, C. Brunet and S. Souchet Dijon, le 15 janvier 2014 Inverse Statistical Learning
3 Continuous Random Variables
 Jinguo Lian Math437 Notes January 15, 016 3 Continuous Random Variables Remember that discrete random variables can take only a countable number of possible values. On the other hand, a continuous random
On robust and efficient estimation of the center of. Symmetry.
 On robust and efficient estimation of the center of symmetry Howard D. Bondell Department of Statistics, North Carolina State University Raleigh, NC 27695-8203, U.S.A (email: bondell@stat.ncsu.edu) Abstract
Tobit and Interval Censored Regression Model
 Global Journal of Pure and Applied Mathematics. ISSN 0973-768 Volume 2, Number (206), pp. 98-994 Research India Publications http://www.ripublication.com Tobit and Interval Censored Regression Model Raidani
Discrete Distributions Chapter 6
 Discrete Distributions Chapter 6 Negative Binomial Distribution section 6.3 Consider k r, r +,... independent Bernoulli trials with probability of success in one trial being p. Let the random variable
Estimating and Testing Quantile-based Process Capability Indices for Processes with Skewed Distributions
 Journal of Data Science 8(2010), 253-268 Estimating and Testing Quantile-based Process Capability Indices for Processes with Skewed Distributions Cheng Peng University of Southern Maine Abstract: This
Model-free prediction intervals for regression and autoregression. Dimitris N. Politis University of California, San Diego
 Model-free prediction intervals for regression and autoregression Dimitris N. Politis University of California, San Diego To explain or to predict? Models are indispensable for exploring/utilizing relationships
Copulas. MOU Lili. December, 2014
 Copulas MOU Lili December, 2014 Outline Preliminary Introduction Formal Definition Copula Functions Estimating the Parameters Example Conclusion and Discussion Preliminary MOU Lili SEKE Team 3/30 Probability
Maximum Smoothed Likelihood for Multivariate Nonparametric Mixtures
 Maximum Smoothed Likelihood for Multivariate Nonparametric Mixtures David Hunter Pennsylvania State University, USA Joint work with: Tom Hettmansperger, Hoben Thomas, Didier Chauveau, Pierre Vandekerkhove,
Kernel density estimation
 Kernel density estimation Patrick Breheny October 18 Patrick Breheny STA 621: Nonparametric Statistics 1/34 Introduction Kernel Density Estimation We ve looked at one method for estimating density: histograms
ECON 4130 Supplementary Exercises 1-4
 HG Set. 0 ECON 430 Sulementary Exercises - 4 Exercise Quantiles (ercentiles). Let X be a continuous random variable (rv.) with df f( x ) and cdf F( x ). For 0< < we define -th quantile (or 00-th ercentile),
41903: Introduction to Nonparametrics
 41903: Notes 5 Introduction Nonparametrics fundamentally about fitting flexible models: want model that is flexible enough to accommodate important patterns but not so flexible it overspecializes to specific
Logistic Kernel Estimator and Bandwidth Selection. for Density Function
 International Journal of Contemporary Matematical Sciences Vol. 13, 2018, no. 6, 279-286 HIKARI Ltd, www.m-ikari.com ttps://doi.org/10.12988/ijcms.2018.81133 Logistic Kernel Estimator and Bandwidt Selection
Semi-parametric predictive inference for bivariate data using copulas
 Semi-parametric predictive inference for bivariate data using copulas Tahani Coolen-Maturi a, Frank P.A. Coolen b,, Noryanti Muhammad b a Durham University Business School, Durham University, Durham, DH1
More on Estimation. Maximum Likelihood Estimation.
 More on Estimation. In the previous chapter we looked at the properties of estimators and the criteria we could use to choose between types of estimators. Here we examine more closely some very popular
Some New Methods for Latent Variable Models and Survival Analysis. Latent-Model Robustness in Structural Measurement Error Models.
 Some New Methods for Latent Variable Models and Survival Analysis Marie Davidian Department of Statistics North Carolina State University 1. Introduction Outline 3. Empirically checking latent-model robustness
SOLUTION FOR HOMEWORK 8, STAT 4372
 SOLUTION FOR HOMEWORK 8, STAT 4372 Welcome to your 8th homework. Here you have an opportunity to solve classical estimation problems which are the must to solve on the exam due to their simplicity. 1.
University, Tempe, Arizona, USA b Department of Mathematics and Statistics, University of New. Mexico, Albuquerque, New Mexico, USA
 This article was downloaded by: [University of New Mexico] On: 27 September 2012, At: 22:13 Publisher: Taylor & Francis Informa Ltd Registered in England and Wales Registered Number: 1072954 Registered
Bayesian estimation of the discrepancy with misspecified parametric models
 Bayesian estimation of the discrepancy with misspecified parametric models Pierpaolo De Blasi University of Torino & Collegio Carlo Alberto Bayesian Nonparametrics workshop ICERM, 17-21 September 2012
Lecture 3: Statistical Decision Theory (Part II)
") Lecture 3: Statistical Decision Theory (Part II) Hao Helen Zhang Hao Helen Zhang Lecture 3: Statistical Decision Theory (Part II) 1 / 27 Outline of This Note Part I: Statistics Decision Theory (Classical
Lecture 3: Statistical Decision Theory (Part II) Hao Helen Zhang Hao Helen Zhang Lecture 3: Statistical Decision Theory (Part II) 1 / 27 Outline of This Note Part I: Statistics Decision Theory (Classical
A NOTE ON TESTING THE SHOULDER CONDITION IN LINE TRANSECT SAMPLING
 A NOTE ON TESTING THE SHOULDER CONDITION IN LINE TRANSECT SAMPLING Shunpu Zhang Department of Mathematical Sciences University of Alaska, Fairbanks, Alaska, U.S.A. 99775 ABSTRACT We propose a new method
Transformations and Bayesian Density Estimation
 Transformations and Bayesian Density Estimation Andrew Bean 1, Steve MacEachern, Xinyi Xu The Ohio State University 10 th Conference on Bayesian Nonparametrics June 25, 2015 1 bean.243@osu.edu Transformations
E cient Regressions via Optimally Combining Quantile Information
 E cient Regressions via Optimally Combining Quantile Information Zhibiao Zhao Penn State University Zhijie Xiao Boston College Abstract We develop a generally applicable framework for constructing e cient
ACTEX CAS EXAM 3 STUDY GUIDE FOR MATHEMATICAL STATISTICS
 ACTEX CAS EXAM 3 STUDY GUIDE FOR MATHEMATICAL STATISTICS TABLE OF CONTENTS INTRODUCTORY NOTE NOTES AND PROBLEM SETS Section 1 - Point Estimation 1 Problem Set 1 15 Section 2 - Confidence Intervals and
Bayesian Point Process Modeling for Extreme Value Analysis, with an Application to Systemic Risk Assessment in Correlated Financial Markets
 Bayesian Point Process Modeling for Extreme Value Analysis, with an Application to Systemic Risk Assessment in Correlated Financial Markets Athanasios Kottas Department of Applied Mathematics and Statistics,
Local Polynomial Regression
 VI Local Polynomial Regression (1) Global polynomial regression We observe random pairs (X 1, Y 1 ),, (X n, Y n ) where (X 1, Y 1 ),, (X n, Y n ) iid (X, Y ). We want to estimate m(x) = E(Y X = x) based
Practice Exam 1. (A) (B) (C) (D) (E) You are given the following data on loss sizes:
 (B) (C) (D) (E) You are given the following data on loss sizes:") Practice Exam 1 1. Losses for an insurance coverage have the following cumulative distribution function: F(0) = 0 F(1,000) = 0.2 F(5,000) = 0.4 F(10,000) = 0.9 F(100,000) = 1 with linear interpolation
Practice Exam 1 1. Losses for an insurance coverage have the following cumulative distribution function: F(0) = 0 F(1,000) = 0.2 F(5,000) = 0.4 F(10,000) = 0.9 F(100,000) = 1 with linear interpolation
Bayesian estimation of bandwidths for a nonparametric regression model with a flexible error density
 ISSN 1440-771X Australia Department of Econometrics and Business Statistics http://www.buseco.monash.edu.au/depts/ebs/pubs/wpapers/ Bayesian estimation of bandwidths for a nonparametric regression model
Challenges in implementing worst-case analysis
 Challenges in implementing worst-case analysis Jon Danielsson Systemic Risk Centre, lse,houghton Street, London WC2A 2AE, UK Lerby M. Ergun Systemic Risk Centre, lse,houghton Street, London WC2A 2AE, UK