ACCELERATED MATHEMATICS CHAPTER 7 NON-PROPORTIONAL LINEAR RELATIONSHIPS TOPICS COVERED:
|
|
|
- Alicia Miles
- 6 years ago
- Views:
Transcription

1 ACCELERATED MATHEMATICS CHAPTER 7 NON-PROPORTIONAL LINEAR RELATIONSHIPS TOPICS COVERED: Representing Linear Non-Proportional Equations Slope & y-intercept Graphing Using Slope & y-intercept Proportional vs. Non-Proportional Systems of Linear Equations Linear Equations from Situations and Graphing Linear Equations from Tables Linear Relationships and Bivariate Data Input/Output and Functions Describing & Comparing Functions Contents modified from my.hrw.com, 8 th grade Edition online practice

2 LINEAR RELATIONSHIPS Proportional Non-Proportional Constant of Proportionality Constant of Variation Direct Variation y = mx + b y = x + 4 y = 4x + 7 y = kx y = 5x You save $5 each month. x y m = slope b = y-intercept You start with $5 and then save $5 each month. x y
3 Verbal Examples Linear Relationships: Proportional vs. Non-Proportional Proportional: Mr. Mangham started the year with $. Each week he earned $5. Non-Proportional: Mr. Mangham started the year with $75. Each week he earned $5. How to tell the difference: A proportional situation always starts at zero (in this case $ at the first of the year). A nonproportional situation does not start at zero (in this case $75 at the first of the year). Table Examples Proportional: Weeks 3 4 Money ($) Money Weeks Non-Proportional: Weeks 3 4 Money ($) Money Weeks How to tell the difference: A proportional table has a constant of proportionality in that y divided by x always equals the same value. A non-proportional table will have different values when y is divided by x. Equation Examples Proportional: y = 5x Non-proportional: y = 5x + 75 How to tell the difference: A proportional equation is always in the form y = kx, where k is the unit rate or constant of proportionality. A non-proportional equation is always in the form y = mx + b, where m is the constant rate of change or slope. The key difference is the added b on the end. Graph Examples Proportional: Non-Proportional: Mr. Mangham's Money 3 4 Mr. Mangham's Money 3 4 How to tell the difference: A proportional graph is a straight line that always goes through the origin. A non-proportional graph is a straight line that does not go through the origin.
4 NONPROPORTIONAL RELATIONSHIPS CHAPTER 7 MODULE 4, 5, 6 (BOOK) Module 4. Relationships can have a constant rate of change but not be proportional. When graphed a linear equation forms a line. Linear equations form y = mx + b. When b the relationship is non-proportional. m = slope These graphs are straight lines that do not go through the origin. Module 4. y-intercept = the y-coordinate of the point where the graph intersects the y-axis. (when x=) y = mx + b is called slope-intercept form. m = slope b = y-intercept Module 4.3/4.4 A line with positive slope will rise from left to right. A line with negative slope will fall from left to right. Linear relationships can be either proportional or non-proportional. Non-linear relationships are all non-proportional. Module 5./5. Word problems, Graphs, Verbal descriptions, Tables to: y = mx + b Linear, proportional: y = mx Linear, non-proportional: y = mx + b Module 5.3 Points on a graph to y = mx + b Bivariate data is a set of data that is made up of two paired variables. Non-linear relationships have a rate of change that varies between pairs of points. Module 6. A function is like a machine. It has exactly one output for each input. The value that is put into the machine is the input. The result is the output. You can determine functions from: Mapping diagrams, Coordinate pairs, Tables, Graphs Module 6. A linear equation is represented by a straight line on a graph. Linear equations are linear functions when their graphs are non-vertical lines. Equations that cannot be written as y = mx + b are not linear equations and therefore not linear functions. Module 6.3 Comparing functions in the form of: Tables, Equations, Graphs, Descriptions
5 Activity 7-: Representing Linear Non-Proportional Relationships (4.) You can use an equation to describe the relationship between two quantities in a real-world situation. You can use a table to show some values that make the equation true.. The equation y = 3x + gives the total change, y, for bowling x games at Baxter Bowling Lanes based on the prices shown. Make a table of values for this situation. x (number of games) 3 4 y (cost in dollars) BAXTER BOWLING LANES $3 per game $ shoe rental. Francisco makes $ per hour doing part-time work on Saturdays. He spends $4 on transportation to and from work. The equation y = x 4 gives his earnings y, after transportation costs, for working x hours. Make a table of values for this situation. x (number of hours) y (earnings in dollars) 3. The entrance fee for Mountain World theme park is $. Visitors purchase additional $ tickets for rides, games, and food. The equation y = x + gives the total cost, y, to visit the park, including purchasing x tickets. x (number of tickets) y (total cost in dollars) y x 4. Plot the ordered pairs from the table. Describe the shape of the graph. 5. Find the rate of change between each point and the next. Is the rate constant? 6. Explain why the relationship between number of tickets and total cost is not proportional. Cost ($) Theme Park Costs Number of Tickets 7. Would it make sense to add more points to the graph from x = to x =? Would it make sense to connect the points with a line? Explain.
6 Activity 7-: Representing Linear Non-Proportional Relationships (4.) A linear equation is an equation whose solutions are ordered pairs that form a straight line when graphed on a coordinate plane. Linear equations can be written in the form y = mx + b. When b, the relationship between x and y is nonproportional. The diameter of a Douglas fir tree is currently inches when measured at chest height. Over the next 5 years, the diameter is expected to increase by an average growth rate of 5 inch per year. The equation y = x + gives y, the diameter of the tree in inches, after x years. 5. Complete the table. x (years) 3 5 y (diameter in inches). Plot the ordered pairs from the table and draw a line connecting the points to represent all the possible solutions. 3. Is this relationship linear? 4. Is it proportional? Diameter (in) Fir tree Growth Time (yr) Make a table of values for each equation. 5. y = x x y 3 y = x 5 8 x y
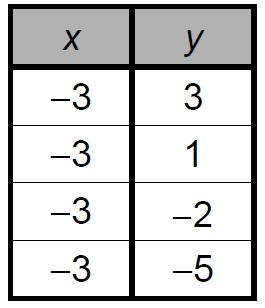
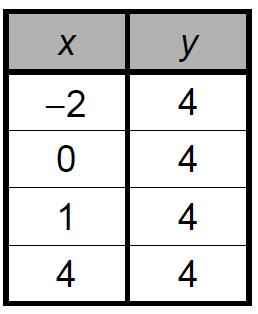
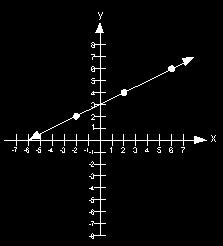
7 Activity 7-3: Representing Linear Non-Proportional Relationships (4.) Explain why each relationship is not proportional... x y y x 3. Complete the table for the equation and then graph the equation. y = x x y State whether the graph of each linear relationship is a solid line or a set of unconnected points and explain your reasoning. 4. The relationship between the number of $4 lunches you buy with a $ school lunch card and the money left remaining on the card. 5. The relationship between time and the distance remaining on a 3-mile walk for someone walking at a steady rate of miles per hour.
8 Activity 7-4: Representing Linear Non-Proportional Relationships (4.) Simone paid $ for an initial year s subscription to a magazine. The renewal rate is $8 per year. This situation can be represented by the equation y = 8x +, where x represents the number of years the subscription is renewed and y represents the total cost.. Make a table for this situation.. Draw a graph to represent the situation. 3. Explain why this relationship is not proportional. 4. Does it make sense to connect the points on the graph with a solid line? Explain. Cost ($) Years 5. What is required of a proportional relationship that is not required of a general line relationship? 6. Explain how you can identify a linear nonproportional relationship from a table? From a graph? From an equation? 7. George observes that for every increase of in the value of x, there is an increase of 6 in the corresponding value of y. He claims that the relationship represented by the table is proportional. Critique George s reasoning. x y Two parallel lines are graphed on a coordinate plane. How many of the parallel lines could represent proportional relationships? Explain.
9 Activity 7-5: Representing Linear Non-Proportional Relationships (4.) Make a table of values for each equation.. y = 4x + 3. x y y = x 4 x y 3. y =.5x + 4. y =.5x + x 4 4 x y y Make a table of values and graph the solutions of each equation. 5. y = x + 6. x y y = x 3 x 4 4 y State whether the graph of each linear relationship is a solid line or a set of unconnected points. Explain your reasoning. 7. The relationship between the height of a tree and the time since the tree was planted. 8. The relationship between the number of $ DVDs you buy and the total cost.
10 Activity 7-6: Determining Slope and y-intercept (4.) The graph of every nonvertical line crosses the y-axis. The y-intercept is the y-coordinate of the point where the graph intersects the y-axis. The x-coordinate of this point is always. The graph represents the linear equation. What is the slope from (,4) to (-3,6)?. What is the slope from (,4) to (6,)? y = x What do you notice about the two slopes and how they relate to the linear equation? 4. Find the value of y when x = using the equation y = x + 4. Describe the point on the graph that 3 corresponds to this situation. 5. What do you notice about this y value and how it relates to the linear equation? The linear equation below is written in the slope-intercept form of an equation. Its graph is the line with slope m and y-intercept b. y = mx + b A linear relationship has a constant rate of change. You can find the rate of change m and the initial value b for a linear situation from a table of values. Example : A phone salesperson is paid a minimum weekly salary and a commission for each phone sold, as shown in the table. Determine the constant rate of change and the initial value. Number of phones sold 3 4 Weekly Income ($) $48 $63 $78 $93 The rate of change is the same as the slope. y m = x = To find the initial value we need to know how much the salesperson makes when zero phones are sold. Work backwards from x = to x =. The initial value is the same as the y-intercept. b =
11 Activity 7-7: Determining Slope and y-intercept (4.). Find the slope and y-intercept of the line represented by each table. x x 3 4 y y Find the slope and y-intercept of the line in each graph. Slope m = y-intercept b = Slope m = y-intercept b = Slope m = y-intercept b = Slope m = y-intercept b =
12 Activity 7-8: Determining Slope and y-intercept (4.). Find the slope and y-intercept of the line represented by each table. x x 5 5 y y 8 6. Some carpet cleaning costs are shown in the table. The relationship is linear. Find and interpret the rate of change (slope) and the initial value of for this situation. Rooms cleaned 3 4 Cost ($) The total cost to pay for parking at a state park for the day and rent a paddleboat are shown below. Number of hours 3 4 Cost ($) Find the cost to park for a day and the hourly rate to rent a paddleboat. 4. What will Lin pay if she rents a paddleboat for 3.5 hours and splits the total cost with a friend? Explain. Raymond s parents will pay for him to take sailboard lessons during the summer. He can take half-hour group lessons or half-hour private lessons. The relationship between cost and number of lessons is linear. Lessons 3 4 Group ($) Private ($) Find the rate of change and the initial value for the group lessons. 6. Find the rate of change and the initial value for the private lessons. 7. Compare and contrast the rates of change and the initial values.
13 Activity 7-9: Determining Slope and y-intercept (4.). Explain why each relationship is not linear. x 3 4 x y y Your teacher asked your class to describe a real-world situation in which the y-intercept is and the slope is 5. Your partner gave the following description: My younger brother originally had small building blocks, but he lost 5 of them every month since. What mistake did your partner make? How can you change the situation to match? 3. John has a job parking cars. He earns a fixed salary of $3 plus a fee of $5 for each car he parks. His potential earnings for a week are shown in the graph. At what point does John begin to earn more from fees that from his fixed salary? Justify your answer. Weekly earnings Cars parked Find the slope and y-intercept of the line in each graph Find the slope and y-intercept of the line represented by each table x y x y 3 4 5
14 Activity 7-: Graphing Linear Nonproportional Relationships (4.3) Example Graph y = x 3 Step : What is the y-intercept (b)? Plot that point. Step : What is the slope? Use the slope to find a second point. Step 3: Draw a line through the points. Example Graph 5 y = x + 3 Step : What is the y-intercept (b)? Plot that point. Step : What is the slope? Use the slope to find a second point. Step 3: Draw a line through the points.. Graph each equation. y = x + y = 3x + 4
15 Activity 7-: Graphing Linear Nonproportional Relationships (4.3) Analyzing a Graph Many real-world situations can be represented by linear relationships. Example Ken has a weekly goal for the number of calories he will burn by taking brisk walks. The equation y = 3x + 4 represents the number of calories y Ken has left to burn after x hours of walking. Graph the equation y = 3x + 4. Step : What is the y-intercept? Step : What is the slope written as a fraction? Use the slope to locate a second point. Step 3: Draw a line through the two points. Calories remaining Time (h). After how many hours of walking will Ken have 6 calories left to burn? After how many hours will he reach his weekly goal?. What if Ken modifies his plans by slowing his speed. The equation for the modified plan is y = x + 4. Graph the new equation on the graph and compare to the previous graph. 3. Suppose Ken decides that instead of walking, he will jog, and jogging burns 6 calories per hour. How do you think this would change the graph? 4. Graph each equation using the slope and y-intercept. y = x 3 y = 3x + Slope = y-intercept = Slope = y-intercept =
16 Activity 7-: Graphing Linear Nonproportional Relationships (4.3) A friend gives you two baseball cards for your birthday. Afterward, you begin collecting them. You buy the same number of cards once each week. The equation y = 4x + describes the number of cards, y, you have after x weeks.. Find and interpret the slope and the y-intercept of the line that represents this situation.. Graph the equation y = 4x Discuss which points on the line do not make sense in this situation. Then plot three more points on the line that do make sense. Cards Weeks A spring stretches in relation to the weight hanging from it according to the equation y =.75x +.5 where x is the weight in pounds and y is the length of the spring in inches. 4. Graph the equation. 5. Interpret the slope and the y-intercept of the line. 6. How long will the spring be if a pound weight is hung on it? Length (in) Weight (lb) 7. Will the length double if you double the weight? Explain.
17 Activity 7-3: Graphing Linear Nonproportional Relationships (4.3). Identify the coordinates of four points on the line with each given slope and y-intercept. A. Slope = 5, y-intercept = B. Slope =., y-intercept =.3 C. Slope =, y-intercept = 8 D. Slope =, y-intercept = 4. A music school charges a registration fee in addition to a fee per lesson. Music lesson last.5 hour. The equation y = 4x + 3 represents the total cost of y of x lessons. Find and interpret the slope and y- intercept of the line that represents this situation. 3. A public pool charges a membership fee and a fee for each visit. The equation y = 3x + 5 represents the cost y for x visits. 4. After locating the y-intercept on the coordinate plane shown, Danielle moves up three gridlines and right one gridline. What is the rise and run of Danielle s move? Is this is a correct slope based on the information presented in the problem? Explain. 5. Graph the equation y = 3x + 5. Then interpret the slope and y-intercept. 6. How many visits to the pool can a member get for $? Cost ($) Visits 7. A students says that the slope of a line for the equation y = 5x is and the y-intercept is 5. Find and correct the error. 8. Suppose you know the slope of a linear relationship and a point that its graph passes through. Can you graph the line even if the point provided does not represent the y-intercept? Explain. 9. Graph the lines y = 3x, y = 3x 3, and y = 3x + 3. What do you notice about the three lines? Make a conjecture based on your observation.
18 Activity 7-4: Graphing Non-Linear Proportional Relationships (4.3) Graph each equation using the slope and the y-intercept.. y = x. y = x + 3 slope = y-intercept = slope = y-intercept = 3. y = x 4 4. y = x slope = y-intercept = slope = y-intercept = 5. The equation y = 5x + gives your score on a math quiz, where x is number of questions you answered correctly. a. Graph the equation. b. Interpret the slope and y-intercept of the line. c. What is your score if you answered 5 questions correctly?
19 Activity 7-5: Proportional and Nonproportional Situations (4.4) IS THE GRAPH A STRAIGHT LINE? YES DOES IT GO THROUGH THE ORIGIN? NO Non-Linear, Non-Proportional YES Linear, Proportional NO Linear, Non-proportional. Determine if each of the following graphs represents a proportional or nonproportional relationship If it is a linear equation it can be written in the form y = mx + b. If it is also proportional, then b = and it can also be written as y = kx.. Determine if each of the following equations represents a proportional or nonproportional relationship. d = 65t p =.s + n = 45 3p 36 = d If there is not a constant rate of change in the data then it is a nonlinear, nonproportional relationship. A linear relationship is a proportional relationship when y x is nonproportional. is constant. Otherwise, the linear relationship 3. Determine if the linear relationship represented by each table is a proportional or nonproportional relationship. x y x y
20 Activity 7-6: Proportional and Nonproportional Situations (4.4). Determine which situation is a proportional relationship and which situation is a nonproportional relationship. The cost for Test Prep Center A is $ times the number of hours that you attend. The cost for Test Prep Center B is $5 an hour, but you have a $ coupon that you can use to reduce the cost..-9. Determine if each relationship is a proportional or nonproportional situation q = p + v = u t = 5d m =.75d x y x y Describe a real-world situation where the relationship is linear and nonproportional.
21 Activity 7-7: Proportional vs. Non-Proportional (4.4).-6. Determine if each relationship is a proportional or nonproportional situation. Explain your reasoning. Assume all tables represent linear relationships. y = x r = b + x y x y This year, Andrea cleebrated her th birthday, and her brother Carlos celebrated his 6 th birthday. Andrea noted that she was now twice as old as her brother was. Is the relationship between their ages proportional? Support your answer. Lily is considering buying books on displat three different tables. Each table has one of the following signs. 8. Each Book $ Each Book 5% off Each Book $8 for Club Members (One-time Membership Fee: $5) What will be the total cost if Lily buys 6 books from the table whose sign indicates a nonproportional relationship? 9. Ed and Riley are cycling in the same direction on the same stright road. Ed s distance from a roadside rest area is given by d=6t. Riley s distance from the same rest area is iven by d= 4.5t+. In each equation d is distance in miles and t is time in hours. a. Determine if equation is proportional or non-proportional. b. When are Ed and Riley the same distance from the rest area? c. Support your answers.
22 Activity 7-8: Proportional vs. Non-Proportional (4.4). Complete the tables below and then graph each set of data. Proportional Relationship x y y x Rate of change (slope) = Non-Proportional Relationship x y y x Rate of change (slope) =. What did you notice about the rate of change for each relationship? 3. What did you notice about the graphs for the proportional and non-proportional relationship? 4. For which relationship is the rate of change the same as the ratio 5. What did you notice about the ratio y x for the each relationship? y x? Proportional Linear Functions Both Non-Proportional Linear Functions Graphs will pass through the Graphs have a constant rate of origin. Graphs will not pass change (slope). through the origin. There is a constant of proportionality. Lines are in the form of y=kx. There is only one and exactly one y-value that corresponds (maps) to any given x-value. Lines are in the form of y=mx+b.
23 Activity 7-9: Solving Systems of Linear Equations by Graphing (4.5) You have learned several ways to graph a linear equation in slope-intercept form. For example, you can use the slope and y-intercept or you can find two points that satisfy the equation and connect them with a line. Graph the pair of equations together on the same graph: y = 3x and y = x + 3 What is the point of intersection of the two lines? Will that point of intersection be a solution to the first equation? Check by substituting the point into the equation. Will that point of intersection be a solution to the second equation? Check by substituting the point into the equation. An ordered pair (x,y) is a solution of an equation in two variables if substituting the x- and y- values into the equation results in a true statement. A system of equations is a set of equations that have the same variables. An ordered pair is a solution of a system of equations if it is a solution of every equation in the set. Solve the system by graphing. y = x + 4 and y = 3x Solve the system by graphing. y = x + and y = 4x Solve the system by graphing. y = x + 5 and y = 3x
24 Activity 7-: Solving Systems of Linear Equations (4.5) Show all graphs on graph paper. Show all work on notebook or graph paper. Eight friends wanted to start a business. They will wear either a baseball cap or a shirt imprinted with their logo while working. They want to spend exactly $36 on the shirts and caps. Shirts cost $6 each and caps cost $3 each. Let x represent the number of shirts and let y represent the number of caps.. Write an equation to represent the total number of caps and shirts they will purchase. Write an equation to represent the total cost of all the shirts and caps. Rewrite both of your equations in y = mx + b form. Graph each equation and to find the solution. What does the solution represent? Bowl-o-Rama charges a shoe rental fee of $. and a cost per game of $.5. Bowling Pinz charges a rental fee of $4. and a cost per game of $... Let x represent the number of games played and let y represent the total cost. Write an equation to represent the total cost at Bowl-O-Rama. Write an equation to represent the total cost at Bowling Pinz. Graph each equation and to find the solution. What does the solution represent? Mr. Underwood runs 7 miles per week and increases his distance by mile each week. Mr. Mangham runs 3 miles per week and increases his distance by miles each week. In how many weeks will Mr. Underwood and Mr. Mangham be running the same distance? What will that distance be? Write a system of equations and graph to find the solution. Write an interesting, creative real-world problem that could be represented by the system of equations shown below. y = 4x + y = 3x + 5 You have two options for your internet service: Option : $5 set-up fee plus $3 per month Option : No set-up fee plus $4 per month In how many months will the total cost of both options be the same? Write a system of equations and graph to find the solution. If you plan to cancel your internet service after 9 months, which is the cheaper option?
25 Activity 7-: Solving Systems of Linear Equations (4.5) Solve each linear system by graphing. Check your answer.. y = y = x 7 y = x 5. y = x x = 4 y = 3x y = 4x 3 3 y = x + 5. Two skaters are racing toward the finish line of a race. The first skater has a 5 meter lead and is traveling at a rate of 5 meters per second. The second skater is traveling at a rate of 5 meters per second. How long will it take for the second skater to pass the first skater?
26 Activity 7-: Solving Systems of Linear Equations (4.5) Solve each linear system by graphing. Check your answer.. 3 y = x + 4 y = x 5 y = x 6. y = x x = y = x y = 3x 6 3 y = x Two skaters are racing toward the finish line of a race. The first skater has a meter lead and is traveling at a rate of meters per second. The second skater is traveling at a rate of 5 meters per second. How long will it take for the second skater to pass the first skater?
27 Activity 7-3: Writing Linear Equations from Situations and Graphs (5.) Writing an Equation in Slope-Intercept Form Greta makes clay mugs and bowls as gifts at the Crafty Studio. She pays a membership fee of $5 a month and an equipment fee of $3. an hour to use the potter s wheel, table, and kiln.. What is the input variable, x, in this situation?. What is the output variable, y, in this situation? 3. Write an equation in the form y = mx + b that Greta can use to calculate her monthly cost. 4. During April Greta does not use the equipment at all. What will her cost be for April? 6. What is the y-intercept, b, in the equation? 7. What is the slope, m, in the equation? 8. A video club charges a one-time membership fee plus a rental fee for each DVD borrowed. Use the graph to write an equation in slope-intercept form. 9. What does the value of the slope represent in this context?. Describe the meaning of the y-intercept. $ Rentals. The cash register subtracts $.5 from a $5 Starbucks gift card for every medium coffee the customer buys. Use the graph to write an equation in slope-intercept form to represent this situation. $ Number of coffees
28 Activity 7-4: Writing Linear Equations from Situations and Graphs (5.) Writing an Equation from a Description The rent charged for space in an office building is a linear relationship related to the size of the space rented. Write an equation in slope-intercept form for the rent at West Main Street Office Rentals. West Main Street Office Rentals Monthly Rates 6 square feet for $75 9 square feet for $5. What are the input (x) and output (y) variables?. Write the information given in the problem as ordered pairs. 3. What is the slope? 4. What is the y-intercept? Use the slope and one of the ordered pairs to determine the intercept. 5. Substitute the slope and y-intercept into the final equation. 6. Hari s weekly allowance varies depending on the number of chores he does. He received $6 in allowance the week he did chores and $4 in allowance the week he did 8 chores. Write an equation for his allowance in slope-intercept form. 7. Li is making beaded necklaces. For each necklace she uses 7 spacers plus 5 beads per inch of necklace length. Write an equation in slope-intercept form to find how many beads Li needs for each necklace. 8. Kate is planning a trip to the beach. She estimates her average speed to graph her expected progress on the trip. Write an equation in slope-intercept form that represents the situation. 9. At 59 degrees Fahrenheit crickets chirp at a rate of 76 times per minute and at 65 degrees Fahrenheit they chirp times per minute. Write an equation in slope-intercept form that represents the situation.. A dragonfly can beat its wings 3 times per second. Write an equation in slope-intercept form that shows the relationship between flying time in seconds and the number of times the dragonfly beats it wings.. A balloon is released from the top of a platform that is 5 meters tall. The balloon rises at the rate of 4 meters per second. Write an equation in slope-intercept form that tells the height of the balloon above the ground after a given number of seconds. Distance to beach (mi) Driving time (hr)
29 Activity 7-5: Writing Linear Equations from Situations and Graphs (5.) The graph shows a scuba diver s ascent over time.. What is the slope of the line?. What does the slope mean in this problem? 3. What is the y-intercept of the line? 4. What does the y-intercept mean in this problem? 5. Write an equation in slope-intercept form that represents the diver s depth over time. Depth (m) Time (sec) 6. The formula for converting Celsius to Fahrenheit temperatures in a linear equation. Water freezes at C, or 3 F, and it boils at C, or F. Write an equation in slope-intercept form that converts degrees Celsius into degrees Fahrenheit. 7. The cost of renting a sailboat at a lake is $ per hour plus $ for lifejackets. Write an equation in slope-intercept form that can be used to calculate that total amount you would pay for using a sailboat. The graph shows that activity in a savings account. 8. What was the amount of the initial deposit that started this savings account? 9. Find the slope and y-intercept of the graphed line.. Write an equation in slope-intercept form for the activity in this savings account.. Explain the meaning of the slope in this graph. $ saved Months in plan. Explain how you decide which part of any problem will be represented by the variable x and which part will be represented by the variable y in a graph of a situation.
30 Activity 7-6: Writing Linear Equations from Words and Graphs (5.) For each situation described, first write an equation in the form y = mx + b. Then solve each problem.. A sales associate is given a $5 hiring bonus with a new job. She earns an average commission of $5 per week for the next weeks. How much does she earn?. A farm has a reserve of 5 pounds of wheat in his silo. The farmer can harvest the wheat at a rate of pounds of wheat per day. In how many days will the farmer have a total of 3,5 pounds of wheat? 3. Mr. Mangham is going on a long run with 75 ml of Gatorade. Each hour he drinks ml of Gatorade. How long will the Gatorade last? 4. A water tank is currently holding 8, gallons. The water will be used at a rate of 45 gallons per day. How long will it take for the water level to reach 6, gallons? 5. Elsa collects snowmen. At the end of 4 months she had 7 snowmen and at the end of 7 months she had 6 snowmen. Find out how many snowmen she had at month by calculating b and then determine how many months it will take her to have 89 snowmen. 6. (4,75) (9,4) Use these two points to write an equation in the form of y = mx + b. 7. (3,4) (7,3) Use these two points to write an equation in the form of y = mx + b. Write an equation in the form y = mx + b for each situation Height (m) y Time (s) x
31 Activity 7-7: Writing Linear Equations from a Table (5.) The table shows the temperature of a fish tank during an experiment. Time (hr) Temperature (F) Graph the ordered pairs.. Draw a line through the points. 3. Calculate the slope. 4. Find the y-intercept. 5. Write the equation. Temperature Tank Temperature Time (hr) 6. The table shows the volume of water released by Hoover Dam over a certain period of time. Graph the data and then write the equation for the graph in slope-intercept form. Time (sec) 5 5 Volume of water (m 3 ) Water Released 3 5 Volume Time (sec)
32 Activity 7-8: Writing Linear Equations from a Table (5.). Elizabeth s cell phone plan lets her choose how many minutes are included each month. The table shows the plan s monthly cost y for a given number of included minutes x. Write an equation in slopeintercept form to represent the situation. Minutes included Cost of the plan ($) What is the base price for the cell phone plan, regardless of how many minutes are included? What is the cost per minute? 3. Elizabeth s cell phone company changes the cost of her plan as shown below. Write an equation in slope-intercept form to represent the situation. How did the plan change? Minutes included Cost of the plan ($) A salesperson received a weekly salary plus a commission for each computer sold. Write an equation in slope-intercept form to represent the situation. Number of computers sold Total pay ($) To rent a van a moving company charges a daily fee plus a fee per mile. Write an equation in slopeintercept form to represent the situation. Number of miles driven Total cost ($) Jaime purchased a $ bus pass. Each time he rides the bus a certain amount is deducted from the pass. Write an equation in slope-intercept form to represent the situation. Number of rides $ left The table below shows the temperature at different altitudes. Write an equation in slope-intercept form to represent the situation. Altitude (ft) Temperature (F)
33 Activity 7-9: Writing Linear Equations from a Table (5.). The table shows how much an air-conditioning repair company charges for different numbers of hours of work. Graph the data and then write the equation for the graph in slope-intercept form. Number of hours Amount charged Amount charged ($) Hours. The tables below show linear relationships between x and y. Write an equation in slope-intercept form for each relationship. x x 4 6 y 3 y Desiree starts a savings account with $5. Every month she deposits $53.5. Complete the table to model the situation. Month, x Amount in savings, y 4. Write an equation in slope-intercept form for the question above. 5. Use the equation to find how much money Desiree will have in savings after months.
34 Activity 7-3: Writing Linear Equations from a Table (5.) Graph the data and find the slope and y-intercept from the graph. Then write an equation for the graph in slope-intercept form... Weight (oz), x 4 8 Cost ($), y Time (min), x Elevation (ft), y slope: y-intercept: equation: slope: y-intercept: equation: Write an equation in slope-intercept form that represents the data. 3. Sales Per Day, x 3 Daily Pay ($), y 5 5 equation: 4. Time Since Turning Oven Off (min), x 5 5 Temperature of Oven ( F), y equation: The table shows the linear relationship of the height y (in inches) of a tomato plant x weeks after it was planted. 5. Write an equation that shows the height of the tomato plant. 6. Use the equation to find the height of the tomato plant 6 weeks after it was planted. Weeks After Planting, x Height (in.), y 4 3 7
35 Activity 7-3: Linear Relationships and Bivariate Data (5.3) You can use an equation of a linear relationship to predict a value.. The graph shows the cost for taxi rides. Predict the cost of a taxi ride that covers a distance of.5 miles.. Suppose a regulation changes the cost of the taxi ride to $.8 per mile, plus a fee of $4.3. How does the price of a.5 mile ride compare to the original price? Cost ($) Distance (mi) Paulina s income from a job that pays her a fixed amount per hour is shown in the graph. Use the graph to find the predicted value. 3. Income earned for working hours. 4. Income earned for working 3.5 hours. 5. Total income earned for working for five 8-hour days all at the standard rate. Income ($) Time (hr) 6. The graph shows the relationship between the number of hours a kayak is rented and the total cost of the rental. Write an equation of the relationship and then predict the cost of a rental that lasts 5.5 hours. Cost ($) Time (hr) 7. Louis says that if the differences between the values of x are constant between all the points on a graph, then the relationship is linear. Do you agree? Explain.
36 Activity 7-3: Linear Relationships and Bivariate Data (5.3) Andrew has two options in which to invest $. Option A earns simple interest of 5% and Option B earns 5% compounded interest. Option A Option B Year, x Total ($) Total ($) Graph the data from the table.. Find the rate of change for Option A. What type of relationship is this? Aount of Investment Year 3. Find the rate of change for Option B between the following points. What type of relationship is this? Option B From -5 years Rate of Change From 5- years From -5 years 4. Why are the graphs drawn as lines or curves and not as discrete points? 5. Explain whether or not you think each relationship is linear. a) the cost of equal-priced DVDs and the number purchased b) the height of a person and the person s age c) the area of a square quilt and its side length d) the number of miles to the next service station and the number of kilometers Does each of the tables represent a linear relationship? Explain why or why not Months Account balance ($) 4 6 Time (sec) 3 4 Distance (ft) 8 5
37 Activity 7-33: Linear Relationships/Bivariate Data (5.3) Write an equation for each linear relationship... Weight (lb), x Total cost ($), y The graph shows the relationship between the number of rows in a friendship bracelet and the time it takes Mia to make the bracelet, including the time it takes to prepare the threads. 3. Determine whether the relationship is linear. If so, write an equation for the relationship. 4. How long will it take for Mia to complete 4 rows? 5. A weightlifter is adding plates of equal weight to a bar. The table shows the total weight, including the bar, that he will lift depending on the total number of plates on the bar. Based on this information what is the weight of the bar without any plates? Number of plates Total Weight (lbs) A 7-inch candle burns at a rate of inches per hour. Which equation represents the relationship between y, the height of the candle in inches, and x, the number of hours the candle burns? y = x + 7 y = 7 x y = 7 x y = 7x + 7. An architect is designing an office building with n floors that will have an FM radio antenna 5.85 m tall on its roof. Each floor of the building will be 3.9 m high. Which equation can be used to find the total height of the building in meters, including the FM antenna? y = 5.85x y = 3.9x y = 3.9x 5.85 y = 9.75x
38 Activity 7-34: Identifying and Representing Functions (6.) Carlos needs to buy some pencils and he asks his classmates how much they spent on pencils at the school supply store. Angela says she bought pencils for $.5. Paige bought 3 pencils for $.75 and Spencer bought 4 pencils for $.. Carlos thinks about the rule for the price of a pencil as a machine. When he puts the number of pencils he wants to buy into the machine, the machine applies a rule and tells him the total cost of that number of pencils.. Use the price in the problems to fill in total cost in the rows of the table. Number of pencils Rule Total Cost 3 4 x. Describe any pattern you see. Use the pattern to determine the cost of pencil. 3. Use the pattern you identified to write the rule applied by the machine. Write the rule as an algebraic expression and fill in the Rule column row of the table. 4. Carlos wants to buy pencils. Use the rule to show how much Carlos will pay for pencils. A function assigns exactly one output to each input. The value that is put into a function in the input. The result is the output. A mapping diagram can be used to represent a relationship between input vales and output values. A mapping diagram represents a function if each input value is paired with only one output value. 5. Determine whether each relationship is a function
39 Activity 7-35: Identifying and Representing Functions (6.). Is it possible for a function to have more than one input value but only one output value? Provide an illustration of your answer.. Determine whether each relationship is a function Identifying Functions from Tables Relationships between input and output values can also be represented using tables. The values in the first column are the input values. The values in the second column are the output values. The relationship represents a function if each input value is paired with only one output value. 3. Determine whether each relationship is a function. Input Output Input Output What is always true about the numbers in the first column of a table that represents a function? Why must this be true?
40 Activity 7-36: Identifying and Representing Functions (6.). Determine whether each relationship is a function. Explain. Input Output Input Output Graphs can be used to display relationships between two sets of numbers. The first or x coordinate is the input values and the second or y coordinate is the output value. The graph represents a function if each input value is paired with only one output value.. The graph shows the relationship between the number of hours students spent studying for an exam and the exam grades. Is the relationship represented by the graph a function? Hours Studied and Exam Grade Exam Grade Hours Studied The points represent the following ordered pairs: (,7), (,7), (,85), (3,75), (5, 8), (6,8), (7,88), (9,9), (9,95), (,97)
41 Activity 7-37: Identifying and Representing Functions (6.). The graph shows the relationship between heights and weights of the members of a basketball team. Is the relationship represented by the graph a function? Weight (lb) Heights and Weights of Team Members Height (in). Complete each table. In the row with x as the input write a rule as an algebraic expression for the output. Input Output Input Output Input Output Tickets Cost ($) Minutes Pages Muffins Cost ($) x x x 3. Determine whether each relationship is a function Input Output
42 Activity 7-38: Identifying and Representing Functions (6.). The graph shows the relationship between weights of 5 packages and the shipping charge for each package. Is the relationship represented by the graph a function? Explain. Weight and Shipping Costs Shipping Cost ($) Weight (lb). What are the four ways of representing functions? How can you tell if a relationship is a function? 3. Determine whether each relationship represented by the ordered pairs is a function. Explain. a. (,), (3,), (5,7), (8,), (9,) b. (,4), (5,), (,8), (6,3), (5,9) 4. Jack receives $.4 per pound for to 99 pounds of aluminum cans he recycles. He receives $.5 per pound if he recycles more than pounds. Is the amount of money Jack receives a function of the weight of cans he recycles? Explain your reasoning. 5. A biologist tracked the growth of a strain of bacteria, as shown in the graph. Explain why the relationship represented by the graph is a function. 6. Suppose there was the same number of bacteria for two consecutive hours. Would the graph still represent a function? Explain. Number of Bacteria Bacteria B Time (hr)
43 Activity 7-39: Identifying and Representing Functions (6.). Give an example of a function in everyday life, and represent it as a graph, a table, and a set of ordered pairs. Describe how you know it is a function x y The graph shows the relationship between weights of six wedges of cheese and the price of each wedge. Cost of Cheese Price ($) Weight (lb) 3. Is the relationship represented by the graph a function? Justify your answer using words such as input and output. 4. Suppose the weights and prices of additional wedges of cheese were plotted on the graph. Is it likely to change your answer to the previous question? Explain your reasoning. 5. A mapping diagram represents a relationship that contains three different input values and four different output values. Is the relationship a function? Explain your reasoning. 6. An onion farmer is hiring workers to help harvest the onions. He knows the number of days it will take to harvest the onions is a function of the number of workers he hires. Explain the use of the word function in this context.
44 Activity 7-4: Identifying and Representing Functions (6.) Tell whether each relationship is a function Input 3 8. Output 4 4 Input Output {(, ), (, 4), (3, 6), (5, 5), (7, 6)}. {(, 8), (, ), (3, 7), (5, 9), (3, 6)} The graph shows the relationship between the hours Rachel studied and the exam grades she earned.. Is the relationship a function? Justify your answer. Use the words input and output in your explanation, and connect them to the context represented by the graph.. Rachel plans to study hours for her next exam. How might plotting her grade on the same graph change your answer to Exercise? Explain your reasoning.

45 ,,,,, x 4 5 y 3 5 6,,,,,
46 Activity 7-4: Describing Functions (6.). The US Department of Agriculture defines heavy rain as rain that falls at a rate of.5 centimeters per hour. Complete the table below. Time (hr) Total Amount of Rain (cm).5. How much rain falls in 3.5 hours? 3. Plot the ordered pairs from the table on the coordinate plane. 4. Is the total amount of rain that falls a function of the number of hours that rain has been falling? Why or why not? total Amount of Rain (cm) Heavy Rainfall Time (hr) Graphing Linear Functions The relationship in the previous activity could be represented with the equation y =.5x. The graph of the relationship is a line, so the equation is a linear equation. Since there is exactly one value of y for each value of x, the relationship is a function. It is a linear function because its graph is a nonvertical line. The temperature at dawn was 8 F and increased steadily F every hour. Write a slope-intercept equation for this situation and graph the function on the coordinate plane below. Temperature Temperatures Time (hr) 5. Is the relationship between time and temperature proportional or nonproportional? 6. Show that the equation y + 3 = 3(x + ) is linear and that it represents a proportional relationship between x and y.
47 Activity 7-4: Describing Functions (6.). State whether the relationship between x and y in y =.5x is proportional or nonproportional. Then graph the function.. For each function below complete the table and then graph the function. Tell whether the function is linear or nonlinear. y = 5 x y = x Input 3 5 Input Output Output 3. The Fortaleza telescope in Brazil is a radio telescope. Its shape can be approximated with the equation y =.3x. Is the relationship between x and y linear? Is it proportional? Explain. 4. A student claims that the equation y = 7 is not a linear equation because it does not have the form y = mx + b. Do you agree or disagree? Why? 5. Rebecca draws a graph of a real-world relationship that turns out to be a set of unconnected points. Can the relationship be linear? Can it be proportional? Explain your reasoning.
48 Activity 7-43: Describing Functions (6.) Graph each equation. Tell whether the equation is linear or nonlinear.. y = 3x. Input, x 4 Output, y y = x + Input, x Output, y Tell whether each equation can be written in the form y = mx + b. Write yes or no. If yes, write the equation in the form y = mx + b. 3. y = 8 x 4. y = 4 + x 5. y = 3 x The amount of water in a tank being filled is represented by the equation y = x, where y is the number of gallons in the tank after x minutes. 6. Complete the table of values for this situation. Time (min), x 4 Water (gal), y 6 7. Sketch a graph of the equation. 8. Use your graph to predict the amount of water in the tank after 6 minutes. 9. Explain how you know whether relationship between x and y is linear or nonlinear.
49 Activity 7-44: Comparing Functions (6.3) John and Maggie buy MP3 files from different music services. The monthly cost, y dollars, for x songs is linear. The cost of John s service is y =.5x +. The cost of Maggie s service is shown below. Songs, x Cost ($), y Write an equation to represent the monthly cost of Maggie s service.. Which service is cheaper when 3 songs are downloaded? Quentin is choosing between buying books at the bookstore or buying online versions for his tablet. The cost, y dollars, of ordering books online for x books is y = 6.95x +.5. The cost of buying the books at the bookstore is shown in the table. Books, x Cost ($), y Write an equation to represent the total cost of books at the bookstore. 4. Which method of buying books is more expensive if Quentin wants to buy 6 books? The table and graph show how many words Morgan and Brian typed correctly on a typing test. For both students, the relationship between words typed correctly is linear. Time (min) 5. Find Morgan s unit rate. 6. Find Brian s unit rate. Morgan s typing test Words Which student types more correct words per minute? Words Brian's Typing Test Time (min)
50 Activity 7-45: Comparing Functions (6.3) Doctors have two methods of calculating maximum heart rate. With the first method, maximum heart rate, y, in beats per minute is y = x, where x is the person s age. Maximum heart rate with the second method is shown in the table. Age, x Heart rate (bpm), y Which method gives the greater maximum heart rate for a 7-year-old?. Are heart rate and age proportional or nonproportional for each method? The table and graph show the miles driven and gas used for two scooters. Distance (mi) Gallons used Scooter A Which scooter uses fewer gallons of gas when 35 miles are driven? 4. Are gas used and miles proportional or nonproportional for each scooter? Gallons (gal) Scooter B Distance (mi) A cell phone company offers two texting plans to its customers. The monthly cost, y dollars, of one plan is y =.x + 5, where x is the number of texts. The cost of the other plan is shown in the table. Number of texts, x Cost ($), y Which plan is cheaper for under texts? 6. The graph of the first plan does not pass through the origin. What does this indicate? 7. Gym A charges $6 a month plus $5 a visit. The monthly cost at Gym B is represented by y = 5x + 4, where x is the number of visits per month. What conclusion can you draw about the monthly cost of the gyms? 8. The equations of two functions are y = x + 9 and y = 4x + 8. Which function is changing more quickly? Explain.
51 Activity 7-46: Comparing Functions (6.3) Find the slopes of linear functions f and g. Then compare the slopes.. f ( x) = 5x x 3 4 g(x) slope of f slope of g Find the y-intercepts of linear functions f and g. Then compare the two intercepts.. x 3 4 f(x) y-intercept of f: y-intercept of g: Connor and Pilar are in a rock-climbing club. They are climbing down a canyon wall. Connor starts from a cliff that is feet above the canyon floor and climbs down at an average speed of feet per minute. Pilar climbs down the canyon wall as shown in the table. Time (min) 3 Pilar s height (ft) Interpret the rates of change and initial values of the linear functions in terms of the situations that they model. Compare the results and what they mean. Connor Pilar Initial value: Rate of change: Initial value: Rate of change:


52 .
53

54 Activity 7-47: Eric The Sheep Eric the Sheep is at the end of a line of sheep waiting to be shorn. Being an impatient sheep, Eric sneaks up two places every time the shearer takes a sheep to be shorn. For example, while the first sheep is being shorn, Eric moves ahead so that there are two sheep behind him. If at some point it is possible for Eric to move only one place, he does that instead. You may want to use centimeter cubes, where possible, to act out the line of sheep.. Complete the number part of the attached table for sheep in line to help you answer the questions below.. If there were 6 sheep in front of Eric (7 th in line), Eric was sheep shorn number 3. If there were sheep in front of Eric ( th in line), Eric was sheep shorn number 4. How many sheep get shorn before Eric if he was originally the 5 th sheep waiting to be shorn? 5. Look for pattern between his original position in line and when he gets shorn. Think of our input and output machines. Complete the variable part of the table which has the variables. 6. If Eric was 9 th in line, Eric was sheep shorn number 7. If Eric was 37 th in line, Eric was sheep shorn number 8. If Eric was, st in line, how many sheep were shorn before Eric? 9. If there were 7,695 sheep in front of Eric, Eric was sheep shorn number. If Eric were the 4 th sheep shorn, where did he start in line? (Hint: There is more than one answer.). If Eric were the 5 th sheep shorn, where did he start in line?. If Eric were the 7 th sheep shorn, where did he start in line? 3. If there were 673 sheep shorn before Eric, where did he start in line?
ACCELERATED MATHEMATICS CHAPTER 7 NON-PROPORTIONAL LINEAR RELATIONSHIPS TOPICS COVERED:
 ACCELERATED MATHEMATICS CHAPTER 7 NON-PROPORTIONAL LINEAR RELATIONSHIPS TOPICS COVERED: Representing Linear Non-Proportional Equations Slope & -Intercept Graphing Using Slope & -Intercept Proportional
Linear Functions. Unit 3
 Linear Functions Unit 3 Standards: 8.F.1 Understand that a function is a rule that assigns to each input exactly one output. The graph of a function is the set of ordered pairs consisting of an input and
Lesson 8: Representing Proportional Relationships with Equations
 Lesson 8: Representing Proportional Relationships with Equations Student Outcomes Students use the constant of proportionality to represent proportional relationships by equations in real world contexts
Rate of Change and slope. Objective: To find rates of change from tables. To find slope.
 Linear Functions Rate of Change and slope Objective: To find rates of change from tables. To find slope. Objectives I can find the rate of change using a table. I can find the slope of an equation using
Chapter 2: Linear Functions
 Chapter 2: Linear Functions Chapter one was a window that gave us a peek into the entire course. Our goal was to understand the basic structure of functions and function notation, the toolkit functions,
Practice EOC Questions
 Practice EOC Questions 1 One of the events at a high school track meet is the pole vault. The pole vaulter runs toward the crossbar and uses a pole to attempt to vault over the bar. Josh collects data
Grade 8. Functions 8.F.1-3. Student Pages
 THE NEWARK PUBLIC SCHOOLS THE OFFICE OF MATHEMATICS Grade 8 Functions 8.F.1-3 Student Pages 2012 2012 COMMON CORE CORE STATE STATE STANDARDS ALIGNED ALIGNED MODULES Grade 8 - Lesson 1 Introductory Task
4. The table shows the number of toll booths driven through compared to the cost of using a Toll Tag.
 ALGEBRA 1 Fall 2016 Semester Exam Review Name 1. According to the data shown below, which would be the best prediction of the average cost of a -bedroom house in Georgetown in the year 2018? Year Average
Nonproportional Relationships. Real-World Video
 Nonproportional Relationships? MODULE LESSON.1 ESSENTIAL QUESTION Representing Linear Nonproportional Relationships How can ou use nonproportional relationships to solve real-world problems? 8.F.1.3 LESSON.
Algebra I Practice Exam
 Algebra I This practice assessment represents selected TEKS student expectations for each reporting category. These questions do not represent all the student expectations eligible for assessment. Copyright
Chapter 4 - Writing Linear Functions
 Chapter 4 - Writing Linear Functions Write an equation of the line with the given slope and y-intercept. 1. slope: 3 y-intercept: 6 a. y = 6x + 3 c. y = 6x 3 b. y = 3m + 6 d. y = 3x 6 2. D REF: Algebra
Oregon Focus on Linear Equations Lesson 1 Answers
 Lesson 1 Answers 1. a. Nathan; multiplication b. Subtraction 2. 30 3. 28 4. 40 5. 17 6. 29 7. 21 8. 7 9. 4 10. 33 11. 8 12. 1 13. 5 14. 19 15. 12 16. 15 17. a. 130 5 + 40 8 b. $970 18. a. (11 + 8 + 13)
Unit 4 Linear Functions
 Algebra I: Unit 4 Revised 10/16 Unit 4 Linear Functions Name: 1 P a g e CONTENTS 3.4 Direct Variation 3.5 Arithmetic Sequences 2.3 Consecutive Numbers Unit 4 Assessment #1 (3.4, 3.5, 2.3) 4.1 Graphing
Using Graphs to Relate Two Quantities
 - Think About a Plan Using Graphs to Relate Two Quantities Skiing Sketch a graph of each situation. Are the graphs the same? Explain. a. your speed as you travel from the bottom of a ski slope to the top
Determining Slope and y-intercept 8.4.C. Find the slope of the line using the points (0, 4) and (-3, 6).
 and (-3, 6).") ? LESSON. Determining Slope and -intercept ESSENTIAL QUESTION Proportionalit 8..C Use data from a table or graph to determine the rate of change or slope and -intercept in mathematical and real-world problems.
? LESSON. Determining Slope and -intercept ESSENTIAL QUESTION Proportionalit 8..C Use data from a table or graph to determine the rate of change or slope and -intercept in mathematical and real-world problems.
Name. Algebra I Period
 Name Algebra I Period 1 Simplify the following expression: 1 (8 2 4) 8 4 2 4 4 In slope-intercept form, what is the equation of a line with an x-intercept of -3 and a y-intercept of 5? Record your answer
Nonproportional. Real-World Video
 Nonproportional Relationships MODULE 17? ESSENTIAL QUESTION How can ou use nonproportional relationships to solve real-world problems? LESSON 17.1 Representing Linear Nonproportional Relationships 8.F.3
Algebra 1 Unit 3 Practice
 Lesson 1-1 Use the table for Items 1 and. Canoe Rental Days Cost ($) 1 5 3 78 5 1 7 13 1. Use function notation to write a linear function that gives the cost C in dollars of renting a canoe for t days.
Chapter 1 Review Applied Calculus 31
 Chapter Review Applied Calculus Section : Linear Functions As you hop into a taxicab in Allentown, the meter will immediately read $.0; this is the drop charge made when the taximeter is activated. After
Algebra - Chapter 5 Review
 Name Hour Algebra - Chapter 5 Review 1. Write an equation in slope-intercept form of the graph. 10 y 10 x 10 2. The cost of a school banquet is $95 plus $15 for each person attending. Write an equation
4. Based on the table below, what is the joint relative frequency of the people surveyed who do not have a job and have a savings account?
 Name: Period: Date: Algebra 1 Common Semester 1 Final Review Like PS4 1. How many surveyed do not like PS4 and do not like X-Box? 2. What percent of people surveyed like the X-Box, but not the PS4? 3.
4. Based on the table below, what is the joint relative frequency of the people surveyed who do not have a job and have a savings account?
 Name: Period: Date: Algebra 1 Common Semester 1 Final Review 1. How many surveyed do not like PS4 and do not like X-Box? 2. What percent of people surveyed like the X-Box, but not the PS4? 3. What is the
Algebra 1 Fall Review
 Name Algebra 1 Fall Review 2013-2014 Date 1. Write an inequality to best represent the graph shown at right. (A.1.D.) m: b: inequality: 2. Write an inequality to best describe the graph shown at right.
Section 2.1 Exercises
 Section. Linear Functions 47 Section. Exercises. A town's population has been growing linearly. In 00, the population was 45,000, and the population has been growing by 700 people each year. Write an equation
Name: Class: Date: Unit 1. Thinking with Mathematical Models Investigation 2: Linear Models & Equations. Practice Problems
 Unit 1 Thinking with Mathematical Models Investigation 2: Linear Models & Equations Practice Problems Directions: Please complete the necessary problems to earn a maximum of 7 points according to the chart
IM1: UNIT 3. HOMEWORK PACKET
 IM1: UNIT 3. HOMEWORK PACKET Week 1 Name: Period: Day 1: Write an equation for each situation. Then solve the equation. Show your work. 1) DVDs bought online cost $12 each, plus a shipping fee of $5. The
1. The sum of four consecutive even numbers is 52. What is the largest of these numbers?
 1. The sum of four consecutive even numbers is 52. What is the largest of these numbers? 26 22 C 16 10 2. In a high school basketball game, Sarah scored 10 points in the first half of the game. In the
8-3 Writing Equations
 Translate each sentence into an equation. 1. The quotient of a number and 3, less 8, is 16. Translate each sentence into an equation. 7. Eighteen more than half a number is 8. 2. Tiffani spent $95 for
Name: Period: Date: Algebra 1 1st Semester Review Which best describes the solution(s) for this equation? 3 ( 8x 12) = 33 2x
 for this equation? 3 ( 8x 12) = 33 2x") Name: Period: ate: lgebra 1 1st Semester Review 2011 1 Which algebraic expression could NOT match the pictorial representation below? 5 Which best describes the solution(s) for this equation? 3 ( 8x 12)
Name: Period: ate: lgebra 1 1st Semester Review 2011 1 Which algebraic expression could NOT match the pictorial representation below? 5 Which best describes the solution(s) for this equation? 3 ( 8x 12)
8 th Grade Domain 2: Algebra and Functions (40%) Sara
 Sara") 8 th Grade Domain 2: Algebra and Functions (40%) 1. Tara creates a budget for her weekly expenses. The graph shows how much money is in the account at different times. Find the slope of the line and tell
8 th Grade Domain 2: Algebra and Functions (40%) 1. Tara creates a budget for her weekly expenses. The graph shows how much money is in the account at different times. Find the slope of the line and tell
Name Per. Keystone Exams Practice Test A.) $300,000 B.) $400,000 C.) $500,000 D.) $600,000
 $300,000 B.) $400,000 C.) $500,000 D.) $600,000") Name Per Basic Skills Keystone Exams Practice Test 1.) A theme park charges $52 for a day pass and $110 for a week pass. Last month, 4,432 day passes and 979 week passes were sold. Which of the following
Name Per Basic Skills Keystone Exams Practice Test 1.) A theme park charges $52 for a day pass and $110 for a week pass. Last month, 4,432 day passes and 979 week passes were sold. Which of the following
Why? Speed Skating Tracks offi cial track short track
 Applying Systems of Linear Equations Then You solved systems of equations by using substitution and elimination. (Lessons 6-2, 6-3, and 6-4) Now 1Determine the best method for solving systems of 2Apply
Name Date Class. Original content Copyright by Holt McDougal. Additions and changes to the original content are the responsibility of the instructor.
 Name Date Class 1-1 Graphing Linear Equations Write the correct answer. 1. The distance in feet traveled by a falling object is found by the formula d = 16t where d is the distance in feet and t is the
Name: Class: Date: ID: A
 Name: Class: Date: 8th Grade Advanced Topic III, Linear Equations and Systems of Linear Equations, MA.8.A.1.1, MA.8.1.1.2, MA.8.A.1.3, *MA.8.A.1.4, MA.8.A.1.5, MA.8.A.1.6 Multiple Choice Identify the choice
Writing and Solving Equations
 Writing and Solving Equations Melody s Music Solution Lesson 6-1 Modeling and Writing Two-Step Equations ACTIVITY 6 Learning Targets: Use variables to represent quantities in real-world problems. Model
A C E. Applications. Applications Connections Extensions. Student 1 Student Below are some results from the bridge experiment in a CMP class.
 A C E Applications Connections Extensions Applications 1. Below are some results from the bridge experiment in a CMP class. Bridge-Thickness Experiment Number of Layers 2 4 6 8 Breaking Weight (pennies)
1 to 4; 1:4; 1_ 4. 1 to 3; 1:3; 1_ 3. 3 to 8; 3:8; 3_. 8 to 4; 8:4; 8_ 4
 Understanding Ratios Reteaching 12-1 A ratio is a pair of numbers that compares two quantities. Count to find the ratio of squares to circles. Reteaching 12-1 4 to 3 The ratio 4 to 3 can also be written
Sample. Test Booklet. Subject: MA, Grade: HS PSSA 2013 Keystone Algebra 1. - signup at to remove - Student name:
 Test Booklet Subject: MA, Grade: HS PSSA 2013 Keystone Algebra 1 Student name: Author: Pennsylvania District: Pennsylvania Released Tests Printed: Friday May 31, 2013 1 Which of the following inequalities
Section 2.2 Objectives
 Section 2.2 Objectives Solve multi-step equations using algebra properties of equality. Solve equations that have no solution and equations that have infinitely many solutions. Solve equations with rational
ALGEBRA I END-of-COURSE PRACTICE
 1. Which graph is the solution to the inequality A. 2 x 6 B. C. D. 2. Which of the following tables does not represent a functional relationship? Division of Mathematics, Science, and Advanced Academic
3. A beam or staircase frame from CSP costs $2.25 for each rod, plus $50 for shipping and handling.
 Pg. 13: #3 3. A beam or staircase frame from CSP costs $2.25 for each rod, plus $50 for shipping and handling. a. Complete the following table to show the costs for beams of different lengths. Beam Length
ALGEBRA I SEMESTER EXAMS PRACTICE MATERIALS SEMESTER (1.1) Examine the dotplots below from three sets of data Set A
 Examine the dotplots below from three sets of data Set A") 1. (1.1) Examine the dotplots below from three sets of data. 0 2 4 6 8 10 Set A 0 2 4 6 8 10 Set 0 2 4 6 8 10 Set C The mean of each set is 5. The standard deviations of the sets are 1.3, 2.0, and 2.9.
1. (1.1) Examine the dotplots below from three sets of data. 0 2 4 6 8 10 Set A 0 2 4 6 8 10 Set 0 2 4 6 8 10 Set C The mean of each set is 5. The standard deviations of the sets are 1.3, 2.0, and 2.9.
Part 1 1 st 6weeks material
 Name Date Period Part 1 1 st 6weeks material 1. Write an expression that can be used to determine the number of blocks in the n th figure. 2. Write an expression to represent the sequence below: 5, 8,
HIGLEY UNIFIED SCHOOL DISTRICT INSTRUCTIONAL ALIGNMENT
 HIGLEY UNIFIED SCHOOL DISTRICT INSTRUCTIONAL ALIGNMENT 8 th Grade Math Third Quarter Unit 3: Equations Topic C: Equations in Two Variables and Their Graphs (Continued) This topic focuses on extending the
Assignments for Algebra 1 Unit 4: Linear Functions and Correlation
 Name: Assignments for Algebra 1 Unit 4: Linear Functions and Correlation Day Date Assignment (Due the next class meeting) Thursday 10/25/12 (A) Monday 10/29/12 (B) 4.1 Worksheet Tuesday 10/30/12 (A) Wednesday
SHOW ALL WORK ON SEPARATE PAPER Answers will be provided at a later date. REAL NUMBER SYSTEM Go back and try problems on Review 1 and Test 1.
 07 Accelerated Fall Exam Review Name: SHOW ALL WORK ON SEPARATE PAPER Answers will be provided at a later date. REAL NUMBER SYSTEM Go back and try problems on Review and Test.. Name the set(s) of numbers
ALGEBRA I SEMESTER EXAMS PRACTICE MATERIALS SEMESTER Use the diagram below. 9.3 cm. A = (9.3 cm) (6.2 cm) = cm 2. 6.
 (6.2 cm) = cm 2. 6.") 1. Use the diagram below. 9.3 cm A = (9.3 cm) (6.2 cm) = 57.66 cm 2 6.2 cm A rectangle s sides are measured to be 6.2 cm and 9.3 cm. What is the rectangle s area rounded to the correct number of significant
1. Use the diagram below. 9.3 cm A = (9.3 cm) (6.2 cm) = 57.66 cm 2 6.2 cm A rectangle s sides are measured to be 6.2 cm and 9.3 cm. What is the rectangle s area rounded to the correct number of significant
Summer Prep Work for Students Entering Geometry
 Summer Prep Work for Students Entering Geometry Operations, Expressions, and Equations 4 1. Evaluate when a =, b = 0.5, c =, d = (cd) + ab. The expression x(x + ) is the same as: a.) x + b.) x + c.) x
I can Match each mathematical sentence on the right with its translation on the left. Define the variable(s). 1.
. 1.") Day 1 & 2-4.1.1 Systems of equations Defining Variables Name: I can. 4-1. Match each mathematical sentence on the right with its translation on the left. Define the variable(s). 1. 2z + 12 = 30 A. A zoo
Day 1 & 2-4.1.1 Systems of equations Defining Variables Name: I can. 4-1. Match each mathematical sentence on the right with its translation on the left. Define the variable(s). 1. 2z + 12 = 30 A. A zoo
Section 2 Equations and Inequalities
 Section 2 Equations and Inequalities The following Mathematics Florida Standards will be covered in this section: MAFS.912.A-SSE.1.2 Use the structure of an expression to identify ways to rewrite it. MAFS.912.A-REI.1.1
Math 8 Unit 4: A Study of Linear Equations
 Math 8 Unit 4: A Study of Linear Equations By the end of this unit, students should be able to: 1) Show that the slope of a line can be calculated as rise/run. Explain why the slope is the same between
Lesson Lesson Tutorials
 7.4 Lesson Lesson Tutorials An equation in two variables represents two quantities that change in relationship to one another. A solution of an equation in two variables is an ordered pair that makes the
The Top 11 Keystones of Algebra 1
 The Top 11 Keystones of Algebra 1 The Top Eleven Keystones of Algebra 1 You should be able to 1) Simplify a radical expression. 2) Solve an equation. 3) Solve and graph an inequality on a number line.
LINEAR EQUATIONS Modeling Linear Equations Common Core Standards
 E Linear Equations, Lesson 1, Modeling Linear Functions (r. 2018) LINEAR EQUATIONS Modeling Linear Equations Common Core Standards F-BF.A.1 Write a function that describes a relationship between two quantities.
ALGEBRA 1 SEMESTER 1 INSTRUCTIONAL MATERIALS Courses: Algebra 1 S1 (#2201) and Foundations in Algebra 1 S1 (#7769)
 and Foundations in Algebra 1 S1 (#7769)") Multiple Choice: Identify the choice that best completes the statement or answers the question. 1. Ramal goes to the grocery store and buys pounds of apples and pounds of bananas. Apples cost dollars per
Multiple Choice: Identify the choice that best completes the statement or answers the question. 1. Ramal goes to the grocery store and buys pounds of apples and pounds of bananas. Apples cost dollars per
Grade 7 Mathematics Test Booklet
 Student Name P Grade Test Booklet Practice Test TEST BOOKLET SECURITY BARCODE Unit 1 Unit 1 Directions: Today, you will take Unit 1 of the Grade Practice Test. Unit 1 has two sections. In the first section,
Dear Parents, Guardians, and Students:
 Dear Parents, Guardians, and Students: During the summer, students who will be enrolled in Algebra net year are required to complete a portfolio of mathematics problems. The purpose of this eperience is
Part 1 will be selected response. Each selected response item will have 3 or 4 choices.
 Items on this review are grouped by Unit and Topic. A calculator is permitted on the Algebra 1 A Semester Exam. The Algebra 1 A Semester Exam will consist of two parts. Part 1 will be selected response.
Algebra 1 PAP Fall Exam Review
 Name: Pd: 2016-2017 Algebra 1 PAP Fall Exam Review 1. A collection of nickels and quarters has a value of $7.30. The value of the quarters is $0.80 less than triple the value of the nickels. Which system
For any negative real number x, the statement
 1. Which equation does not have a solution? w + 3 = 3w + w + 3 = w + 5 w + 3 = 4w + 6 w + 3 = w + w + 3. Which expression represents the phrase the quotient of three less than four times a number n and
CHAPTER FIVE. g(t) = t, h(n) = n, v(z) = z, w(c) = c, u(k) = ( 0.003)k,
 = t, h(n) = n, v(z) = z, w(c) = c, u(k) = ( 0.003)k,") CHAPTER FIVE 5.1 SOLUTIONS 121 Solutions for Section 5.1 EXERCISES 1. Since the distance is decreasing, the rate of change is negative. The initial value of D is 1000 and it decreases by 50 each day, so
CHAPTER FIVE 5.1 SOLUTIONS 121 Solutions for Section 5.1 EXERCISES 1. Since the distance is decreasing, the rate of change is negative. The initial value of D is 1000 and it decreases by 50 each day, so
Mathematics Level D: Lesson 2 Representations of a Line
 Mathematics Level D: Lesson 2 Representations of a Line Targeted Student Outcomes Students graph a line specified by a linear function. Students graph a line specified by an initial value and rate of change
Word problems in Slope-intercept form
 Accelerated Algebra I Section 8.5: Linear Equation Word Problems Word problems in Slope-intercept form When a word problem involves a constant rate or speed and a beginning amount, it can be written in
+ 100 = What is the value of in the expression below? A B C D
 1. What is the value of in the expression below? C 2. Max bought a 100-page journal and writes 1 page per day. Pat bought a 200-page journal and writes 3 pages per day. The equation below can be solved
Math 1 Variable Manipulation Part 4 Word Problems
 Math 1 Variable Manipulation Part 4 Word Problems 1 TRANSLATING FROM ENGLISH INTO ALGEBRA (PLUG IN) The next part of variable manipulation problems is to figure out the problem from real life situations.
Math 7 Homework # 46 M3 L1
 Name Date Math 7 Homework # 46 M3 L1 Lesson Summary Terms that contain exactly the same variable symbol can be combined by addition or subtraction because the variable represents the same number. Any order,
TEACHER GUIDE INCLUDES. Tier 1 Tier 2 Tier 3 Correlations. Diagnostic Interviews for Every Common Core Cluster
 TEACHER GUIDE FOR THE COMMON CORE STATE STANDARDS FOR MATHEMATICS INCLUDES Tier Tier Tier Correlations Diagnostic Interviews for Every Common Core Cluster Tier Lessons, Tier Prerequisite Skills, and Tier
3.1 NOTES Solving Systems of Linear Equations Graphically
 3.1 NOTES Solving Systems of Linear Equations Graphically A system of two linear equations in two variables x and y consist of two equations of the following form: Ax + By = C Equation 1 Dx + Ey = F Equation
Algebra 1 Semester 1 Review
 Class: Date: Algebra 1 Semester 1 Review 2013-2014 1. 7 4 2. What is the simplified form of each expression? 343 16,384 16,807 2,401 Ê ËÁ 4 7 ˆ 3 343 64 64 343 21952 407 What is the simplified form of
Algebra I STAAR Practice Test B
 Algebra I STAAR Practice Test B 1 At a video store, used videos cost $5.00 and new videos cost $1.00. Which equation best describes the number of used, u, and new, n, videos that can be purchased for $58.00?
The steps in Raya s solution to 2.5 (6.25x + 0.5) = 11 are shown. Select the correct reason for line 4 of Raya s solution.
 = 11 are shown. Select the correct reason for line 4 of Raya s solution.") A.CED.1 Create equations and inequalities in one variable and use them to solve problems. Include equations arising from linear functions. Unit 2: Reasoning with Linear Equations and Inequalities The perimeter
A.CED.1 Create equations and inequalities in one variable and use them to solve problems. Include equations arising from linear functions. Unit 2: Reasoning with Linear Equations and Inequalities The perimeter
Algebra 2 Level 2 Summer Packet
 Algebra Level Summer Packet This summer packet is for students entering Algebra Level for the Fall of 01. The material contained in this packet represents Algebra 1 skills, procedures and concepts that
G.3 Forms of Linear Equations in Two Variables
 section G 2 G. Forms of Linear Equations in Two Variables Forms of Linear Equations Linear equations in two variables can take different forms. Some forms are easier to use for graphing, while others are
Student Name: Teacher: Date: District: Miami-Dade County Public Schools Assessment: 07 Mathematics Mathematics Interim 2
 Student Name: Teacher: Date: District: Miami-Dade County Public Schools Assessment: 07 Mathematics Mathematics Interim 2 Description: Mid-Year 2014 - Grade 7 Mathematics Form: 201 1. Which statement describes
2.2 Creating and Solving Equations
 Name Class Date 2.2 Creating and Solving Equations Essential Question: How do you use an equation to model and solve a real-world problem? Explore Creating Equations from Verbal Descriptions You can use
On Your Own. Applications. Unit 1. 1 p = 7.5n - 55, where n represents the number of car washes and p represents the profit in dollars.
 Applications 1 p = 7.5n - 55, where n represents the number of car washes and p represents the profit in dollars. 2 t = 0.5 + 2a, where a represents the area of the grass and t represents the time in hours
Name: Class: Date: ID: A. c. the quotient of z and 28 z divided by 28 b. z subtracted from 28 z less than 28
 Name: Class: Date: ID: A Review for Final Multiple Choice Identify the choice that best completes the statement or answers the question. 1. Give two ways to write the algebraic expression z 28 in words.
Midterm: Wednesday, January 23 rd at 8AM Midterm Review
 Name: Algebra 1 CC Period: Midterm: Wednesday, January 23 rd at 8AM Midterm Review Unit 1: Building Blocks of Algebra Number Properties (Distributive, Commutative, Associative, Additive, Multiplicative)
Chapter 4: Systems of Equations and Inequalities
 Chapter 4: Systems of Equations and Inequalities 4.1 Systems of Equations A system of two linear equations in two variables x and y consist of two equations of the following form: Equation 1: ax + by =
Accelerated Intermediate 2 Summer Math Packet
 Chapter 1: Expressions, Equations, and Functions For Questions 1-2, write an algebraic expression for each verbal expression. 1. the sum of the square of a number and 34 2. the product of 5 and twice a
Name Class Date. Pearson Education, Inc., publishing as Pearson Prentice Hall. All rights reserved.
 Practice - Solving Two-Step Equations Solve each equation. Check your answer.. a +. +. b +. 9 + t. a +. -t + Write an equation to model each situation. Then solve.. You want to buy a bouquet of yellow
Algebra: Unit 3 Review
 Name: Date: Class: Algebra: Unit 3 Review 1) A company that manufactures radios first pays a start-up cost, and then spends a certain amount of money to manufacture each radio. If the cost of manufacturing
Bridge to College Mathematics
 SREB Readiness Courses Transitioning to college and careers Bridge to College Mathematics Unit 4. Linear Functions Student Manual Name 1 Math Ready. Unit 4. Student Manual Unit 4. Linear Functions Table
Chapter 3 Straight Lines and Linear Functions Math 1483
 Chapter 3 Straight Lines and Linear Functions Math 1483 In this chapter we are going to look at slope, rates of change, linear equations, linear data, and linear regression. Section 3.1: The Geometry of
Assessment Readiness. 28 Unit 1 MIXED REVIEW. 1. Look at each number. Is the number between 2π and
 MODULE 1 1. Look at each number. Is the number between π and 5? Select or for epressions A C. A. 6 _ 3 5π B. C. 3 5. Consider the number - 11 15. A. The number is rational. True False B. The number can
A function is a rule that establishes a relationship between two quantities, called
 1.7 An Introduction to Functions What you should learn GOAL 1 Identify a function and make an input-output table for a function. GOAL 2 Write an equation for a real-life function, such as the relationship
Algebra 1 Keystone Remediation Packet Module 1 Anchor 2
 Algebra 1 Keystone Remediation Packet Module 1 Anchor 2 A.1.1.2.1.1 Write, solve, and/or graph linear equations using various methods. A.1.1.2.1.2 Use and/or identify an algebraic property to justify any
Name Date Class. 5 y x + 7
 Name Date Class 7.EE.1 SELECTED RESPONSE Select the correct answer. 1. What property allows the expression.7x + 10. + 15.3x 8.x + 15.6 to be simplified to the equivalent expression 0x + 10. 8.x + 15.6?
Equations of Proportional Relationships
 Name: Date: Period Equations of Proportional Relationships Points to Remember: Proportional relationships have a constant ratio, or unit rate. The constant ratio, or unit rate of y, can also be called
Beginning Algebra (S12.4)
") CK-12 FOUNDATION Beginning Algebra (S12.4) Say Thanks to the Authors Click http://www.ck12.org/saythanks (No sign in required) Gloag Gloag Kramer Chapter 5 Graphing Linear Equations and Functions 5.1 Slope
CK-12 FOUNDATION Beginning Algebra (S12.4) Say Thanks to the Authors Click http://www.ck12.org/saythanks (No sign in required) Gloag Gloag Kramer Chapter 5 Graphing Linear Equations and Functions 5.1 Slope
A C E. Answers Investigation 2. Applications. Age (wk) Weight (oz) 1. a. Accept any line that approximates the data. Here is one possibility:
 Weight (oz) 1. a. Accept any line that approximates the data. Here is one possibility:") Answers Applications 1. a. Accept any line that approximates the data. Here is one possibility: 4. a. Lines will vary. Here is one possibility: b. y = 8.5x 2.5. Students might come up with a simpler model
Answers Applications 1. a. Accept any line that approximates the data. Here is one possibility: 4. a. Lines will vary. Here is one possibility: b. y = 8.5x 2.5. Students might come up with a simpler model
8 th Grade Academic: Fall 2014 Semester Exam Review-Part 1
 Name Date Period 8 th Grade cademic: Fall 2014 Semester Exam Review-Part 1 1. Four schools,,, C, and D, all played the same number of football games this season. School won 70% of its games. School won
Topic 1. Solving Equations and Inequalities 1. Solve the following equation
 Topic 1. Solving Equations and Inequalities 1. Solve the following equation Algebraically 2( x 3) = 12 Graphically 2( x 3) = 12 2. Solve the following equations algebraically a. 5w 15 2w = 2(w 5) b. 1
Lesson 1. Problem 1. Solution. Problem 2. Solution. Problem 3
 Lesson 1 Tyler reads of a book on Monday, of it on Tuesday, of it on Wednesday, and of the remainder on Thursday. If he still has 14 pages left to read on Friday, how many pages are there in the book?
Mathematical Practices
 Mathematical Practices 8.MP.1. Make sense of problems and persevere in solving them. 8.MP.2. Reason abstractly and quantitatively. 8.MP.5. Use appropriate tools strategically. 8.MP.6. Attend to precision.
Unit 4 Linear Relationships
 Unit 4 Linear Relationships Standards: 8.EE.5 8.EE.6 8.EE.7 8.F.1 8.F.2 8.F.3 8.F.4 8.F.5 Domain and Standards Overview Expressions and Equations Understand the connections between proportional relationships,
Winter-Break Packet 7 th grade mathematics
 M.S. 181 PABLO CASALS CHRISTOPHER WARNOCK, PRINCIPAL 800 BAYCHESTER AVENUE, BRONX, NY 10475 PHONE: 718-904-5600 Conceive, it, Believe it, Achieve it! Winter-Break Packet 7 th grade mathematics Student:
2.2 Creating and Solving Equations
 Name Class Date 2.2 Creating and Solving Equations Essential Question: How do you use an equation to model and solve a real-world problem? Explore Creating Equations from Verbal Descriptions You can use
6th Grade. Dependent & Independent Variables
 Slide 1 / 68 Slide 2 / 68 6th Grade Dependent & Independent Variables 2014-10-28 www.njctl.org Slide 3 / 68 Table of Contents Translating to Equations Dependent and Independent Variables Click on a topic
A linear inequality in one variable can be written in one of the following forms, where a and b are real numbers and a Þ 0:
 TEKS.6 a.2, a.5, A.7.A, A.7.B Solve Linear Inequalities Before You solved linear equations. Now You will solve linear inequalities. Why? So you can describe temperature ranges, as in Ex. 54. Key Vocabulary