Advances in Micromechanics Modeling of Composites. Structures for Structural Health Monitoring. Albert Moncada
|
|
|
- Della Harrell
- 6 years ago
- Views:
Transcription
1 Advances in Micromechanics Modeling of Composites Structures for Structural Health Monitoring by Albert Moncada A Dissertation Presented in Partial Fulfillment of the Requirements for the Degree Doctor of Philosophy Approved November 2012 by the Graduate Supervisory Committee: Aditi Chattopadhyay, Chair Lenore Dai Antonia Papandreou-Suppappola John Rajadas Masoud Yekani Fard ARIZONA STATE UNIVERSITY December 2012
2 ABSTRACT Although high performance, light-weight composites are increasingly being used in applications ranging from aircraft, rotorcraft, weapon systems and ground vehicles, the assurance of structural reliability remains a critical issue. In composites, damage is absorbed through various fracture processes, including fiber failure, matrix cracking and delamination. An important element in achieving reliable composite systems is a strong capability of assessing and inspecting physical damage of critical structural components. Installation of a robust Structural Health Monitoring (SHM) system would be very valuable in detecting the onset of composite failure. A number of major issues still require serious attention in connection with the research and development aspects of sensor-integrated reliable SHM systems for composite structures. In particular, the sensitivity of currently available sensor systems does not allow detection of micro level damage; this limits the capability of data driven SHM systems. As a fundamental layer in SHM, modeling can provide in-depth information on material and structural behavior for sensing and detection, as well as data for learning algorithms. This dissertation focusses on the development of a multiscale analysis framework, which is used to detect various forms of damage in complex composite structures. A generalized method of cells based micromechanics analysis, as implemented in NASA s MAC/GMC code, is used for the micro-level analysis. First, a baseline study of MAC/GMC is performed to determine the governing failure theories that best capture the damage progression. The i
3 deficiencies associated with various layups and loading conditions are addressed. In most micromechanics analysis, a representative unit cell (RUC) with a common fiber packing arrangement is used. The effect of variation in this arrangement within the RUC has been studied and results indicate this variation influences the macro-scale effective material properties and failure stresses. The developed model has been used to simulate impact damage in a composite beam and an airfoil structure. The model data was verified through active interrogation using piezoelectric sensors. The multiscale model was further extended to develop a coupled damage and wave attenuation model, which was used to study different damage states such as fiber-matrix debonding in composite structures with surface bonded piezoelectric sensors. ii
4 DEDICATION This dissertation is dedicated to my parents and my wife for the love and support that they have given to me. My parents instilled in me the work ethic needed to complete this doctorate. My wife kept me sane and on track. I love all of you so much. iii
5 ACKNOWLEDGMENTS First, I would like to thank my advisor Prof. Aditi Chattopadhyay for her guidance and support. She has provided me with invaluable knowledge that will be with me my entire professional career. I would also like to thank the members on my dissertation committee, Prof. Lenore Dai, Prof. Antonia Pappandreou- Suppappola, Prof. John Rajadas, and Dr. Masoud Yekani Fard. They have provided their time and guidance in helping me complete my dissertation. I would also like to thank my fellow graduate students for the help, support and most of all the laughs. Thanks for keeping our work environment fun. This made working all the long hours at school tolerable. I would also like to thank Kay Vasley, AIMS Center administrative assistant, for helping with all the little things that made traveling to conferences, ordering supplies, and filling out school paperwork so much easier. This thesis was supported by NASA Grant NNX07AD70A. I would like to thank Dr. Steve Arnold and Dr. Brett Bednarcyk at NASA Glenn Research Center for hosting me for three summers and providing me invaluable guidance and input for my journal and conference papers. iv
6 TABLE OF CONTENTS Page LIST OF TABLES... x LIST OF FIGURES... xii CHAPTER 1 INTRODUCTION Motivation Objectives of the work Thesis Outline MICROMECHANICS-BASED PROGRESSIVE FAILURE ANALYSIS OF COMPOSITE LAMINATES USING DIFFERENT CONSTITUENT FAILURE THEORIES Introduction Background Failure theories Numerical analysis and results (0 /±45 /90 ) laminate, AS4/3501-6: σ y vs σ x failure stress envelope (0 /±45 /90 ) laminate, AS4/3501-6: stress/strain curves for σ y :σ x = 1: (0 /±45 /90 ) laminate, AS4/3501-6: stress/strain curves for σ y :σ x = 2: v
7 CHAPTER Page lamina, T300/BSL914C: σ x vs τ xy failure stress envelope lamina, E-glass/ LY556/HT907/DY063: σ y vs τ xy failure stress envelope (90 /±30 /90 ) laminate, E-glass/ LY556/HT907/DY063: σ y vs σ x failure stress envelope (90 /±30 /90 ) laminate, E-glass/ LY556/HT907/DY063: σ x vs τ xy failure stress envelope lamina, E-glass/MY750/HY917/DY063: σ y vs σ x failure stress envelope (0 /90 ) cross ply laminate, E-glass/MY750/HY917/DY063: stress/strain curve for σ y :σ x = 0: ±55 angle ply laminate, E-glass/MY750/HY917/DY063: σ y vs σ x failure stress envelope ±55 angle ply laminate, E-glass/MY750/HY917/DY063: stress/strain curves for σ y :σ x = 1: ±55 angle ply laminate, E-glass/MY750/HY917/DY063: stress/strain curves for σ y :σ x = 2: ±45 angle ply laminate, E-glass/MY750/HY917/DY063: stress/strain curve for σ y :σ x = 1: ±45 angle ply laminate, E-glass/MY750/HY917/DY063: stress/strain curve for σ y :σ x = 1: vi
8 CHAPTER Page Overall performance Conclusion ANALYSIS OF MICROSTRUCTURE VARIABILITY OF COMMON FIBER PACKING ARRANGEMENTS Introduction Background Failure theory Fiber layouts Results Fiber and material properties distribution Failure surface simulations Conclusion AN EXPLICIT MULTISCALE MODEL FOR PROGRESSIVE FAILURE OF COMPOSITE STRUCTURES Introduction Analysis Micromechanics model FEAMAC Test setup Experimental setup: Composite beam Model setup: Composite beam Experimental setup: Composite airfoil vii
9 CHAPTER Page Material characterization- composite airfoil Results Experimental results: Composite beam Modeling results: Composite beam Active wave propagation: Composite beam Experimental results: Composite airfoil Conclusion COUPLED ATTENUATION AND MULTISCALE DAMAGE MODEL FOR COMPOSITE STRUCTURES Introduction Progressive damage Single fiber scattering Implementation Experiments Simulation Results Monotonic loading Multiple loading Attenuation Conclusion CONTRIBUTIONS AND FUTURE WORK Contributions viii
10 CHAPTER Page Future work REFERENCES ix
11 LIST OF TABLES Table Page 2.1. Summary of composite laminates and specific loading cases examined for each composite system. (Soden, Hinton, & Kaddour, 1998b) Fiber material properties (Soden, Hinton, & Kaddour, 1998b) Matrix material properties (Soden, Hinton, & Kaddour, 1998b) Percent error for AS4/ failure stress envelope for both GMC and HFGMC (0 /±45 /90 ) laminate AS4/ percent error for the stress/strain curves with σ y :σ x = 1:0 loading for both GMC and HFGMC (0 /±45 /90 ) laminate AS4/ percent error for the stress/strain curves with σ y :σ x = 2:1 loading for both GMC and HFGMC Percent error for T300/BSL914C failure stress envelope for both GMC and HFGMC Percent error for E-glass/LY556/HT907/DY063 σ y vs τ xy failure stress envelope for both GMC and HFGMC Percent error for (90 /±30 /90 ) laminate E-glass/LY556/HT907/ DY063 σ y vs σ x failure stress envelope for both GMC and HFGMC Percent error for (90 /±30 /90 ) laminate E-glass/LY556/HT907/ DY063 σ x vs τ xy failure stress envelope for both GMC and HFGMC x
12 Table Page Percent error for 0 lamina E-glass/MY750/HY917/DY063 σ y vs σ x failure stress envelope for both GMC and HFGMC Percent error for (0 /90 ) cross ply laminate E-glass/MY750/HY917/ DY063 with loading σ y :σ x = 0:1 for both GMC and HFGMC Percent error for ±55 angle ply laminate E-glass/MY750/HY917/ DY063 σ y vs σ x failure stress envelope for both GMC and HFGMC Percent error for ±55 angle ply laminate E-glass/MY750/HY917/ DY063 with loading σ y :σ x = 2:1 for both GMC and HFGMC Percent error for ±45 angle ply laminate E-glass/MY750/HY917/ DY063 with loading σ y :σ x = 1:1 for both GMC and HFGMC Average ranking of percent error for various failure theories Constants for the square, square diagonal, and hexagonal packing Fiber material properties (Soden, Hinton, & Kaddour, 1998b) Matrix material properties (Soden, Hinton, & Kaddour, 1998b) Composite beam simulation constituent material properties Material properties for Epon E 863 epoxy and FiberGlast carbon fiber Material properties for impact head and foam core Material properties for Epon E 863 epoxy and FiberGlast carbon fiber Crack angle (rad) with corresponding failure stress xi
13 LIST OF FIGURES Figure Page 2.1. Laminate composite layup orientations for a) (90/0) s, b) (90/±45/0) s, c) (±55) s, d) (90/±30) s, and e) (±45) s GMC and HFGMC 26x26 subcell repeating unit cell employed to model the plies in the various WWFE laminates Method for calculating E and S for percent error calculation for (a) failure surfaces and (b) stress-strain curves (0 /±45 /90 ) laminate AS4/3501-6: σ y vs σ x failure stress envelope with (a) GMC and (b) HFGMC (0 /±45 /90 ) laminate AS4/3501-6: Stress/strain curves for σ y :σ x = 1:0 with (a) GMC and (b) HFGMC Tsai-Hill plots of RUC for (0 /±45 /90 ) laminate with loading of σ y :σ x = 1:0 using GMC. The failed subcells are circled with blue ellipses (0 /±45 /90 ) laminate AS4/3501-6: Stress/strain curve for σ y :σ x = 2:1 with (a) GMC and (b) HFGMC Tsai-Hill plots of RUC for (0 /±45 /90 ) laminate with loading of σ y :σ x = 2:1 using GMC. The failed subcells are circled with blue ellipses lamina T300/BSL914C: σ x vs τ xy failure stress envelope with (a) GMC and (b) HFGMC xii
14 Figure Page lamina E-glass/LY556/HT907/DY063: σ y vs τ xy failure stress envelope with (a) GMC and (b) HFGMC (90 /±30 /90 ) laminate E-glass/LY556/HT907/DY063: σ y vs σ x failure stress envelope with (a) GMC and (b) HFGMC (90 /±30 /90 ) laminate E-glass/LY556/HT907/DY063: σ x vs τ xy failure stress envelope with (a) GMC and (b) HFGMC lamina E-glass/MY750/HY917/DY063: σ y vs σ x failure stress envelope with (a) GMC and (b) HFGMC (0 /90 ) cross ply laminate E-glass/MY750/HY917/DY063: Stress/strain curve for σ y :σ x = 0:1 with (a) GMC and (b) HFGMC Tsai-Hill plots of RUC for (0 /90 ) laminate with loading of σ y :σ x = 0:1 using GMC. The failed subcells are circled with blue ellipses ±55 angle ply laminate E-glass/MY750/HY917/DY063: σ y vs σ x failure stress envelope with (a) GMC and (b) HFGMC ±55 angle ply laminate E-glass/MY750/HY917/DY063: Stress/strain curves for σ y :σ x = 1:0 with (a) GMC and (b) HFGMC Tsai-Hill plots of RUC for ±55 laminate with loading σ y :σ x = 1:0 using GMC. The failed subcells are circled with blue ellipses ±55 angle ply laminate E-glass/MY750/HY917/DY063: Stress/strain curve for σ y :σ x = 2:1 with (a) GMC and (b) HFGMC ±45 angle ply laminate E-glass/MY750/HY917/DY063: Stress/strain curve for σ y :σ x = 1:1 with (a) GMC and (b) HFGMC.. 41 xiii
15 Figure Page ±45 angle ply laminate, E-glass/MY750/HY917/DY063: Stress/strain curve for σ y :σ x = 1:-1 with (a) GMC and (b) HFGMC Dimensions and layout of the square, square diagonal and hexagonal packing structure (a) Random Gaussian movement in both the X 2 and X 3 directions, (b) three dimensional probability of single fiber (c) three dimensional probability of square packing structure, (d) two dimensional probability representation of square diagonal packing structure Ideal Square fiber packing arrangement for (a) 20%, (b) 40%, and (c) 60% fiber volume fraction at highest fiber fidelity Ideal Square diagonal fiber packing arrangement for (a) 20%, (b) 40%, and (c) 60% fiber volume fraction at highest fiber fidelity Ideal Hexagonal fiber packing arrangement for (a) 20%, (b) 40%, and (c) 60% fiber volume fraction at highest fiber fidelity Fiber refinement of 25 subcells Examples of random fiber microstructures for (a) square, (b) square diagonal, and (c) hexagonal packing at 40% fiber volume fraction Square packing distribution. Ideal distribution for (a) 20% (b) 40% and (c) 60% fiber volume fraction. Actual distribution for (d) 20% (e) 40% and (f) 60% fiber volume fraction xiv
16 Figure Page 3.9. Square diagonal packing distribution. Ideal distribution for (a) 20% (b) 40% and (c) 60% fiber volume fraction. Actual distribution for (d) 20% (e) 40% and (f) 60% fiber volume fraction Hexagonal packing distribution. Ideal distribution for (a) 20% (b) 40% and (c) 60% fiber volume fraction. Actual distribution for (d) 20% (e) 40% and (f) 60% fiber volume fraction Transverse modulus for square, square diagonal, and hexagonal packing for various fiber volume fractions Shear modulus for square, square diagonal, and hexagonal packing for various fiber volume fractions E-glass/MY750/HY917/DY063glass epoxy σ x :σ y failure surface distribution for square, square diagonal and hexagonal packing E-glass/ LY556/HT907/DY063 glass epoxy σ y :τ xy failure surface distribution for square, square diagonal and hexagonal packing T300/BSL914C carbon fiber-epoxy σ x :τ xy failure surface distribution for square, square diagonal and hexagonal packing Repeating unit cell considered by the doubly periodic GMC micromechanics theory FEAMAC flowchart showing interaction of ABAQUS and MAC/GMC. (Bednarcyk & Arnold, 2007) ABAQUS/Explicit VUMAT flowchart Test sample and impacting head dimensions xv
17 Figure Page 4.5. Experimental apparatus setup Composite beam model assembly Simulation and experimental airfoil size (a) Hollow and (b) foam airfoils Experimental apparatus setup for airfoil impact Experimental and MAC\GMC Bodner-Partom fitted tensile stressstrain response of Epon E 863 resin Experimental and MAC\GMC Bodner-Partom fitted compressive stress-strain response of Epon E 863 resin Experimental and MAC\GMC Bodner-Partom fitted shear stressstrain response of Epon E 863 resin Element types within airfoil simulation TWI EchoTherm images of damaged composite beam subjected to various impact velocities Impact with 1.71m/s impact velocity Impact with 2.1m/s impact velocity Impact with 2.53m/s impact velocity Example of material properties transferred from impact model to wave propagation model. This example is for the 2.53 m/s impact.88 xvi
18 Figure Page Composite beam wave propagation (a) Initial state showing actuator and sensor, (b) initial wave actuation, (c) wave initially passing through damaged are, (d) fully saturated wave with many reflections Experimental signals for healthy, 1.71 m/s, 2.1 m/s, and 2.53 m/s impact damage states Simulated signals for healthy, 1.71 m/s, 2.1 m/s, and 2.53 m/s impact damage states Experimental fast Fourier transform (FFT) of the acquired signals for the healthy and damaged states for three separate impacts Simulated fast Fourier transform (FFT) of the acquired signals for the healthy and damaged states for three separate impacts Von Mises stress distribution for hollow airfoil with 3.65 and 5.96 m/s impact Von Mises stress distribution for foam core airfoil with 3.65 and 5.96 m\s impact Damage of impacted area for the hollow airfoil with a 3.65 m/s impact Damage of impacted area for the hollow airfoil with a 5.96 m/s impact Damage of impacted area for the foam core airfoil with a 3.65 m/s impact xvii
19 Figure Page Damage of impacted area for the foam core airfoil with a 5.96 m/s impact Comparison of damage between the experiment and simulation for the 3.65 m/s impact Comparison of damage between the experiment and simulation for the 5.96 m/s impact Single fiber schematic for single crack Symmetric crack growth due to in plane loading for 90 ply before and after first subcell failure Schematic showing super position of two separate cracks to add up to symmetric crack Test sample PZT layout Subcell failure and corresponding fiber-matrix crack length Experimental and simulation results for monotonic loading of (90/0) s composite beam Global stress-strain curve for multiple loading of (90/0) s graphite/epoxy beam (a) Major strain for loaded sample with virtual strain gage regions. (b) Corresponding sample image Global stress-local strain curve; high strain region Global stress-local strain curve; high strain region Global stress-local strain curve; low strain region xviii
20 Figure Page Variation of attenuation with various crack lengths; simulation Variation of attenuation with various crack lengths; experiments xix
21 Chapter 1 INTRODUCTION 1.1. Motivation Structural Health Monitoring (SHM) is a growing field of research for its potential to improve safety and reduce the cost of many structures, such as airplanes, automobiles, buildings, etc. SHM consists of detecting, identifying, and predicting various forms of damage within the structural components. Over the past two decades or so, SHM technologies have been developed to create a new field that branches into various engineering disciplines. A comprehensive study of many SHM techniques has been documented by Dr. Charles Farrar (Farrar & Worden, 2007). This emerging field is starting to make its way into the mainstream, where its usefulness will be felt in the form of safer structures, increased usability, and reduced operating costs. In the context of modern day use, SHM has been used to detect damage in metallic structures. For aging aircrafts, technology is retrofitted to the structure in order for SHM to be used. Recently structures have started to be constructed of more advanced materials. Composite materials, although having been around for many decades, have only recently gained enough exposure to be included in advanced aerospace structures. Designing new systems that use composite materials allows for a seamless integration of SHM systems into the structures, resulting in a new set of integrated vehicle health management (IVHM) systems. To date, in order to understand damage within aerospace structures, nondestructive evaluation (NDE) has been a commonly used approach. NDE is 1
22 performed at scheduled intervals in the aerospace field, causing considerable downtime that takes the airplane out of service and results in a loss of income for the company. While NDE is similar to SHM in its ability to find and evaluate damage, NDE techniques cannot be conducted in situ. In addition to NDE, there are other empirical models and observations that have been used for damage detection; these methods, however, fail to take into account a fundamental understanding of the underlying physics (Chang & Liu, 2003; Frangopol & Peil, 2006). They may work well for detection and classification of large structures where sensors are easily placed, but for structures where sensors are unavailable or not desirable, modeling is required in order to understand the component behavior. Fundamentally, accurate modeling and simulation techniques can provide an improved insight into the physics of failure; including damage initiation and subsequent growth. The data can be used for optimal sensor placement damage detection and prognosis algorithms. An area where sensors are currently unable to detect damage is during damage initiation at the micro level. For composite materials, damage initiation occurs at the constituent level of the fiber and the surrounding matrix. These micro level cracks cannot be captured using available sensors. In addition, the measured changes in the signal strength due to damage often appear insignificant due to noise. Therefore, the concept of virtual sensing was introduced by Chattopadhyay et al. (2009). The idea is to combine the output from a multi-scale analysis with sensor data to improve the detectability range and improve the 2
23 accuracy of residual useful life (RUL) predictions. The concept of virtual sensing can also be used in hard to reach areas where actual sensors cannot be placed. Active wave interrogation is a prominent form of SHM. This is executed by having an actuator send out a signal that is received by a sensor. While the wave passes through the structure, it provides a baseline of the medium it is traveling through. When damage is present, the waveform changes its shape and energy. A method of damage detection is to measure the attenuation of the signals. Attenuation is the loss of a signal while it is traveling through a medium. This method works well for finding damage within composite materials, but the anisotropy introduces additional complexities. While waves travel through the dissimilar materials, the wave gets scattered and changes its speed. Also since the fibers are rounded for most composite materials, this results in nonlinear scattering of the wave. Furthermore, when damage is induced on the composite structure, there is added wave scattering from fiber matrix debonding, matrix cracking, and delamination between ply layers. The difference between the healthy and damaged attenuation helps distinguish the different damages that are present. To summarize, there is an increased need for reliable physics-based multiscale models of composite materials for integration within an SHM framework. Understanding and modeling attenuation in composite materials and structures is also a critical component of wave based damage detection and state evaluation. The information from the physics-based models can then be used to develop more efficient and robust prognosis framework. 3
24 1.2. Objectives This work is unique because it incorporates various modeling techniques with applications relevant to SHM. Following are the specific goals: A micromechanics model based on the generalized method of cells, MAC/GMC (Bednarcyk & Arnold, 2002), is used to conduct a baseline study of the current capabilities for damage modeling. Four failure criteria are used and their predictions are compared and accuracies assessed. Variability in the microstructure is introduced to enable statistical variation of material properties and study the impact on failure strengths. An explicit multiscale simulation is developed to model low velocity impact on composite structures. This explicit simulation also includes wave propagation, which is used in damage interrogation. A hybrid model is developed by combining a wave attenuation model with a damage model from MAC\GMC. This is used to study variable levels of attenuation corresponding to various levels of damage Thesis outline The report is structured as follows: Chapter 1 offers an introduction and the motivation for this work. Chapter 2 provides an introduction to MAC\GMC. A formulation and comparison between GMC and high fidelity GMC (HFGMC) is presented. Comparison with the World Wide Failure Exercise (WWFE) is made for both GMC and HFGMC 4
25 for various failure theories to find which one performs the best. Also the assumptions are tested to see if any modifications to the model are needed. Chapter 3 discusses statistical variation within the microstructure. An overview of the three common packing microstructures is presented. The distribution of both the transverse and shear stiffnesses is also discussed. In addition, failure stress envelopes are developed to show the effects of the variations. Chapter 4 lays out the implementation of the micromechanics model into an explicit impact model. FEAMAC, the link between MAC\GMC and a finite element code ABAQUS, is discussed. Two different test articles are used in this section, a composite beam and composite airfoil. Impact damage comparisons are made from both simulations and experiments. To quantify the damage, a nondestructive evaluation method flash thermography is used to quantify the experimental damage. Also for the composite beam, active wave propagation is used to interrogate damage induced from the impact. Chapter 5 provides an introduction of a single fiber wave scattering code. A description of actual damage progression through in plane loading is discussed. Development of the single fiber wave scattering with the single crack is expanded upon to incorporate two symmetric cracks at the top and bottom of the fiber. Then various crack lengths are induced by loading for the simulation and experimental data. Lastly, the attenuation for each system is analyzed. Chapter 6 summarizes the contributions from this work and also the future direction of the current research. 5
26 Chapter 2 MICROMECHANICS-BASED PROGRESSIVE FAILURE ANALYSIS OF COMPOSITE LAMINATES USING DIFFERENT CONSTITUENT FAILURE THEORIES 2.1. Introduction The goal of micromechanics is to predict the mechanical behavior of the composite material when given the arrangement and mechanical behavior of the constituent materials within a composite. If only effective elastic properties are required, the micromechanics problem simplifies considerably, and a number of micromechanics theories can provide reasonable results (see (Herakovich, 1998) for examples and comparisons). If, however, local nonlinear effects, such as damage, debonding, and inelasticity need to be captured, the micromechanics theory must be capable of predicting local stress and strain field gradients throughout the composite. Namely, if the matrix at a particular location within the simulated composite reaches its yield or failure stress, a local deformation and/or damage model is utilized to predict the inelastic strain accumulation and/or damage response (cf. Boyce & Arruda, 1990; Hasan & Boyce, 1995; Liang & Liechti, 1996; G'Sell & Souahi, 1997; Mulliken & Boyce, 2006; Gilat, Goldberg, & Roberts, 2007; Yekani Fard, Liu, & Chattopadhyay, 2011; Yekani Fard, Liu, & Chattopadhyay, 2012a; Yekani Fard, Liu, & Chattopadhyay, 2012b; Yekani Fard, Liu, & Chattopadhyay, 2012c; Yekani Fard, Chattopadhyay, & Liu, 2012). A key advantage of micromechanics vs. macromechanics of a ply is the ability to apply 6
27 such nonlinear models at the constituent scale, where simpler monolithic damage and inelasticity models can be used. In this chapter, the Generalized Method of Cells (GMC) and High-Fidelity Generalized Method of Cells (HFGMC) micromechanics theories, coupled with classical lamination theory (Herakovich, 1998; Jones, 1975-as implemented within NASA's Micromechanics Analysis Code with Generalized Method of Cell (MAC/GMC) Bednarcyk & Arnold, 2002), are employed to predict the Worldwide Failure Exercise (WWFE) laminate behavior. WWFE is a collection of comprehensive experiments covering a wide range of polymer matrix composites (PMCs) (Hinton & Soden, 1998; Soden, Hinton, & Kaddour, 1998b). In this study, six laminates were used to achieve a broad range of layups. They included a range of parameters, including different types of constituent materials (fiber and matrix), laminate layups (unidirectional, angle-ply, cross-ply, quasiisotropic), and loading conditions. The contributors to the WWFE exercise were given the same material data for the plies and constituents. The data was then compared with the different PMC failure theory predictions from various authors (Soden, Hinton, & Kaddour, 1998a; Soden, Hinton, & Kaddour, 2002). It is important to note that the WWFE was geared towards ply level failure analysis methods rather than micromechanics based methods such as those employed herein. Thus, while basic fiber and matrix elastic and strength properties were provided, additional data needed to accurately capture the nonlinear neat resin response curves, were not. 7
28 Most contributors to the WWFE have used lamina level mechanics for their theories. Some, however, have used micromechanics properties in the formulation in instances such as failure strain limits, post-failure analysis, failure criteria, and stress magnification factors. Chamis (Soden, Hinton, & Kaddour, 1998a) was the only contributor in the original exercise that relied on full micromechanics theories for identifying the laminate responses. In 2002 (Hinton, Kaddour, & Soden, 2002) two new micromechanics-based theories were added to the WWFE by Mayes and Hansen (2004), who developed a multi-continuum theory, as well as a bridging theory developed by Huang (2004). Interestingly, all WWFE contributors begin the analysis with constituent properties, but they use varying factors to match the ply level properties; the method established in this work, however, does not take this approach. The focus of the current study is to examine the influence of the choice made in the failure criterion (i.e., maximum stress, maximum strain, Tsai-Hill, and Tsai-Wu) for a given constituent (microscale) and its impact on the overall ability to predict composite failure at the macroscale. Note that no modifications are made to account for the in-situ behavior of the constituents. Rather, pure predictions are made using the constituent properties provided by the WWFE. As such, the predictions presented here, do not benefit from the anchor points along the axes in a ply level failure envelope plot that correspond to ply tensile and compressive strengths. The anchor points in the present model are predicted from the constituent level elastic and strength properties. Consequently, it is expected that the overall correlation of the numerical simulations with the 8
29 experiment could benefit from backing out in-situ properties, which would enable significantly better matching of the ply level response. This study was performed to show the feasibility of this method in using constituent properties and generating lamina and laminate responses that perform comparably to properties generated from ply level testing. Furthermore, a basic step function (i.e., subvolume elimination) has been employed to simulate damage progression at the fiber/matrix scale, i.e., once a subvolume within the micromechanics model satisfies the applicable failure criterion, it is then instantaneously assigned a near zero stiffness. Again, the predictions should benefit from a more progressive transition, from damage initiation to complete loss of stiffness on the micro scale, but this was not attempted in this study. The results presented herein should thus be interpreted as a preliminary application of GMC and HFGMC to PMC laminate failure with an eye toward identifying areas for improvement and the influence of failure criterion selection on the overall composite response and failure Background The family of micromechanics theories, known collectively as the Generalized Method of Cells (GMC), has been employed in the present work. GMC provides semi-closed form expressions for the effective constitutive behavior of a composite material, including nonlinear effects such as damage, debonding, and inelasticity, which can be modeled internally based on the local fiber and matrix stress and strain fields. The original method of cells (Aboudi J., 1981; Aboudi J., 1991), considered a doubly periodic repeating unit cell 9
30 (applicable for continuous reinforcement), was limited to only four subcells (one fiber and three matrix). This theory was generalized by Paley and Aboudi (1992) to consider an arbitrary number of subcells and thus constituent phases. The resulting GMC thus enables analysis of repeating unit cells containing more than two constituent materials, a more refined fiber shape, and various fiber architectures (i.e., fiber packing arrangements). A triply periodic version of GMC has also been developed (Aboudi J., 1995), which models short fiber and particulate reinforced composites, as well as porous materials. Fundamental to GMC is the assumed linear displacement field, which produces subcells with a state of constant stress and strain. Here, no additional quadrature points are necessary within each subcell to track nonlinear effects; a single subcell value (at the centroid) for each component will suffice. Also, the constant stress and strain fields of the subcells result in a lack of normal to shear coupling, which limits the accuracy of GMC's local stress and strain fields. In other words, if only global normal loads are applied, then locally, only normal stresses are produced. Similarly, if only global shear loads are applied, then only local shear stresses are generated. On the positive side, GMC's lack of shear coupling enables the method's equations to be reformulated such that unique tractions serve as the basic unknowns, which significantly increase the computational efficiency of the method by hundreds to thousands of times for sufficiently complex repeating unit cells (Pindera & Bednarcyk, 1999; Bednarcyk & Pindera, 2000). Finally, due to the constant fields, GMC is completely insensitive to subcell grid refinement, as long as the architecture of the repeating 10
31 unit cell is not altered by such grid refinement. Consequently, the least refined representation of a given RUC architecture that allows for the capturing of the salient features of the microstructural geometry will suffice. A newer but related micromechanics model, High Fidelity Generalized Method of Cells (HFGMC), has overcome GMC's lack of normal and shear coupling (Aboudi, Pindera, & Arnold, 2001; Aboudi, Pindera, & Arnold, 2003) by assuming a second order Taylor series expansion for each subcell's displacement field, along with additional equations required to enforce continuity and periodicity. This has resulted in more accurate local stress and strain fields, but at the expense of more intensive computational demands. Further, HFGMC exhibits subcell grid refinement dependence (although less extreme than typical finite element mesh refinement), along with the need to track field variables at quadrature points within each subcell to account for nonlinear inelastic effects. Review papers by Aboudi (1996; 2004) summarize the work done to date by researchers using both the GMC and HFGMC micromechanics theories Failure theories The failure theories compared herein, all of which are applied on the fiber/matrix constituent level, are the maximum stress, maximum strain, Tsai-Hill, and Tsai-Wu criteria. A comparison of these failure theories applied at the ply level is provided by Herakovich (1998). The maximum stress criterion can be expressed as, 11
32 X C X 23 Q 11 T Y C Y 13 R 22 T (2.1) Z C Z 12 S 33 T where the stress components are subcell values, X T, Y T, and Z T are the tensile material normal strengths, X C, Y C, and Z C are the compressive material normal strengths, and Q, R, and S are the material shear strengths. Note that compressive strengths are negative. Violation of any part of Equation (2.1) indicates failure of the subcell. Similarly, the maximum strain criterion can be written as, X C 11 X T 23 Q Y C 22 Y T 13 R (2.2) Z C 33 Z T 12 S where the strain components are subcell values, X εt, Y εt, and Z εt are the tensile material normal failure strains, X εc, Y εc, and Z εc are the compressive material normal failure strains, and Q ε, R ε, and S ε are the material shear failure. Note that compressive failure strains are negative. Violation of any part of Equation (2.2) indicates failure of the subcell. The fully multiaxial Tsai-Hill criterion (Tsai, 1968) failure surface is expressed as, X Y Z Q R S X Y Z X Y Z X Y Z (2.3) 12
33 where, in order to incorporate differing tensile and compressive strengths, X, Y, and Z have the additional constraints: X X X T C Y Y Y T C Z Z Z T C (2.4) Subcell failure is indicated when the function on the left-hand side of Equation (2.3) is greater than 1. Finally, the Tsai-Wu failure surface (Tsai & Wu, 1971) can be written as, F 2F 2F XT XC YT YC ZT ZC XT XC YT YC ZT ZC Q R S (2.5) where the compressive strengths are negative. The interaction coefficients, F 12, F 13, and F 23, herein have been taken according to Tsai and Hahn (1980), F 1 12 F13 F23 2 XT XCYT YC 2 XT XCZT ZC 1 1 (2.6) Y Y Z Z 2 T C T C Note that the Tsai-Wu theory with the interaction terms according to Tsai and Hahn (1980) have been denoted "Tsai-Wu (Hahn)". Subcell failure is indicated when the function on the left-hand side of Equation (2.6) is greater than 1. The use of these failure criteria has both advantages and disadvantages (Gibson, 2007). For the maximum stress and maximum strain theories, the implementation is very simple. The drawback of the two failure criteria, however, is that they do not account for any interactions among the stress components. The advantage of using the Tsai-Hill and Tsai-Wu (Hahn) failure criteria is that they account for interaction among the stress components. The disadvantages are that they are more complex, and the Tsai-Wu criterion introduces additional coefficients. If the material is isotropic, the Tsai-Hill 13
34 criterion reduces to the von Mises failure criterion. The Tsai-Wu (Hahn) failure criterion is incorporated into this work in order to include the effects of hydrostatic stress, since they are omitted in the Tsai-Hill criterion. Both the Tsai- Hill and Tsai-Wu criteria have been implemented into GMC in order to model failure of both isotropic and orthotropic constituent materials Numerical analysis and results The considered materials, laminate lay-ups, and loading cases are shown in Table 2.1 and were extracted from Soden, Hinton, and Kaddour (1998b). The schematics of the laminates are shown in Figure 2.1, with the fiber orientation and relative layer thickness shown to scale. The constituent material properties are shown in Tables 2.2 and 2.3. Table 2.1. Summary of composite laminates and specific loading cases examined for each composite system. (Soden, Hinton, & Kaddour, 1998b). Material Laminate lay-up Loading case and description AS4/ (0 /±45 /90 ) s laminate 1. σ y vs σ x failure stress envelope 2. Stress/strain curve for σ y :σ x = 1:0 3. Stress/strain curve for σ y :σ x = 2:1 T300/BSL914C 0 unidirectional lamina 4. σ x vs τ xy failure stress envelope E-glass/LY556/ HT907/DY063 0 unidirectional lamina 5. σ y vs τ xy failure stress envelope (90 /±30 ) s laminate 6. σ y vs σ x failure stress envelope E-glass/MY750/ HY917/DY σ x vs τ xy failure stress envelope 0 unidirectional lamina 8. σ y vs σ x failure stress envelope (0 /90 ) s cross ply laminate 9. Stress/strain curve for σ y :σ x = 0:1 (±55 ) s angle ply laminate 10. σ y vs σ x failure stress envelope 11. Stress/strain curve for σ y :σ x = 1:0 12. Stress/strain curve for σ y :σ x = 2:1 (±45 ) s angle ply laminate 13. Stress/strain curve for σ y :σ x = 1:1 14. Stress/strain curve for σ y :σ x = 1:-1 14
 225 230 80 74 Transverse modulus, E f2 (GPa) 15 15 80 74 E-Glass Silenka In-plane shear modulus, G f12 (GPa) 15 15 33.33 30.")
35 Figure 2.1. Laminate composite layup orientations for a) (90/0) s, b) (90/±45/0) s, c) (±55) s, d) (90/±30) s, and e) (±45) s Table 2.2. Fiber material properties (Soden, Hinton, & Kaddour, 1998b). Fiber type AS4 T300 E-glass Gevetex Longitudinal modulus, E f1 (GPa) Transverse modulus, E f2 (GPa) E-Glass Silenka In-plane shear modulus, G f12 (GPa) Major Poisson's ratio, ν Transverse shear modulus, G f23 (Gpa) Longitudinal tensile strength, X ft (MPa) Longitudinal compressive strength, X fc (MPa) Longitudinal tensile failure strain, f 1T (%) Longitudinal compressive failure strain, f 1C (%)
36 Table 2.3. Matrix material properties (Soden, Hinton, & Kaddour, 1998b). Matrix type epoxy BSL914C epoxy LY556/HT907/ DY063 epoxy MY750/HY917 /DY063 epoxy Manufacturer Hercules DFVLR Ciba Geigy Ciba Geigy Modulus, E m (GPa) Shear modulus, G m (GPa) Poisson's ratio, ν Tensile strength, Y mt (MPa) Compressive strength, Y mc (MPa) Shear strength, S m (MPa) Tensile failure strain, ε mt (%) The results presented in this section are pure predictions based on the fiber/matrix constituent properties provided in Soden, Hinton, and Kaddour (1998b). A linear elastic constituent model is used until the material has reached the failure criterion. Within this constituent model, the simplest damage progression model, which is a step function, has been employed. That is, once a subcell has reached failure according to the applicable failure criterion, its stiffness is instantaneously reduced to 0.01% of its original value. This stiffness reduction is performed identically regardless of the mode of failure. In the case of HFGMC, where stresses vary within a subcell, the subcell average stress is employed to predict failure. Clearly, a much more involved failure progression model can be incorporated in the future, and within HFGMC, subcell quadrature point based failure, rather than subcell average failure, could be considered. In all cases, the subcell repeating unit cell, shown in Figure 2.2, was employed. Note that this repeating unit cell is quite refined in terms of those typically used in GMC and HFGMC (Pindera & Bednarcyk, 1999; Aboudi, Pindera, & Arnold, 16

37 2003) and is sufficient for accurately capturing the local fields in the context of these models. Figure 2.2. GMC and HFGMC 26x26 subcell repeating unit cell employed to model the plies in the various WWFE laminates. For the failure surfaces in this work, both initial and final failures are shown. The experimental values are shown as open circles while the four different subcell failure criteria are represented as various line types. In each case, the predicted initial failure envelope is of the same type as its associated final failure line type, except for the addition of symbols to the line type. There are, however, some cases where the initial failure is not shown because it is only 1 to 2 MPa from the final failure surface. These cases are all of the unidirectional laminas (Figures 2.9, 2.10, and 2.13) and the failure surface for the ±(55) s laminate, Figure The percent error equation used for quantifying the error in the plots is shown in Equation (2.7). Two methods were used to calculate the distances 17

38 between the simulation (S) and experiment (E) within the failure surfaces and stress-strain curves. Figure 2.3 shows how E and S are calculated for the failure surface. The magnitude of the experiment is measured from the origin to the experimental point, E. The same loading ratio is used and the value of the simulated failure surface is acquired as S. This is then averaged for all the experimental points. If there are common experimental points along a similar loading ratio, the mean is calculated and used as E for that loading ratio. For calculating the magnitudes for the stress-strain curves, a horizontal line is drawn from the vertical axis through the experimental point and through the simulation. The percent error is again calculated for all the experimental points and averaged. S E % error 100 E (2.7) Figure 2.3. Method for calculating E and S for percent error calculation for (a) failure surfaces and (b) stress-strain curves. 18
39 2.4.1.(0 /±45 /90 ) laminate, AS4/3501-6: σ y vs σ x failure stress envelope A comparison of theoretical predictions to experimental results for the failure stress envelope in the global directions (X, Y), see Figure 2.1, is shown in Figure 2.4 (a) for GMC and Figure 2.4 (b) for HFGMC. The GMC and HFGMC simulations predict final failure that is similar for all failure theories, with HFGMC predicting somewhat wider failure initiation envelopes. This could be attributed to the quasi-isotropic laminate washing out the intricacies of each failure theory. This is verified by calculating the percent error associated with the failure surfaces, Table 2.4. Also from Table 2.4 we can see that the Tsai-Hill and Max Strain failure criteria were ranked first and second, respectively, for both GMC and HFGMC simulations. The final failure envelopes are similar for the failure criteria for the first, second, and fourth quadrants. The failure criteria show good agreement with experiment in the first and fourth quadrants, while the second quadrant has no experimental data. There is an over-prediction for all criteria in the third quadrant which could be attributed to specimen buckling. The over-prediction in this quadrant contributes to most of the error for all of the failure surfaces. In the initial failure envelope, all the failure criteria are similar for the second and fourth quadrant, but vary in the first and third. It should be noted that there is clear variability among criteria for damage initiation, but all the failure criteria are very close for predicting final failure. It seems that final failure is controlled more by how damage progresses, which is not as dependent on the particular failure criterion. 19
40 Figure 2.4. (0 /±45 /90 ) laminate AS4/3501-6: σy vs σx failure stress envelope with (a) GMC and (b) HFGMC. Table 2.4. Percent error for AS4/ failure stress envelope for both GMC and HFGMC. GMC HFGMC % Error Rank % Error Rank Max Stress Max Strain Tsai-Hill Tsai-Wu (Hahn) (0 /±45 /90 ) laminate, AS4/3501-6: stress/strain curves for σ y :σ x = 1:0 A comparison of theoretical predictions to experimental results for tension loading along the y-direction is shown in Figure 2.5 (a) for GMC and Figure 2.5 (b) for HFGMC. The experimental values are shown as open circles while the four different subcell failure criteria are shown with various line types as denoted in the legend. 20
41 Figure 2.5. (0 /±45 /90 ) laminate AS4/3501-6: Stress/strain curves for σy:σx = 1:0 with (a) GMC and (b) HFGMC. All of the failure criteria predictions are similar to one another, as are the predictions of GMC and HFGMC. The onset of initiation of damage (as indicated by deviation from linearity) between the experiments and the predictions is very good as well. Subsequent to initiation the simulations exhibit both a lower secondary slope and ultimate composite failure stress than the experimental results. This is similar to the results from the ply level theory of Bogetti et al. (2004) for this load case. Figure 2.6 illustrates the magnitude of the Tsai-Hill failure criterion at the microscale, thus enabling one to observe the onset of failure in the fiber and matrix using GMC. Failure occurs when the values surpass the critical value of 1 whereupon the corresponding subcell stiffness is reduced to approximately zero, thus reducing its load carry ability. Within the figure, the failed subcells are circled with blue ellipses. From Figure 2.6 it is clear that the initial ply failure starts in between 125 and 250 MPa within the matrix of the ±45 21

42 layers, which corresponds to the main stiffness change shown in Figure 2.5. The second ply failure, within the 0 layer, occurs between 250 and 375 MPa, which corresponds to the minor shifts in Figure 2.5. The final failure of the 90 layer causes the complete laminate failure. Figure 2.6. Tsai-Hill plots of RUC for (0 /±45 /90 ) laminate with loading of σy:σx = 1:0 using GMC. The failed subcells are circled with blue ellipses. The percent errors for the four failure theories are shown in Table 2.5 for both GMC and HFGMC. As was shown in Figure 2.5, the percent errors for all of the failure theories are low with the best being the Max Stress and Max Strain for both GMC and HFGMC. 22
43 Table 2.5. (0 /±45 /90 ) laminate AS4/ percent error for the stress/strain curves with σ y :σ x = 1:0 loading for both GMC and HFGMC. GMC HFGMC ε x % ε y % Average ε Rank x % ε y % Average Rank Error Error % Error Error Error % Error Max Stress Max Strain Tsai-Hill Tsai-Wu (Hahn) (0 /±45 /90 ) laminate, AS4/3501-6: stress/strain curves for σ y :σ x = 2:1 A comparison of theoretical predictions to experimental results for combined tension loading (σ y = 2 σ x ) is shown in Figure 2.7 (a) for GMC and Figure 2.7 (b) for HFGMC. The experimental values are shown as open circles for the strain along the x direction and open squares for the strain along the y direction while the four different subcell failure criteria are shown with various denoted line types. 23
44 Figure 2.7. (0 /±45 /90 ) laminate AS4/3501-6: Stress/strain curve for σy:σx = 2:1 with (a) GMC and (b) HFGMC. The various failure criteria predictions are similar to one another. In the GMC case, the failure criteria under-predict the final failure and over-predict the nonlinearity caused by progressive failure. The progression of subcell and ply failure can again be observed by plotting the Tsai Hill failure criterion, shown in Figure 2.8. Again within the figure, the failed subcells are circled with blue ellipses. The ply matrix subcell failures correspond to the changes in slope of composite stress strain response, with the initial, secondary, and final failure occurring within the ±45, 0, and 90 layers, respectively. The percent error for both GMC and HFGMC predictions are very similar for Max Stress, Max Strain, and Tsai Hill (see Table 2.6) with the Tsai-Wu (Hahn) theory displaying slightly higher error. 24
 laminate AS4/3501-6 percent error for the stress/strain curves with σ y :σ x = 2:1 loading for both GMC and HFGMC.")
45 Figure 2.8. Tsai-Hill plots of RUC for (0 /±45 /90 ) laminate with loading of σy:σx = 2:1 using GMC. The failed subcells are circled with blue ellipses. Table 2.6. (0 /±45 /90 ) laminate AS4/ percent error for the stress/strain curves with σ y :σ x = 2:1 loading for both GMC and HFGMC. GMC HFGMC ε x % ε y % Average ε Rank x % ε y % Average Rank Error Error % Error Error Error % Error Max Stress Max Strain Tsai-Hill Tsai-Wu (Hahn) lamina, T300/BSL914C: σ x vs τ xy failure stress envelope A comparison of theoretical predictions and experimental results for the transverse and shear loading failure stress envelope is shown in Figure 2.9 (a) for GMC and Figure 2.9 (b) for HFGMC. The percent error is similar among all of the failure theories, Table 2.7. The difference between the predicted failure shear 25
46 stress of all the failure criteria and the median failure of the experiments is 20 MPa for GMC and 19 MPa HFGMC. There is a large scatter between the high and low of the experimental data for the shear stress alone, with the high being MPa and low being 55.2 MPa. This makes it difficult to give an accurate deviation between the experimental and predicted data for pure shear loading, although the models are clearly significantly under-predicting the shear failure. The deviation between GMC and HFGMC, however, is small, therefore suggesting that the cause lies somewhere other than the micromechanics formulation. The large amount of scatter within the experimental results of Figure 2.9 indicates that capturing stochastic effects in the model would be advantageous. There is not much scatter between the various failure criteria but this could be attributed to the large discrepancy between the shear and axial failure stresses. There is a slight variation when the failure mechanism switches between tension and the shear failures. Figure lamina T300/BSL914C: σx vs τxy failure stress envelope with (a) GMC and (b) HFGMC. 26
47 Table 2.7. Percent error for T300/BSL914C failure stress envelope for both GMC and HFGMC. GMC HFGMC % Error Rank % Error Rank Max Stress Max Strain Tsai-Hill Tsai-Wu (Hahn) lamina, E-glass/ LY556/HT907/DY063: σ y vs τ xy failure stress envelope A comparison of theoretical predictions to experimental results for the transverse and shear loading failure stress envelope is shown in Figure 2.10 (a) for GMC and Figure 2.10 (b) for HFGMC. The best fit for the experimental data was the Tsai-Wu (Hahn) failure criterion, which offered good correlation with the transverse tension and compression loading. The percent error quantifies how well the Tsai-Wu (Hahn) performed compared to the other failure theories, see Table 2.8. The pure shear loading was under-predicted by approximately 18 MPa for all failure criteria, which was a percent error of 29.2%. The pure shear loading, however, improved to 13 MPa under-prediction using HFGMC, which was a percent error of 21.6%. There also is an interaction with the shear stress and transverse compressive stress in the experiments, which delays failure that the models did not capture. The correlation would clearly benefit from using in-situ constituent properties, which would allow the model to reproduce the pure shear loading data point. The differences between the GMC and HFGMC models are small compared to those among the various failure criteria. The Tsai-Hill envelope shows the greatest deviation between GMC and HFGMC. This case is 27
48 very different than the first failure surface case in which the final failure surfaces are very similar. This could be attributed to this system being a single lamina. Within the other laminates, the various stacking sequences helped mask this effect. Figure lamina E-glass/LY556/HT907/DY063: σy vs τxy failure stress envelope with (a) GMC and (b) HFGMC. Table 2.8. Percent error for E-glass/LY556/HT907/DY063 σ y vs τ xy failure stress envelope for both GMC and HFGMC. GMC HFGMC % Error Rank % Error Rank Max Stress Max Strain Tsai-Hill Tsai-Wu (Hahn)
49 (90 /±30 /90 ) laminate, E-glass/ LY556/HT907/DY063: σ y vs σ x failure stress envelope A comparison of theoretical predictions to experimental results for the failure stress envelope in the normal directions is shown in Figure 2.11 (a) for GMC and in Figure 2.11 (b) for HFGMC. All the failure theories seem to be consistent with one another with minor deviations for both the GMC and HFGMC final failure envelopes, except for the Tsai-Wu (Hahn) wherein significant variation between GMC and HFGMC is observed. Both have varying initial failure envelopes with significant differences in the third quadrant (although little experimental data is given in this quadrant). This is also where the failure prediction has the greatest deviation from the experimental data. This suggests the presence of a compressive failure mechanism (e.g., buckling, fiber kinking) that is not being captured by the models. There is a slight deviation in the second quadrant as well, but not as severe as in the third quadrant. The first and fourth quadrants agree well with the experimental data. Table 2.9 shows the errors to be high but this is skewed by the large discrepancies in the third quadrant. This laminate is behaving similar to the AS4/ laminate in the first test in which there is clear variability among criteria for damage initiation, but all the failure criteria are very close for predicting final failure. This is true for all the cases except the Tsai-Wu (Hahn) using HFGMC. 29
50 Figure (90 /±30 /90 ) laminate E-glass/LY556/HT907/DY063: σy vs σx failure stress envelope with (a) GMC and (b) HFGMC. Table 2.9. Percent error for (90 /±30 /90 ) laminate E-glass/LY556/HT907/ DY063 σ y vs σ x failure stress envelope for both GMC and HFGMC. GMC HFGMC % Error Rank % Error Rank Max Stress Max Strain Tsai-Hill Tsai-Wu (Hahn) (90 /±30 /90 ) laminate, E-glass/ LY556/HT907/DY063: σ x vs τ xy failure stress envelope A comparison of theoretical predictions to experimental results for the failure stress envelope in the x direction and shear loading is shown in Figure 2.12 (a) for GMC and Figure 2.12 (b) for HFGMC. The final failure envelopes are very similar to one another, except that the Max Strain failure criterion has a higher prediction for the pure shear stress failure for GMC. The failure criteria 30
51 lead to an over-prediction for both pure shear and compression. The tension, on the other hand, is a slight under prediction. The initial failure envelopes seem similar, but with slight variations. The initial failure envelopes for the HFGMC tend to occur at higher stresses than those in GMC. Overall, the predictions for this laminate have the general shape of the experimental failure envelope. Table 2.10 shows that the Tsai-Hill and Tsai-Wu (Hahn) had the lowest percentage error for both GMC and HFGMC. This laminate is behaving similar to the AS4/ laminate in the first test and the previous (90 /±30 /90 ) laminate in which there is clear variability among criteria for damage initiation, but all the failure criteria are very close for predicting final failure. Figure (90 /±30 /90 ) laminate E-glass/LY556/HT907/DY063: σx vs τxy failure stress envelope with (a) GMC and (b) HFGMC. 31
52 Table Percent error for (90 /±30 /90 ) laminate E-glass/LY556/HT907/ DY063 σ x vs τ xy failure stress envelope for both GMC and HFGMC. GMC HFGMC % Error Rank % Error Rank Max Stress Max Strain Tsai-Hill Tsai-Wu (Hahn) lamina, E-glass/MY750/HY917/DY063: σ y vs σ x failure stress envelope A comparison of theoretical predictions to experimental for the failure stress envelope in the normal directions is shown in Figure 2.13 (a) for GMC and Figure 2.13 (b) for HFGMC. For the limited experimental data given, one failure criterion fits the data the best for GMC. The Tsai-Wu (Hahn) predicts the transverse compressive stress very well and follows the data well within the fourth quadrant for GMC. For the HFGMC, though, Tsai-Wu (Hahn) overpredicts the transverse compressive stress, but predicts the transverse tensile stress well. Table 2.11 confirms that the Tsai-Wu (Hahn) had the lowest error for GMC, but the over-prediction using HFGMC proved to put it last among the four theories. The disparity among the four failure theories for both GMC and HFGMC is displayed prominently for this composite system and layup. This system is very similar to the other unidirectional case, E- glass/ly556/ht907/dy063, where the final failure surfaces are very different among the various failure criteria. This shows that within a single lamina the failure criteria play a significant role in dictating the shape. 32
53 Figure lamina E-glass/MY750/HY917/DY063: σy vs σx failure stress envelope with (a) GMC and (b) HFGMC. Table Percent error for 0 lamina E-glass/MY750/HY917/DY063 σ y vs σ x failure stress envelope for both GMC and HFGMC. GMC HFGMC % Error Rank % Error Rank Max Stress Max Strain Tsai-Hill Tsai-Wu (Hahn) (0 /90 ) cross ply laminate, E-glass/MY750/HY917/DY063: stress/strain curve for σ y :σ x = 0:1 A comparison of theoretical predictions to experimental results for tension loading in the x direction is shown in Figure 2.14 (a) for GMC and Figure 2.14 (b) for HFGMC. The experimental values are shown as open circles while the four different subcell failure criteria are shown as various denoted line types. 33
54 Figure (0 /90 ) cross ply laminate E-glass/MY750/HY917/DY063: Stress/strain curve for σy:σx = 0:1 with (a) GMC and (b) HFGMC. For both the GMC and HFGMC, the various failure criteria predictions are very similar to one another. They all over-predict the final failure by 40 MPa. For the GMC, the failure theories all follow the ε y strain well, but the Max Strain and Tsai-Hill failure criteria follow the ε x strain curve better than the other two failure criteria. For the HFGMC, the failure theories all follow the ε y strain curve well, with the Max Strain criterion curve now matching the other criteria curves closely. Figure 2.15 shows the Tsai-Hill micro plots of the two layers during loading for the GMC model where the failed subcells are circled with blue ellipses. The first failure is the matrix within the 0 layer. The second failure within the laminate is the matrix within the 90 layer. The final failure for the laminate is the fiber failure within the 90 layer, which is aligned with the loading direction in this case. The corresponding shifts in the stress-strain curve are shown in Figure The failure theory that performed the best for both the 34

55 GMC and HFGMC was the Tsai-Hill method, see Table The large errors in the x direction could be attributed to the small values in the strain compared to the larger values in the y direction in the percentage error equation. Figure Tsai-Hill plots of RUC for (0 /90 ) laminate with loading of σy:σx = 0:1 using GMC. The failed subcells are circled with blue ellipses. Table Percent error for (0 /90 ) cross ply laminate E-glass/MY750/HY917/ DY063 with loading σ y :σ x = 0:1 for both GMC and HFGMC. GMC HFGMC ε 0/90 x % ε y % Average ε Rank x % ε y % Average Rank Error Error % Error Error Error % Error Max Stress Max Strain Tsai-Hill Tsai-Wu (Hahn) ±55 angle ply laminate, E-glass/MY750/HY917/DY063: σ y vs σ x failure stress envelope A comparison of theoretical predictions to experimental data for the failure stress envelope in the normal directions is shown in Figure 2.16 (a) for 35
56 GMC and Figure 2.16 (b) for HFGMC. The experimental values are shown as open circles while the four different subcell failure criteria are shown as various line types. The initial failure envelope is not included because the initial envelope was only 1 to 2 MPa from the predicted final failure envelope for all failure criteria. Figure ±55 angle ply laminate E-glass/MY750/HY917/DY063: σy vs σx failure stress envelope with (a) GMC and (b) HFGMC. The simulated failure envelopes do not accurately predict the experimental data for HFGMC. Rather, the GMC captures the data set better, predicting larger failure envelopes, especially in the third quadrant. This is also apparent in the percentage errors, which were lower for GMC compared to HFGMC, Table The Tsai-Wu (Hahn) criterion provided the best prediction for both GMC and HFGMC in this case. All failure theories struggled to predict accurate results in the first quadrant, with a large discrepancy along the tensile σ y -axis. This discrepancy is explored in more detail in the next section. 36
57 Table Percent error for ±55 angle ply laminate E-glass/MY750/HY917/ DY063 σ y vs σ x failure stress envelope for both GMC and HFGMC. GMC HFGMC % Error Rank % Error Rank Max Stress Max Strain Tsai-Hill Tsai-Wu (Hahn) ±55 angle ply laminate, E-glass/MY750/HY917/DY063: stress/strain curves for σ y :σ x = 1:0 A comparison of theoretical predictions to experimental results for loading along the y direction is shown in Figure 2.17 (a) for GMC and Figure 2.17 (b) for HFGMC. The experimental values are shown as open circles while the four different subcell failure criteria are shown as various line types. Figure ±55 angle ply laminate E-glass/MY750/HY917/DY063: Stress/strain curves for σy:σx = 1:0 with (a) GMC and (b) HFGMC. 37
58 The predictions of the various failure criteria are very similar to one another. They all under-predict the final failure significantly with very little damage progression. Neither GMC nor HFGMC correlate well with the experiments. Clearly a mechanism is not being captured by the models as the observed failure response is much more gradual and progressive than the model predictions. It is noted that the present MAC/GMC simulations are based on plate geometry for the laminate, while the experimental specimens were tubular. Bogetti et al. (2004) suggest that models for this WWFE laminate must adapt to account for the fiber realignment in the tubes and also to radial expansion or contraction of the tube. This holds true for the ±55 and ±45 test specimens whose ply level strain state are dominated by shear. An improved matrix level damage progression model (beyond the step function used herein) could also potentially improve the correlation for this case. As seen in micro plots of the Tsai-Hill failure criterion, Figure 2.18 for GMC, the upper and lower portions of the RUC develop most of the stresses, and once the outer matrix subcells fail (those circled with blue ellipses) the damage progresses to the neighboring matrix subcells in subsequent steps, until final failure is achieved. The percent errors are not calculated since all of the failure criteria perform similarly. 38

59 Figure Tsai-Hill plots of RUC for ±55 laminate with loading σy:σx = 1:0 using GMC. The failed subcells are circled with blue ellipses ±55 angle ply laminate, E-glass/MY750/HY917/DY063: stress/strain curves for σ y :σ x = 2:1 A comparison of theoretical predictions to experimental results for combined tension loading is shown in Figure 2.19 (a) for GMC and Figure 2.19 (b) for HFGMC. The experimental values in the x direction are shown as open circles, the experimental values in the y direction are shown as open squares, and the four different subcell failure criteria predictions are shown as various line types. 39
60 Figure ±55 angle ply laminate E-glass/MY750/HY917/DY063: Stress/strain curve for σy:σx = 2:1 with (a) GMC and (b) HFGMC. For the GMC there is a large deviation among the different failure theory predictions. All the theories have the same shape and capture the experimental data reasonably well. The Max Strain theory best captures the final failure, Table The HFGMC, however, did not capture the failure well in this load case. It under-predicted final failure for all failure criteria, but followed the shape of the experimental curve well up until its predicted final failure. Table Percent error for ±55 angle ply laminate E-glass/MY750/HY917/ DY063 with loading σ y :σ x = 2:1 for both GMC and HFGMC. GMC HFGMC % Error Rank % Error Rank Max Stress Max Strain Tsai-Hill Tsai-Wu (Hahn)
61 ±45 angle ply laminate, E-glass/MY750/HY917/DY063: stress/strain curve for σ y :σ x = 1:1 A comparison of theoretical predictions to experimental results for equal tension loading in both the x and y directions is shown in Figure 2.20 (a) for GMC and Figure 2.20 (b) for HFGMC. The experimental values in the x direction are shown as open circles, the experimental values in the y direction are shown as open squares, and the four different subcell failure criteria predictions are shown as various line types. It is noted that, for a ±45 laminate subjected to σ y :σ x = 1:1, there is no theoretical distinction between the ε y and ε x response. This should be the case for the experiments as well, but applying inner pressure to the tube specimens combined with tension produced slightly varied values for the strains. Figure ±45 angle ply laminate E-glass/MY750/HY917/DY063: Stress/strain curve for σy:σx = 1:1 with (a) GMC and (b) HFGMC. The various failure criteria predictions are very similar to one another for both the GMC and HFGMC. All of the failure criteria follow both the ε x and ε y 41
62 curves very well. They all capture the initial failure that changes the slope for the stress-strain plot. The models did, however, over-predict the final failure significantly by approximately 200 MPa. The Max Stress failure theory provided the lowest percent error between the failure theories, Table Table Percent error for ±45 angle ply laminate E-glass/MY750/HY917/ DY063 with loading σ y :σ x = 1:1 for both GMC and HFGMC. GMC HFGMC ε x % ε y % Average ε Rank x % ε y % Average Rank Error Error % Error Error Error % Error Max Stress Max Strain Tsai-Hill Tsai-Wu (Hahn) ±45 angle ply laminate, E-glass/MY750/HY917/DY063: stress/strain curve for σ y :σ x = 1:-1 A comparison of theoretical predictions to experimental results for y- directional tension and x-directional compression is shown in Figure 2.21 (a) for GMC and Figure 2.21 (b) for HFGMC. The experimental values are shown as open circles while the four different subcell failure criteria are shown as various line types. 42
63 Figure ±45 angle ply laminate, E-glass/MY750/HY917/DY063: Stress/strain curve for σy:σx = 1:-1 with (a) GMC and (b) HFGMC. The various failure criteria predictions are very similar to one another for both the GMC and HFGMC. All of the failure criteria follow both the ε x and ε y slope very well, but they under-predict the final failure significantly by 50 MPa. This case is similar to the ±55 angle ply laminate E- glass/my750/hy917/dy063 under the loading ratio of σ y :σ x = 1:0, where the ply level strain state is dominated by shear. Once again the models significantly under-predict the damage progression prior to final failure, with GMC predicting somewhat tougher laminate behavior compared to HFGMC Overall performance The performance of the various failure theories was separated into two different categories: performance in stress-strain curve prediction and performance in failure surface prediction, Table For the stress-strain curves Max Stress and Max Strain performed the best. They performed consistently toward the top for both methods of simulation, GMC and HFGMC. The Tsai-Hill 43
64 failure theory and Tsai-Wu (Hahn) finished third and fourth, respectively. For the failure surfaces, it was a little more varied. For the GMC method, the Tsai-Wu (Hahn) method finished first, but for HFGMC it finished third. The Tsai-Hill performed well for these cases, placing second using both GMC and HFGMC. The Max Strain criterion also performed well. It finished third using GMC and first using HFGMC. The Max Stress criterion did not perform well in predicting the failure surfaces. It placed fourth for both GMC and HFGMC analyses. These differences among the theories are caused by the multiaxial in-situ micro scale stress and strain states in each ply, which results in a predicted different initiation, and then progression of damage for each theory. Table Average ranking of percent error for various failure theories. Stress-Strain Curves Failure Surface GMC HFGMC GMC HFGMC Max Stress Max Strain Tsai-Hill Tsai-Wu (Hahn) One aspect that comes to light is that a failure theory could perform well in predicting the stress-strain curves, but could be less effective in predicting the failure surfaces. The basic failure theories, Max Stress and Max Strain, kept the error lower in predicting the stress-strain curves, but have a harder time calculating final failure. The failure theories that took into account the multi-axial stress states, Tsai-Hill and Tsai-Wu (Hahn), did a better job of predicting the final failures. Overall, the Max Strain failure theory proved to be the best compromise 44
65 at predicting the material behavior well in the stress-strain curves and in predicting the final failure within GMC and HFGMC Conclusion The objectives of this chapter were to evaluate the basic predictive capabilities of the Generalized Method of Cells (GMC) and High-Fidelity Generalized Method of Cells (HFGMC) micromechanics theories in progressive failure prediction of PMC laminates and to evaluate the influence of four failure criteria applied at the fiber/matrix constituent scale. Toward this end, the two micromechanics theories (first order GMC and second order HFGMC) were used to model the ply level behavior within classical lamination theory simulations of the Worldwide Failure Exercise (WWFE) data. A comparison among the maximum stress, maximum strain, Tsai-Hill, and Tsai-Wu (Hahn) failure criteria was made for failure initiation, final failure, and various stress-strain curves. It must be stated that this is the first time that GMC and HFGMC have been systematically applied to predict PMC laminate failure and that no modifications were made to the fiber/matrix properties provided by the WWFE. The results are thus pure predictions from the models, without the benefit of in-situ property alterations that enable the predictions to match ply level strength data. Also, the simplest damage progression model in the form of a step function at the micro scale was used. The results indicate that the choice of failure theory has a significant effect on the predictions, with the Maximum Strain criterion showing the best agreement with the experiments. The differences between the GMC and HFGMC 45
66 micromechanics theories were small compared to those among the four failure criteria for final failure. This may be in part because the HFGMC implementation used average subcell stresses to predict failure rather than quadrature point stresses. Using average stresses negates some of the benefits of the more accurate stress concentrations provided by HFGMC and makes HFGMC act more like GMC. The results from this work also show that the predictions match best with the experimental data in cases less dominated by shear at the ply and micro scales. For example, the (0 /±45 /90 ) AS4/ laminate predictions (Figures 2.4, 2.5 and 2.7) and the (0 /90 ) E-glass/MY750/HY917/DY063 laminate predictions (Figure 2.14) correlate well with experiment, while the ±55 E- glass/my750/hy917/dy063 laminate predictions (Figures 2.16, 2.17 and 2.19) and even the shear dominated portions of the 0 lamina predictions (Figures 2.9 and 2.10) do not. There is thus a clear need for an improved damage progression model that enables a more gradual transition between failure initiation and final failure at the fiber/matrix scale, especially in cases that are dominated by local shear. The overall tendency was for the predictions to be more conservative compared to experimental failure data when the local behavior is influenced by shear. This again points to the need for a more progressive damage model in shear that enables the dissipation of greater amounts of energy prior to final failure. It is also highly desirable to link the progressive damage to the physically meaningful fracture toughness of the material. Work is currently underway to 46
67 address both of these needs (Bednarcyk, Aboudi, & Arnold, 2010; Pineda, Bednarcyk, Waas, & Arnold, 2012). 47
68 Chapter 3 ANALYSIS OF MICROSTRUCTURE VARIABILITY OF COMMON FIBER PACKING ARRANGEMENTS 3.1. Introduction Within composite modeling, micromechanics have been used to get bulk properties for quite some time. Recently, there has been work using micromechanics within full structural analyses to impart material properties that change according to damage at the constituent level (Fish & Shek, 2000; Haj-Ali, Kilic, & Zureick, 2001; Zhu, Chattopadhyay, & Goldberg, 2006; Pineda E. J., Waas, Bednarcyk, Collier, & Yarrington, 2009; Zhang & Zhang, 2010). Methods in the aforementioned references provide accurate analyses, but with no variation in the fiber layout and, in turn, no variability in the failure. Usually within metal matrix composites, the fibers are relatively large, and the fiber structure is highly regulated. However, within polymer matrix composites though, the structure is highly stochastic in nature. Using a random microstructure will cause variability in material properties and failure strengths. This, in turn, could help with probability of failure studies for structures using these materials. The value of a more precise representative volume element (RVE) for accurate modeling of the microstructure of composites was addressed by Sun and Vaidya (1996). They showed that using two different packing arrangements, square and hexagonal, the generation of material properties using micromechanics was possible. Sun and Vaidya showed that their model correlated well with theoretical predictions and experiments. Li (2000) provided a systematic 48
69 approach for finding the correct unit cell from various translational symmetry transformations. This work produced a unit cell that could accommodate irregular fibers and asymmetrical imperfections. Arnold et al. (1996) provided a review on the state of the art at that time for effects of architecture within metal matrix composites (MMCs). They also introduced the use of GMC for calculating the response of MMCs using square, square diagonal, hexagonal, and rectangular arrays, as well as varying fiber shapes. Aghdam and Dezhsetan (2005) used a simplified unit cell (SUC) to analyze square, hexagonal, and random RVEs. Their work showed good agreement with other models simulating MMCs. Teng (2007) calculated the transverse properties of unidirectional composites subjected to random fiber debonding. Teng s paper showed the effect of debonding on tensile properties, and how tensile properties differed from the compressive properties. Oh et al. (2006) showed the stress distribution at the interface of the matrix and the fiber for square, hexagonal, and random packing. Their work used a Fourier series approximation and a statistical approach for modeling the interfacial strain fields. Jin et al. (2007) showed the stress distribution of the interface for the square, hexagonal, and random packing due to residual stresses, demonstrating that a random arrangement influenced the residual stresses more than the regular packing. Huang et al. (2008) showed the effects of fiber arrangement on the mechanical behavior of unidirectional composites, and showed that failure in the transverse direction in their model agreed well with experimental data. 49
70 Okabe et al. (2012) predicted the tensile strength of unidirectional carbon fiber-reinforced plastic (CFRP). Their work calculated the distribution of the fiber breakage from single fiber tests and calculated the matrix properties form angle ply laminates. A spring element model was then used to simulate the tensile strength within the CFRP, which correlated well with their experiments. Melro et al. (2012) used a random RVE to calculate material properties of CFRPs using analytical and numerical methods. They found that the biggest influence on the data was the size of the RVE and the minimum acceptable distance between the fibers. All the work cited herein show the importance of micromechanics modeling using a random RUC. This work will focus on the influence of packing variations with respect to failure under various bi-axial loading conditions assuming elastic analysis for polymer matrix composites (PMCs). This research effort will use the micromechanics code MAC\GMC to conduct variable analyses of three commonly used fiber arrangements, square, square diagonal and hexagonal packing. It will show the variation of the simulated microstructures compared with ideal distribution. It will also demonstrate the variation in the transverse and shear moduli due to perturbations of fiber centers given a basic fiber packing arrangement. Lastly, it will compare the failure of these microstructures in three material systems subjected to three different loading combinations. 50
71 3.2. Background Failure theory Chapter 2 provided a comprehensive study determining the best failure theory using the MAC/GMC model, comparing four failure theories; maximum stress, maximum strain, Tsai-Hill, and Tsai-Wu. The maximum strain criterion performed the best and will be used in this chapter Fiber layouts Researchers have commonly used three different layouts to model unidirectional composites; square, square diagonal, and hexagonal packing. The three different layouts are represented in Figure 3.1. In order to provide enough fibers to give a statistical variation and for it to be small enough to run efficiently, four fibers are used within each RUC. Equation (3.1) is used to calculate the radius of the fibers, R. The values for b and h for each packing arrangement are given in Table 3.1. (3.1) 51
72 Figure 3.1. Dimensions and layout of the square, square diagonal and hexagonal packing structure. Table 3.1. Constants for the square, square diagonal, and hexagonal packing. Square Square Diagonal Hexagonal b h 1.5 NF.5.5 In order to make these structures random, a Gaussian random number in both the X 2 and X 3 directions is added to each fiber s ideal position. To illustrate the Gaussian random movement Figure 3.2 shows the process. In Figure 3.2 (a), the center of one fiber is moved over a different random Gaussian distribution for both the X 2 and X 3 directions. The probability that the center of the fiber is in a region is shown in Figure 3.2 (b), with the directions being the coordinates and the height being the probability that the center is in that position. Note the color red indicates the highest probability while blue indicates the lowest. After one fiber is moved randomly, the process is repeated for the remaining fibers. Figure 3.2 (c) is the three-dimensional representation of all the fibers and if the perspective is rotated to look at a top-down view, the two-dimensional 52
 is shown in Table 3.1 for each packing structure. Within the code, if any of the fibers are overlapping, the overlapped structure is thrown out and a new RUC is calculated. Figure 3.2.")
73 representation is acquired, Figure 3.2 (d). The standard deviations of the Gaussians are derived from Equation (3.2) where R varies with the fiber volume fraction and NF (defined in Figure 3.1) is shown in Table 3.1 for each packing structure. Within the code, if any of the fibers are overlapping, the overlapped structure is thrown out and a new RUC is calculated. Figure 3.2. (a) Random Gaussian movement in both the X 2 and X 3 directions, (b) three dimensional probability of single fiber (c) three dimensional probability of square packing structure, (d) two dimensional probability representation of square diagonal packing structure. (3.2) 53

74 A low, medium, and high fiber volume fraction is used to check the distribution of the transverse modulus and the failure strength for the microstructure. Three fiber volume fractions; 20, 40, and 60%, are used for all three packing layouts; Figures 3.3, 3.4 and 3.5. For this study a 9x9 RUC with 25 subcells representing the general circular fiber shape, see Figure 3.6. Figure 3.7 shows an example random fiber layout for each of the three packing arrangements at 40% fiber volume fraction. Figure 3.3. Ideal Square fiber packing arrangement for (a) 20%, (b) 40%, and (c) 60% fiber volume fraction at highest fiber fidelity. Figure 3.4. Ideal Square diagonal fiber packing arrangement for (a) 20%, (b) 40%, and (c) 60% fiber volume fraction at highest fiber fidelity. 54
 20%, (b) 40%, and (c) 60% fiber")

75 Figure 3.5. Ideal Hexagonal fiber packing arrangement for (a) 20%, (b) 40%, and (c) 60% fiber volume fraction at highest fiber fidelity. Figure 3.6. Fiber refinement of 25 subcells. Figure 3.7. Examples of random fiber microstructures for (a) square, (b) square diagonal, and (c) hexagonal packing at 40% fiber volume fraction. 55
76 3.3. Results Fiber and material properties distribution The distribution of the radius center point for 1000 different microstructures for each of the packing structures is shown in Figures 3.8, 3.9 and As before, the color red indicates the highest probability while dark blue indicates the lowest. For these figures the upper half, a-c, shows the ideal distribution and the bottom half, d-f, shows the distribution from the model. For all packing structures there is agreement between the ideal and the model. The distribution plot shows that with higher fiber volume fraction the variation of the fiber centers is smaller, as expected. This is caused by the standard deviation being a function of the fiber radius and because the fibers themselves do not have as much room to move. Conversely, the distribution of the lower fiber volume fraction allows for considerable movement of fiber centers and the distribution is larger. 56
 20% (b) 40% and (c) 60% fiber volume fraction.")

77 Figure 3.8. Square packing distribution. Ideal distribution for (a) 20% (b) 40% and (c) 60% fiber volume fraction. Actual distribution for (d) 20% (e) 40% and (f) 60% fiber volume fraction. Figure 3.9. Square diagonal packing distribution. Ideal distribution for (a) 20% (b) 40% and (c) 60% fiber volume fraction. Actual distribution for (d) 20% (e) 40% and (f) 60% fiber volume fraction. 57
.")
78 Figure Hexagonal packing distribution. Ideal distribution for (a) 20% (b) 40% and (c) 60% fiber volume fraction. Actual distribution for (d) 20% (e) 40% and (f) 60% fiber volume fraction. For experimental comparison, the material systems used in WWFE have been used (Soden, Hinton, & Kaddour, 1998b). The elastic properties for the fiber and matrix materials used in this study are shown in Tables 3.2 and 3.3. The variation of material properties for the random fiber structures can be seen mainly in the transverse and shear moduli, Figures 3.11 and 3.12, respectively. The material system used for this comparison was the E-glass/MY750/ HY917/DY063 glass epoxy system. The random movement of the fibers within the X 2 -X 3 directions has no bearing on axial modulus. Within Figures 3.11 and 3.12, the mean is shown by the colored marker and the ideal is shown with an asterisk. The error bars are the maximum and minimum of the modulus. The distribution of the 58
79 transverse modulus is overlapping for the all packing arrangements for the lower fiber volume fraction. This happens because the fibers are able to move considerably. As the fiber volume fraction is increased, the fibers are constrained to stay more and more in their underlying packing arrangement. The largest distribution of the transverse modulus for each fiber volume fraction is the square diagonal packing. The stiffest mean transverse modulus corresponds to the square packing followed by the hexagonal packing. The packing that was the most compliant was the square diagonal packing. For 60% fiber volume fraction, the square packing was the most accurate compared to the experimental value. A trend for all of the fiber volume fractions was that the mean was similar to the ideal for all packing structures. The mean and ideal values for the square packing arrangement were near the upper bounds. For the hexagonal packing, they were near the middle, and for the square diagonal they were near the lower bounds. Table 3.2. Fiber material properties (Soden, Hinton, & Kaddour, 1998b). Fiber type T300 E-glass Gevetex Longitudinal modulus, E f1 (GPa) Transverse modulus, E f2 (GPa) E-Glass Silenka In-plane shear modulus, G f12 (GPa) Major Poisson's ratio, ν Transverse shear modulus, G f23 (Gpa) Longitudinal tensile strength, X ft (MPa) Longitudinal compressive strength, X fc (MPa) Longitudinal tensile failure strain, f 1T (%) Longitudinal compressive failure strain, f 1C (%)
80 E 22 Modulus (GPa) Table 3.3. Matrix material properties (Soden, Hinton, & Kaddour, 1998b). Matrix type BSL914C epoxy LY556/HT907/ DY063 epoxy MY750/HY917 /DY063 epoxy Manufacturer DFVLR Ciba Geigy Ciba Geigy Modulus, E m (GPa) Shear modulus, G m (GPa) Poisson's ratio, ν Tensile strength, Y mt (MPa) Compressive strength, Y mc (MPa) Shear strength, S m (MPa) 70 Tensile failure strain, ε mt (%) Square Square Diagonal Hexagonal Ideal Experiment Fiber Volume Fraction (%) Figure Transverse modulus for square, square diagonal, and hexagonal packing for various fiber volume fractions. 60
81 G 12 Modulus (GPa) Square Square Diagonal Hexagonal Ideal Experiment Fiber Volume Fraction (%) Figure Shear modulus for square, square diagonal, and hexagonal packing for various fiber volume fractions. The shear modulus behaved similarly to the transverse modulus. The largest distribution for the shear modulus was from the square diagonal packing. The stiffest mean shear modulus was the square packing, and it was also the closest to the experimental value. The hexagonal packing had the next highest mean shear modulus and the lowest mean was the square diagonal packing Failure surface simulations Only the unidirectional failure surfaces in the WWFE were considered in this comparison. A fiber volume fraction of 60% was used. The laminate results still shoed some variability, but they were small compared to the unidirectional results. The results for the laminate responses can be seen to follow the results 61
82 from those in chapter 2. The three systems compared in this study show the interaction of the normal and shear loading directions. The first system compared is the E-glass/MY750/HY917/DY063 glass epoxy system subjected to stresses in the σ x :σ y directions, Figure 3.13, where the x direction is aligned with the fiber. The figure shows when the loading is aligned with the fiber, σ x direction, there is little to no variation between the packing structures, which is to be expected. There is variation of failure for all of the packing when σ y is positive. When σ y is negative, there is a region in the fourth quadrant that is the similar for all three packing structures, which shows that this area is insensitive to the packing. The square diagonal packing structure shows the highest variation between the packing arrangements. The hexagonal failures fit within the square diagonal failures over most of the domain. The square packing is similar when σ y is positive but when σ y is negative overall it predicts a higher failure stress. 62
83 Figure E-glass/MY750/HY917/DY063glass epoxy σ x :σ y failure surface distribution for square, square diagonal and hexagonal packing. The second system compared is the E-glass/ LY556/HT907/DY063 glass epoxy system subjected to stresses in the σ y :τ xy directions, Figure 3.14, where the y-direction is transverse to the fiber. All of the packing arrangements overpredict the transverse tension failure and under predict in transverse compression failure. All three packing arrangements under-predicted the failure in the shear direction, and the square diagonal performed the best. The hexagonal and square packing arrangements had near constant spreads of failure over the entire domain. The square diagonal packing arrangement was wide for the transverse direction and small for the shear direction. 63
84 Figure E-glass/ LY556/HT907/DY063 glass epoxy σ y :τ xy failure surface distribution for square, square diagonal and hexagonal packing. The second system compared is the T300/BSL914C carbon fiber-epoxy system subjected to stresses in the σ x :τ xy directions, Figure 3.15, where the x direction is aligned with the fiber. This figure is similar to Figure 3.13 because there is no variation of failure when loading is aligned with the fiber, σ x direction. The variations over the whole domain are fairly consistent once again for the square and hexagonal packing, while there is more variation in the square diagonal packing. The square diagonal also fits the data the best in shear loading. 64
85 Figure T300/BSL914C carbon fiber-epoxy σ x :τ xy failure surface distribution for square, square diagonal and hexagonal packing Conclusion The influence of random perturbations in fiber placement on stiffness and failure has been examined. Varying the microstructure in a statistical manner causes changes in the transverse modulus, shear modulus, and the failure strength. The fibers were moved in a Gaussian distribution for each of the underlying packing arrangements and matched with the ideal distribution. The transverse and shear moduli showed variation for all three random microstructures with the square diagonal showed the most variation. The failure surfaces for three different material systems subjected to three different loading combinations exhibited variation. The square diagonal packaging showed the highest variation of failure. The square and hexagonal showed consistent variation throughout all 65
86 of the failure surfaces. For future work, more fibers will be considered to see the dependence on the number of fibers, and a full random RVE will be used so there are no biases to the underlying base microstructure. The results from this work can be used within a FEA model to give a probability of failure within the structure. 66
87 Chapter 4 AN EXPLICIT MULTISCALE MODEL FOR PROGRESSIVE FAILURE OF COMPOSITE STRUCTURES 4.1. Introduction With growing use of composites in the aerospace industry, new and improved damage modeling techniques need to be developed to better characterize these materials. There have been many instances where low speed impacts, such as bird strikes, tool drops, etc. have caused damage to airplane structures. In order to understand the structural behavior during impact and the amount of damage that occurs, it is also critical to understand the effect of damage initiation and its evolution on the structural system itself. Although a significant volume of work has been reported in impact damage detection (i.e. Tsuda, et al., 2004; Aymerich & Staszewski, 2010; Sultan, et al., 2011), there is a need to develop physics based multiscale modeling techniques to understand impact damage in composites. Recently, the need for multiscale models within the framework of structural health management (SHM) has been recognized (Chattopadhyay, et al., 2009). In particular, physics based models are necessary for describing the nonlinear structural and sensor/actuator response in active sensing techniques employed in SHM approaches. Therefore, the development of these techniques are not only important to gain insight into the damaged state of the material, the output from the analysis can be combined with sensor data to establish more robust SHM framework. To be of maximum benefit, these models must integrate the necessary length scales critical for damage evolution, account 67
88 for sensor/host structure coupling in active sensing, and be computationally efficient for on-line health management (Farrar & Worden, 2007). This chapter describes a multiscale modeling framework to investigate wave propagation and attenuation in complex composites subjected to impact damage. The procedure is based on the Generalized Method of Cells (GMC) micromechanics model, implemented within NASA's Micromechanics Analysis Code (MAC/GMC) (Bednarcyk & Arnold, 2002), which is linked to the general purpose finite element analysis (FEA) software, ABAQUS. This linkage between MAC/GMC and ABAQUS is via FEAMAC (Bednarcyk & Arnold, 2007). FEAMAC is used to induce damage at the microlevel, which is propagated to the macrolevel using a UMAT routine in ABAQUS/Standard. This method shows efficacy when the loading is well defined and is linear. However, when composites are subject to impact loading, the nonlinear contact force interaction between the projectile and the structure limits the application of the implicit FEA analysis. Therefore, there is a need to further extend the multiscale analysis framework. In this work, a VUMAT utilizing MAC/GMC micromechanics model will be coupled with ABAQUS/Explicit to conduct impact damage modeling on a composite beam and composite airfoil. Wave propagation studies for the composite beam will be investigated to show the effects of boundary conditions on wave dispersion. The impact damage model will also be verified using experiments conducted on composite plates and airfoils. 68
89 4.2. Analysis Micromechanics model The micromechanics model that is employed in this study is the generalized method of cells (GMC) (Paley & Aboudi, 1992). The doubly periodic version of this model, which enables analysis of continuous fiber composites such as those considered herein, employs a repeating unit cell to represent the composite geometry. The rectangular repeating unit cell, depicted in Figure 4.1, consists of an arbitrary number of rectangular subcells, denoted by the indices ( ), each of which may contain a distinct homogeneous material. The local (subcell) constitutive equation for the model is given by, I T σ C ε ε ε (4.1) where σ is the vector of average subcell stresses, C is the subcell elastic I T stiffness matrix, and ε, ε, and ε are the vectors of average subcell total strain, inelastic strain, and thermal strain, respectively. 69
90 x l l l l l h x h h h x h Figure 4.1. Repeating unit cell considered by the doubly periodic GMC micromechanics theory. The basic assumption in GMC is that the displacement vector in each subcell varies linearly with the local subcell coordinates ( y center of each subcell,, y 2 3 ) located at the ui Wi 00 y2 Wi 10 y3 Wi 01 (4.2) The GMC formulation involves imposition of continuity of displacements and tractions between adjacent subcells and repeating unit cells in an integral, or average, sense. In the original work of Paley and Aboudi (1992), this procedure resulted in a system of 6N N linear algebraic equations in which the strains in the subcells, which are constant within each subcell, serve as the basic unknown N N quantities. Note that and are the number of subcells within the repeating unit cell in the two in-plane directions (see Figure 4.1). The GMC equations have been computationally optimized by Pindera and Bednarcyk (1999) such that subcell stress components serve as the unknown variables, which lead to an 70
91 alternative system of linear algebraic equations with only N N equations plus additional decoupled equations, assuming at most orthotropic local subcell behavior. This reduced number of unknown quantities (e.g., degrees of freedom) provides GMC with a high level of computational efficiency. This system of equations (involving the normal stress components) can be written as, m I T GT f f f (4.3) while the additional decoupled equations, involving the shear stress components, can be written as, m I m I m I G T f f, G T f f, G T f f (4.4) ~ G ij ( ) In Equation (4.4), the G matrix and the terms contain information on the subcell material elastic properties and the subcell dimensions; the T vector T ij ( ) m and the terms, are the unique subcell stress components; the f vector and the m f ij terms contain information on the repeating unit cell dimensions and the I I ( ) global (unit cell) strains; the f vector and the terms contain the inelastic f ij effects; and the T f vector contains the thermal effects. Once Equations (4.3 and 4.4) are solved, the local stress and strain fields throughout the repeating unit cell can be determined from the standard kinematics equations and the local constitutive equation, Equation (4.1). Then the terms in the global constitutive equation, I T σ C ε ε ε (4.5) can be determined using the definition of average (global) stress, 71
92 1 N N σ hl hl σ (4.6) 1 1 I T where C is the average or effective stiffness matrix and ε, ε, and ε are the average or effective total, inelastic, and thermal strain vectors, respectively. Equation (4.5) is the effective (macro) constitutive equation for the homogenized composite material represented by the GMC repeating unit cell. It allows one to impose an admissible combination of global stress and strain components, in addition to spatially constant thermal loading, and to determine the remaining global stresses and strains acting on the composite material. Then, via Equations (4.3 and 4.4) the local stress and strain fields can be determined as well. These local-global fields constitute the complete micromechanics solution FEAMAC FEAMAC interfaces MAC/GMC with the commercial software ABAQUS by employing a user-defined material, UMAT or VUMAT, depending on the analysis. This framework and its experimental comparisons have been demonstrated by Bednarcyk and Arnold (2007). The flowchart in Figure 4.2 demonstrates the interaction between FEAMAC and ABAQUS. The FEAMAC subroutine is called for every integration point within the finite element model for which a MAC/GMC material has been assigned. Originally, FEAMAC was only compatible with the implicit solver ABAQUS/Standard. A flowchart depicting the interaction between the new explicit solver, comprising coupling of ABAQUS/Explicit and the VUMAT, is shown in Figure


93 Figure 4.2. FEAMAC flowchart showing interaction of ABAQUS and MAC/GMC. (Bednarcyk & Arnold, 2007) Figure 4.3. ABAQUS/Explicit VUMAT flowchart. Pineda et al. (2009) are credited with developing the explicit formulation of FEAMAC. Their formulation could only accommodate two-dimensional shell elements; this work extends FEAMAC to continuum shell elements so that piezoelectric actuator/sensors can be accurately modeled. Since there were 73
94 numerous problems associated with the logistics of modeling structures to the element surface of 2D shell elements, continuum elements are used here to allow for accurate geometric representation of the piezoelectric actuator and sensors Test setup Experimental setup: Composite beam To validate the multiscale model, experimental data was collected by impact testing composite samples. This work was performed in conjunction with Reynolds and Chattopadhyay (2008). A [(0 /90 ) 4 ] s graphite\epoxy beam specimen, geometrically depicted in Figure 4.4, was chosen since the ply layup is common in aerospace structures. The experimental tests were performed on a standard drop weight impact frame using a 15.9 kg impact head. The impact energy was varied by changing the drop to result in impact velocities, ranging from 1.71 to 2.53 m/s. The beam specimens were supported in a simply supported 3 point bending setup with mm span between supports. Figure 4.5 shows a beam specimen loading in the experimental apparatus. The impactinduced damage ranged from no visible damage to visible fiber breakage and delaminations. Active wave propagation was used as a comparison between the healthy and damaged states. A 4.5 cycle burst wave analyzed the beam with a frequency of 25 khz to interrogate the damaged area. 74

95 Figure 4.4. Test sample and impacting head dimensions. Figure 4.5. Experimental apparatus setup Model setup: Composite beam The finite element model mimics the geometry and displacement boundary conditions of the test specimen. The first step of the finite element analysis models the drop weight impact experiment. Figure 4.6 shows the model assembly. A homogenized stacking sequence of [0 /90 /90 /0 ] was employed to reduce the computation costs. The fiber matrix geometry was modeled as a 2x2 unit cell architecture within MAC/GMC. Only the contact area of the impact 75

96 head was modeled with additional distributed mass to reflect the actual mass of the experimental impact head. An initial velocity was assigned to the impact head and general frictionless hard contact was assumed. The material properties were unknown; therefore generic graphite and matrix properties for the preimpregnated composite were assumed, Table 4.1. Figure 4.6. Composite beam model assembly. Table 4.1. Composite beam simulation constituent material properties E L (GPa) E T (GPa) ν L ν T G (GPa) α L (10-6/ C) α T (10-6/ C) Graphite Fiber Polymer Matrix Since piezoelectric elements are unavailable within ABAQUS\Explicit, a concession was needed to get comparable sensor signals. First, to get the actuation signal, radial surface tractions were applied with the burst waveform to the adhesive layer. This resulted in wave propagation results, which are similar to those obtained using ABAQUS\Implicit model using piezoelectric actuation. For 76
97 sensing, a lead zirconate titanate sensor (PZT) was attached to the beam specimen with an adhesive layer Experimental setup: Composite airfoil A [(0/90)] s unidirectional graphite\epoxy was used for the airfoil skins. The airfoils were manufactured with FiberGlast unidirectional carbon fiber fabric in a wet layup with Hexion Epon E 863 resin and Hexion Epi-cure 3290 hardener. The airfoils were made to mimic NACA 0012 shape with an 11-inch cord length and a 17-inch span, Figure 4.7. The airfoil was impacted at a location corresponding to mid chord and mid span. Two different airfoils were tested, a hollow and a foam core. The hollow airfoil was designed and manufactured using an Aquapour mold made by Advanced Ceramics Manufacturing. A composite skin was then laid up over the mold and once the composite was cured, the core was removed by dissolving the mandrel with water, Figure 4.8 (a). The foam core airfoil was made in a similar fashion by wrapping the composite around a foam mandrel. This mandrel was made from an 8 lb/ft 3 density polyurethane foam from US Composites, Figure 4.8 (b). 77


98 Figure 4.7. Simulation and experimental airfoil size. Figure 4.8. (a) Hollow and (b) foam airfoils. Figure 4.9 shows a representation of the impact setup for the experiment. A modified Charpy impactor was used with a 35 mm hemispherical impact head. The impact velocities were 3.65 m/s and 5.96 m/s, which produced impact energies of 46.6J and 124.3J, respectively. The airfoil was supported at both ends 78

99 with a rigid fixture. The resulting impacts provided a range of damage, from no visible damage to visible fiber breakage and delamination. Figure 4.9. Experimental apparatus setup for airfoil impact Material characterization: Composite airfoil Material characterization of the resin was performed to obtain the full stress-strain relationship. For tension, compression, and shear, the tests show that the Epon E 863 polymer behaved with a slight plastic hardening until the ultimate stress, followed by softening until failure. Bodner-Partom viscoplasticity theory, built within MAC\GMC, was chosen to model the epoxy matrix (Equations 4.7, 4.8, and 4.9). The MAC\GMC Bodner-Partom epoxy fitted model is compared with the experimental data in Figures 4.10, 4.11 and The tension and compression stress-strain curves show that the elastic modulus and peak stresses are different due to hydrostatic pressure effects in the polymer matrix. Since there is no constitutive model within MAC\GMC that can reproduce different moduli 79
 (4.7) (4.8) (4.9) Figure 4.")
100 and failure stress, a compromise is made to fit the two. The material properties that were used in the simulation for the Epon E 863 epoxy and FiberGlast fiber is shown in Table 4.2. ( ) (4.7) (4.8) (4.9) Figure Experimental and MAC\GMC Bodner-Partom fitted tensile stressstrain response of Epon E 863 resin. 80


101 Figure Experimental and MAC\GMC Bodner-Partom fitted compressive stress-strain response of Epon E 863 resin. Figure Experimental and MAC\GMC Bodner-Partom fitted shear stressstrain response of Epon E 863 resin. 81
102 Table 4.2. Material properties for Epon E 863 epoxy and FiberGlast carbon fiber. Epon E 863 Epoxy FiberGlast Fiber E (GPa) ν D 0 (s -1 ) Z 0 (MPa) Z 1 (MPa) x E A (GPa) E T (GPa) ν A ν T G A (GPa) m n The two parallel supports clamping the edges of the airfoil during the experiment were modeled as simply supported along two inches of each edge. Since the VUMAT material elements within ABAQUS take considerably more time than the linear elastic material elements, only a 4x4 inch area is analyzed for damage, Figure The remaining airfoil elements were modeled as linear elastic elements with the ply properties calculated with MAC\GMC. Figure 4.13 shows the different element types that were used in the simulation. The foam material and steel impactors are solid elements with the properties shown in Table 4.3. The foam was assumed to deform elastically without any damage. 82
 method to quantify the damage of the impacted composite beams.")
103 Figure Element types within airfoil simulation. Table 4.3. Material properties for impact head and foam core. E (GPa) ν Steel Foam Results Experimental results: Composite beam The experimental results showed damage of various amplitudes corresponding to different impact velocities. Flash thermography imaging was used as a non-destructive evaluation (NDE) method to quantify the damage of the impacted composite beams. This technique uses a flash lamp to provide instantaneous heat flux to the surface of the specimen and uses an infrared camera to capture the response. Differences in the temperature field within the response are an indicator of damage. Figure 4.14 shows the area captured by the flash thermography infrared camera and shows increasing damage (white area) with 83

104 increased impact speed. Piezoelectric actuator/sensors were also used to interrogate the damage. This technique uses piezoelectric patches to apply an actuation wave to the specimen while other piezoelectric patches detect the propagated wave. Differences between a healthy base signal and a damaged signal is an indicator of damage. Figure TWI EchoTherm images of damaged composite beam subjected to various impact velocities Modeling results: Composite beam The numerical modeling results presented in Figures 4.15, 4.16 and 4.17 show varying damage with different impact velocities. The top ply of the composite beam shows good correlation with the experimental results of the flash thermography. The damaged area is about as wide as the impactor towards the center of the beam, but there was a considerable amount of damage along the 84

105 edges. The experimental results showed more damage along the edges when compared to presented numerical results. This could be attributed to damages induced during the manufacturing and fabrication of the composite specimens. Small imperfections provide hot spots for damage to nucleate and propagate, and which the model does not reflect. Figure Impact with 1.71m/s impact velocity. 85
106 Figure Impact with 2.1m/s impact velocity. Figure Impact with 2.53m/s impact velocity. 86
107 It can be seen that as the impact velocity increases, so does the damage. Also, all cases of impact show a reduced amount of damage for the 90 inner plies. This may be attributed to the 90 plies being located at the neutral axis of the laminate and carrying less bending stresses. For all impact speeds, the bottom layer sustains the most damage. This happens because the bending of the composite at the bottom ply will cause large tensile strains resulting in damage. The model and the experimental data correlates qualitatively; this can be attributed to the fact that the experimental impact may not match the simulated impact. It appears that in the experiment the head does not impact uniformly across the surface; a corner of the impact head hits first for the 1.71 and 2.1 m/s impact cases and does not appear for the 2.53 m/s impact Active wave propagation: Composite beam For the composite beam wave propagation modeling, simply supported boundary conditions are used at the end of the beam to mimic the wave propagation experiment. The damaged material properties from the impact model were transferred to a new discretized mesh for the wave propagation model. The material properties were provided by MAC/GMC for the reduced stiffness caused from the impact damage, Figure There were four different material properties used in the wave propagation based on the amount of subcells damaged. 87

108 Figure Example of material properties transferred from impact model to wave propagation model. This example is for the 2.53 m/s impact. The wave propagation modeling starts with configuration of the piezoelectric sensors. The actuator generates the burst signal, which is received by the sensor located on the other side of the impacted area. The actuator and sensor placement is shown in Figure 4.19 (a). To visualize the wave generated by the actuator, the out-of-plane displacement is plotted in Figure 4.19 (b-d). Figure 4.19 (b) shows the wave generated by the actuator. Figure 4.19 (c) shows the wave as it has progressed through the damaged area. Figure 4.19 (d) shows how the wave has propagated through the entire composite beam with multiple reflections. 88
 Initial state showing actuator and sensor, (b) initial wave actuation, (c) wave initially passing through damaged are, (d) fully saturated wave with many")
109 Figure Composite beam wave propagation (a) Initial state showing actuator and sensor, (b) initial wave actuation, (c) wave initially passing through damaged are, (d) fully saturated wave with many reflections. Figure 4.20 shows the experimental sensor signals for the healthy state and the after impact (three impact velocities). Some variations in amplitude and are observed between the waves. Figure 4.21 shows the simulated sensor signals for the corresponding states (healthy and three impact cases). The simulated signals also show variations in the amplitude and other smaller differences. 89

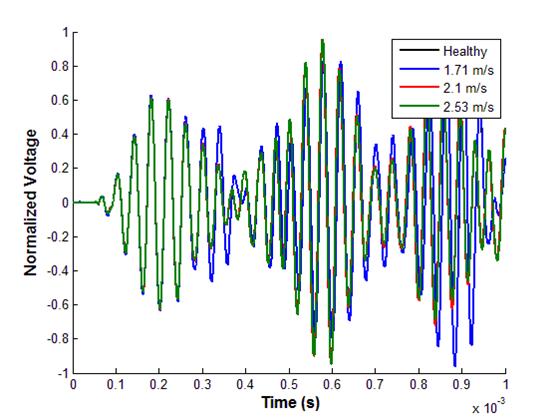
110 Figure Experimental signals for healthy, 1.71 m/s, 2.1 m/s, and 2.53 m/s impact damage states. Figure Simulated signals for healthy, 1.71 m/s, 2.1 m/s, and 2.53 m/s impact damage states. 90
111 Trying to interpret these signals in the time domain can be difficult. In order to easily see the differences, a fast Fourier transform (FFT) is applied to transform the signal into the frequency domain and this shows which frequencies are prevalent in the signal. Figure 4.22 shows that there is a more visible difference between the healthy and damaged states within the experiment. The healthy and 1.71 m/s impact cases have their central frequencies very close to one another, centered on the 25 KHz actuation signal. The higher impact velocities, 2.1 and 2.53 m/s, show the peak shifting to the right. This indicates that the increase in damage area has shifted this frequency. There are also some minor changes to the other frequencies present in the signal. Figure Experimental fast Fourier transform (FFT) of the acquired signals for the healthy and damaged states for three separate impacts. 91
112 Figure 4.23 points to the fact that the FFT of the simulated signals shows some similarities with the experimental signals. The simulated signals show that the healthy and 1.71 m/s impact cases have a similar main peak around 25 KHz. Once again the 2.1 and 2.53 m/s impact cases show shift in this peak (to the right). The simulation results also show minor changes in the smaller energy components of the FFT. The results indicate that the simulated sensor signals can be used to detect the presence of impact damage. Figure Simulated fast Fourier transform (FFT) of the acquired signals for the healthy and damaged states for three separate impacts Experimental results: Composite airfoil Simulation results show that because of its overall flexibility, the hollow airfoil has a larger stress distribution, Figure Figure 4.25 shows more stress concentration around the impact site in the foam core airfoil. There is also a 92

113 secondary stress concentration at the leading edge of the airfoil, in line with the impact site of both airfoils. The von Mises stress distributions for the foam core airfoil are very similar for both impact speeds; however, the stress magnitude is almost double for the 5.96 m/s impact. Figure Von Mises stress distribution for hollow airfoil with 3.65 and 5.96 m/s impact. Figure Von Mises stress distribution for foam core airfoil with 3.65 and 5.96 m\s impact. The damage induced by the impact for both impact levels of the hollow airfoil is shown in Figures 4.26 and For the slower 3.65 m/s impact, there is very little damage to the top and middle plies. The bottom ply has a concentration of damage at the location of the impact. For the higher impact speed of 5.96 m/s, 93

114 there was considerably more distributed damage to the top and middle plies, with a majority of that damage occurring towards the leading edge. There was also heavier damage around the impact location of the top and middle plies. Figure Damage of impacted area for the hollow airfoil with a 3.65 m/s impact. 94
115 Figure Damage of impacted area for the hollow airfoil with a 5.96 m/s impact. The comparison between the experiments and simulations of the hollow airfoil was difficult. The simulation considered perfect bonding and damage occurring only in the designated area. In the experiments, however, no damage could be detected with the naked eye and with the TRI EchoTherm at the impact site. There was some damage to the leading edge (cracking) and more to the trailing edge (delaminations). The manufacturing process was seen to cause the majority of the problems. It was difficult to adhere the trailing edge of the airfoil to itself, which caused the edge to delaminate. The damage induced by the impact for both impact levels of the hollow airfoil is shown in Figures 4.28 and Comparing the simulated damage of the two airfoils, there is considerably more damage at the impact site of the foam core 95
116 airfoil. This can be attributed to the overall elastic stiffness the foam added to the airfoil. This caused the impact energy to be more concentrated in the impact location. The hollow airfoil flexed more and dissipated the impact energy with this flexing. For the 3.65 m/s impact, the layer with the highest amount of damage for the foam core airfoil is the bottom 0 layer. This damage is located directly below the impact. The damage distribution at the top 0 layer follows the same trend as the middle 90 layer, but with a higher magnitude. The shape of the distributed damage is in an X shape on the top 0 layer, with the middle layer displaying similar characteristics. The bottom 0 layer shows a distribution of damage towards the leading edge, but none towards the trailing edge. Figure Damage of impacted area for the foam core airfoil with a 3.65 m/s impact. 96
117 Figure Damage of impacted area for the foam core airfoil with a 5.96 m/s impact. For the 5.96 m/s impact, the damage was greater for all the plies, compared with the 3.65 m/s impact. The bottom 0 ply had the most damage, with up to 3 subcells of damage, which means that the entire matrix was damaged and only the fiber was intact at this area. The shape of the distributed damage for the 5.96 m/s impact was also similar to that of the 3.65 m/s impact. The magnitude of the damage increased as shown by the X shape in all the plies. The difference between the hollow and foam core airfoil was the absence of damage to the trailing edge of the foam core. The composite skin was attached to the foam with epoxy and did not show any delamination in the trailing edge as was seen in the hollow airfoil. 97

118 A comparison of the simulated and experimental impact damage of the foam core airfoil is shown in Figures 4.30 and The EchoTherm detects minor damage in the 3.65 m/s impact. The simulation shows a higher distribution of damage, but the higher damaged regions correspond to the experimental damage. An examination of the EchoTherm images shows a series of images after the heat impulse on the surface. For this impact, the damage can be seen in the initial series of images, which indicates the presence of surface damage only. The experimental EchoTherm images from the 5.96 m/s impact demonstrate that there is good agreement with the simulated damage. For the entire series of images there was evidence of damage, which correspond to the simulation showing high damage in all of the layers. In order for the experimental and simulated results to match up the damage threshold should be increased. Figure Comparison of damage between the experiment and simulation for the 3.65 m/s impact. 98

119 Figure Comparison of damage between the experiment and simulation for the 5.96 m/s impact Conclusion The predicted impact damage using micromechanics failure theories within MAC\GMC shows good correlation with experimental data for both the composite beam and composite airfoils. There are slight differences between the model and experiment that could be attributed to the initial states of the composite beams. For both the experimental and simulated composite beam, it can also be seen that the damage nucleates around the impact area and spreads along the edges. After the impact damage was induced, the wave propagation model showed good agreement between the experimental and simulated signals. In the FFTs, there were similar peak shifts for both the experimental and simulated waves for the higher impact velocities. 99
120 The impact damage to the airfoils was over-predicted for both the impact speeds. The hollow airfoil experimentally showed no damage in the impact area, but this could be attributed to manufacturing problems. Most of the impact energy was dissipated by a delamination at the trailing edge and cracking at the leading edge. The foam core airfoil did not show this damage since the foam core was attached with epoxy to the composite skin. This made the foam core airfoil more rigid and caused most of the impact energy to be concentrated around the point impact. For impacting a composite beam, applying the same boundary conditions for both the impact and wave propagation should be considered so the model could be run in one simulation. Also, increasing the number of MAC/GMC elements, to cover the entire damage zone, will improve the accuracy. The use of these elements at the leading and trailing edge could help correlate the damage for the hollow airfoil. 100
121 Chapter 5 COUPLED ATTENUATION AND MULTISCALE DAMAGE MODEL FOR COMPOSITE STRUCTURES 5.1. Introduction Lamb wave behavior in composite specimens is a complex phenomenon due to varying attenuation as a function of direction and the presence of a number of scattering sources. It is well known that incident wave energy is scattered by the fiber and matrix interface during elastic wave propagation within composite structures. This type of scattering occurs because the wave is subjected to a sudden change in stiffness between the fiber and the matrix, and also due to the curvature of the fiber. Consequently, the amplitude attenuation of induced waves increases in composite specimens. The characteristics of attenuation in healthy structures change once additional scattering surfaces, which are attributed to damage, are introduced. The types of damage that cause these changes include fiber-matrix debonding, matrix cracking, interlaminar delamination, and fiber breakage. In structural health monitoring (SHM) applications, this change in attenuation can be used to indicate the presence of damage. Thus it is important to develop an accurate model to characterize attenuation in composites for varying levels of induced damage. Yang and Norris (1991) developed an analytical model that calculated attenuation for a single fiber subjected to crack at the fiber-matrix interface. Gurevich et al. (1998) calculated the attenuation within a poroelastic medium by incorporating ellipsoidal inclusions. Liu and Kriz (1998) calculated the 101
122 attenuation within composites that have interfacial cracks. Lonne et al. (2003) developed a model that calculated losses in attenuation due to scattering as well as viscoelastic losses. Although these models have shown good correlation with experiments, they are not coupled with physics based analysis, and therefore cannot be used to accurately capture the relationship between increased damage and attenuation. An integrated procedure capturing damage nucleation and evolution as well as wave attenuation is necessary to accurately characterize wave propagation in composites. In this chapter, the wave attenuation in composites is investigated through a multiscale analysis. The damage at the micro level is simulated using a micromechanics analysis, known as the Generalized Method of Cells (GMC). This is coupled with a single fiber-scattering formulation that calculates the attenuation of a fiber within a matrix with debonding between the fiber and the surrounding matrix. Results from the simulations are compared with experiments for stress-strain response and also for the attenuation Progressive damage Progressive damage for the simulation is induced at the micro level within MAC\GMC. In this progressive damage model when any of the subcells fail, the stiffness is reduced to nearly zero. This in turn reduces the overall stiffness of the repeating unit cell, RUC, and causes progressive damage. The failure theory that visually performed the best at predicted failure, and is used in this work, was the Tsai-Wu criterion; it was applied within the model on the fiber/matrix constituent level. 102

123 Single fiber scattering The single fiber scattering of a debonded fiber subjected to shear waves, originally developed by Yang & Norris (1991), is further extended in this work. The schematic of the fiber is shown in Figure 5.1. Based on symmetry, just half of the fiber is modeled. The crack is centered along the origin of the reflected direction θ. The half-crack length is denoted by the angle δ. The incident wave angle is denoted as θ 0. Figure 5.1. Single fiber schematic for single crack. The full scattering equation is expressed as follows. F(, ) F (, ) F (, ) F (, ) (5.1) (0) (1) (1) 0 0 S 0 A 0 where F (0) is the scattering from the healthy structure, F S (1) is the symmetric scattering of debonded fiber, and F (1) A is the antisymmetric scattering of the fiber. These scattering terms are described in depth by Yang and Norris (1991). Using MAC\GMC, it was observed that when in-plane loading was used the damage was symmetric at the top and bottom of the fiber, Figure 5.2. The crack starts at the top and bottom and propagates to the sides. In order to account 103


124 for these two symmetric cracks in the scattering equation, superposition is used on the original symmetric crack formulation, Figure 5.3. The original symmetric crack coordinate system was rotated to show that the scattering is similar for both cracks except for the angle of incidence and the angle where the scattering is measured. Figure 5.2. Symmetric crack growth due to in plane loading for 90 ply before and after first subcell failure. Figure 5.3. Schematic showing super position of two separate cracks to add up to symmetric crack. 104
125 The modified scattering equation is as follows. F(, ) F (, ) F (, ) F (, ) (0) (1) (1) 0 0 S 0 A 0 F (, ) F (, ) F (, ) (0) (2) (2) 0 S 0 A 0 (5.2) where F (0) is the scattering from the healthy structure, F (1) S and F (1) A are the symmetric and antisymmetric scattering of debonded fiber in the first orientation, respectively. F (2) S and F (2) A are the symmetric and antisymmetric scattering of debonded fiber in the second orientation, respectively. The rotated coordinate system is transformed into the original coordinate system by, 0 0 (5.3) Combining Equations 5.2 and 5.3, the final scattering equation is obtained. F(, ) 2 F (, ) F (, ) F (, ) (0) (1) (1) 0 0 S 0 A 0 F (, ) F (, ) (2) (2) S 0 A 0 (5.4) It must be noted that the limits for the crack length within the original scattering function were 0-π, and with the two cracks, the limits become 0-π/ Implementation Experiments Experimental validation of the model was conducted using (90/0) s graphite\epoxy samples. The tensile samples were manufactured with FiberGlast unidirectional carbon fiber fabric in a wet layup with Hexion Epon E 863 resin and Hexion Epi-cure 3290 hardener. The samples were 305 mm in length, mm in width, and 2 mm in thickness. Piezoelectric sensors made from lead zirconate titanate, PZT, are used as both actuators and sensors. APC 860 PZTs 105

126 were used that were 6.25 mm in diameter and.0254 mm thick. Figure 5.4 shows the layout of the actuators, PZT 1 and 2, and the sensors. The distance between PZT 2 and sensor 1 is 28 mm as well as the distance between sensor 1 and sensor 2. PZT 1 is placed directly between sensors 1 and 2. The sensors are optimally placed to maximize the time between the S 0, A 0, and S 0 reflected modes. An MTS desktop frame with a 32 kn capacity and ARAMIS (Trilion Quality Systems, 2012) digital image correlation technique were used for the stress-strain relationship calculations. Figure 5.4. Test sample PZT layout A 4.5 cycle burst wave at frequencies ranging from 50 khz to 300 khz was used as the actuation signal on the composite beam. The experimental value of the attenuation was obtained using an approach similar to Das et. al. (2004), as shown in Equation (5.7) 106
127 (5.7) where R AS1 and R AS2 are the distances between PZT 2 and sensors 1 and 2, respectively. The energy value associated with PZT 1 (in Equations (5.7)) is the transfer function that ensures that the sensors are reading the same signal. The energy value associated with PZT 2 is the actual test signal that finds the difference in signal energy between sensor 1 and sensor Simulation The material tests conducted in chapter 4 that characterize the Epon E 863 polymer material are utilized in this chapter. A Bodner-Partom model was used to describe the plastic nature of the polymer, and the fiber was modeled as transversely isotropic with the properties for both shown in Table 5.1. The neat resin response is shown in the previous chapter, Figures 4.10, 4.11 and For the simulation, a 7x7 RUC was used to model the fiber and the matrix, Figure 5.5. The matrix is allowed to fail according to the Tsai-Wu (Hahn) failure criterion. The crack length between the fiber and the matrix were calculated when the subcells adjacent to the fiber failed. The corresponding angle with respect to subcell failure is shown in Figure
 (GPa) (GPa) 225 15 0.2 0.0714 15 Figure 5.5. Subcell failure and corresponding fiber-matrix crack length. 5.3. Results 5.3.1. Monotonic loading The comparison between the experimental and the MAC\GMC simulation is shown in Figure 5.")
128 Table 5.1. Material properties for Epon E 863 epoxy and FiberGlast carbon fiber. Epon E 863 Epoxy FiberGlast Fiber E (GPa) ν D 0 (s -1 ) Z 0 (MPa) Z 1 (MPa) M n x E A E T ν A ν T G A (GPa) (GPa) (GPa) Figure 5.5. Subcell failure and corresponding fiber-matrix crack length Results Monotonic loading The comparison between the experimental and the MAC\GMC simulation is shown in Figure 5.6. The experimental data was consistent among the three tests but there was a slight difference between the simulation and experiment. The simulation under-predicts the initial failure, which keeps it under the overall experimental curve. The initial elastic and post failure moduli were captured 108
129 Stress (MPa) accurately. The stress-strain curves diverge when the subcell failures occur. The failure stress and strain show good agreement. The stresses corresponding to failure of the subcells and the corresponding crack lengths are shown in Table Figure 5.6. Experimental and simulation results for monotonic loading of (90/0)s composite beam. Sample 1 Sample 2 Sample 3 MAC\GMC Strain (mm/mm) Table 5.2. Crack angle (rad) with corresponding failure stress Crack Length Failure Stress 133 MPa 161 MPa 210 MPa 322 MPa Multiple loading The results of multiple loading cycles on the graphite\epoxy beam showed very good consistency, Figure 5.7. The global stress strain curve was calculated as the load cell readout and the displacement of the crosshead divided by the gage length of the sample. There are two interesting observations to be made here: 109
130 Stress (MPa) First, there is a flat region on the unloading that is present between the first and second unloading. Second, a slight hardening is observed in the modulus for each reloading step. This indicates the presence of residual strain after each loading that is indicative of damage Sample 1 Sample 2 Sample Strain (mm/mm) Figure 5.7. Global stress-strain curve for multiple loading of (90/0)s graphite/epoxy beam. Full field local strain was determined using the ARAMIS system. By taking the strain across the entire sample, a virtual strain gage can be used to calculate the local strain, as shown in Figure 5.8. The red areas in Figure 5.8 (a) are matrix cracks in the outer layer and correspond to visible cracks. For region 1, an overall high strain field is seen in Figure 5.9. A very slight amount of damage was induced during the first loading. A significant level of damage was induced with the second loading, which is shown by the residual strain. When 110

131 comparing the global stress-global strain curve to the local strain curve, no flat regions are observed. Region 2, Figure 5.10, corresponds to the high strain area and shows progressive damage with a slight residual strain after the first loading and moderate residual strain after the second loading. The third region (Region 3), Figure 5.11, is a low strain region. There was no damage during the first loading, but damage was induced during the second loading. As the global stress increases, the local strain decreases. This is due to two effects: 1) the stress is likely to be low in this area and 2) the load is redistributed within the test sample. The elastic modulus for the third loading is similar to the unloading modulus of the second load. This indicates that the area remains elastic after the damage is induced. Figure 5.8. (a) Major strain for loaded sample with virtual strain gage regions. (b) Corresponding sample image. 111
Multiscale Approach to Damage Analysis of Laminated Composite Structures
 Multiscale Approach to Damage Analysis of Laminated Composite Structures D. Ivančević and I. Smojver Department of Aeronautical Engineering, Faculty of Mechanical Engineering and Naval Architecture, University
QUESTION BANK Composite Materials
 QUESTION BANK Composite Materials 1. Define composite material. 2. What is the need for composite material? 3. Mention important characterits of composite material 4. Give examples for fiber material 5.
TABLE OF CONTENTS. Mechanics of Composite Materials, Second Edition Autar K Kaw University of South Florida, Tampa, USA
 Mechanics of Composite Materials, Second Edition Autar K Kaw University of South Florida, Tampa, USA TABLE OF CONTENTS 1. INTRODUCTION TO COMPOSITE MATERIALS 1.1 Introduction... 1.2 Classification... 1.2.1
BIAXIAL STRENGTH INVESTIGATION OF CFRP COMPOSITE LAMINATES BY USING CRUCIFORM SPECIMENS
 BIAXIAL STRENGTH INVESTIGATION OF CFRP COMPOSITE LAMINATES BY USING CRUCIFORM SPECIMENS H. Kumazawa and T. Takatoya Airframes and Structures Group, Japan Aerospace Exploration Agency 6-13-1, Ohsawa, Mitaka,
LAMINATION THEORY FOR THE STRENGTH OF FIBER COMPOSITE MATERIALS
 XXII. LAMINATION THEORY FOR THE STRENGTH OF FIBER COMPOSITE MATERIALS Introduction The lamination theory for the elastic stiffness of fiber composite materials is the backbone of the entire field, it holds
INTERNATIONAL JOURNAL OF APPLIED ENGINEERING RESEARCH, DINDIGUL Volume 2, No 1, 2011
 Interlaminar failure analysis of FRP cross ply laminate with elliptical cutout Venkateswara Rao.S 1, Sd. Abdul Kalam 1, Srilakshmi.S 1, Bala Krishna Murthy.V 2 1 Mechanical Engineering Department, P. V.
Mechanical and Thermal Properties of Coir Fiber Reinforced Epoxy Composites Using a Micromechanical Approach
 Mechanical and Thermal Properties of Coir Fiber Reinforced Epoxy Composites Using a Micromechanical Approach Sandhyarani Biswas Department of Mechanical Engineering, N.I.T Rourkela, INDIA Abstract: Now-a-days,
Computational Analysis for Composites
 Computational Analysis for Composites Professor Johann Sienz and Dr. Tony Murmu Swansea University July, 011 The topics covered include: OUTLINE Overview of composites and their applications Micromechanics
REPORT DOCUMENTATION PAGE
 REPORT DOCUMENTATION PAGE Form Approved OMB NO. 0704-0188 The public reporting burden for this collection of information is estimated to average 1 hour per response, including the time for reviewing instructions,
FINITE ELEMENT ANALYSIS OF COMPOSITE MATERIALS
 FINITE ELEMENT ANALYSIS OF COMPOSITE MATERIALS Ever J. Barbero Department of Mechanical and Aerospace Engineering West Virginia University USA CRC Press Taylor &.Francis Group Boca Raton London New York
PLY LEVEL UNCERTAINTY EFFECTS ON FAILURE OF COMPOSITE
 7th European Workshop on Structural Health Monitoring July 8-11, 2014. La Cité, Nantes, France More Info at Open Access Database www.ndt.net/?id=17206 PLY LEVEL UNCERTAINTY EFFECTS ON FAILURE OF COMPOSITE
Stress, Strain Stress strain relationships for different types of materials Stress strain relationships for a unidirectional/bidirectional lamina
 Chapter 2 Macromechanical Analysis of a Lamina Stress, Strain Stress strain relationships for different types of materials Stress strain relationships for a unidirectional/bidirectional lamina Islamic
ME 582 Advanced Materials Science. Chapter 2 Macromechanical Analysis of a Lamina (Part 2)
") ME 582 Advanced Materials Science Chapter 2 Macromechanical Analysis of a Lamina (Part 2) Laboratory for Composite Materials Research Department of Mechanical Engineering University of South Alabama, Mobile,
ME 582 Advanced Materials Science Chapter 2 Macromechanical Analysis of a Lamina (Part 2) Laboratory for Composite Materials Research Department of Mechanical Engineering University of South Alabama, Mobile,
Coupling of plasticity and damage in glass fibre reinforced polymer composites
 EPJ Web of Conferences 6, 48 1) DOI: 1.151/epjconf/1648 c Owned by the authors, published by EDP Sciences, 1 Coupling of plasticity and damage in glass fibre reinforced polymer composites R. Kvale Joki
Module 7: Micromechanics Lecture 25: Strength of Materials Approach. Introduction. The Lecture Contains. Effective Transverse Modulus
 Introduction In the previous lecture we have introduced the concept of Representative Volume Element or Unit Cell. This is the basic building block in a micromechanical study. Further, we explained the
MECHANICAL FAILURE OF A COMPOSITE HELICOPTER STRUCTURE UNDER STATIC LOADING
 MECHANICAL FAILURE OF A COMPOSITE HELICOPTER STRUCTURE UNDER STATIC LOADING Steven Roy, Larry Lessard Dept. of Mechanical Engineering, McGill University, Montreal, Québec, Canada ABSTRACT The design and
Fracture Mechanics, Damage and Fatigue: Composites
 University of Liège Aerospace & Mechanical Engineering Fracture Mechanics, Damage and Fatigue: Composites Ludovic Noels Computational & Multiscale Mechanics of Materials CM3 http://www.ltas-cm3.ulg.ac.be/
Composite Structures- Modeling, FEA, Optimization and Diagnostics
 Composite Structures- Modeling, FEA, Optimization and Diagnostics Ratan Jha Mechanical and Aeronautical Engineering Clarkson University, Potsdam, NY Composite Laminate Modeling Refined Higher Order Displacement
Development of a Progressive Failure Model for Notched Woven Composite Laminates. Daniel Christopher Munden
 Development of a Progressive Failure Model for Notched Woven Composite Laminates Daniel Christopher Munden Thesis submitted to the faculty of the Virginia Polytechnic Institute and State University in
Micromechanics Based Multiscale Modeling. of the Inelastic Response and Failure of. Complex Architecture Composites. Kuang Liu
 Micromechanics Based Multiscale Modeling of the Inelastic Response and Failure of Complex Architecture Composites by Kuang Liu A Dissertation Presented in Partial Fulfillment of the Requirements for the
MODELING OF THE BEHAVIOR OF WOVEN LAMINATED COMPOSITES UNTIL RUPTURE
 MODELING OF THE BEHAVIOR OF WOVEN LAMINATED COMPOSITES UNTIL RUPTURE Jean Paul Charles, Christian Hochard,3, Pierre Antoine Aubourg,3 Eurocopter, 375 Marignane cedex, France Unimeca, 6 rue J. Curie, 3453
An Elasto-Visco-Plastic Multiscale Model for Fibrous Unidirectional Composite Materials
 An Elasto-Visco-Plastic Multiscale Model for Fibrous Unidirectional Composite Materials by Shari Lynn King A thesis presented to the University of Waterloo in fulfillment of the thesis requirement for
A Stress Gradient Failure Theory for Textile Structural Composites. Final Technical Report submitted to ARO
 A Stress Gradient Failure Theory for Textile Structural Composites Final Technical Report submitted to ARO By RYAN KARKKAINEN and BHAVANI SANKAR University of Florida Department of Mechanical & Aerospace
Crash and Impact Simulation of Composite Structures by Using CAE Process Chain
 Crash and Impact Simulation of Composite Structures by Using CAE Process Chain Madhukar Chatiri 1, Thorsten Schütz 2, Anton Matzenmiller 3, Ulrich Stelzmann 1 1 CADFEM GmbH, Grafing/Munich, Germany, mchatiri@cadfem.de
Materials and Structures. Indian Institute of Technology Kanpur
 Introduction to Composite Materials and Structures Nachiketa Tiwari Indian Institute of Technology Kanpur Lecture 16 Behavior of Unidirectional Composites Lecture Overview Mt Material ilaxes in unidirectional
Impact and Crash Modeling of Composite Structures: A Challenge for Damage Mechanics
 Impact and Crash Modeling of Composite Structures: A Challenge for Damage Mechanics Dr. A. Johnson DLR Dr. A. K. Pickett ESI GmbH EURO-PAM 99 Impact and Crash Modelling of Composite Structures: A Challenge
Overview of Probabilistic Modeling of Woven Ceramic Matrix Composites ABSTRACT
 ABSTRACT An overview of current research efforts in understanding the cause of variability in the thermo-mechanical properties of woven ceramic matrix composites is presented. Statistical data describing
Effect of Thermal Stresses on the Failure Criteria of Fiber Composites
 Effect of Thermal Stresses on the Failure Criteria of Fiber Composites Martin Leong * Institute of Mechanical Engineering Aalborg University, Aalborg, Denmark Bhavani V. Sankar Department of Mechanical
THE MUTUAL EFFECTS OF SHEAR AND TRANSVERSE DAMAGE IN POLYMERIC COMPOSITES
 THE 19 TH INTERNATIONAL CONFERENCE ON COMPOSITE MATERIALS THE MUTUAL EFFECTS OF SHEAR AND TRANSVERSE DAMAGE IN POLYMERIC COMPOSITES L.V. Smith 1 *, M. Salavatian 1 1 School of Mechanical and Materials
Micromechanical analysis of FRP hybrid composite lamina for in-plane transverse loading
 Indian Journal of Engineering & Materials Sciences Vol. 15, October 2008, pp. 382-390 Micromechanical analysis of FRP hybrid composite lamina for in-plane transverse loading K Sivaji Babu a *, K Mohana
2-D biaxial testing and failure predictions of IM7/977-2 carbon/epoxy quasi-isotropic laminates q
 Composite Structures 75 (2006) 60 66 www.elsevier.com/locate/compstruct 2-D biaxial testing and failure predictions of IM7/977-2 carbon/epoxy quasi-isotropic laminates q Jeffry S. Welsh a, *, J. Steven
Enhancing Prediction Accuracy In Sift Theory
 18 TH INTERNATIONAL CONFERENCE ON COMPOSITE MATERIALS Enhancing Prediction Accuracy In Sift Theory J. Wang 1 *, W. K. Chiu 1 Defence Science and Technology Organisation, Fishermans Bend, Australia, Department
Module III - Macro-mechanics of Lamina. Lecture 23. Macro-Mechanics of Lamina
 Module III - Macro-mechanics of Lamina Lecture 23 Macro-Mechanics of Lamina For better understanding of the macromechanics of lamina, the knowledge of the material properties in essential. Therefore, the
In Situ Ultrasonic NDT of Fracture and Fatigue in Composites
 ECNDT 26 - Mo.2.6.5 In Situ Ultrasonic NDT of Fracture and Fatigue in Composites I. SOLODOV, K. PFLEIDERER, and G. BUSSE Institute for Polymer Testing and Polymer Science (IKP), Non-destructive Testing
MESH MODELING OF ANGLE-PLY LAMINATED COMPOSITE PLATES FOR DNS AND IPSAP
 16 TH INTERNATIONAL CONFERENCE ON COMPOSITE MATERIALS MESH MODELING OF ANGLE-PLY LAMINATED COMPOSITE PLATES FOR DNS AND IPSAP Wanil Byun*, Seung Jo Kim*, Joris Wismans** *Seoul National University, Republic
Elastic parameters prediction under dynamic loading based on the. unit cell of composites considering end constraint effect
 Elastic parameters prediction under dynamic loading based on the unit cell of composites considering end constraint effect Wang Meng 1,, Fei Qingguo 1,, Zhang Peiwei 1, (1. Institute of Aerospace Machinery
Calculation of Damage-dependent Directional Failure Indices from the Tsai-Wu Static Failure Criterion
 Van Paepegem, W. and Degrieck, J. (3. alculation of Damage-dependent Directional Failure Indices from the sai-wu Static Failure riterion. omposites Science and echnology, 63(, 35-3. alculation of Damage-dependent
Predicting Failure of Multiangle Composite Laminates
 Predicting Failure of Multiangle Composite Laminates Preliminary discussion (not in textbook): Micromechanics failure analyses vs Macromechanics failure analyses Fiber Architecture of Some Common Composite
Computational Modeling of Adiabatic Heating in Triaxially Braided Polymer Matrix Composites Subjected to Impact Loading via a Subcell Based Approach
 Computational Modeling of Adiabatic Heating in Triaxially Braided Polymer Matrix Composites Subjected to Impact Loading via a Subcell Based Approach Christopher Sorini 1, Aditi Chattopadhyay 1, and Robert
Module 4: Behaviour of a Laminae-II. Learning Unit 1: M1. M4.1 Mechanics of Composites. M4.1.1 Introduction to Mechanics of Composites
 Module 4: Behaviour of a Laminae-II Learning Unit 1: M1 M4.1 Mechanics of Composites M4.1.1 Introduction to Mechanics of Composites The relation between ply uniaxial strengths and constituent properties
THE ROLE OF DELAMINATION IN NOTCHED AND UNNOTCHED TENSILE STRENGTH
 THE ROLE OF DELAMINATION IN NOTCHED AND UNNOTCHED TENSILE STRENGTH M. R. Wisnom University of Bristol Advanced Composites Centre for Innovation and Science University Walk, Bristol BS8 1TR, UK M.Wisnom@bristol.ac.uk
PRELIMINARY PREDICTION OF SPECIMEN PROPERTIES CLT and 1 st order FEM analyses
 OPTIMAT BLADES Page 1 of 24 PRELIMINARY PREDICTION OF SPECIMEN PROPERTIES CLT and 1 st order FEM analyses first issue Peter Joosse CHANGE RECORD Issue/revision date pages Summary of changes draft 24-10-02
Prediction of The Ultimate Strength of Composite Laminates Under In-Plane Loading Using A Probabilistic Approach
 Prediction of the Ultimate Strength of Composite Laminates Under In-Plane Loading Prediction of The Ultimate Strength of Composite Laminates Under In-Plane Loading Using A Probabilistic Approach Tae Jin
TABLE OF CONTENTS CHAPTER TITLE PAGE DECLARATION DEDICATION ACKNOWLEDGEMENT ABSTRACT ABSTRAK
 vii TABLE OF CONTENTS CHAPTER TITLE PAGE DECLARATION DEDICATION ACKNOWLEDGEMENT ABSTRACT ABSTRAK TABLE OF CONTENTS LIST OF TABLES LIST OF FIGURES LIST OF ABBREVIATIONS LIST OF SYMBOLS ii iii iv v vi vii
EFFECT OF THERMAL FATIGUE ON INTRALAMINAR CRACKING IN LAMINATES LOADED IN TENSION
 EFFECT OF THERMAL FATIGUE ON INTRALAMINAR CRACKING IN LAMINATES LOADED IN TENSION J.Varna and R.Joffe Dept of Applied Physics and Mechanical Engineering Lulea University of Technology, SE 97187, Lulea,
INITIATION AND PROPAGATION OF FIBER FAILURE IN COMPOSITE LAMINATES
 THE 19 TH INTERNATIONAL CONFERENCE ON COMPOSITE MATERIALS INITIATION AND PROPAGATION OF FIBER FAILURE IN COMPOSITE LAMINATES E. Iarve 1,2*, D. Mollenhauer 1, T. Breitzman 1, K. Hoos 2, M. Swindeman 2 1
KINK BAND FORMATION OF FIBER REINFORCED POLYMER (FRP)
") KINK BAND FORMATION OF FIBER REINFORCED POLYMER (FRP) 1 University of Science & Technology Beijing, China, niukm@ustb.edu.cn 2 Tsinghua University, Department of Engineering Mechanics, Beijing, China,
KINK BAND FORMATION OF FIBER REINFORCED POLYMER (FRP) 1 University of Science & Technology Beijing, China, niukm@ustb.edu.cn 2 Tsinghua University, Department of Engineering Mechanics, Beijing, China,
*Corresponding author: Keywords: Finite-element analysis; Multiscale modelling; Onset theory; Dilatational strain invariant.
 18 TH INTERNATIONAL CONFERENCE ON COMPOSITE MATERIALS MICROMECHANICAL MODELLING OF TEST SPECIMENS FOR ONSET OF DILATATIONAL DAMAGE OF POLYMER MATRIX IN COMPOSITE MATERIALS T. D. Tran 1, D. Kelly 1*, G.
Composite models 30 and 131: Ply types 0 and 8 calibration
 Model calibration Composite Bi-Phase models 30 and 3 for elastic, damage and failure PAM-CRASH material model 30 is for solid and 3 for multi-layered shell elements. Within these models different ply types
Open-hole compressive strength prediction of CFRP composite laminates
 Open-hole compressive strength prediction of CFRP composite laminates O. İnal 1, A. Ataş 2,* 1 Department of Mechanical Engineering, Balikesir University, Balikesir, 10145, Turkey, inal@balikesir.edu.tr
DYNAMIC FAILURE ANALYSIS OF LAMINATED COMPOSITE PLATES
 Association of Metallurgical Engineers of Serbia AMES Scientific paper UDC:669.1-419:628.183=20 DYNAMIC FAILURE ANALYSIS OF LAMINATED COMPOSITE PLATES J. ESKANDARI JAM 1 and N. GARSHASBI NIA 2 1- Aerospace
PREDICTION OF OUT-OF-PLANE FAILURE MODES IN CFRP
 PREDICTION OF OUT-OF-PLANE FAILURE MODES IN CFRP R. R. Pinto 1, P. P. Camanho 2 1 INEGI - Instituto de Engenharia Mecanica e Gestao Industrial, Rua Dr. Roberto Frias, 4200-465, Porto, Portugal 2 DEMec,
RATE-DEPENDENT OFF-AXIS COMPRESSIVE STRENGTH OF A UNIDIRECTIONAL CARBON/EPOXY LAMINATE AT HIGH TEMPERATURE
 16 TH INTERNATIONAL CONFERENCE ON COMPOSITE MATERIALS RATE-DEPENDENT OFF-AXIS COMPRESSIVE STRENGTH OF A UNIDIRECTIONAL CARBON/EPOXY LAMINATE AT HIGH TEMPERATURE Masamichi KAWAI *, Satoru SAITO **, Jian-Qi
VALIDATION of CoDA SOFTWARE for COMPOSITES SYNTHESIS AND PRELIMINARY DESIGN (or GETTING COMPOSITES USED - PART 2 )
") VALIDATION of CoDA SOFTWARE for COMPOSITES SYNTHESIS AND PRELIMINARY DESIGN (or GETTING COMPOSITES USED - PART 2 ) Graham D Sims and William R Broughton Composites Design Data and Methods, Centre for Materials
VALIDATION of CoDA SOFTWARE for COMPOSITES SYNTHESIS AND PRELIMINARY DESIGN (or GETTING COMPOSITES USED - PART 2 ) Graham D Sims and William R Broughton Composites Design Data and Methods, Centre for Materials
SIMULATION OF PROGRESSIVE FAILURE PREDICTION OF FILAMENT WOUND COMPOSITE TUBES SUBJECTED TO MULTIPLE LOADING WITH MEMBRANE-FLEXION COUPLING EFFECTS
 VOL. 5, NO. 4, APRIL 010 ISSN 1819-6608 006-010 Asian Research Publishing Network (ARPN). All rights reserved. SIMULATION OF PROGRESSIVE FAILURE PREDICTION OF FILAMENT WOUND COMPOSITE TUBES SUBJECTED TO
Chapter 2 - Macromechanical Analysis of a Lamina. Exercise Set. 2.1 The number of independent elastic constants in three dimensions are: 2.
 Chapter - Macromechanical Analysis of a Lamina Exercise Set. The number of independent elastic constants in three dimensions are: Anisotropic Monoclinic 3 Orthotropic 9 Transversely Orthotropic 5 Isotropic.
Strength of GRP-laminates with multiple fragment damages
 Strength of GRP-laminates with multiple fragment damages S. Kazemahvazi, J. Kiele, D. Zenkert Kungliga Tekniska Högskolan, KTH 100 44 Stockholm, Sweden sohrabk@kth.se SUMMARY The strength of glass fibre
DAMAGE SIMULATION OF CFRP LAMINATES UNDER HIGH VELOCITY PROJECTILE IMPACT
 18 TH INTERNATIONAL CONFERENCE ON COMPOSITE MATERIALS DAMAGE SIMULATION OF CFRP LAMINATES UNDER HIGH VELOCITY PROJECTILE IMPACT A. Yoshimura 1*, T. Okabe, M. Yamada 3, T. Ogasawara 1, Y. Tanabe 3 1 Advanced
BEARING STRENGTH ASSESSMENT OF COMPOSITE MATERIAL THROUGH NUMERICAL MODELS
 BEARING STRENGTH ASSESSMENT OF COMPOSITE MATERIAL THROUGH NUMERICAL MODELS Euler S. Dias*, Carlos A. Cimini Jr.* * Federal University of Minas Gerais, Dept. of Structural Engineering, Belo Horizonte -
Composite Damage Material Modeling for Crash Simulation: MAT54 & the Efforts of the CMH-17 Numerical Round Robin
 Composite Damage Material Modeling for Crash Simulation: MAT54 & the Efforts of the CMH-17 Numerical Round Robin 2014 Technical Review Bonnie Wade (UW) Prof. Paolo Feraboli AMTAS (JAMS) Crashworthiness
UNCONVENTIONAL FINITE ELEMENT MODELS FOR NONLINEAR ANALYSIS OF BEAMS AND PLATES
 UNCONVENTIONAL FINITE ELEMENT MODELS FOR NONLINEAR ANALYSIS OF BEAMS AND PLATES A Thesis by WOORAM KIM Submitted to the Office of Graduate Studies of Texas A&M University in partial fulfillment of the
A STRUCTURE DESIGN OF CFRP REAR PRESSURE BULKHEAD WITHOUT STIFFENERS
 Xi an, 2-25 th August 217 A STRUCTURE DESIGN OF CFRP REAR PRESSURE BULKHEAD WITHOUT STIFFENERS LI Zhongyang 1, LI Dong 2 Mailbox72-35, Yanliang District, Xian, China, Email: zhongyangli@live.com Keywords:
Alternative numerical method in continuum mechanics COMPUTATIONAL MULTISCALE. University of Liège Aerospace & Mechanical Engineering
 University of Liège Aerospace & Mechanical Engineering Alternative numerical method in continuum mechanics COMPUTATIONAL MULTISCALE Van Dung NGUYEN Innocent NIYONZIMA Aerospace & Mechanical engineering
A S Kaddour 1*, M J Hinton 2. Keywords: Triaxial, Failure, Criteria, WWFE-II, Benchmark, Envelopes, Hydrostatic pressure
 CHALLENGING LESSONS FROM THE SECOND WORLD- WIDE FAILURE EXERCISE (WWFE-II): PREDICTING FAILURE IN POLYMER COMPOSITE LAMINATES UNDER 3-D STATES OF STRESS A S Kaddour 1*, M J Hinton 2 1 QinetiQ, Farnborough,
Non-conventional Glass fiber NCF composites with thermoset and thermoplastic matrices. F Talence, France Le Cheylard, France
 20 th International Conference on Composite Materials Copenhagen, 19-24th July 2015 Non-conventional Glass fiber NCF composites with thermoset and thermoplastic matrices. Thierry Lorriot 1, Jalal El Yagoubi
Interlaminar fracture characterization in composite materials by using acoustic emission
 5th International Symposium on NDT in Aerospace, 13-15th November 2013, Singapore Interlaminar fracture characterization in composite materials by using acoustic emission Ian SILVERSIDES 1, Ahmed MASLOUHI
Getting Started with Composites Modeling and Analysis
 Getting Started with Composites Modeling and Analysis IN THIS WEBINAR: PRESENTED BY: Orthotropic materials and how to define them Composite Laminate properties and modeling Composite failure theories and
RUNWAY DEBRIS IMPACT ON GENERIC COMPOSITE TURBOFAN BLADE MULTISCALE PROGRESSIVE FAILURE ANALYSIS
 RUNWAY DEBRIS IMPACT ON GENERIC COMPOSITE TURBOFAN BLADE MULTISCALE PROGRESSIVE FAILURE ANALYSIS Gong Huiling 1 Frank Abdi 2 Marc VillàMontero 2 Cody Godines 2 1 MVT Group Inc, Shanghai, China 2 Alpha
A Critical Plane-energy Model for Multiaxial Fatigue Life Prediction. of Homogeneous and Heterogeneous Materials. Haoyang Wei
 A Critical Plane-energy Model for Multiaxial Fatigue Life Prediction of Homogeneous and Heterogeneous Materials by Haoyang Wei A Thesis Presented in Partial Fulfillment of the Requirements for the Degree
V. FAILURE OF FIBER COMPOSITE LAMINATES PROGRESSIVE
 V. FAILURE OF FIBER COMPOSITE LAMINATES PROGRESSIVE DAMAGE AND POLYNOMIAL INVARIANTS Fiber composites are typically used in flat, laminated forms or variations thereof, often also involving woven or braided
Modeling and Simulations of Aircraft Structures Stiffness, Damage, and Failure Prediction for Laminated Composites
 Modeling and Simulations of Aircraft Structures Stiffness, Damage, and Failure Prediction for Laminated Composites H.E.Pettermann 1, C.Schuecker 1, D.H.Pahr 2, F.G.Rammerstorfer 2 1 Austrian Aeronautics
ISSN: ISO 9001:2008 Certified International Journal of Engineering Science and Innovative Technology (IJESIT) Volume 2, Issue 4, July 2013
 Volume 2, Issue 4, July 2013") Delamination Studies in Fibre-Reinforced Polymer Composites K.Kantha Rao, Dr P. Shailesh, K. Vijay Kumar 1 Associate Professor, Narasimha Reddy Engineering College Hyderabad. 2 Professor, St. Peter s Engineering
Delamination Studies in Fibre-Reinforced Polymer Composites K.Kantha Rao, Dr P. Shailesh, K. Vijay Kumar 1 Associate Professor, Narasimha Reddy Engineering College Hyderabad. 2 Professor, St. Peter s Engineering
VORONOI APPLIED ELEMENT METHOD FOR STRUCTURAL ANALYSIS: THEORY AND APPLICATION FOR LINEAR AND NON-LINEAR MATERIALS
 The 4 th World Conference on Earthquake Engineering October -7, 008, Beijing, China VORONOI APPLIED ELEMENT METHOD FOR STRUCTURAL ANALYSIS: THEORY AND APPLICATION FOR LINEAR AND NON-LINEAR MATERIALS K.
LS-DYNA MAT54 for simulating composite crash energy absorption
 LS-DYNA MAT54 for simulating composite crash energy absorption Bonnie Wade and Paolo Feraboli (UW) Mostafa Rassaian (Boeing BR&T) JAMS 2011 The Joint Advanced Materials and Structures Center of Excellence
Calibration and Experimental Validation of LS-DYNA Composite Material Models by Multi Objective Optimization Techniques
 9 th International LS-DYNA Users Conference Optimization Calibration and Experimental Validation of LS-DYNA Composite Material Models by Multi Objective Optimization Techniques Stefano Magistrali*, Marco
Modelling the nonlinear shear stress-strain response of glass fibrereinforced composites. Part II: Model development and finite element simulations
 Modelling the nonlinear shear stress-strain response of glass fibrereinforced composites. Part II: Model development and finite element simulations W. Van Paepegem *, I. De Baere and J. Degrieck Ghent
A synergistic damage mechanics approach to mechanical response of composite laminates with ply cracks
 Article A synergistic damage mechanics approach to mechanical response of composite laminates with ply cracks JOURNAL OF COMPOSITE MATERIALS Journal of Composite Materials 0(0) 7! The Author(s) 0 Reprints
MODELING DYNAMIC FRACTURE AND DAMAGE IN A FIBER-REINFORCED COMPOSITE LAMINA WITH PERIDYNAMICS
 University of Nebraska - Lincoln DigitalCommons@University of Nebraska - Lincoln Mechanical & Materials Engineering Faculty Publications Mechanical & Materials Engineering, Department of 011 MODELING DYNAMIC
An integrated approach to the design of high performance carbon fibre reinforced risers - from micro to macro - scale
 An integrated approach to the design of high performance carbon fibre reinforced risers - from micro to macro - scale Angelos Mintzas 1, Steve Hatton 1, Sarinova Simandjuntak 2, Andrew Little 2, Zhongyi
Multi Disciplinary Delamination Studies In Frp Composites Using 3d Finite Element Analysis Mohan Rentala
 Multi Disciplinary Delamination Studies In Frp Composites Using 3d Finite Element Analysis Mohan Rentala Abstract: FRP laminated composites have been extensively used in Aerospace and allied industries
Prediction of Elastic Constants on 3D Four-directional Braided
 Prediction of Elastic Constants on 3D Four-directional Braided Composites Prediction of Elastic Constants on 3D Four-directional Braided Composites Liang Dao Zhou 1,2,* and Zhuo Zhuang 1 1 School of Aerospace,
Constitutive Equations
 Constitutive quations David Roylance Department of Materials Science and ngineering Massachusetts Institute of Technology Cambridge, MA 0239 October 4, 2000 Introduction The modules on kinematics (Module
FAILURE CRITERIA FOR COMPOSITE MATERIALS UNDER MULTIAXIAL STRESS STATES
 FAILURE CRITERIA FOR COMPOSITE MATERIALS UNDER MULTIAXIAL STRESS STATES Essam Totry 1, Carlos González 1, 2 and Javier LLorca 1, 2 1 Departmento de Ciencia de Materiales, Universidad Politécnica de Madrid.
Fracture Mechanics of Composites with Residual Thermal Stresses
 J. A. Nairn Material Science & Engineering, University of Utah, Salt Lake City, Utah 84 Fracture Mechanics of Composites with Residual Thermal Stresses The problem of calculating the energy release rate
ME 7502 Lecture 2 Effective Properties of Particulate and Unidirectional Composites
 ME 75 Lecture Effective Properties of Particulate and Unidirectional Composites Concepts from Elasticit Theor Statistical Homogeneit, Representative Volume Element, Composite Material Effective Stress-
PROGRESSIVE DAMAGE ANALYSES OF SKIN/STRINGER DEBONDING. C. G. Dávila, P. P. Camanho, and M. F. de Moura
 PROGRESSIVE DAMAGE ANALYSES OF SKIN/STRINGER DEBONDING C. G. Dávila, P. P. Camanho, and M. F. de Moura Abstract The debonding of skin/stringer constructions is analyzed using a step-by-step simulation
Composite Laminate Modeling
 omposite Laminate Modeling White Paper for Femap and NX Nastran Users Venkata Bheemreddy, Ph.D., Senior Staff Mechanical Engineer Adrian Jensen, PE, Senior Staff Mechanical Engineer WHAT THIS WHITE PAPER
An investigation of the mechanical behaviour of carbon epoxy cross ply cruciform specimens under biaxial loading
 An investigation of the mechanical behaviour of carbon epoxy cross ply cruciform specimens under biaxial loading A. Makris, C. Ramault, D. Van Hemelrijck Department of Mechanics of Materials and Constructions,
QUANTIFICATION OF DAMAGE EVOLUTION IN MULTILAYERED HIGH TEMPERATURE COMPOSITES FROM ULTRASONIC MEASUREMENTS
 QUANTIFICATION OF DAMAGE EVOLUTION IN MULTILAYERED HIGH TEMPERATURE COMPOSITES FROM ULTRASONIC MEASUREMENTS A. D. Degtyar 1 and S. I. Rokhlin The Ohio State University Nondestructive Evaluation Program
Crashworthiness of composite structures: Experiment and Simulation
 Crashworthiness of composite structures: Experiment and Simulation Francesco Deleo, Bonnie Wade and Prof. Paolo Feraboli (UW) Dr. Mostafa Rassaian (Boeing R&T) JAMS 2010 The Joint Advanced Materials and
Fatigue Analysis of Wind Turbine Composites using Multi-Continuum Theory and the Kinetic Theory of Fracture
 Fatigue Analysis of Wind Turbine Composites using Multi-Continuum Theory and the Kinetic Theory of Fracture P. Greaves a, P. McKeever a, R. G. Dominy b, T. Koziara b a Narec, Offshore House, Albert Street,
Materials and Structures. Indian Institute of Technology Kanpur
 Introduction to Composite Materials and Structures Nachiketa Tiwari Indian Institute of Technology Kanpur Lecture 15 Behavior of Unidirectional Composites Lecture Overview Mt Material ilaxes in unidirectional
Numerical investigation on the position of holes for reducing stress concentration in composite plates with bolted and riveted joints
 THEORETICAL & APPLIED MECHANICS LETTERS 1, 041005 (2011) Numerical investigation on the position of holes for reducing stress concentration in composite plates with bolted and riveted joints M. R. Khoshravan,
Comparison of Ply-wise Stress-Strain results for graphite/epoxy laminated plate subjected to in-plane normal loads using CLT and ANSYS ACP PrepPost
 Comparison of Ply-wise Stress-Strain results for graphite/epoxy laminated plate subjected to in-plane normal loads using CLT and ANSYS ACP PrepPost 1 Mihir A. Mehta, 2 Satyen D. Ramani 1 PG Student, Department
A coupled field finite element model to predict actuation properties of piezoelectrically actuated bistable composites.
 A coupled field finite element model to predict actuation properties of piezoelectrically actuated bistable composites. P.F.Giddings, C.R.Bowen, H.A.Kim University of Bath, UK Dept. Mech. ng, University
Most of the material in this package is based on a recently published book. This is:
 Mechanics of Composite Materials Version 2.1 Bill Clyne, University of Cambridge Boban Tanovic, MATTER Assumed Pre-knowledge It is assumed that the student is familiar with simple concepts of mechanical
Numerical Vibration Analysis of Impacted CFRP Specimens Using COMSOL Multiphysics
 Numerical Vibration Analysis of Impacted CFRP Specimens Using COMSOL Multiphysics Philipp Jatzlau 1, Florian Seybold 1 1 Technical University of Munich, Center for Building Materials, Chair of Non-destructive
A RESEARCH ON NONLINEAR STABILITY AND FAILURE OF THIN- WALLED COMPOSITE COLUMNS WITH OPEN CROSS-SECTION
 A RESEARCH ON NONLINEAR STABILITY AND FAILURE OF THIN- WALLED COMPOSITE COLUMNS WITH OPEN CROSS-SECTION H. Debski a*, J. Bienias b, P. Jakubczak b a Faculty of Mechanical Engineering, Department of Machine
Capability Assessment of Finite Element Software in Predicting the Last Ply Failure of Composite Laminates
 Available online at www.sciencedirect.com Procedia Engineering 41 (2012 ) 1647 1653 International Symposium on Robotics and Intelligent Sensors 2012 (IRIS 2012) Capability Assessment of Finite Element
Generic Strategies to Implement Material Grading in Finite Element Methods for Isotropic and Anisotropic Materials
 University of Nebraska - Lincoln DigitalCommons@University of Nebraska - Lincoln Engineering Mechanics Dissertations & Theses Mechanical & Materials Engineering, Department of Winter 12-9-2011 Generic