Dynamic Pricing, Managed Lanes and Integrated Corridor Management: Challenges for Advanced Network Modeling Methodologies
|
|
|
- Wendy Cross
- 6 years ago
- Views:
Transcription
1 Dynamic Pricing Managed Lanes and Integrated Corridor Management: Challenges for Advanced Network Modeling Methodologies Hani S. Mahmassani Transportation Center Northwestern University November Georgia Tech
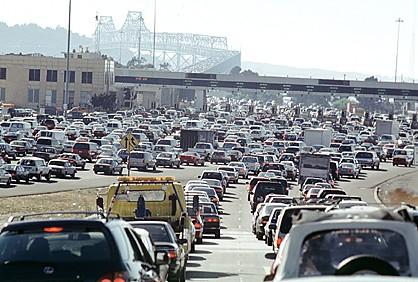
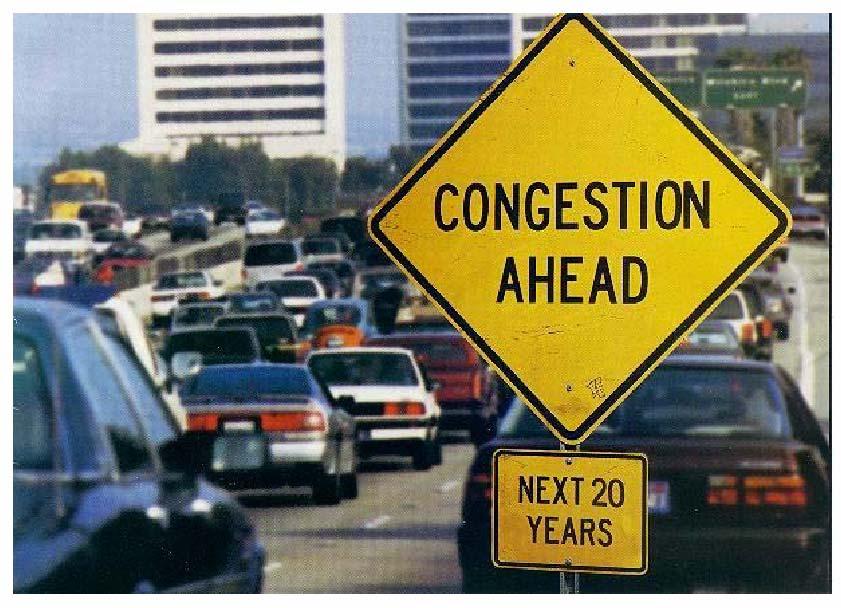
2 Two Key Motivating Phenomena. Growing Congestion.??


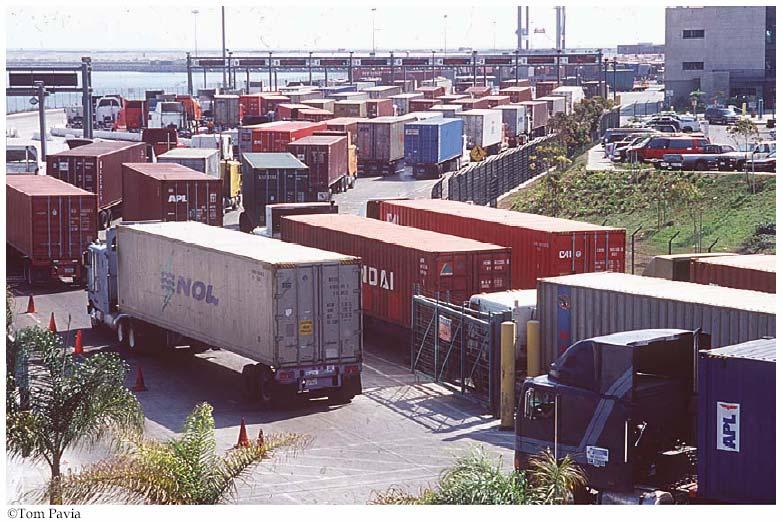
3 Highway Authorities.

4 Why Road Pricing? Motivating Phenomena: Growing congestion in metropolitan areas Budget constraints for highway authorities Objectives of road pricing: Revenue generation: road/bridge tolls Congestion management: congestion pricing cordon tolls and high occupancy toll HOT) lanes toward dynamic pricing with time-varying tolls) Examples of road pricing applications London cordon pricing: charging private vehicles in downtown area to reduce traffic congestion and raise revenues for transport improvements. I-15 HOT lanes in San Diego: allowing solo drivers to pay a dynamic toll to use the express lanes normally reserved for high occupancy vehicles HOV). Highway 407 the Express Toll Route ETR) in Toronto: collecting tolls based on distance traveled in the multi-lane electronic highway. State Route 91 in Orange County California: express toll lanes constructed and operated by private company.
5 Rationale for Congestion Pricing 1. Market-clearing prices: charge whatever it takes to achieve desired service levels use prices instead of wasted time/queues to rationalize use of transport infrastructure; efficiency argument. 2. To induce more efficient use of transport infrastructure Network Equilibrium Theory: Use pricing to induce Time-minimizing) system optimal SO) flow pattern instead of inefficient user equilibrium UE) attained without pricing. First-best pricing: Charge users marginal cost imposed on system) on all network links; Second-best pricing: Impose tolls only on selected links usually for practical reasons)
6 Congestion Pricing as Demand Management Tool 1. Pricing increasingly viewed as one instrument along with two main other controls for integrated transportation system management: 1. Traffic controls: ramp metering signal coordination 2. Information Supply: advanced traveler information systems parking information systems variable message signs VMS) 2. In real-time: with improved sensing and information technologies can determine prices traffic controls and information strategies adaptively online based on current and anticipated state of the system
7 Implications for Evaluation Methodology 1. Consideration of time-variation within day) of traffic demand and during peak-periods: dynamic analysis 2. Network perspective: cannot consider highway facility in isolation; need to consider traffic distribution across paths in a network 3. Need to capture congestion phenomena and queueing 4. Representation of operational aspects associated with coordinated measures: e.g. HOV lanes 5. User responses to prices: 1. Short-term: route choice 2. Medium-term: trip timing mode choice 3. Longer-term: destination choice forsake trip or telecommute); location and activity decisions

8 Network Simulation-Assignment Modeling for Advanced Traffic System Management
9 Why is DUE Model important for Dynamic Pricing Applications? Estimated dynamic) origin-destination OD) demand Network characteristics and traffic control data Dynamic User Equilibrium Models or Dynamic Traffic Assignment) Address the dynamic nature of traffic flows Describe path choices of network users based on the user equilibrium/optimal Obtain DUE path flow patterns Time-varying road pricing scenario as a set of time-dependent link tolls) Evaluation of dynamic pricing scenarios: predicted path choices toll road usage profit and revenue) and network performance average travel time and average delay). Decision support for toll operators and traffic system managers
10 Which Essential Aspect Was Not Considered? User Heterogeneity Critical limitation of existing dynamic traffic assignment tools Each trip-maker chooses a path that minimizes the two major path travel criteria: travel time and out-of-pocket cost path generalized cost). Conventional traffic assignment models consider a homogeneous perception of tolls by assuming a constant VOT in the path choice model. Empirical studies e.g. Hensher 2001; Brownstone and Small 2005; Cirillo et al. 2006) found that the VOT varies significantly across individuals. High VOT Low VOT Home Path A: 45 minutes + $2 Path B: 55 minutes + $0 Office
11 Our Objective Develop Multi-Criterion Simultaneous Route and Departure Time User Equilibrium MSRDUE) models and algorithms Address the heterogeneous user preference of path and/or departure time choices in response to time-varying toll charges. Capture traffic flow dynamics and spatial and temporal vehicular interactions simulation-based approach). Adhere to the time-dependent generalization of Wardrop s UE principle gap function measures the deviation from equilibrium). Be deployable on road traffic networks of practical sizes vehicle-based implementation technique).
12 Problem Statement Assumptions: GN A) discretized planning horizon and time-dependent link tolls. Define schedule delay as the difference between actual and preferred arrival times PAT). Every trip-maker has his/her own PAT interval θ Early schedule delay ESD) and late schedule delay LSD) Value of ESD VOESD β) and value of LSD VOLSD λ) The experienced trip cost perceived by a trip-maker with θ α β and λ τ τ τ τ τ G θ α β λ) = TC + α TT + β ESD θ) + λ LSD θ) odp odp odp Path generalized cost where τ lb mid τ mid ub ESDodp θ ) = max{0 θ τ } LSDodp θ) = max{0 τ θ } VOT α VOESD β and VOLSD λ are continuously distributed across trip-makers with given probability density functions and feasible ranges. odp Schedule delay cost odp
13 Problem Statement ctd.) Departure time and path choice behavioral assumption: Each trip-maker chooses the alternative that minimizes the experienced trip cost with respect to his/her PAT VOT VOESD and VOLSD. An alternative is a combination of arrival time interval and the corresponding least generalized cost path that arrives the destination at that arrival time interval). Multi-criterion simultaneous route and departure time UE MSRDUE) For each OD pair every trip cannot decrease the experienced trip cost with respect to that trip s particular VOT VOESD VOLSD and PAT interval by unilaterally changing departure time and/or path. Each trip-maker is assigned to the alternative that has the least trip cost with respect to his/her own PAT VOT VOESD and VOLSD. MSRDUE problem: Under a given time-dependent road pricing scenario to solve for the departure time and path flow patterns satisfying the MSRDUE conditions.
14 Why is this problem difficult? Relaxation of VOT from constant to continuous random variable Find an equilibrium state resulting from the interactions of possibly infinite) many classes of trips each of which corresponds to a class-specific VOT. Computing and storing such a grand path set is computationally intractable and memory intensive in road) network applications of practical sizes Parametric Analysis Method PAM) to find the set of extreme efficient or non-dominated) path trees Cost In the disutility minimization-based path choice modeling framework with convex disutility functions All trips would choose only among the set of extreme efficient paths Applications in static assignment Dial 1996; Marcotte 1997) Extreme efficient paths Henig 1985) Dominated paths Non-extreme efficient paths Time
15 Column Generation-based MSRDUE algorithm Input OD demand link tolls VOT distribution and initial path assignment Initialization Traffic simulation to evaluate initial path assignment Sequential Parametric Analysis Method SPAM) VOT VOESD VOLSD breakpoints definig multi-user classes and extreme efficient alternatives for each class Convergence Checking? NO YES Output path flows and terminate Multi-class Path Flow Updating Scheme Outer Loop: Alternative Generation Multi-class Dynamic Network Loading Traffic Simulation Inner Loop: Equilibration YES Convergence Checking? NO
16 Sequential Parametric Analysis Method SPAM) Determine VOT VOESD and VOLSD breakpoints that define multiuser classes and find the least trip cost extreme non-dominated) alternative for each user class Repeat the two stages for each destination: d = 1...D d D Stage 1: parametric analysis of VOT min α Stage 2: parametric analysis of VOESD min β 2 β 1 α 2 3 α α Tr1) Tr2) Tr3) 1 β β max λ min 2 λ max α parametric analysis of VOLSD 1 λ max λ Repeat the second stage for each VOT subinterval: b=1...3
17 Parametric Analysis of VOT stage 1 of the SPAM Determine the breakpoints that partition the feasible VOT range and define the master user classes and find time-dependent least generalized cost path tree for each user class. Tree1) Tree2) Tree3) Tree4) Tree5) Tree6) VOT α min Time α max Each tree consists of timedependent least generalized cost paths from all origin nodes to a destination node for all arrival time intervals. To determine the subinterval of VOT in which the current tree Trα) is optimal. Cost
18 Parametric Analysis of VOESD and VOLSD for a VOT subinterval stage 2 of the SPAM Given a time-dependent extreme efficient path tree Trb) corresponding to the VOT subinterval [α b-1 α b ) the parametric analyses of VOESD and VOLSD are conducted in an expanded network. o τ1 δo τ1)) p 1 Arrival Times 1 d τ ) ESD/LSD PAT intervals 1 d' θ ) o τ 2 δo τ 2)) p 2 2 d τ ) d' θ ) 2 o τ 3 δ o τ 3)) p 3 d τ ) 3 3 d' θ ) o τ 4 δo τ 4)) p 4 4 d τ ) d' θ ) 4 5 o τ 5 δo τ )) d τ 5) p 5 5 d' θ )
19 Parametric Analysis of VOESD and VOLSD for a VOT subinterval An example o τ1 δo τ1)) p 1 Arrival Times τ 1 PAT θ 1 ESD + β min o τ 2 δo τ 2)) τ 2 θ 2 p 2 o τ 3 δ o τ 3)) p 3 τ 3 θ 3 current PAT β 1 λ max o τ 4 δo τ 4)) τ 4 θ 4 β max λ 1 p 4 o τ δ )) θ5 5 o τ 5 p 5 τ 5 LSD + λ min
20 Output of the SPAM VOESD breakpoints that define the subintervals and the least trip cost alternative for each subinterval. b θ VOLSD breakpoints that define the subintervals and the least trip cost alternative for each subinterval. b θ Multiple user classes: for each VOT subinterval b and PAT θ Simplified as ub θ m n) The corresponding set of least trip cost alternatives } { ) min ) 1 0 max ) 1 0 β β β β β β β β β θ β θ θ = > > > > > = = b M m b M b ) 1... *) * ) [ 1 θ τ β β θ θ b M m p m b b m m = } { ) min ) 1 0 max ) 1 0 λ λ λ λ λ λ λ λ λ θ λ θ θ = > > > > > = = b N n b N b ) 1... *) * ) [ 1 θ τ λ λ θ θ b N n p n b b n n = ) 1... ) 1... ) ) ) θ θ θ θ λ θ β b N n b M m n m b u b b = = ) ) ) θ θ θ θ θ b od b od od n b alt m b alt n m b alt = Parametric Analysis of VOESD and VOLSD for a VOT subinterval
21 Multi-Class Flow Updating and Convergence Checking Multi-Class Alternative Flow Updating Scheme Multiple user classes ub θ m n) are naturally determined by the SPAM. Decomposes the problem into many bθmnod) sub-problems and solves each of them by adjusting OD flows between non-least trip cost alternatives and the least trip cost alternative. Extension of the multi-class path flow updating scheme for the BDUE Convergence Checking Gap Gap r ) = Average Gap AGap r) = l τ l odp u b θ m n) o d τ p) alt b θ m n) od τ l odp u b θ m n) o d τ p) alt b θ m n) od r b θ m n) Δ b θ m n) Δ τ l odp u b θ m n) o d τ p) alt b θ m n) r od r τ l odp τ l odp b θ m n) b θ m n) b θ m n)
22 Numerical Experiments and Results Purpose Examine the algorithmic convergence property and solution quality of the algorithm Investigate how the random parameters would affect departure time and path flow patterns or toll road usage) under different dynamic pricing scenarios i.e. to compare the random and constant parameter models). Random parameters VOT distribution: N$0.4/min $0.2/min) [α min α max ] = [ ] Lam and Small 2001; Brownstone and Small 2005; Southern CA) VOESD distribution: N$0.3/min $0.15/min) [β min β max ] = [ ] VOLSD distribution: N$1.8/min $0.6/min) [λ min λ max ] = [ ] economic judgments based on the results reported in Small 1982)) Arrival time and PAT intervals: 5 minutes.
23 Numerical Experiments and Results Experiment conducted on the Fort Worth network TX) Select a critical OD pair that accounts for 25% of total demand. O Number of Vehicles PAT pattern Time min) D Pricing Scenario 0-20 minutes minutes minutes minutes minutes minutes minutes #1 low) $0.05 $0.20 $0.35 $0.50 $0.35 $0.20 $0.05 #2 mid) $0.25 $0.40 $0.55 $0.70 $0.55 $0.40 $0.25 #3 high) $0.45 $0.60 $0.75 $0.90 $0.75 $0.60 $0.45 dynamic pricing scenarios
24 Numerical Experiments and Results Experiment conducted on the Fort Worth network TX) Convergence pattern and solution quality in terms of Average Gap. Convergence pattern in terms of departure time distribution Agap min) Random Parameters Constant Parameters Number of Vehicles Initial Sol. Iteration 1 Iteration 5 Iteration Iteration Time min) average gap departure time distribution random parameter model)
25 Numerical Experiments and Results Experiment conducted on Fort Worth network TX) Convergence pattern in terms of the number of schedule delay vehicles i.e. early late and on-time vehicles) in the random parameter model Number of Vehicles # of ESD # of LSD # of OnTime Iteration
26 Numerical Experiments and Results Experiment conducted on the Fort Worth network TX) Compare the differences in departure time distribution and toll road usage between random and constant parameter models Number of Vehicles Random Parameter Model Constant Parameter Model Number of Vehicles Random Parameter Model Constant Parameter Model Time min) Time min) departure time distribution Time-varying toll road usage
27 Numerical Experiments and Results Experiment conducted on the Fort Worth network TX) The Comparison of departure time distribution and toll road usage under different dynamic pricing scenarios Number of Vehicles Low Price Mid Price High Price Number of Vehicles Low Price Mid Price High Price Time min) Time min) departure time distribution Time-varying toll road usage
28 Concluding Remarks VOT and VOSD are assumed continuously distributed across tripmakers. The MSRDUE problem is solved by the column generation-based algorithm which embeds the extreme non-dominated path finding algorithm SPAM sequential parametric analysis method) in addition to the multi-class alternative flow updating scheme and the traffic simulator The algorithm is independent of the VOT VOESD and VOLSD assumptions and independent of the traffic simulator. The convergence pattern of the proposed MSRDUE algorithm is not affected by the different assumptions of VOT VOESD and VOLSD and it is able to find close-to-msrdue solutions.
29 Concluding Remarks There are significant differences in the estimated/predicted departure time pattern and toll road usage between the two models. Trip-makers behave identically in choosing departure times and paths in the constant parameter model. The random parameter model explicitly considers heterogeneous users with different parameters. The proposed MSRDUE model can realistically describe trip-makers responses to time-varying toll charges in temporal distribution departure times) and spatial splits path flows). Future Works: Inclusion of other path choice attributes such as reliability. Extensions to OD-specific and time-varying VOT VOESD and VOLSD distributions Development of re-optimization algorithms for the PAM and SPAM Applications to dynamic congestion pricing problems
 2.")
30 Congestion Pricing as Demand Management Tool 1. Pricing increasingly viewed as one instrument along with two main other controls for integrated transportation system management: 1. Traffic controls: ramp metering signal coordination 2. Information Supply: advanced traveler information systems parking information systems variable message signs VMS) 2. In real-time: with improved sensing and information technologies can determine prices traffic controls and information strategies adaptively online based on current and anticipated state of the system


31 HOT LANES Hot lanes will only be considered with the addition of a lane to the Beltway. No general purpose lanes will be converted to HOT lanes. Single Occupant Vehicles allowed to use HOV lanes for a toll Toll rates vary based on traffic conditions or time of day so as to maintain high level of service on managed lane Facilitated by AVI and automatic toll collection
32 Value Pricing Value pricing Let travelers choose between two adjacent roadways: priced but free-flowing vs. free but congested Applications Predetermined toll values SR-91 in Orange County California Harris County Texas Reactive I-394 Minnesota I-15 FasTrak in San Diego California
33 Motivation Anticipatory pricing Set toll values based on predictive traffic measures in order to prevent traffic breakdown before it occurs Managed lanes Anticipatory ramp metering Advanced Traveler Information Systems ATIS) Anticipatory travel time information provision Anticipatory measures are expected to be more effective than the prevailing measures when prediction is reliable
34 Reactive Pricing Strategy How does reactive pricing work? obtain the prevailing traffic measures/conditions adjust current link tolls accordingly communicate to drivers via local VMS at the entry point could also disseminate via radio in-vehicle equipment mobile internet etc. Link Toll Generator Toll values Traffic data Real World Traffic
35 Anticipatory Pricing Strategy What differentiates anticipatory from reactive pricing? Network state prediction Use predicted traffic conditions Calculate link toll within the prediction horizon and implement it in real time Link Toll Generator Predicted data Toll values Traffic Prediction Traffic data Real World Traffic
36 Formulation Toll generation problem is formulated as a mathematical programming with equilibrium constraints MPEC) Embedded in a closed-loop rolling horizon framework MPEC problem is solved within the prediction horizon
37 Rolling Horizon Framework Rolling horizon approach is a practical method for real-time demand-responsive control Basic idea: vehicles currently assigned will not be influenced by vehicles assigned far into the future stage length PDYNA - stage 1 PDYNA - stage 2 PDYNA - stage 3 RTDYNA roll period
38 MPEC Formulation for Toll Generator Objective function Minimize the total travel time Subject to the constraints Maintain high LOS on the toll links free flow speed) Second best toll: on selected links only Feasible link flow Flow conservation Tolled user equilibrium conditions
39 Methodology Step 0: start from time 0 and set initial link tolls Step 1: UE traffic assignment with given current link tolls Step 2: update link toll range based on prevailing/predicted concentration Step 3: search for second-best toll values within the toll range) by gradient based algorithm Step 4: if the end of planning horizon is not reached roll forward and go to Step 1; otherwise stop
40 Tolled UE Traffic Assignment Given a set of link tolls Search for tolled UE flow by an iterative procedure or simulating users route switching decisions based on real-time information and bounded rationality Time-dependent travel time Time-dependent link toll Generalized cost = travel time + link toll Switch path if the improvement in the remaining trip cost exceeds the indifference band
41 Update Link Toll Range The minimum and maximum toll values β r ta t 1) a t+ i) a a min = β + α wi c ccr ) i= 0 Speed a v f a v qm β h 1 ta t 1) a t+ i) a a max = β + α wi c cbp ) i= 0 a c bp a c cr Concentration Within feasible range Flow a q max Non-negative Preset upper bound for link toll a q bp a c bp a c cr Concentration
42 Second-best Toll Search Simplify the problem as a single-level optimization problem Min β θ β x β )) β Ω subject to Projected sub-gradient approach PSA) to search for good local optima Evaluate gradient at β k Define search direction s k Decide step length k 1 l * Update toll value β + = PrΩ β k + l * s k )
43 Implementation and Evaluation: TrEPS For the reactive case: activate the state estimation module which interacts with the reactive toll generator For the anticipatory case: activate both estimation and prediction modules which work together with the anticipatory toll generator


44 The Test Bed Network: CHART Toll Lane End I-95-I-495 Junction Toll Lane Start I-95-MD-166 Junction Intermediate Access/Egress Locations I-95 corridor between Washington DC and Baltimore MD US 2 toll lanes 2241 nodes 3459 links 111 TAZ zones 2 hours morning peak demand
45 Pricing Strategies No pricing base case) Static pricing Predetermine the time-varying link tolls based on the historical information Reactive pricing Set time-varying link tolls based on prevailing traffic conditions Anticipatory pricing Set time-dependent link tolls based on predicted traffic conditions
46 Preliminary Results Travel Time Warm-up period: increase in travel time at the beginning With the anticipatory pricing strategy the travel times become steady after 1 hour free flow condition) Static pricing strategy provides free flow condition on the toll lanes but reduces the LOS on the alternative freeway lanes Toll Lanes Regular Lanes


47 Preliminary Results Traffic Measures Concentrations averaged over links along the congested portion of toll road weighted by the link length Throughputs measured at downstream of where traffic breaks down in base case no pricing) Anticipatory pricing strategy can provide higher throughput while maintaining lower concentration steady traffic flow)
48 Conclusion The second-best dynamic congestion pricing problem was formulated as a MPEC in a closed-loop rolling horizon framework Anticipatory pricing sets the toll values based on future traffic conditions so that it can prevent traffic breakdown in advance and maintain steady traffic flow Many challenges remain methodology application social acceptability
49
Departure time choice equilibrium problem with partial implementation of congestion pricing
 Departure time choice equilibrium problem with partial implementation of congestion pricing Tokyo Institute of Technology Postdoctoral researcher Katsuya Sakai 1 Contents 1. Introduction 2. Method/Tool
Network Equilibrium Models: Varied and Ambitious
 Network Equilibrium Models: Varied and Ambitious Michael Florian Center for Research on Transportation University of Montreal INFORMS, November 2005 1 The applications of network equilibrium models are
Anticipatory Pricing to Manage Flow Breakdown. Jonathan D. Hall University of Toronto and Ian Savage Northwestern University
 Anticipatory Pricing to Manage Flow Breakdown Jonathan D. Hall University of Toronto and Ian Savage Northwestern University Flow = density x speed Fundamental diagram of traffic Flow (veh/hour) 2,500 2,000
Real-time, Adaptive Prediction of Incident Delay for Advanced Traffic Management Systems
 Real-time, Adaptive Prediction of Incident Delay for Advanced Traffic Management Systems Liping Fu and Bruce Hellinga Department of Civil Engineering, University of Waterloo, Waterloo, Canada Phone: 59
Pareto-Improving Congestion Pricing on General Transportation Networks
 Transportation Seminar at University of South Florida, 02/06/2009 Pareto-Improving Congestion Pricing on General Transportation Netorks Yafeng Yin Transportation Research Center Department of Civil and
Feedback Based Dynamic Congestion Pricing
 1 Feedback Based Dynamic Congestion Pricing 2 Pushkin Kachroo, PhD pushkin@unlv.edu Phone: 702-895-5258 Transportation Research Center University of Nevada, Las Vegas 4054 Maryland Pkwy Las Vegas, Nevada
Yu (Marco) Nie. Appointment Northwestern University Assistant Professor, Department of Civil and Environmental Engineering, Fall present.
 Nie. Appointment Northwestern University Assistant Professor, Department of Civil and Environmental Engineering, Fall present.") Yu (Marco) Nie A328 Technological Institute Civil and Environmental Engineering 2145 Sheridan Road, Evanston, IL 60202-3129 Phone: (847) 467-0502 Fax: (847) 491-4011 Email: y-nie@northwestern.edu Appointment
Yu (Marco) Nie A328 Technological Institute Civil and Environmental Engineering 2145 Sheridan Road, Evanston, IL 60202-3129 Phone: (847) 467-0502 Fax: (847) 491-4011 Email: y-nie@northwestern.edu Appointment
Lecture 19: Common property resources
 Lecture 19: Common property resources Economics 336 Economics 336 (Toronto) Lecture 19: Common property resources 1 / 19 Introduction Common property resource: A resource for which no agent has full property
APPENDIX IV MODELLING
 APPENDIX IV MODELLING Kingston Transportation Master Plan Final Report, July 2004 Appendix IV: Modelling i TABLE OF CONTENTS Page 1.0 INTRODUCTION... 1 2.0 OBJECTIVE... 1 3.0 URBAN TRANSPORTATION MODELLING
METHODOLOGICAL ISSUES IN MODELING TIME-OF-TRAVEL
 METHODOLOGICAL ISSUES IN MODELING TIME-OF-TRAVEL PREFERENCES Moshe Ben-Akiva (corresponding author) Massachusetts Institute of Technology 77 Massachusetts Avenue, Room -8 Cambridge, MA 0239 Tel. 67-253-5324
Appendixx C Travel Demand Model Development and Forecasting Lubbock Outer Route Study June 2014
 Appendix C Travel Demand Model Development and Forecasting Lubbock Outer Route Study June 2014 CONTENTS List of Figures-... 3 List of Tables... 4 Introduction... 1 Application of the Lubbock Travel Demand
Traffic Demand Forecast
 Chapter 5 Traffic Demand Forecast One of the important objectives of traffic demand forecast in a transportation master plan study is to examine the concepts and policies in proposed plans by numerically
Optimal Adaptive Routing and Traffic Assignment in Stochastic Time-Dependent Networks. Song Gao
 Optimal Adaptive Routing and Traffic Assignment in Stochastic Time-Dependent Networks by Song Gao B.S., Civil Engineering, Tsinghua University, China (1999) M.S., Transportation, MIT (22) Submitted to
COMBINATION OF MACROSCOPIC AND MICROSCOPIC TRANSPORT SIMULATION MODELS: USE CASE IN CYPRUS
 International Journal for Traffic and Transport Engineering, 2014, 4(2): 220-233 DOI: http://dx.doi.org/10.7708/ijtte.2014.4(2).08 UDC: 656:519.87(564.3) COMBINATION OF MACROSCOPIC AND MICROSCOPIC TRANSPORT
1.225 Transportation Flow Systems Quiz (December 17, 2001; Duration: 3 hours)
") 1.225 Transportation Flow Systems Quiz (December 17, 2001; Duration: 3 hours) Student Name: Alias: Instructions: 1. This exam is open-book 2. No cooperation is permitted 3. Please write down your name
1.225 Transportation Flow Systems Quiz (December 17, 2001; Duration: 3 hours) Student Name: Alias: Instructions: 1. This exam is open-book 2. No cooperation is permitted 3. Please write down your name
transportation research in policy making for addressing mobility problems, infrastructure and functionality issues in urban areas. This study explored
 ABSTRACT: Demand supply system are the three core clusters of transportation research in policy making for addressing mobility problems, infrastructure and functionality issues in urban areas. This study
Changes in the Spatial Distribution of Mobile Source Emissions due to the Interactions between Land-use and Regional Transportation Systems
 Changes in the Spatial Distribution of Mobile Source Emissions due to the Interactions between Land-use and Regional Transportation Systems A Framework for Analysis Urban Transportation Center University
A SIMPLIFIED MODEL OF URBAN RAILWAY SYSTEM FOR DYNAMIC TRAFFIC ASSIGNMENT
 1 A SIMPLIFIED MODEL OF URBAN RAILWAY SYSTEM FOR DYNAMIC TRAFFIC ASSIGNMENT T. SEO a, K. WADA b and D. FUKUDA c a Department of Civil and Environmental Engineering, School of Environment and Society, Tokyo
Viable and Sustainable Transportation Networks. Anna Nagurney Isenberg School of Management University of Massachusetts Amherst, MA 01003
 Viable and Sustainable Transportation Networks Anna Nagurney Isenberg School of Management University of Massachusetts Amherst, MA 01003 c 2002 Viability and Sustainability In this lecture, the fundamental
What is 511? Need for 511 Services. Development & Deployment of Regional Road and Weather Information Supporting 511 Traveler Services
 Development & Deployment of Regional Road and Weather Information Supporting 511 Traveler Services Leon F. Osborne University of North Dakota Regional Weather Information Center Grand Forks, ND David L.
Guidelines on Using California Land Use/Transportation Planning Tools
 Guidelines on Using California Land Use/Transportation Planning Tools 1. Selecting Ds Analysis Modules Appropriate to a Region In almost all cases, the appropriate Ds Analysis Module to use for analysis
Encapsulating Urban Traffic Rhythms into Road Networks
 Encapsulating Urban Traffic Rhythms into Road Networks Junjie Wang +, Dong Wei +, Kun He, Hang Gong, Pu Wang * School of Traffic and Transportation Engineering, Central South University, Changsha, Hunan,
How to Estimate, Take Into Account, and Improve Travel Time Reliability in Transportation Networks
 University of Texas at El Paso DigitalCommons@UTEP Departmental Technical Reports (CS) Department of Computer Science 11-1-2007 How to Estimate, Take Into Account, and Improve Travel Time Reliability in
arxiv: v1 [cs.gt] 16 Jul 2012
![arxiv: v1 [cs.gt] 16 Jul 2012](/thumbs/73/69378454.jpg "arxiv: v1 [cs.gt] 16 Jul 2012") Road Pricing for Spreading Peak Travel: Modeling and Design arxiv:128.4589v1 [cs.gt] 16 Jul 212 Tichakorn Wongpiromsarn *, Nan Xiao, Keyou You, Kai Sim, Lihua Xie, Emilio Frazzoli, and Daniela Rus * Singapore-MIT
Road Pricing for Spreading Peak Travel: Modeling and Design arxiv:128.4589v1 [cs.gt] 16 Jul 212 Tichakorn Wongpiromsarn *, Nan Xiao, Keyou You, Kai Sim, Lihua Xie, Emilio Frazzoli, and Daniela Rus * Singapore-MIT
AGlimpseofAGT: Selfish Routing
 AGlimpseofAGT: Selfish Routing Guido Schäfer CWI Amsterdam / VU University Amsterdam g.schaefer@cwi.nl Course: Combinatorial Optimization VU University Amsterdam March 12 & 14, 2013 Motivation Situations
WRTM and Active Transportation and Demand Management
 The Future of Transportation - 2010 APWA Annual Congress and Exposition WRTM and Active Transportation and Demand Management Weather Responsive Traffic Management Workshop October 7, 2011 Jim Hunt F d
Mapping Accessibility Over Time
 Journal of Maps, 2006, 76-87 Mapping Accessibility Over Time AHMED EL-GENEIDY and DAVID LEVINSON University of Minnesota, 500 Pillsbury Drive S.E., Minneapolis, MN 55455, USA; geneidy@umn.edu (Received
Publication List PAPERS IN REFEREED JOURNALS. Submitted for publication
 Publication List YU (MARCO) NIE SEPTEMBER 2010 Department of Civil and Environmental Engineering Phone: (847) 467-0502 2145 Sheridan Road, A328 Technological Institute Fax: (847) 491-4011 Northwestern
Returns to Scale in Networks. Marvin Kraus * June Keywords: Networks, congestion, returns to scale, congestion pricing
 Returns to Scale in Networks by Marvin Kraus * June 2006 Keywords: Networks, congestion, returns to scale, congestion pricing * Department of Economics, Boston College, Chestnut Hill, MA 02467, USA. E-mail:
GIS Based Transit Information System for Metropolitan Cities in India
 PAPER REFERENCE NO.: PN-250 GIS Based Transit Information System for Metropolitan Cities in India Pal, Sarvjeet. a and Singh, Varun. b a M. Tech. (GIS & Remote Sensing); GIS Cell; Motilal Nehru National
Decentralisation and its efficiency implications in suburban public transport
 Decentralisation and its efficiency implications in suburban public transport Daniel Hörcher 1, Woubit Seifu 2, Bruno De Borger 2, and Daniel J. Graham 1 1 Imperial College London. South Kensington Campus,
A Framework for Dynamic O-D Matrices for Multimodal transportation: an Agent-Based Model approach
 A Framework for Dynamic O-D Matrices for Multimodal transportation: an Agent-Based Model approach Nuno Monteiro - FEP, Portugal - 120414020@fep.up.pt Rosaldo Rossetti - FEUP, Portugal - rossetti@fe.up.pt
November 16, Metropolitan Washington Council of Governments National Capital Region Transportation Planning Board
 Metropolitan Washington Council of Governments National Capital Region Transportation Planning Board Summary of the State of the Practice and State of the Art of Modeling Peak Spreading November 16, 2007
URBAN TRANSPORTATION SYSTEM (ASSIGNMENT)
") BRANCH : CIVIL ENGINEERING SEMESTER : 6th Assignment-1 CHAPTER-1 URBANIZATION 1. What is Urbanization? Explain by drawing Urbanization cycle. 2. What is urban agglomeration? 3. Explain Urban Class Groups.
BRANCH : CIVIL ENGINEERING SEMESTER : 6th Assignment-1 CHAPTER-1 URBANIZATION 1. What is Urbanization? Explain by drawing Urbanization cycle. 2. What is urban agglomeration? 3. Explain Urban Class Groups.
Appendix BAL Baltimore, Maryland 2003 Annual Report on Freeway Mobility and Reliability
 (http://mobility.tamu.edu/mmp) Office of Operations, Federal Highway Administration Appendix BAL Baltimore, Maryland 2003 Annual Report on Freeway Mobility and Reliability This report is a supplement to:
Using Aurora Road Network Modeler for Active Traffic Management
 2010 American Control Conference Marriott Waterfront, Baltimore, MD, USA June 30-July 02, 2010 WeC20.2 Using Aurora Road Network Modeler for Active Traffic Management Alex A. Kurzhanskiy and Pravin Varaiya
Chapter 2 Travel Time Definitions
 Chapter 2 Travel Time Definitions Abstract In this Chapter, travel time definitions are analytically presented. Also, a trajectory reconstruction algorithm necessary in order to navigate between different
INTRODUCTION TO TRANSPORTATION SYSTEMS
 INTRODUCTION TO TRANSPORTATION SYSTEMS Lectures 5/6: Modeling/Equilibrium/Demand 1 OUTLINE 1. Conceptual view of TSA 2. Models: different roles and different types 3. Equilibrium 4. Demand Modeling References:
NORTH HOUSTON HIGHWAY IMPROVEMENT PROJECT (NHHIP)
") NORTH HOUSTON HIGHWAY IMPROVEMENT PROJECT (NHHIP) Planning for a Mega Project in a Metropolitan Area TxDOT Short Course October 13, 2015 RECOMMENDED ALTERNATIVES Environmental Impact Statement (EIS) Project
NORTH HOUSTON HIGHWAY IMPROVEMENT PROJECT (NHHIP) Planning for a Mega Project in a Metropolitan Area TxDOT Short Course October 13, 2015 RECOMMENDED ALTERNATIVES Environmental Impact Statement (EIS) Project
3.0 ANALYSIS OF FUTURE TRANSPORTATION NEEDS
 3.0 ANALYSIS OF FUTURE TRANSPORTATION NEEDS In order to better determine future roadway expansion and connectivity needs, future population growth and land development patterns were analyzed as part of
This document is downloaded from DR-NTU, Nanyang Technological University Library, Singapore.
 This document is downloaded from DR-NTU, Nanyang Technological University Library, Singapore. Title Efficient and fair system states in dynamic transportation networks Author(s) Zhu, Feng; Ukkusuri, Satish
MS&E 246: Lecture 17 Network routing. Ramesh Johari
 MS&E 246: Lecture 17 Network routing Ramesh Johari Network routing Basic definitions Wardrop equilibrium Braess paradox Implications Network routing N users travel across a network Transportation Internet
Index Terms: Demand, Effective Travel Time, Perception Error.
 Modeling Impacts of Travel Time in Route Choice Decisions under Rainy Conditions J.P.Singh 1, Prabhat Shrivastava 2 1. Associate Professor (Applied Mechanics Dept. S.A.K.E.C, Chembur Mumbai-88, INDIA,
COUNCIL POLICY MANUAL
 COUNCIL POLICY MANUAL SECTION: PUBLIC WORKS SUBJECT: SNOW & ICE CONTROL POLICY 2012/2013 GOAL: Pages: 1 of 10 Approval Date: Dec. 3, 2012 Res. # 1001/2012 To annually identify the winter maintenance costs
Traffic Impact Study
 Traffic Impact Study Statham DRI One University Parkway Prepared for: Barrow County Prepared by: October 2012 Table of Contents Executive Summary i Section 1. Introduction 1 Project Description 1 Methodology
Dynamic Traffic Modeling: Approximating the equilibrium for peak periods in urban areas. LUTS, EPFL April 2015
 Dynamic Traffic Modeling: Approximating the equilibrium for peak periods in urban areas Raphaël Lamotte Nikolas Geroliminis LUTS, EPFL April 2015 STRC 15th Swiss Transport Research Conference Monte Verità
Using Piecewise-Constant Congestion Taxing Policy in Repeated Routing Games
 Using Piecewise-Constant Congestion Taxing Policy in Repeated Routing Games Farhad Farokhi, and Karl H. Johansson Department of Electrical and Electronic Engineering, University of Melbourne ACCESS Linnaeus
Supplementary Technical Details and Results
 Supplementary Technical Details and Results April 6, 2016 1 Introduction This document provides additional details to augment the paper Efficient Calibration Techniques for Large-scale Traffic Simulators.
Copyright by Dongxu He 2018
 Copyright by Dongxu He 2018 The Thesis Committee for Dongxu He certifies that this is the approved version of the following thesis: Dynamic Routing and Information Sharing for Connected and Autonomous
2015 Grand Forks East Grand Forks TDM
 GRAND FORKS EAST GRAND FORKS 2015 TRAVEL DEMAND MODEL UPDATE DRAFT REPORT To the Grand Forks East Grand Forks MPO October 2017 Diomo Motuba, PhD & Muhammad Asif Khan (PhD Candidate) Advanced Traffic Analysis
Metro SafeTrack Impact on Individual Travel Behavior & Regional Traffic Conditions. 1. Introduction. 2. Focus of this Volume & Issue
 Metro SafeTrack Impact on Individual Travel Behavior & Regional Traffic Conditions Volume 1 Issue 1 June 10, 16 1. Introduction The National Transportation Center (NTC@Maryland) at the University of Maryland
Expanding the GSATS Model Area into
 Appendix A Expanding the GSATS Model Area into North Carolina Jluy, 2011 Table of Contents LONG-RANGE TRANSPORTATION PLAN UPDATE 1. Introduction... 1 1.1 Background... 1 1.2 Existing Northern Extent of
Tradable Permits for System-Optimized Networks. Anna Nagurney Isenberg School of Management University of Massachusetts Amherst, MA 01003
 Tradable Permits for System-Optimized Networks Anna Nagurney Isenberg School of Management University of Massachusetts Amherst, MA 01003 c 2002 Introduction In this lecture, I return to the policy mechanism
ABSTRACT. Professor Lei Zhang, Department of Civil and Environmental Engineering
 ABSTRACT Title of Document: INCORPORATING RELIABILITY AND PEAK SPREADING INTO MARYLAND STATEWIDE TRANSPORTATION MODEL Sepehr Ghader, Masters of Science, 2015 Directed By: Professor Lei Zhang, Department
MnDOT Method for Calculating Measures of Effectiveness (MOE) From CORSIM Model Output
 From CORSIM Model Output") MnDOT Method for Calculating Measures of Effectiveness (MOE) From CORSIM Model Output Rev. April 29, 2005 MnDOT Method for Calculating Measures of Effectiveness (MOE) From CORSIM Model Output Table of
MnDOT Method for Calculating Measures of Effectiveness (MOE) From CORSIM Model Output Rev. April 29, 2005 MnDOT Method for Calculating Measures of Effectiveness (MOE) From CORSIM Model Output Table of
APPENDIX I: Traffic Forecasting Model and Assumptions
 APPENDIX I: Traffic Forecasting Model and Assumptions Appendix I reports on the assumptions and traffic model specifications that were developed to support the Reaffirmation of the 2040 Long Range Plan.
Traffic Games Econ / CS166b Feb 28, 2012
 Traffic Games Econ / CS166b Feb 28, 2012 John Musacchio Associate Professor Technology and Information Management University of California, Santa Cruz johnm@soe.ucsc.edu Traffic Games l Basics l Braess
NORTH HOUSTON HIGHWAY IMPROVEMENT PROJECT (NHHIP)
") NORTH HOUSTON HIGHWAY IMPROVEMENT PROJECT (NHHIP) Project Overview Briefing Packet September 2015 RECOMMENDED ALTERNATIVES Environmental Impact Statement (EIS) Project Divided into 3 Segments Segment 1:
NORTH HOUSTON HIGHWAY IMPROVEMENT PROJECT (NHHIP) Project Overview Briefing Packet September 2015 RECOMMENDED ALTERNATIVES Environmental Impact Statement (EIS) Project Divided into 3 Segments Segment 1:
A Model of Traffic Congestion, Housing Prices and Compensating Wage Differentials
 A Model of Traffic Congestion, Housing Prices and Compensating Wage Differentials Thomas F. Rutherford Institute on Computational Economics (ICE05) University of Chicago / Argonne National Laboratory Meeting
Examining Travelers Who Pay to Drive Slower in the Katy Managed Lanes
 Examining Travelers Who Pay to Drive Slower in the Katy Managed Lanes Farinoush Sharifi Zachry Department of Civil Engineering, Texas A&M University TAMU, College Station, TX Tel: -- Email: farinoushsharifi@tamu.edu
Simulation on a partitioned urban network: an approach based on a network fundamental diagram
 The Sustainable City IX, Vol. 2 957 Simulation on a partitioned urban network: an approach based on a network fundamental diagram A. Briganti, G. Musolino & A. Vitetta DIIES Dipartimento di ingegneria
FHWA Planning Data Resources: Census Data Planning Products (CTPP) HEPGIS Interactive Mapping Portal
 HEPGIS Interactive Mapping Portal") FHWA Planning Data Resources: Census Data Planning Products (CTPP) HEPGIS Interactive Mapping Portal Jeremy Raw, P.E. FHWA, Office of Planning, Systems Planning and Analysis August 2017 Outline Census
FHWA Planning Data Resources: Census Data Planning Products (CTPP) HEPGIS Interactive Mapping Portal Jeremy Raw, P.E. FHWA, Office of Planning, Systems Planning and Analysis August 2017 Outline Census
Study Overview. the nassau hub study. The Nassau Hub
 Livable Communities through Sustainable Transportation the nassau hub study AlternativeS analysis / environmental impact statement The Nassau Hub Study Overview Nassau County has initiated the preparation
First-Best Dynamic Assignment of Commuters with Endogenous Heterogeneities in a Corridor Network
 First-Best Dynamic Assignment of Commuters with Endogenous Heterogeneities in a Corridor Network ISTTT 22@Northwestern University Minoru Osawa, Haoran Fu, Takashi Akamatsu Tohoku University July 24, 2017
We can now formulate our model as showed in equation 2:
 Simulation of traffic conditions requires accurate knowledge of travel demand. In a dynamic context, this entails estimating time-dependent demand matrices, which are a discretised representation of the
A Cellular Automaton Model for Heterogeneous and Incosistent Driver Behavior in Urban Traffic
 Commun. Theor. Phys. 58 (202) 744 748 Vol. 58, No. 5, November 5, 202 A Cellular Automaton Model for Heterogeneous and Incosistent Driver Behavior in Urban Traffic LIU Ming-Zhe ( ), ZHAO Shi-Bo ( ô ),,
CIV3703 Transport Engineering. Module 2 Transport Modelling
 CIV3703 Transport Engineering Module Transport Modelling Objectives Upon successful completion of this module you should be able to: carry out trip generation calculations using linear regression and category
Routing. Topics: 6.976/ESD.937 1
 Routing Topics: Definition Architecture for routing data plane algorithm Current routing algorithm control plane algorithm Optimal routing algorithm known algorithms and implementation issues new solution
Emission Paradoxes in Transportation Networks. Anna Nagurney Isenberg School of Management University of Massachusetts Amherst, MA 01003
 Emission Paradoxes in Transportation Networks Anna Nagurney Isenberg School of Management University of Massachusetts Amherst, MA 01003 c 2002 Introduction In this lecture, I identify several distinct
TIME DEPENDENT CORRELATIONS BETWEEN TRAVEL TIME AND TRAFFIC VOLUME ON EXPRESSWAYS
 TIME DEPENDENT CORRELATIONS BETWEEN TRAVEL TIME AND TRAFFIC VOLUME ON EXPRESSWAYS Takamasa IRYO Research Associate Department of Architecture and Civil Engineering Kobe University 1-1, Rokkodai-cho, Nada-ku,
Travel Time Calculation With GIS in Rail Station Location Optimization
 Travel Time Calculation With GIS in Rail Station Location Optimization Topic Scope: Transit II: Bus and Rail Stop Information and Analysis Paper: # UC8 by Sutapa Samanta Doctoral Student Department of
CEE 320 Midterm Examination (50 minutes)
") CEE 320 Midterm Examination (50 minutes) Fall 2009 Please write your name on this cover. Please write your last name on all other exam pages This exam is NOT open book, but you are allowed to use one 8.5x11
CEE 320 Midterm Examination (50 minutes) Fall 2009 Please write your name on this cover. Please write your last name on all other exam pages This exam is NOT open book, but you are allowed to use one 8.5x11
Complementarity Models for Traffic Equilibrium with Ridesharing
 Complementarity Models for Traffic Equilibrium with Ridesharing Huayu Xu, Jong-Shi Pang, Fernando Ordóñez, and Maged Dessouky Original April 2015; revised July 2015; final August 2015 Abstract It is estimated
INTRODUCTION PURPOSE DATA COLLECTION
 DETERMINATION OF VEHICLE OCCUPANCY ON THE KATY AND NORTHWEST FREEWAY MAIN LANES AND FRONTAGE ROADS Mark Ojah and Mark Burris Houston Value Pricing Project, March 2004 INTRODUCTION In the late 1990s, an
VHD Daily Totals. Population 14.5% change. VMT Daily Totals Suffolk 24-hour VMT. 49.3% change. 14.4% change VMT
 6.9 Suffolk 6-54 VMT Population and Travel Characteristics Population 14.5% change 2014 1,529,202 VHD Daily Totals 2014 251,060 49.3% change 2040 1,788,175 2040 374,850 VMT Daily Totals 2014 39,731,990
The morning commute in urban areas with heterogeneous trip lengths. ISTTT22, Northwestern University Raphaël Lamotte, Nikolas Geroliminis
 The morning commute in urban areas with heterogeneous trip lengths ISTTT22, Northwestern University Raphaël Lamotte, Nikolas Geroliminis In a nutshell Vickrey (1969): the morning commute with a local bottleneck.
CONGESTION TOLLING AND URBAN SPATIAL STRUCTURE. Richard Arnott. Department of Economics. Boston College. Chestnut Hill, MA U.S.A.
 CONGESTION TOLLING AND URBAN SPATIAL STRUCTURE Richard Arnott Department of Economics Boston College Chestnut Hill, MA 02167 U.S.A. Acknowledgments: The author would like to thank the editors and referees
Prepared for: San Diego Association Of Governments 401 B Street, Suite 800 San Diego, California 92101
 Activity-Based Travel Model Validation for 2012 Using Series 13 Data: Coordinated Travel Regional Activity Based Modeling Platform (CT-RAMP) for San Diego County Prepared for: San Diego Association Of
Vehicle Routing with Traffic Congestion and Drivers Driving and Working Rules
 Vehicle Routing with Traffic Congestion and Drivers Driving and Working Rules A.L. Kok, E.W. Hans, J.M.J. Schutten, W.H.M. Zijm Operational Methods for Production and Logistics, University of Twente, P.O.
Dynamic Service Placement in Geographically Distributed Clouds
 Dynamic Service Placement in Geographically Distributed Clouds Qi Zhang 1 Quanyan Zhu 2 M. Faten Zhani 1 Raouf Boutaba 1 1 School of Computer Science University of Waterloo 2 Department of Electrical and
SEQUENTIAL ESTIMATION OF DYNAMIC DISCRETE GAMES. Victor Aguirregabiria (Boston University) and. Pedro Mira (CEMFI) Applied Micro Workshop at Minnesota
 and. Pedro Mira (CEMFI) Applied Micro Workshop at Minnesota") SEQUENTIAL ESTIMATION OF DYNAMIC DISCRETE GAMES Victor Aguirregabiria (Boston University) and Pedro Mira (CEMFI) Applied Micro Workshop at Minnesota February 16, 2006 CONTEXT AND MOTIVATION Many interesting
SEQUENTIAL ESTIMATION OF DYNAMIC DISCRETE GAMES Victor Aguirregabiria (Boston University) and Pedro Mira (CEMFI) Applied Micro Workshop at Minnesota February 16, 2006 CONTEXT AND MOTIVATION Many interesting
Forecasts from the Strategy Planning Model
 Forecasts from the Strategy Planning Model Appendix A A12.1 As reported in Chapter 4, we used the Greater Manchester Strategy Planning Model (SPM) to test our long-term transport strategy. A12.2 The origins
Assessing the uncertainty in micro-simulation model outputs
 Assessing the uncertainty in micro-simulation model outputs S. Zhu 1 and L. Ferreira 2 1 School of Civil Engineering, Faculty of Engineering, Architecture and Information Technology, The University of
Minimizing Total Delay in Fixed-Time Controlled Traffic Networks
 Minimizing Total Delay in Fixed-Time Controlled Traffic Networks Ekkehard Köhler, Rolf H. Möhring, and Gregor Wünsch Technische Universität Berlin, Institut für Mathematik, MA 6-1, Straße des 17. Juni
Taming the Modeling Monster
 Taming the Modeling Monster Starring: Ellen Greenberg Scott McCarey Jim Charlier Audience Poll, part 1 Elected Officials Board Members Public Staff Consultants Journalists Other Audience Poll, part 2 Modeling
Cyber-Physical Cooperative Freight Routing System
 1 Cyber-Physical Cooperative Freight Routing System Ioannis Kordonis Member, IEEE, Maged M. Dessouky, Petros Ioannou Fellow IEEE Abstract The efficient use of the road network for freight transport has
Queueing Systems: Lecture 6. Lecture Outline
 Queueing Systems: Lecture 6 Amedeo R. Odoni November 6, 2006 Lecture Outline Congestion pricing in transportation: the fundamental ideas Congestion pricing and queueing theory Numerical examples A real
When is the concept of generalized transport costs useless? The effects of the change in the value of time
 Urban Transport XIV 629 When is the concept of generalized transport costs useless? The effects of the change in the value of time T. Kono, H. Morisugi 2 & A. Kishi 3 Graduate School of Engineering, Tohoku
Surge Pricing and Labor Supply in the Ride- Sourcing Market
 Surge Pricing and Labor Supply in the Ride- Sourcing Market Yafeng Yin Professor Department of Civil and Environmental Engineering University of Michigan, Ann Arbor *Joint work with Liteng Zha (@Amazon)
Snow and Ice Control POLICY NO. P-01/2015. CITY OF AIRDRIE Snow and Ice Control Policy
 Page 1 CITY OF AIRDRIE Snow and Ice Control Effective Date: Approved By: Approved On: March 17, 2015 City Council March 16, 2015 Revision Date: Resolution #: ------ PURPOSE: The City of Airdrie is responsible
Optimal Adaptive Departure Time Choices with Real-Time Traveler Information Considering Arrival Reliability
 University of Massachusetts Amherst ScholarWorks@UMass Amherst Masters Theses 1911 - February 2014 2009 Optimal Adaptive Departure Time Choices with Real-Time Traveler Information Considering Arrival Reliability
Forecasts for the Reston/Dulles Rail Corridor and Route 28 Corridor 2010 to 2050
 George Mason University Center for Regional Analysis Forecasts for the Reston/Dulles Rail Corridor and Route 28 Corridor 21 to 25 Prepared for the Fairfax County Department of Planning and Zoning Lisa
Keywords: Travel Behavior; Transportation Finance; Global Positioning Systems (GPS)
") 0 0 0 How Local is Travel? Michael Scharenbroich Humphrey Institute of Public Affairs University of Minnesota 0 th Ave. S Minneapolis, MN scha0@umn.edu Michael Iacono* Department of Civil Engineering University
0 0 0 How Local is Travel? Michael Scharenbroich Humphrey Institute of Public Affairs University of Minnesota 0 th Ave. S Minneapolis, MN scha0@umn.edu Michael Iacono* Department of Civil Engineering University
Morning Commute with Competing Modes and Distributed Demand: User Equilibrium, System Optimum, and Pricing. Eric J. Gonzales and Carlos F.
 INSTITUTE OF TRANSPORTATION STUDIES UNIVERSITY OF CALIFORNIA, BERKELEY Morning Commute with Competing Modes and Distributed Demand: User Equilibrium, System Optimum, and Pricing Eric J. Gonzales and Carlos
CHAPTER 5 DELAY ESTIMATION FOR OVERSATURATED SIGNALIZED APPROACHES
 CHAPTER 5 DELAY ESTIMATION FOR OVERSATURATED SIGNALIZED APPROACHES Delay is an important measure of effectiveness in traffic studies, as it presents the direct cost of fuel consumption and indirect cost
CHAPTER 3. CAPACITY OF SIGNALIZED INTERSECTIONS
 CHAPTER 3. CAPACITY OF SIGNALIZED INTERSECTIONS 1. Overview In this chapter we explore the models on which the HCM capacity analysis method for signalized intersections are based. While the method has
Analysis and Design of Urban Transportation Network for Pyi Gyi Ta Gon Township PHOO PWINT ZAN 1, DR. NILAR AYE 2
 www.semargroup.org, www.ijsetr.com ISSN 2319-8885 Vol.03,Issue.10 May-2014, Pages:2058-2063 Analysis and Design of Urban Transportation Network for Pyi Gyi Ta Gon Township PHOO PWINT ZAN 1, DR. NILAR AYE
California Urban Infill Trip Generation Study. Jim Daisa, P.E.
 California Urban Infill Trip Generation Study Jim Daisa, P.E. What We Did in the Study Develop trip generation rates for land uses in urban areas of California Establish a California urban land use trip
A General Equilibrium Model for Transportation Systems with e-hailing Services and Flow Congestion
 A General Equilibrium Model for Transportation Systems with e-hailing Services and Flow Congestion Xuegang (Jeff) Ban Maged Dessouy Jong-Shi Pang Rong Fan September 23, 2018 Abstract Passengers are increasingly
Signalized Intersection Delay Models
 Chapter 35 Signalized Intersection Delay Models 35.1 Introduction Signalized intersections are the important points or nodes within a system of highways and streets. To describe some measure of effectiveness