8/29/2015 Connect Math Plus
|
|
|
- Darrell Moris Benson
- 6 years ago
- Views:
Transcription
1 Page 773 Appendix A Tables Table A Factorials Table B The Binomial Distribution Table C The Poisson Distribution Table D Random Numbers Table E The Standard Normal Distribution Table F The t Distribution Table GThe Chi Square Distribution Table H The F Distribution Table I Critical Values for the PPMC Table J Critical Values for the Sign Test Table K Critical Values for the Wilcoxon Signed Rank Test Table L Critical Values for the Rank Correlation Coefficient Table MCritical Values for the Number of Runs Table NCritical Values for the Tukey Test TABLE A Factorials n n! , , , ,628, ,916, ,001, ,227,020, ,178,291, ,307,674,368, ,922,789,888, ,687,428,096, ,402,373,705,728, ,645,100,408,832, ,432,902,008,176,640,000 IgNsIkr7j8P3jH lbgwdbg1shv52ytigmyvsh_x _gn NB3ozb4Lles8G0b9HKvXUeFNjpgvIlKe3a 1/26


2 IgNsIkr7j8P3jH lbgwdbg1shv52ytigmyvsh_x _gn NB3ozb4Lles8G0b9HKvXUeFNjpgvIlKe3a 2/26


3 IgNsIkr7j8P3jH lbgwdbg1shv52ytigmyvsh_x _gn NB3ozb4Lles8G0b9HKvXUeFNjpgvIlKe3a 3/26


4 IgNsIkr7j8P3jH lbgwdbg1shv52ytigmyvsh_x _gn NB3ozb4Lles8G0b9HKvXUeFNjpgvIlKe3a 4/26


5 IgNsIkr7j8P3jH lbgwdbg1shv52ytigmyvsh_x _gn NB3ozb4Lles8G0b9HKvXUeFNjpgvIlKe3a 5/26


6 Note: All values of or less are omitted. Source: J. Freund and G. Simon, Modern Elementary Statistics, Table The Binomial Distribution, 1992 Prentice Hall, Inc. Reproduced by permission of Pearson Education, Inc. IgNsIkr7j8P3jH lbgwdbg1shv52ytigmyvsh_x _gn NB3ozb4Lles8G0b9HKvXUeFNjpgvIlKe3a 6/26


7 IgNsIkr7j8P3jH lbgwdbg1shv52ytigmyvsh_x _gn NB3ozb4Lles8G0b9HKvXUeFNjpgvIlKe3a 7/26


8 IgNsIkr7j8P3jH lbgwdbg1shv52ytigmyvsh_x _gn NB3ozb4Lles8G0b9HKvXUeFNjpgvIlKe3a 8/26

9 IgNsIkr7j8P3jH lbgwdbg1shv52ytigmyvsh_x _gn NB3ozb4Lles8G0b9HKvXUeFNjpgvIlKe3a 9/26


10 IgNsIkr7j8P3jH lbgwdbg1shv52ytigmyvsh_x _gn NB3ozb4Lles8G0b9HKvXUeFNjpgvIlKe3 10/26

11 IgNsIkr7j8P3jH lbgwdbg1shv52ytigmyvsh_x _gn NB3ozb4Lles8G0b9HKvXUeFNjpgvIlKe3 11/26


12 Reprinted with permission from W. H. Beyer, Handbook of Tables for Probability and Statistics, 2nd ed. Copyright CRC Press, Boca Raton, Fla., IgNsIkr7j8P3jH lbgwdbg1shv52ytigmyvsh_x _gn NB3ozb4Lles8G0b9HKvXUeFNjpgvIlKe3 12/26


13 8/29/2015 Connect Math Plus Reprinted with permission from W. H. Beyer, Handbook of Tables for Probability and Statistics, 2nd ed. Copyright CRC Press, Boca Raton, Fla., IgNsIkr7j8P3jH lbgwdbg1shv52ytigmyvsh_x _gn NB3ozb4Lles8G0b9HKvXUeFNjpgvIlKe3 13/26


14 Page 789 For z values less than 3.49, use IgNsIkr7j8P3jH lbgwdbg1shv52ytigmyvsh_x _gn NB3ozb4Lles8G0b9HKvXUeFNjpgvIlKe3 14/26


15 For z values greater than 3.49, use IgNsIkr7j8P3jH lbgwdbg1shv52ytigmyvsh_x _gn NB3ozb4Lles8G0b9HKvXUeFNjpgvIlKe3 15/26


16 Source: Adapted from W. H. Beyer, Handbook of Tables for Probability and Statistics, 2nd ed., CRC Press, Boca Raton, Fla., Reprinted with permission. IgNsIkr7j8P3jH lbgwdbg1shv52ytigmyvsh_x _gn NB3ozb4Lles8G0b9HKvXUeFNjpgvIlKe3 16/26


17 Source: Owen, Handbook of Statistical Tables, Table A 4 Chi Square Distribution Table, 1962 by Addison Wesley Publishing Company, Inc. Copyright renewal Reproduced by permission of Pearson Education, Inc. IgNsIkr7j8P3jH lbgwdbg1shv52ytigmyvsh_x _gn NB3ozb4Lles8G0b9HKvXUeFNjpgvIlKe3 17/26

18 IgNsIkr7j8P3jH lbgwdbg1shv52ytigmyvsh_x _gn NB3ozb4Lles8G0b9HKvXUeFNjpgvIlKe3 18/26

19 IgNsIkr7j8P3jH lbgwdbg1shv52ytigmyvsh_x _gn NB3ozb4Lles8G0b9HKvXUeFNjpgvIlKe3 19/26

20 IgNsIkr7j8P3jH lbgwdbg1shv52ytigmyvsh_x _gn NB3ozb4Lles8G0b9HKvXUeFNjpgvIlKe3 20/26

21 IgNsIkr7j8P3jH lbgwdbg1shv52ytigmyvsh_x _gn NB3ozb4Lles8G0b9HKvXUeFNjpgvIlKe3 21/26

22 TABLE I Critical Values for the PPMC Reject H 0 : p = 0 if the absolute value of r is greater than the value given in the table. The values are for a two tailed test; d.f. = n 2. d.f. α = 0.05 α = IgNsIkr7j8P3jH lbgwdbg1shv52ytigmyvsh_x _gn NB3ozb4Lles8G0b9HKvXUeFNjpgvIlKe3 22/26
23 Source: From Biometrika Tables for Statisticians, vol. 1 (1962), p Reprinted with permission. TABLE J Critical Values for the Sign Test Reject the null hypothesis if the smaller number of positive or negative signs is less than or equal to the value in the table. One tailed, α = α = 0.01 α = α = 0.05 n Two tailed, α = 0.01 α = 0.02 α = 0.05 α = Source: Table 1, p. 560, from The Statistical Sign Test by W. J. Dixon and A. M. Mood, vol. 41. no. 236 (Dec. 1946), pp TABLE K IgNsIkr7j8P3jH lbgwdbg1shv52ytigmyvsh_x _gn NB3ozb4Lles8G0b9HKvXUeFNjpgvIlKe3 23/26
24 Critical Values for the Wilcoxon Signed Rank Test Reject the null hypothesis if the test value is less than or equal to the value given in the table. One tailed, α = 0.05 α = α = 0.01 α = n Two tailed, α = 0.10 α = 0.05 α = 0.02 α = Source: From Some Rapid Approximate Statistical Procedures, Copyright 1949, 1964 Lerderle Laboratories, American Cyanamid Co., Wayne, N.J. Reprinted with permission. TABLE L Critical Values for the Rank Correlation Coefficient Reject H 0 : p = 0 if the absolute value of r S is greater than the value given in the table. n α = 0.10 α = 0.05 α = 0.02 α = IgNsIkr7j8P3jH lbgwdbg1shv52ytigmyvsh_x _gn NB3ozb4Lles8G0b9HKvXUeFNjpgvIlKe3 24/26
, p. 412.")
25 Source: From N. L. Johnson and F. C. Leone, Statistical and Experimental Design, vol. I (1964), p Reprinted with permission from the Institute of Mathematical Statistics. Source: Adapted from C. Eisenhardt and F. Swed, Tables for Testing Randomness of Grouping in a Sequence of Alternatives, The Annals of Statistics, vol. 14 (1943), pp Reprinted with permission of the Institute of Mathematical Statistics and of the Benjamin/Cummings Publishing Company, in whose publication, Elementary Statistics, 3rd ed. (1989), by Mario F. Triola, this table appears. IgNsIkr7j8P3jH lbgwdbg1shv52ytigmyvsh_x _gn NB3ozb4Lles8G0b9HKvXUeFNjpgvIlKe3 25/26


26 8/29/2015 Connect Math Plus Source: Tables of Range and Studentized Range, Annals of Mathematical Statistics, vol. 31, no. 4. Reprinted with permission of the Institute of Mathematical Sciences. IgNsIkr7j8P3jH lbgwdbg1shv52ytigmyvsh_x _gn NB3ozb4Lles8G0b9HKvXUeFNjpgvIlKe3 26/26
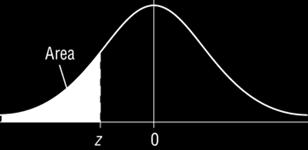
Alternative Presentation of the Standard Normal Distribution
 A2 A APPENDIX A Alternative Presentation of the Standard Normal Distribution WHAT YOU SHOULD LEARN How to find areas under the standard normal curve INSIGHT Because every normal distribution can be transformed
MATH 240. Chapter 8 Outlines of Hypothesis Tests
 MATH 4 Chapter 8 Outlines of Hypothesis Tests Test for Population Proportion p Specify the null and alternative hypotheses, ie, choose one of the three, where p is some specified number: () H : p H : p
Formulas and Tables by Mario F. Triola
 Copyright 010 Pearson Education, Inc. Ch. 3: Descriptive Statistics x f # x x f Mean 1x - x s - 1 n 1 x - 1 x s 1n - 1 s B variance s Ch. 4: Probability Mean (frequency table) Standard deviation P1A or
Formulas and Tables. for Elementary Statistics, Tenth Edition, by Mario F. Triola Copyright 2006 Pearson Education, Inc. ˆp E p ˆp E Proportion
 Formulas and Tables for Elementary Statistics, Tenth Edition, by Mario F. Triola Copyright 2006 Pearson Education, Inc. Ch. 3: Descriptive Statistics x Sf. x x Sf Mean S(x 2 x) 2 s Å n 2 1 n(sx 2 ) 2 (Sx)
Formulas and Tables for Elementary Statistics, Eighth Edition, by Mario F. Triola 2001 by Addison Wesley Longman Publishing Company, Inc.
 Formulas and Tables for Elementary Statistics, Eighth Edition, by Mario F. Triola 2001 by Addison Wesley Longman Publishing Company, Inc. Ch. 2: Descriptive Statistics x Sf. x x Sf Mean S(x 2 x) 2 s 2
Formulas and Tables. for Essentials of Statistics, by Mario F. Triola 2002 by Addison-Wesley. ˆp E p ˆp E Proportion.
 Formulas and Tables for Essentials of Statistics, by Mario F. Triola 2002 by Addison-Wesley. Ch. 2: Descriptive Statistics x Sf. x x Sf Mean S(x 2 x) 2 s Å n 2 1 n(sx 2 ) 2 (Sx) 2 s Å n(n 2 1) Mean (frequency
Introduction to Statistical Hypothesis Testing
 Introduction to Statistical Hypothesis Testing Arun K. Tangirala Hypothesis Testing of Variance and Proportions Arun K. Tangirala, IIT Madras Intro to Statistical Hypothesis Testing 1 Learning objectives
APPENDICES APPENDIX A. STATISTICAL TABLES AND CHARTS 651 APPENDIX B. BIBLIOGRAPHY 677 APPENDIX C. ANSWERS TO SELECTED EXERCISES 679
 APPENDICES APPENDIX A. STATISTICAL TABLES AND CHARTS 1 Table I Summary of Common Probability Distributions 2 Table II Cumulative Standard Normal Distribution Table III Percentage Points, 2 of the Chi-Squared
Statistics Handbook. All statistical tables were computed by the author.
 Statistics Handbook Contents Page Wilcoxon rank-sum test (Mann-Whitney equivalent) Wilcoxon matched-pairs test 3 Normal Distribution 4 Z-test Related samples t-test 5 Unrelated samples t-test 6 Variance
Basic Business Statistics, 10/e
 Chapter 1 1-1 Basic Business Statistics 11 th Edition Chapter 1 Chi-Square Tests and Nonparametric Tests Basic Business Statistics, 11e 009 Prentice-Hall, Inc. Chap 1-1 Learning Objectives In this chapter,
Non-parametric tests, part A:
 Two types of statistical test: Non-parametric tests, part A: Parametric tests: Based on assumption that the data have certain characteristics or "parameters": Results are only valid if (a) the data are
Modeling Hydrologic Chanae
 Modeling Hydrologic Chanae Statistical Methods Richard H. McCuen Department of Civil and Environmental Engineering University of Maryland m LEWIS PUBLISHERS A CRC Press Company Boca Raton London New York
Copyright 2008 Pearson Education, Inc. Publishing as Pearson Addison-Wesley. Chapter 8 Section 6
 Copyright 008 Pearson Education, Inc. Publishing as Pearson Addison-Wesley Chapter 8 Section 6 8.6 Solving Equations with Radicals 1 3 4 Solve radical equations having square root radicals. Identify equations
Factors affecting the Type II error and Power of a test
 Factors affecting the Type II error and Power of a test The factors that affect the Type II error, and hence the power of a hypothesis test are 1. Deviation of truth from postulated value, 6= 0 2 2. Variability
Non-parametric methods
 Eastern Mediterranean University Faculty of Medicine Biostatistics course Non-parametric methods March 4&7, 2016 Instructor: Dr. Nimet İlke Akçay (ilke.cetin@emu.edu.tr) Learning Objectives 1. Distinguish
REFERENCES AND FURTHER STUDIES
 REFERENCES AND FURTHER STUDIES by..0. on /0/. For personal use only.. Afifi, A. A., and Azen, S. P. (), Statistical Analysis A Computer Oriented Approach, Academic Press, New York.. Alvarez, A. R., Welter,
Lecture Slides. Elementary Statistics Eleventh Edition. by Mario F. Triola. and the Triola Statistics Series 9.1-1
 Lecture Slides Elementary Statistics Eleventh Edition and the Triola Statistics Series by Mario F. Triola Copyright 2010, 2007, 2004 Pearson Education, Inc. All Rights Reserved. 9.1-1 Chapter 9 Inferences
What is a Hypothesis?
 What is a Hypothesis? A hypothesis is a claim (assumption) about a population parameter: population mean Example: The mean monthly cell phone bill in this city is μ = $42 population proportion Example:
Business Statistics MEDIAN: NON- PARAMETRIC TESTS
 Business Statistics MEDIAN: NON- PARAMETRIC TESTS CONTENTS Hypotheses on the median The sign test The Wilcoxon signed ranks test Old exam question HYPOTHESES ON THE MEDIAN The median is a central value
PSY 307 Statistics for the Behavioral Sciences. Chapter 20 Tests for Ranked Data, Choosing Statistical Tests
 PSY 307 Statistics for the Behavioral Sciences Chapter 20 Tests for Ranked Data, Choosing Statistical Tests What To Do with Non-normal Distributions Tranformations (pg 382): The shape of the distribution
Math 1040 Final Exam Form A Introduction to Statistics Spring Semester Name Section Instructor
 Math 1040 Final Exam Form A Introduction to Statistics Spring Semester 2015 Name Section Instructor Time Limit: 120 minutes Any calculator is okay. Necessary tables and formulas are attached to the exam.
Dover- Sherborn High School Mathematics Curriculum Probability and Statistics
 Mathematics Curriculum A. DESCRIPTION This is a full year courses designed to introduce students to the basic elements of statistics and probability. Emphasis is placed on understanding terminology and
Statistics for Managers Using Microsoft Excel Chapter 9 Two Sample Tests With Numerical Data
 Statistics for Managers Using Microsoft Excel Chapter 9 Two Sample Tests With Numerical Data 999 Prentice-Hall, Inc. Chap. 9 - Chapter Topics Comparing Two Independent Samples: Z Test for the Difference
Transition Passage to Descriptive Statistics 28
 viii Preface xiv chapter 1 Introduction 1 Disciplines That Use Quantitative Data 5 What Do You Mean, Statistics? 6 Statistics: A Dynamic Discipline 8 Some Terminology 9 Problems and Answers 12 Scales of
NEGATIVE z Scores. TABLE A-2 Standard Normal (z) Distribution: Cumulative Area from the LEFT. (continued)
 Distribution: Cumulative Area from the LEFT. (continued)") NEGATIVE z Score z 0 TALE A- Standard Normal (z) Ditribution: Cumulative Area from the LEFT z.00.01.0.03.04.05.06.07.08.09-3.50 and lower.0001-3.4.0003.0003.0003.0003.0003.0003.0003.0003.0003.000-3.3.0005.0005.0005.0004.0004.0004.0004.0004.0004.0003-3..0007.0007.0006.0006.0006.0006.0006.0005.0005.0005-3.1.0010.0009.0009.0009.0008.0008.0008.0008.0007.0007-3.0.0013.0013.0013.001.001.0011.0011.0011.0010.0010
NEGATIVE z Score z 0 TALE A- Standard Normal (z) Ditribution: Cumulative Area from the LEFT z.00.01.0.03.04.05.06.07.08.09-3.50 and lower.0001-3.4.0003.0003.0003.0003.0003.0003.0003.0003.0003.000-3.3.0005.0005.0005.0004.0004.0004.0004.0004.0004.0003-3..0007.0007.0006.0006.0006.0006.0006.0005.0005.0005-3.1.0010.0009.0009.0009.0008.0008.0008.0008.0007.0007-3.0.0013.0013.0013.001.001.0011.0011.0011.0010.0010
Statistics for Managers Using Microsoft Excel Chapter 10 ANOVA and Other C-Sample Tests With Numerical Data
 Statistics for Managers Using Microsoft Excel Chapter 10 ANOVA and Other C-Sample Tests With Numerical Data 1999 Prentice-Hall, Inc. Chap. 10-1 Chapter Topics The Completely Randomized Model: One-Factor
STATISTIKA INDUSTRI 2 TIN 4004
 STATISTIKA INDUSTRI 2 TIN 4004 Pertemuan 11 & 12 Outline: Nonparametric Statistics Referensi: Walpole, R.E., Myers, R.H., Myers, S.L., Ye, K., Probability & Statistics for Engineers & Scientists, 9 th
Statistics for Managers Using Microsoft Excel/SPSS Chapter 8 Fundamentals of Hypothesis Testing: One-Sample Tests
 Statistics for Managers Using Microsoft Excel/SPSS Chapter 8 Fundamentals of Hypothesis Testing: One-Sample Tests 1999 Prentice-Hall, Inc. Chap. 8-1 Chapter Topics Hypothesis Testing Methodology Z Test
Chapter Fifteen. Frequency Distribution, Cross-Tabulation, and Hypothesis Testing
 Chapter Fifteen Frequency Distribution, Cross-Tabulation, and Hypothesis Testing Copyright 2010 Pearson Education, Inc. publishing as Prentice Hall 15-1 Internet Usage Data Table 15.1 Respondent Sex Familiarity
SEVERAL μs AND MEDIANS: MORE ISSUES. Business Statistics
 SEVERAL μs AND MEDIANS: MORE ISSUES Business Statistics CONTENTS Post-hoc analysis ANOVA for 2 groups The equal variances assumption The Kruskal-Wallis test Old exam question Further study POST-HOC ANALYSIS
Statistics for Managers Using Microsoft Excel
 Statistics for Managers Using Microsoft Excel 7 th Edition Chapter 1 Chi-Square Tests and Nonparametric Tests Statistics for Managers Using Microsoft Excel 7e Copyright 014 Pearson Education, Inc. Chap
Increasing Power in Paired-Samples Designs. by Correcting the Student t Statistic for Correlation. Donald W. Zimmerman. Carleton University
 Power in Paired-Samples Designs Running head: POWER IN PAIRED-SAMPLES DESIGNS Increasing Power in Paired-Samples Designs by Correcting the Student t Statistic for Correlation Donald W. Zimmerman Carleton
POLI 443 Applied Political Research
 POLI 443 Applied Political Research Session 4 Tests of Hypotheses The Normal Curve Lecturer: Prof. A. Essuman-Johnson, Dept. of Political Science Contact Information: aessuman-johnson@ug.edu.gh College
CHAPTER 17 CHI-SQUARE AND OTHER NONPARAMETRIC TESTS FROM: PAGANO, R. R. (2007)
") FROM: PAGANO, R. R. (007) I. INTRODUCTION: DISTINCTION BETWEEN PARAMETRIC AND NON-PARAMETRIC TESTS Statistical inference tests are often classified as to whether they are parametric or nonparametric Parameter
FROM: PAGANO, R. R. (007) I. INTRODUCTION: DISTINCTION BETWEEN PARAMETRIC AND NON-PARAMETRIC TESTS Statistical inference tests are often classified as to whether they are parametric or nonparametric Parameter
SLCC MATH 1040 FINAL EXAM FALL 2015
 SLCC MATH 1040 FINAL EXAM FALL 015 Form A NAME: INSTRUCTOR: TEST INSTRUCTIONS: This exam consists of both "multiple choice" and "free response" questions. For "free response" questions, you must support
Spearman Rho Correlation
 Spearman Rho Correlation Learning Objectives After studying this Chapter, you should be able to: know when to use Spearman rho, Calculate Spearman rho coefficient, Interpret the correlation coefficient,
Introduction and Descriptive Statistics p. 1 Introduction to Statistics p. 3 Statistics, Science, and Observations p. 5 Populations and Samples p.
 Preface p. xi Introduction and Descriptive Statistics p. 1 Introduction to Statistics p. 3 Statistics, Science, and Observations p. 5 Populations and Samples p. 6 The Scientific Method and the Design of
Determine the moment of inertia of the area about the x axis Determine the moment of inertia of the area about the y axis.
 10 Solutions 44918 1/28/09 4:21 PM Page 941 2010 Pearson Education, Inc., Upper Saddle River, NJ. All rights reserved. This material is protected under all copright laws as the currentl eist. No portion
7.2 One-Sample Correlation ( = a) Introduction. Correlation analysis measures the strength and direction of association between
 Introduction. Correlation analysis measures the strength and direction of association between") 7.2 One-Sample Correlation ( = a) Introduction Correlation analysis measures the strength and direction of association between variables. In this chapter we will test whether the population correlation
7.2 One-Sample Correlation ( = a) Introduction Correlation analysis measures the strength and direction of association between variables. In this chapter we will test whether the population correlation
CHI SQUARE ANALYSIS 8/18/2011 HYPOTHESIS TESTS SO FAR PARAMETRIC VS. NON-PARAMETRIC
 CHI SQUARE ANALYSIS I N T R O D U C T I O N T O N O N - P A R A M E T R I C A N A L Y S E S HYPOTHESIS TESTS SO FAR We ve discussed One-sample t-test Dependent Sample t-tests Independent Samples t-tests
Chapter 4. Regression Models. Learning Objectives
 Chapter 4 Regression Models To accompany Quantitative Analysis for Management, Eleventh Edition, by Render, Stair, and Hanna Power Point slides created by Brian Peterson Learning Objectives After completing
Class 24. Daniel B. Rowe, Ph.D. Department of Mathematics, Statistics, and Computer Science. Marquette University MATH 1700
 Class 4 Daniel B. Rowe, Ph.D. Department of Mathematics, Statistics, and Computer Science Copyright 013 by D.B. Rowe 1 Agenda: Recap Chapter 9. and 9.3 Lecture Chapter 10.1-10.3 Review Exam 6 Problem Solving
Quality of tests Mixed exercise 8
 Quality of tests Mixed exercise 8 1 a H :p=.35 H 1 :p>.35 Assume H, so that X B(15,.35) Significance level 5%, so require c such that P( Xc)
DETAILED CONTENTS PART I INTRODUCTION AND DESCRIPTIVE STATISTICS. 1. Introduction to Statistics
 DETAILED CONTENTS About the Author Preface to the Instructor To the Student How to Use SPSS With This Book PART I INTRODUCTION AND DESCRIPTIVE STATISTICS 1. Introduction to Statistics 1.1 Descriptive and
Classroom Activity 7 Math 113 Name : 10 pts Intro to Applied Stats
 Classroom Activity 7 Math 113 Name : 10 pts Intro to Applied Stats Materials Needed: Bags of popcorn, watch with second hand or microwave with digital timer. Instructions: Follow the instructions on the
Salt Lake Community College MATH 1040 Final Exam Fall Semester 2011 Form E
 Salt Lake Community College MATH 1040 Final Exam Fall Semester 011 Form E Name Instructor Time Limit: 10 minutes Any hand-held calculator may be used. Computers, cell phones, or other communication devices
Types of Statistical Tests DR. MIKE MARRAPODI
 Types of Statistical Tests DR. MIKE MARRAPODI Tests t tests ANOVA Correlation Regression Multivariate Techniques Non-parametric t tests One sample t test Independent t test Paired sample t test One sample
Lecture Slides. Elementary Statistics. by Mario F. Triola. and the Triola Statistics Series
 Lecture Slides Elementary Statistics Tenth Edition and the Triola Statistics Series by Mario F. Triola Slide 1 Chapter 13 Nonparametric Statistics 13-1 Overview 13-2 Sign Test 13-3 Wilcoxon Signed-Ranks
Lecture Slides. Section 13-1 Overview. Elementary Statistics Tenth Edition. Chapter 13 Nonparametric Statistics. by Mario F.
 Lecture Slides Elementary Statistics Tenth Edition and the Triola Statistics Series by Mario F. Triola Slide 1 Chapter 13 Nonparametric Statistics 13-1 Overview 13-2 Sign Test 13-3 Wilcoxon Signed-Ranks
Presented at the 2008 SCEA-ISPA Joint Annual Conference and Training Workshop - Myung-Yul Lee 1 C-17 Program, The Boeing Company
 Myung-Yul Lee 1 Using C-17 Program's Data to Build a Parametric Model for the Engineering Organization Introduction The Boeing Company, C-17 program, located in Long Beach, California has produced more
Chapter 24. Comparing Means. Copyright 2010 Pearson Education, Inc.
 Chapter 24 Comparing Means Copyright 2010 Pearson Education, Inc. Plot the Data The natural display for comparing two groups is boxplots of the data for the two groups, placed side-by-side. For example:
HYPOTHESIS TESTING II TESTS ON MEANS. Sorana D. Bolboacă
 HYPOTHESIS TESTING II TESTS ON MEANS Sorana D. Bolboacă OBJECTIVES Significance value vs p value Parametric vs non parametric tests Tests on means: 1 Dec 14 2 SIGNIFICANCE LEVEL VS. p VALUE Materials and
NONPARAMETRICS. Statistical Methods Based on Ranks E. L. LEHMANN HOLDEN-DAY, INC. McGRAW-HILL INTERNATIONAL BOOK COMPANY
 NONPARAMETRICS Statistical Methods Based on Ranks E. L. LEHMANN University of California, Berkeley With the special assistance of H. J. M. D'ABRERA University of California, Berkeley HOLDEN-DAY, INC. San
Mini Lecture 2.1 Introduction to Functions
 Mini Lecture.1 Introduction to Functions 1. Find the domain and range of a relation.. Determine whether a relation is a function. 3. Evaluate a function. 1. Find the domain and range of the relation. a.
Section 4.1 Polynomial Functions and Models. Copyright 2013 Pearson Education, Inc. All rights reserved
 Section 4.1 Polynomial Functions and Models Copyright 2013 Pearson Education, Inc. All rights reserved 3 8 ( ) = + (a) f x 3x 4x x (b) ( ) g x 2 x + 3 = x 1 (a) f is a polynomial of degree 8. (b) g is
Non-parametric Hypothesis Testing
 Non-parametric Hypothesis Testing Procedures Hypothesis Testing General Procedure for Hypothesis Tests 1. Identify the parameter of interest.. Formulate the null hypothesis, H 0. 3. Specify an appropriate
Introduction to Statistical Data Analysis Lecture 7: The Chi-Square Distribution
 Introduction to Statistical Data Analysis Lecture 7: The Chi-Square Distribution James V. Lambers Department of Mathematics The University of Southern Mississippi James V. Lambers Statistical Data Analysis
Statistical Hypothesis Testing with SAS and R
 Statistical Hypothesis Testing with SAS and R Statistical Hypothesis Testing with SAS and R Dirk Taeger Institute for Prevention and Occupational Medicine of the German Social Accident Insurance, Institute
A Monte Carlo Simulation of the Robust Rank- Order Test Under Various Population Symmetry Conditions
 Journal of Modern Applied Statistical Methods Volume 12 Issue 1 Article 7 5-1-2013 A Monte Carlo Simulation of the Robust Rank- Order Test Under Various Population Symmetry Conditions William T. Mickelson
TEST POWER IN COMPARISON DIFFERENCE BETWEEN TWO INDEPENDENT PROPORTIONS
 TEST POWER IN COMPARISON DIFFERENCE BETWEEN TWO INDEPENDENT PROPORTIONS Mehmet MENDES PhD, Associate Professor, Canakkale Onsekiz Mart University, Agriculture Faculty, Animal Science Department, Biometry
Math 1040 Final Exam Form A Introduction to Statistics Fall Semester 2010
 Math 1040 Final Exam Form A Introduction to Statistics Fall Semester 2010 Instructor Name Time Limit: 120 minutes Any calculator is okay. Necessary tables and formulas are attached to the back of the exam.
2.2. Limits Involving Infinity. Copyright 2007 Pearson Education, Inc. Publishing as Pearson Prentice Hall
 2.2 Limits Involving Infinity Copyright 2007 Pearson Education, Inc. Publishing as Pearson Prentice Hall Finite Limits as x ± What you ll learn about Sandwich Theorem Revisited Infinite Limits as x a End
Hypothesis Tests and Estimation for Population Variances. Copyright 2014 Pearson Education, Inc.
 Hypothesis Tests and Estimation for Population Variances 11-1 Learning Outcomes Outcome 1. Formulate and carry out hypothesis tests for a single population variance. Outcome 2. Develop and interpret confidence
Chapter 18 Resampling and Nonparametric Approaches To Data
 Chapter 18 Resampling and Nonparametric Approaches To Data 18.1 Inferences in children s story summaries (McConaughy, 1980): a. Analysis using Wilcoxon s rank-sum test: Younger Children Older Children
Can you tell the relationship between students SAT scores and their college grades?
 Correlation One Challenge Can you tell the relationship between students SAT scores and their college grades? A: The higher SAT scores are, the better GPA may be. B: The higher SAT scores are, the lower
Contents Kruskal-Wallis Test Friedman s Two-way Analysis of Variance by Ranks... 47
 Contents 1 Non-parametric Tests 3 1.1 Introduction....................................... 3 1.2 Advantages of Non-parametric Tests......................... 4 1.3 Disadvantages of Non-parametric Tests........................
Business Statistics. Chapter 6 Review of Normal Probability Distribution QMIS 220. Dr. Mohammad Zainal
 Department of Quantitative Methods & Information Systems Business Statistics Chapter 6 Review of Normal Probability Distribution QMIS 220 Dr. Mohammad Zainal Chapter Goals After completing this chapter,
Solutions to Odd-Numbered End-of-Chapter Exercises: Chapter 14
 Introduction to Econometrics (3 rd Updated Edition) by James H. Stock and Mark W. Watson Solutions to Odd-Numbered End-of-Chapter Exercises: Chapter 14 (This version July 0, 014) 015 Pearson Education,
Dr. Maddah ENMG 617 EM Statistics 10/12/12. Nonparametric Statistics (Chapter 16, Hines)
") Dr. Maddah ENMG 617 EM Statistics 10/12/12 Nonparametric Statistics (Chapter 16, Hines) Introduction Most of the hypothesis testing presented so far assumes normally distributed data. These approaches
Dr. Maddah ENMG 617 EM Statistics 10/12/12 Nonparametric Statistics (Chapter 16, Hines) Introduction Most of the hypothesis testing presented so far assumes normally distributed data. These approaches
GENERAL PROBLEMS OF METROLOGY AND MEASUREMENT TECHNIQUE
 DOI 10.1007/s11018-017-1141-3 Measurement Techniques, Vol. 60, No. 1, April, 2017 GENERAL PROBLEMS OF METROLOGY AND MEASUREMENT TECHNIQUE APPLICATION AND POWER OF PARAMETRIC CRITERIA FOR TESTING THE HOMOGENEITY
Application of Parametric Homogeneity of Variances Tests under Violation of Classical Assumption
 Application of Parametric Homogeneity of Variances Tests under Violation of Classical Assumption Alisa A. Gorbunova and Boris Yu. Lemeshko Novosibirsk State Technical University Department of Applied Mathematics,
FRANKLIN UNIVERSITY PROFICIENCY EXAM (FUPE) STUDY GUIDE
 STUDY GUIDE") FRANKLIN UNIVERSITY PROFICIENCY EXAM (FUPE) STUDY GUIDE Course Title: Probability and Statistics (MATH 80) Recommended Textbook(s): Number & Type of Questions: Probability and Statistics for Engineers
FRANKLIN UNIVERSITY PROFICIENCY EXAM (FUPE) STUDY GUIDE Course Title: Probability and Statistics (MATH 80) Recommended Textbook(s): Number & Type of Questions: Probability and Statistics for Engineers
Lecture Slides. Elementary Statistics. by Mario F. Triola. and the Triola Statistics Series
 Lecture Slides Elementary Statistics Tenth Edition and the Triola Statistics Series by Mario F. Triola Slide 1 Chapter 9 Inferences from Two Samples 9-1 Overview 9-2 Inferences About Two Proportions 9-3
Introduction to Statistics Tutorial: Large-Sample Estimation. INCOGEN, Inc. 2008
 Introduction to Statistics Tutorial: Large-Sample Estimation INCOGEN, Inc. 2008 Outline Types of estimators Evaluating goodness of an estimator Calculating confidence intervals Choosing sample size Estimating
GROUPED DATA E.G. FOR SAMPLE OF RAW DATA (E.G. 4, 12, 7, 5, MEAN G x / n STANDARD DEVIATION MEDIAN AND QUARTILES STANDARD DEVIATION
 FOR SAMPLE OF RAW DATA (E.G. 4, 1, 7, 5, 11, 6, 9, 7, 11, 5, 4, 7) BE ABLE TO COMPUTE MEAN G / STANDARD DEVIATION MEDIAN AND QUARTILES Σ ( Σ) / 1 GROUPED DATA E.G. AGE FREQ. 0-9 53 10-19 4...... 80-89
POLI 443 Applied Political Research
 POLI 443 Applied Political Research Session 6: Tests of Hypotheses Contingency Analysis Lecturer: Prof. A. Essuman-Johnson, Dept. of Political Science Contact Information: aessuman-johnson@ug.edu.gh College
Department of Economics. Business Statistics. Chapter 12 Chi-square test of independence & Analysis of Variance ECON 509. Dr.
 Department of Economics Business Statistics Chapter 1 Chi-square test of independence & Analysis of Variance ECON 509 Dr. Mohammad Zainal Chapter Goals After completing this chapter, you should be able
Preface Introduction to Statistics and Data Analysis Overview: Statistical Inference, Samples, Populations, and Experimental Design The Role of
 Preface Introduction to Statistics and Data Analysis Overview: Statistical Inference, Samples, Populations, and Experimental Design The Role of Probability Sampling Procedures Collection of Data Measures
Student Workbook for College Physics: A Strategic Approach Volume 2 Knight Jones Field Andrews Second Edition
 Student Workbook for College Physics: A Strategic Approach Volume 2 Knight Jones Field Andrews Second Edition Pearson Education Limited Edinburgh Gate Harlow Esse CM2 2JE England and Associated Companies
BIO 682 Nonparametric Statistics Spring 2010
 BIO 682 Nonparametric Statistics Spring 2010 Steve Shuster http://www4.nau.edu/shustercourses/bio682/index.htm Lecture 8 Example: Sign Test 1. The number of warning cries delivered against intruders by
Unit 14: Nonparametric Statistical Methods
 Unit 14: Nonparametric Statistical Methods Statistics 571: Statistical Methods Ramón V. León 8/8/2003 Unit 14 - Stat 571 - Ramón V. León 1 Introductory Remarks Most methods studied so far have been based
SCHOOL OF MATHEMATICS AND STATISTICS. Linear and Generalised Linear Models
 SCHOOL OF MATHEMATICS AND STATISTICS Linear and Generalised Linear Models Autumn Semester 2017 18 2 hours Attempt all the questions. The allocation of marks is shown in brackets. RESTRICTED OPEN BOOK EXAMINATION
Introduction to Statistical Inference Lecture 10: ANOVA, Kruskal-Wallis Test
 Introduction to Statistical Inference Lecture 10: ANOVA, Kruskal-Wallis Test la Contents The two sample t-test generalizes into Analysis of Variance. In analysis of variance ANOVA the population consists
Nonparametric Tests. Mathematics 47: Lecture 25. Dan Sloughter. Furman University. April 20, 2006
 Nonparametric Tests Mathematics 47: Lecture 25 Dan Sloughter Furman University April 20, 2006 Dan Sloughter (Furman University) Nonparametric Tests April 20, 2006 1 / 14 The sign test Suppose X 1, X 2,...,
Lec 1: An Introduction to ANOVA
 Ying Li Stockholm University October 31, 2011 Three end-aisle displays Which is the best? Design of the Experiment Identify the stores of the similar size and type. The displays are randomly assigned to
Nonparametric Statistics. Leah Wright, Tyler Ross, Taylor Brown
 Nonparametric Statistics Leah Wright, Tyler Ross, Taylor Brown Before we get to nonparametric statistics, what are parametric statistics? These statistics estimate and test population means, while holding
Elementary Statistics Triola, Elementary Statistics 11/e Unit 17 The Basics of Hypotheses Testing
 (Section 8-2) Hypotheses testing is not all that different from confidence intervals, so let s do a quick review of the theory behind the latter. If it s our goal to estimate the mean of a population,
Finding Outliers in Monte Carlo Computations
 Finding Outliers in Monte Carlo Computations Prof. Michael Mascagni Department of Computer Science Department of Mathematics Department of Scientific Computing Graduate Program in Molecular Biophysics
Distribution-Free Tests for Two-Sample Location Problems Based on Subsamples
 3 Journal of Advanced Statistics Vol. No. March 6 https://dx.doi.org/.66/jas.6.4 Distribution-Free Tests for Two-Sample Location Problems Based on Subsamples Deepa R. Acharya and Parameshwar V. Pandit
Let the x-axis have the following intervals:
 1 & 2. For the following sets of data calculate the mean and standard deviation. Then graph the data as a frequency histogram on the corresponding set of axes. Set 1: Length of bass caught in Conesus Lake
Comparison of Power between Adaptive Tests and Other Tests in the Field of Two Sample Scale Problem
 Comparison of Power between Adaptive Tests and Other Tests in the Field of Two Sample Scale Problem Chikhla Jun Gogoi 1, Dr. Bipin Gogoi 2 1 Research Scholar, Department of Statistics, Dibrugarh University,
AN IMPROVEMENT TO THE ALIGNED RANK STATISTIC
 Journal of Applied Statistical Science ISSN 1067-5817 Volume 14, Number 3/4, pp. 225-235 2005 Nova Science Publishers, Inc. AN IMPROVEMENT TO THE ALIGNED RANK STATISTIC FOR TWO-FACTOR ANALYSIS OF VARIANCE
TUTORIAL 8 SOLUTIONS #
 TUTORIAL 8 SOLUTIONS #9.11.21 Suppose that a single observation X is taken from a uniform density on [0,θ], and consider testing H 0 : θ = 1 versus H 1 : θ =2. (a) Find a test that has significance level
Inter-Rater Agreement
 Engineering Statistics (EGC 630) Dec., 008 http://core.ecu.edu/psyc/wuenschk/spss.htm Degree of agreement/disagreement among raters Inter-Rater Agreement Psychologists commonly measure various characteristics
Chap The McGraw-Hill Companies, Inc. All rights reserved.
 11 pter11 Chap Analysis of Variance Overview of ANOVA Multiple Comparisons Tests for Homogeneity of Variances Two-Factor ANOVA Without Replication General Linear Model Experimental Design: An Overview
Chapter 8 Student Lecture Notes 8-1. Department of Economics. Business Statistics. Chapter 12 Chi-square test of independence & Analysis of Variance
 Chapter 8 Student Lecture Notes 8-1 Department of Economics Business Statistics Chapter 1 Chi-square test of independence & Analysis of Variance ECON 509 Dr. Mohammad Zainal Chapter Goals After completing
Inequalities Between Hypergeometric Tails
 JOURNAL OF APPLIED MATHEMATICS AND DECISION SCIENCES, 7(3), 165 174 Copyright c 2003, Lawrence Erlbaum Associates, Inc. Inequalities Between Hypergeometric Tails MARY C. PHIPPS maryp@maths.usyd.edu.au
S. R. Tate. Stable Computation of the Complex Roots of Unity, IEEE Transactions on Signal Processing, Vol. 43, No. 7, 1995, pp
 Stable Computation of the Complex Roots of Unity By: Stephen R. Tate S. R. Tate. Stable Computation of the Complex Roots of Unity, IEEE Transactions on Signal Processing, Vol. 43, No. 7, 1995, pp. 1709
Hypothesis testing Mixed exercise 4
 Hypothesis testing Mixed exercise 4 1 a Let the random variable X denote the number of vehicles passing the point in a 1-minute period. 39 Use the Poisson distribution model X Po, i.e. X Po(.5).5 e.5 P(
Math 152. Rumbos Fall Solutions to Exam #2
 Math 152. Rumbos Fall 2009 1 Solutions to Exam #2 1. Define the following terms: (a) Significance level of a hypothesis test. Answer: The significance level, α, of a hypothesis test is the largest probability