Analysis of Cross-Sectional Data
|
|
|
- Carmel Marsha Burns
- 6 years ago
- Views:
Transcription
1 Analysis of Cross-Sectional Data Kevin Sheppard Oxford MFE This version: November 8, 2017 November 13 14, 2017

2 Outline Econometric models Specification that can be analyzed with linear regression Factor models for returns Estimation of unknown parameters Assessing model fit The relationship between OLS and ML Testing Hypotheses: Wald, LR and LM Model building Checking for assumption violation 2 / 64
3 Large Sample Properties Theorem (Asymptotic Distribution of ˆ ) Under these assumptions p n( ˆ n ) d! N(0, 1 XX S 1 XX ) (1) where XX = E[x 0 i x i] and S = V[n 1/2 X 0 ]. CLT is a strong result that will form the basis of the inference we can make on What good is a CLT? 3 / 64
4 Estimating the parameter covariance p Before making inference, the covariance of n ˆ must be estimated Theorem (Asymptotic Covariance Consistency) Under the large sample assumptions, and ˆ XX =n 1 X 0 X! p XX nx Ŝ =n 1 ˆ 2 i x0 i x p i! S i=1 =n 1 X 0 ÊX ˆ 1 XXŜ ˆ 1 XX p! 1 XX S 1 XX where Ê = diag( ˆ 2 1,..., ˆ 2 n ). 4 / 64
5 Bootstrap Estimation of Parameter Covariance 2 common bootstraps for estimating regression parameter covariance 1. Residual Bootstrap Appropriate when data are conditionally homoskedastic Separate selection of xi and ˆ i when constructing bootstrap ỹ i 2. Non-parametric Bootstrap Works under more general conditions Resamples {yi, x i } as a pair Both are for data where the errors are not cross-sectionally correlated 5 / 64
![The Bootstrap Algorithm for homoskedastic data Algorithm (Residual Bootstrap Regression Covariance) 1. Generate 2 sets of n uniform integers {u 1,i } n i=1 and {u 2,i} n i=1on [1, 2,...,n]. 2. Construct a simulated sample ỹ u1,i = x u1,i ˆ + ˆ u2,i.](/docs-images/75/72373169/images/6-2.jpg "3. Estimate the parameters of interest using ỹ u1,i = x u1,i + u1,i, and denote the estimate b. 4. Repeat steps 1 through 3 a total of B times. 5.")
6 The Bootstrap Algorithm for homoskedastic data Algorithm (Residual Bootstrap Regression Covariance) 1. Generate 2 sets of n uniform integers {u 1,i } n i=1 and {u 2,i} n i=1on [1, 2,...,n]. 2. Construct a simulated sample ỹ u1,i = x u1,i ˆ + ˆ u2,i. 3. Estimate the parameters of interest using ỹ u1,i = x u1,i + u1,i, and denote the estimate b. 4. Repeat steps 1 through 3 a total of B times. 5. Estimate the variance of ˆ using bv ˆ = B 1 BX j ˆ j ˆ 0 or bv ˆ b=1 = B 1 BX j j 0 b=1 6 / 64

7 The Bootstrap Algorithm for heteroskedastic data Algorithm (Nonparametric Bootstrap Regression Covariance) 1. Generate a sets of n uniform integers {u i } n i=1 on [1, 2,...,n]. 2. Construct a simulated sample {y ui, x ui }. 3. Estimate the parameters of interest using y ui = x ui + ui, and denote the estimate b. 4. Repeat steps 1 through 3 a total of B times. 5. Estimate the variance of ˆ using bv ˆ = B 1 BX j ˆ j ˆ 0 or bv ˆ b=1 = B 1 BX j j 0 b=1 7 / 64
8 Hypothesis Testing

9 Hypothesis Testing 8 / 64
10 Elements of a hypothesis test Definition (Null Hypothesis) The null hypothesis, denoted H 0, is a statement about the population values of some parameters to be tested. The null hypothesis is also known as the maintained hypothesis. Null is important because it determines the conditions under which the distribution of ˆ must be known Definition (Alternative Hypothesis) The alternative hypothesis, denoted H 1, is a complementary hypothesis to the null and determines the range of values of the population parameter that should lead to rejection of the null. Alternative is important because it determines the conditions where the null should be rejected H 0 : Market = 0, H 1 : Market > 0 or H 1 : Market 6= 0 9 / 64

11 Elements of a hypothesis test Definition (Hypothesis Test) A hypothesis test is a rule that specifies the values where H 0 should be rejected in favor of H 1. The test embeds a test statistic and a rule which determines if H0 can be rejected Note: Failing to reject the null does not mean the null is accepted. Definition (Critical Value) The critical value for an -sized test, denoted C, is the value where a test statistic, T, indicates rejection of the null hypothesis when the null is true. CV is the value where the null is just rejected CV is usually a point although can be a set 10 / 64
 A Type I error is the event that the null is rejected when the null is actually valid.")
12 Elements of a hypothesis test Definition (Rejection Region) The rejection region is the region where T > C. Definition (Type I Error) A Type I error is the event that the null is rejected when the null is actually valid. Controlling the Type I is the basis of frequentist testing Note: Occurs only when null is true Definition (Size) The size or level of a test, denoted, is the probability of rejecting the null when the null is true. The size is also the probability of a Type I error. Size represents the preference for being wrong and rejecting true null 11 / 64
 The power of the test is the probability of rejecting the null when the alternative is true.")
13 Elements of a hypothesis test Definition (Type II Error) A Type II error is the event that the null is not rejected when the alternative is true. A Type II occurs when the null is not rejected when it should be Definition (Power) The power of the test is the probability of rejecting the null when the alternative is true. The power is equivalently defined as 1 minus the probability of a Type II error. High power tests can discriminate between the null and the alternative with a relatively small amount of data 12 / 64
 H 1 Type II Error Correct (Power) 13 / 64")
14 Type I & II Errors, Size and Power Size and power can be related to correct and incorrect decisions Decision Do not reject H 0 Reject H 0 Truth H 0 Correct Type I Error (Size) H 1 Type II Error Correct (Power) 13 / 64
( 2 1) =0 H 0 : Linear Equality Hypotheses (LEH) H 0 : R r = 0 or in long hand, kx j=1 R i,j 1 2 1 + 2 1 = 0 j = r i, i = 1,")
15 Hypothesis testing in regressions Distribution theory allows for inference Hypothesis H 0 : R( )=0 R( ) is a function from R k! R m, m apple k All equality hypotheses can be written this way H 0 : ( 1 1)( 2 1) =0 H 0 : Linear Equality Hypotheses (LEH) H 0 : R r = 0 or in long hand, kx j=1 R i,j = 0 j = r i, i = 1, 2,...,m R is an m by k matrix r is an m by 1 vector Attention limited to linear hypotheses in this chapter Nonlinear hypotheses examined in GMM notes 14 / 64
![What is a linear hypothesis 3-Factor FF Model: BH e i = 1 + 2 VWM e i + 3 SMB i + 4 HML i + i H 0 : 2 = 0 [Market Neutral] R =[0100] r = 0 H 0 : 2 + 3 = 1 R =[0110] r = 1](/docs-images/75/72373169/images/16-2.jpg "H 0 : 3 = 4 = 0 [CAPM with nonzero intercept] apple 0 0 1 0 R = 0 0 0 1 r =[0 0] 0 H 0 : 1 = 0, 2 = 1, 2 + 3 + 4 = 1 2 3 1 0 0 0 R = 4 0 1 0 0 5 0 1 1 1 r =[0 1 1] 0 15 /")
16 What is a linear hypothesis 3-Factor FF Model: BH e i = VWM e i + 3 SMB i + 4 HML i + i H 0 : 2 = 0 [Market Neutral] R =[0100] r = 0 H 0 : = 1 R =[0110] r = 1 H 0 : 3 = 4 = 0 [CAPM with nonzero intercept] apple R = r =[0 0] 0 H 0 : 1 = 0, 2 = 1, = R = r =[0 1 1] 0 15 / 64

 + i r i = 3 r P i + i 16 / 64")
17 Estimating linear regressions subject to LER Linear regressions subject to linear equality constraints can always be directly estimated using a transformed regression BHi e = VWMi e + 3 SMB i + 4 HML i + i H 0 : 1 = 0, 2 = 1, = 1 ) 2 = ) 1 = ) 3 = 4BHi e Combine to produce restricted model BH e i = 0 + 1VWM e i + 3 SMB i 3 HML i + i BH e i VWM e i = 3(SMB i HML i ) + i r i = 3 r P i + i 16 / 64
 Lagrange Multiplier (LM) Also Score")
 Likelihood Ratio (LR) Tests magnitude of")

18 3 Major Categories of Tests Wald Directly tests magnitude of R r t-test is a special case Estimation only under alternative (unrestricted model) Lagrange Multiplier (LM) Also Score test or Rao test Tests how close to a minimum the sum of squared errors is if the null is true Estimation only under null (restricted model) Likelihood Ratio (LR) Tests magnitude of log-likelihood difference between the null and alternative Invariant to reparameterization Good thing! Estimation under both null and alternative Close to LM in asymptotic framework 17 / 64
 elihood")
 (y Xβ)) β ˆβ 18")
19 Visualizing the three tests Rβ r =0 2X (y Xβ) elihood tio Lagrange Multiplier Wald (y Xβ) (y Xβ)) β ˆβ 18 / 64
 ) p n R ˆ Note: Under the null H0 : R = r Transform to standard normal random variable z = p R n ˆ r q R 1 XX S 1 XX R0 Infeasible: Depends on unknown covariance Construct feasible")
20 t-tests Single linear hypothesis: H0 : R = r p n ˆ d! N(0, 1 XX S 1 XX ) ) p n R ˆ Note: Under the null H0 : R = r Transform to standard normal random variable z = p R n ˆ r q R 1 XX S 1 XX R0 Infeasible: Depends on unknown covariance Construct feasible version using estimate t = p R n ˆ r q R ˆ XXŜ 1 ˆ XXR 1 0 r d! N(0, R 1 XX S 1 XX R0 ) Estimated variance of R ˆ Note: Asymptotic distribution is unaffected since covariance estimator is consistent 19 / 64
 t-stat of a coefficient ˆk is test of H 0 : k = 0 against H 0 : k 6= 0 p n ˆk r 1 XX S 1 XX Single most common statistic Reported for nearly every")
21 t-test and t-stat Unique property of t-tests: Easily test one-sided alternatives H 0 : 1 = 0 vs. H 1 : 1 > 0 More powerful if you know the sign (e.g. risk premia) t-stat of a coefficient ˆk is test of H 0 : k = 0 against H 0 : k 6= 0 p n ˆk r 1 XX S 1 XX Single most common statistic Reported for nearly every coefficient [kk] ] 20 / 64

22 Distribution and rejection region 95% One sided (Upper) 95% 2 sided z ˆβ β 0 se( ˆβ) / 64
23 Implementing a t Test Algorithm (t-test) 1. Estimate the unrestricted model y i = x i + i 2. Estimate the parameter covariance using ˆ 1 XXŜ ˆ 1 XX 3. Construct the restriction matrix, R, and the value of the restriction, r, from null 4. Compute t = p n R ˆ n r p, v = R ˆ 1 v XXŜ ˆ XXR Make decision (C is the upper tail -CV from N(0, 1)): a. 1-sided Upper: Reject the null if t > C b. 1-sided Lower: Reject the null if t < C c. 2-sided: Reject the null if t > C /2 22 / 64

24 t-tests on the FF Portfolios Testing the coefficients on the BH e portfolio All have H0 : j = 0 and H 1 : j 6= 0 Definition (P-value) Heteroskedasticity Parameter ˆ S.E. t-stat p-val Constant VWM e SMB HML UMD The p-value is largest size ( ) where the null hypothesis cannot be rejected. The p-value can be equivalently defined as the smallest size where the null hypothesis can be rejected. Should be familiar with 1.645, 1.96 (2) and / 64
 Standardized and squared W = n(r ˆ r) 0 h R 1 XX S 1 XX R0i 1 (R ˆ r) d!")
25 Wald tests Wald tests examine validity of one or more equality restriction by measuring magnitude of R r For same reasons as t-test, under the null p n R ˆ r d! N(0, R 1 XX S 1 XX R0 ) Standardized and squared W = n(r ˆ r) 0 h R 1 XX S 1 XX R0i 1 (R ˆ r) d! 2 m Again, this is infeasible, so use the feasible version W = n(r ˆ r) 0 h R ˆ 1 XXŜ ˆ 1 XXR 0i 1 (R ˆ r) d! 2 m 24 / 64
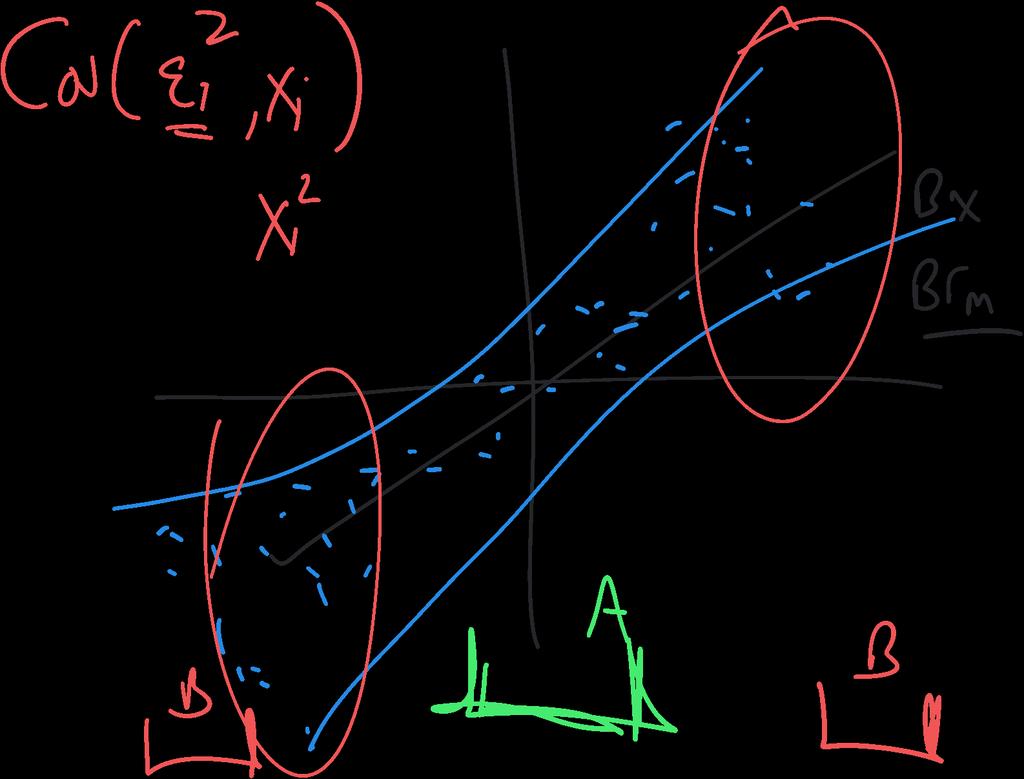
26 Bivariate confidence sets No Correlation Positive Correlation Negative Correlation Different Variances % 90% 80% / 64

27 Implementing a Wald Test Algorithm (Large Sample Wald Test) 1. Estimate the unrestricted model y i = x i + i. 2. Estimate the parameter covariance using ˆ 1 XXŜ ˆ 1 XX where ˆ XX = n 1 nx x 0 i x i, Ŝ = n 1 nx ˆ 2 i x0 i x i i=1 i=1 3. Construct the restriction matrix, R, and the value of the restriction, r, from the null hypothesis. 4. Compute W = n(r ˆ h i n r) 0 R ˆ XXŜ 1 ˆ XXR (R ˆ n r). 5. Reject the null if W > C where C is the critical value from a 2 m using a size of. 26 / 64


28 Wald tests on the FF Portfolios BH e i = VWM e i + 3 SMB i + 4 HML i + 5 UMB i + i Wald tests only fail to reject the null that the constant and the coefficient on SMB are zero Wald Tests Null M W p-val j = 0, j = 1,..., j = 0, j = 1, 3, 4, j = 0, j = 1, j = 0, j = 1, = Note: Nulls are and, alternatives are or H0 : 1 = 0 \ 3 = 0, H 1 : 1 6= 0 [ 3 6= 0 27 / 64
29 Lagrange Multiplier (LM) tests LM tests examine shadow price of the constraint (null) min (y X ) 0 (y X ) s. t. R r = 0. Lagrangian L(, )=(y X ) 0 (y X )+(R r) 0 If null true, then 0 L = 2X 0 (y X )+R 0 L = R r = A few minutes of matrix algebra later = 2 R(X 0 X) 1 R 0 1 (R ˆ r) = ˆ (X 0 X) 1 R 0 R(X 0 X) 1 R 0 1 (R ˆ r) Tilde denotes estimates computed under the null (e.g. ) 28 / 64
30
 1 R 0i 1 (R ˆ r) is just a function of normals (via ˆ, the OLS estimator) Alternatively, R 0 = 2X 0 R has rank m, so R 0")
 And we know how to test multivariate normals for equality to 0 LM = n s 0 S 1 s d!")
31 Why LM tests are also known as score tests... = 2 hr(x 0 X) 1 R 0i 1 (R ˆ r) is just a function of normals (via ˆ, the OLS estimator) Alternatively, R 0 = 2X 0 R has rank m, so R 0 0, X 0 0 are the estimated residuals under the null Under the assumptions, p n s = p n n 1 X 0 d! N(0, S) And we know how to test multivariate normals for equality to 0 LM = n s 0 S 1 s d! But we always have to use the feasible version, 2 m LM = n s 0 ˆ S 1 s = n s 0 n 1 X 0 ẼX 1 s d! 2 m Note: ˆ S (and Ẽ) is estimated using the errors from the restricted regression. 29 / 64
32 Implementing a LM test Algorithm (Large Sample Lagrange Multiplier Test) 1. Form the unrestricted model, y i = x i + i. 2. Impose the null on the unrestricted model and estimate the restricted model, ỹ i = x i + i. 3. Compute the residuals from the restricted regression, i = ỹ i x i. 4. Construct the score using the residuals from the restricted regression from both models, s i = x i i where x i are the regressors from the unrestricted model. 5. Estimate the average score and the covariance of the score, s = n 1 nx s i, S = n 1 nx s 0 i s i (2) i=1 i=1 6. Compute the LM test statistic as LM = n s S 1 s 0 and compare to the critical value from a 2 m using a size of. 30 / 64
33 LM tests on the FF Portfolios BH e i = VWM e i + 3 SMB i + 4 HML i + 5 UMB i + i LM broadly agrees with Wald but note the magnitudes LM Tests Null M LM p-val j = 0, j = 1,..., j = 0, j = 1, 3, 4, j = 0, j = 1, j = 0, j = 1, = / 64
 0 S 1 ( s ŝ) = n ( s 0)")
 is estimated using the errors from the unrestricted regression.")
34 Likelihood ratio (LR) tests A large sample LR test can be constructed using a test statistic that looks like the LM test Formally the large-sample LR is based on testing whether the difference of the scores, evaluated at the restricted and unrestricted parameters, is large in a statistically meaningful sense Suppose S is known, then n ( s ŝ) 0 S 1 ( s ŝ) = n ( s 0) 0 S 1 ( s 0) ( Why?) n s 0 S 1 s d! Leads to definition of large sample LR identical to LM but uses a difference variance estimator 2 m LR = n s 0 Ŝ 1 s d! 2 m Note: Ŝ (and Ê) is estimated using the errors from the unrestricted regression. Ŝ is estimated under the alternative and S is estimated under the null Ŝ is usually smaller than S ) LR is usually larger than LM 32 / 64
35 Implementing a LR test Algorithm (Large Sample Likelihood Ratio Test) 1. Estimate the unrestricted model y i = x i + i. 2. Impose the null on the unrestricted model and estimate the restricted model, ỹ i = x i + i. 3. Compute the residuals from the restricted regression, i = ỹ i x i, and from the unrestricted regression, ˆ i = y i x i ˆ. 4. Construct the score from both models, s i = x i i and ŝ i = x i ˆ i, where in both cases x i are the regressors from the unrestricted model. 5. Estimate the average score and the covariance of the score, s = n 1 nx s i, Ŝ = n 1 nx ŝ 0 iŝi (3) i=1 i=1 6. Compute the LR test statistic as LR = n sŝ 1 s 0 and compare to the critical value from a 2 m using a size of. 33 / 64
36 Likelihood ratio (LR) tests (Classic Assumptions) Warning: The LR on this slide critically relies on homoskedasticity and normality If null is close to alternative, log-likelihood should be similar under both! LR = 2 ln max, 2 f (y X;, 2 ) subject to R = r max, 2 f (y X;, 2 ) A little simple algebra later... SSER LR = n ln SSE U = n ln s 2 R s 2 U In classical setup, distribution LR is apple n k LR exp m n 1 F m,n k Although m Fm,n k! 2 m as n!1 34 / 64
37 LR tests on the FF Portfolios BH e i = VWM e i + 3 SMB i + 4 HML i + 5 UMB i + i LR tests agree with the other two but are closer to Wald in magnitude LR Tests Null M LR p-val j = 0, j = 1,..., j = 0, j = 1, 3, 4, j = 0, j = 1, j = 0, j = 1, = / 64
38 Comparing the three tests Three tests, which to choose Asymptotically all are equivalent Rule of thumb: W LR > LM since W and LR use errors estimated under the alternative Larger test statistics are good since all have same distribution ) more power If derived from MLE (Classical Assumptions: normality, homoskedasticity), an exact relationship: W = LR > LM In some contexts (not linear regression) ease of estimation is a useful criteria to prefer one test over the others Easy estimation of null: LM Easy estimation of alternative: Wald Easy to estimate both: LR or Wald 36 / 64
39 Comparing the three Rβ r =0 2X (y Xβ) elihood tio Lagrange Multiplier Wald (y Xβ) (y Xβ)) β ˆβ 37 / 64
40 Heteroskedasticity
41 Heteroskedasticity Heteroskedasticity: hetero: Different skedannumi: To scatter Heteroskedasticity is pervasive in financial data Usual covariance estimator (previously given) allows for Heteroskedasticity of unknown form Tempting to always use Heteroskedasticity Robust Covariance estimator Also known as White s Covariance (Eicker/Huber) estimator Finite sample properties are generally worse if data are homoskedastic If data are homoskedastic can use a simpler estimator Formally need i h i h i h E h 2 i x j,i x j,i = E 2 i x j,i and E 2 i x2 j,i x j,i = E 2 i i x 2 j,i for i = 1, 2,...,n, j = 1, 2,...,k to justify simpler estimator 38 / 64
42 Estimating the parameter covariance (Homoskedasticity) Theorem (Homoskedastic CLT) Under the large sample assumptions, and if the errors are homoskedastic, p n( ˆ n ) where XX = E[x 0 i x i] and 2 = V[ i ] d! N(0, 2 1 XX ) Theorem (Homoskedastic Covariance Estimator) Under the large sample assumptions, and if the errors are homoskedastic, ˆ 2 ˆ 1 XX p! 2 1 XX Homoskedasticity justifies the usual estimator ˆ 2 n 1 X 0 X 1 When using financial data this is the unusual estimator 39 / 64
43 Testing for heteroskedasticity Two covariance estimators: ˆ XXŜ 1 ˆ 1 XX ˆ 2 ˆ 1 XX White s Covariance estimator has worse finite sample properties Should be avoided if homoskedasticity plausible White s test: ˆ 2 i = z i + i z i consist of all cross products of x in x jn LM test that all coefficients on parameters (except the constant) are zero H 0 : 2 = 3 =...= k (k+1)/2 = 0 White s test on the BH e portfolio returns in CAPM ˆ 2 i = VWM e i + 3 VWM e2 i + i ˆ t-stat LM test: 274.9, p-val ) Strong evidence of heteroskedasticity 40 / 64
44 Implementing White s Test for Heteroskedasticity Algorithm (White s Test for Heteroskedasticity) 1. Fit the model y i = x i + i 2. Construct the fit residuals ˆ i = y i x i ˆ 3. Construct the auxiliary regressors z i where the k(k + 1)/2 elements of z i are computed from x i,o x i,p for o = 1, 2,...,k, p = o, o + 1,...,k. 4. Estimate the auxiliary regression ˆ 2 i = z i + i 5. Compute White s Test statistic as nr 2 where the R 2 is from the auxiliary regression and compare to the critical value at size from a 2 k(k+1)/2 1. Note: This algorithm assumes the model contains a constant. If the original model does not contain a constant, then z i should be augmented with a constant, and the asymptotic distribution is a 2 k(k+1)/2. 41 / 64
45 Pitfalls and Problems
46 Problems with models What happens when the assumptions are violated? Model misspecified Omitted variables Extraneous Variables Functional Form Heteroskedasticity Too few moments Errors correlated with regressors Rare in asset pricing 42 / 64
47 Not enough moments Too few moments causes problems for both ˆ and t-stats Consistency requires 2 moments for xi, 1 for i Consistent estimation of variance requires 4 moments of xi and 2 of i Fewer than 2 moments of xi Slopes can still be consistent Intercepts cannot Fewer than 1 for i ˆ is inconsistent Too much noise! Between 2 and 4 moments of xi or 1 and 2 of i Tests are inconsistent 43 / 64
48 Omitted Variables What if the linearity assumption is violated? Omitted variables Correct Model y i = x 1,i 1 + x 2,i 2 + i Model Estimated y i = x 1,i 1 + i Can show ˆ 1 p! x 2,i = x 1,i + i ˆ 1 captures any portion of y i explainable by x 1,i from model 1 2 through correlation between x 1,i and x 2,i Two cases where omitted variables do not produce bias x 1,i and x 2,i uncorrelated: Dummy variables 2 = 0 : Model correct Estimated variance inconsistent 44 / 64
49 Extraneous Variables Correct model y i = x 1,i 1 + i Model Estimated y i = x 1,i 1 + x 2,i 2 + i Can show: ˆ 1 p! 1 No problem, right? Including extraneous regressors increase parameter uncertainty Excluding marginally relevant regressors reduces parameter uncertainty but increases chance model is misspecified Bias-Variance Trade off Smaller models reduce variance, even if introducing bias Large models have less bias Related to model selection / 64
50 Heteroskedasticity Common problem across most financial data sets Asset returns Firm characteristics Executive compensation Solution 1: Heteroskedasticity robust covariance estimator ˆ 1 XXŜ ˆ 1 XX Partial Solution 2 : Use data transformations Ratios: Volume vs. Turnover (Volume/Shares Outstanding) Logs: Volume vs. ln Volume Volume = Size Shock ln Volume = ln Size + ln Shock 46 / 64
51 GLS and FGLS Solution 3: Generalized Least Squares (GLS) ˆ GLS n =(X 0 W 1 X) Can choose W cleverly 1 X 0 W 1 y, W is n n positive definite ˆ GLS n Choose W so that W 1 2 is homoskedastic and uncorrelated p! ˆ GLS is asymptotically efficient In practice W is unknown, but can be estimated ˆ 2 i = z i + i Ŵ = diag(z i ˆ) Resulting estimator is Feasible GLS (FGLS) Still asymptotically efficient Small sample properties are not assured may be quite bad In between: Use pre-specified but potentially sub-optimal W For example: Diagonal which ignores potential correlation Requires alternative estimator of parameter covariance (notes) 47 / 64
52 Model Building

53 Model Building The Black Art of econometrics Many rules and procedures Most contradictory Always a trade-off between bias and variance in finite sample Better models usually have a finance or economic theory behind them Three steps Model Selection Specification Checking Model Evaluation Pseudo-Out-of-Sample evaluation Unless on orders from your boss 48 / 64
54 Strategies General to Specific Fit largest specification Drop largest p-val Refit Stop if all p-values indicate significance at size is the econometrician s choice Specific to General Fit all specifications that include a single explanatory variable Include variable with the smallest p-val Starting from this model, test all other variables by adding in one-at-a-time Stop if no p-val of an excluded variable indicates significance at size 49 / 64
55 Information Criteria Information Criteria Akaike Information Criterion (AIC) AIC = ln ˆ k n Schwartz (Bayesian) Information Criterion (SIC/BIC) BIC = ln ˆ 2 + k ln n n Both have versions suitable for likelihood based estimation Reward for better fit: Reduce ln ˆ 2 Penalty for more parameters: 2 k n Choose model with smallest IC or k ln n n AIC has fixed penalty ) inclusion of extraneous variables BIC has larger penalty if ln n > 2 (n > 7) 50 / 64
56 Cross Validation Use 100 m% to estimate parameters, evaluate using remaining m% m = 100 k 1 in k-fold cross validation Algorithm (k-fold cross validation) 1. For each model: a. Randomly divide observations into k-equally sized blocks, S j, j = 1,...,k b. For j = 1,...,k estimate ˆ j by excluding the observations in block i c. Compute cross-validated SSE using observations in block j and ˆ j SSE xv = kx X y i x i ˆ j 2 j=1 i2s j 2. Select model with lowest cross-validated SSE Typical values for k are 5 or / 64
57 Specification Analysis Is a selected model any good? Test it: Stability Test: Chow y i = x i + i y i = x i + I [n>c] x i + i H 0 : = 0 Nonlinearity Test: Ramsey s RESET y i = x i + 1 ŷ 2 i + 2 ŷ 3 i L 1 ŷ L i + i H 0 : = 0 Recursive and/or Rolling Estimation Influence Function Influence: x i (X 0 X) 1 x 0 i ( Normalized length of x i Normality Tests: Jarque-Bera sk 2 (apple 3)2 JB = n / 64
58 Implementing a Chow & RESET Tests Algorithm (Chow Test) 1. Estimate the model y i = x i + I [n>c] x i + i. 2. Test the null H 0 : = 0 against the alternative H 1 : i 6= 0, for some i, using a Wald, LM or LR test. Algorithm (RESET Test) 1. Estimate the model y i = x i + i and construct the fit values, ŷ i = x i ˆ. 2. Re-estimate the model y i = x i + 1 ŷi ŷi i. 3. Test the null H 0 : 1 = 2 =...= m = 0 against the alternative H 1 : i 6= 0, for some i, using a Wald, LM or LR test, all of which have a 2 m distribution. 53 / 64
59 BH e Residual plot in 4 factor model / 64
60 Specification Analysis: The BH e model Chow and RESET Tests: Dependent variable BH e i Variable Coefficient P-val Variable Coefficient P-val VWM e i VWM e i SMB i SMB i HML i HML i UMD i UMD i VWM e i I [YR 1947] ŷi SMB i I [YR 1947] ŷ 3 i HML i I [YR 1947] UMD i I [YR 1947] Chow ( Jarque-Bera: P-val: 0.00 ( 2 2 ) 2 4 ) RESET ( 2 2 ) Kurtosis 10 (p-val: 0.00) ( Skewness 1 (p-val: 0.00) ( 2 1 ) 2 1 ) 55 / 64
61 Outliers Outliers happen for a number of reasons Data entry errors Funds blowing-up Hyper-inflation Often interested in results which are robust to some outliers Three common options Trimming Windsorizaiton (Iteratively) Reweighted Least Squares (IRWLS) Similar to GLS, only uses functions based on outlyingness of error 56 / 64
62 Trimming Trimming involves removing observations Removal must be based on values of i not y i Removal based on yi can lead to bias Requires initial estimate of ˆ, denoted Could include full sample, but sensitive to outliers, especially if extreme Use a subsample that you believe is good Choose subsamples at random and use a typical value Construct residuals i = y i x i and delete observations if i < ˆq or i > ˆq 1 for some small (typically 2.5% or 5%) ˆq is the -quantile of the empirical distribution of i Estimate final ˆ using OLS on remaining (non-trimmed) data 57 / 64
63 Correct and Incorrect Trimming Removal based on yi leads to bias 5 Correct Trimming 5 Incorrect Trimming / 64
64 Windsorization Windsoization involves replacing outliers with less outlying observations Like trimming, removal must be based on values of i not y i Requires initial estimate of ˆ, denoted Construct residuals i = y i x i Reconstruct yi as 8 >< x i + ˆq i < ˆq y i = y i ˆq apple i apple ˆq 1 >: x i + ˆq 1 i ˆq 1 Estimate final ˆ using OLS the reconstructed data 59 / 64
65 Correct and Incorrect Windsorization Removal based on yi leads to bias 5 Correct Windsorization 5 Incorrect Windsorization / 64
66 Rolling and Recursive Regressions Parameter stability is often an important concern Rolling regressions are an easy method to examine parameter stability j+m j+m X ˆ i x 0 i x X i x 0 i y A i, j = 1, 2,...,n m i=j i=j Constructing confidence intervals formally is difficult Approximate method computes full sample covariance matrix, and then scales by n/m to reflect the smaller sample used Similar to building a confidence interval under a null that the parameters are constant Recursive regression is defined similarly only using an expanding window jx jx ˆ i x 0 i x i x 0 i y A i, j = m, m + 1,...,n i=1 i=1 Similar issues with confidence intervals Often hard to find see variation near end of sample if n is large 61 / 64
67 Rolling Estimates of ˆ VWM e HML SMB UMD / 64
68 Recursive Estimates of ˆ VWM e SMB HML UMD / 64
69 Influence Function, BH e on 4-factors / 64

70
71
72
73
74
Analysis of Cross-Sectional Data
 Analysis of Cross-Sectional Data Kevin Sheppard http://www.kevinsheppard.com Oxford MFE This version: October 30, 2017 November 6, 2017 Outline Econometric models Specification that can be analyzed with
MFE Financial Econometrics 2018 Final Exam Model Solutions
 MFE Financial Econometrics 2018 Final Exam Model Solutions Tuesday 12 th March, 2019 1. If (X, ε) N (0, I 2 ) what is the distribution of Y = µ + β X + ε? Y N ( µ, β 2 + 1 ) 2. What is the Cramer-Rao lower
Empirical Economic Research, Part II
 Based on the text book by Ramanathan: Introductory Econometrics Robert M. Kunst robert.kunst@univie.ac.at University of Vienna and Institute for Advanced Studies Vienna December 7, 2011 Outline Introduction
Generalized Linear Models
 Generalized Linear Models Lecture 3. Hypothesis testing. Goodness of Fit. Model diagnostics GLM (Spring, 2018) Lecture 3 1 / 34 Models Let M(X r ) be a model with design matrix X r (with r columns) r n
the error term could vary over the observations, in ways that are related
 Heteroskedasticity We now consider the implications of relaxing the assumption that the conditional variance Var(u i x i ) = σ 2 is common to all observations i = 1,..., n In many applications, we may
Heteroskedasticity. Part VII. Heteroskedasticity
 Part VII Heteroskedasticity As of Oct 15, 2015 1 Heteroskedasticity Consequences Heteroskedasticity-robust inference Testing for Heteroskedasticity Weighted Least Squares (WLS) Feasible generalized Least
Economics 471: Econometrics Department of Economics, Finance and Legal Studies University of Alabama
 Economics 471: Econometrics Department of Economics, Finance and Legal Studies University of Alabama Course Packet The purpose of this packet is to show you one particular dataset and how it is used in
Introductory Econometrics
 Based on the textbook by Wooldridge: : A Modern Approach Robert M. Kunst robert.kunst@univie.ac.at University of Vienna and Institute for Advanced Studies Vienna November 23, 2013 Outline Introduction
Intermediate Econometrics
 Intermediate Econometrics Heteroskedasticity Text: Wooldridge, 8 July 17, 2011 Heteroskedasticity Assumption of homoskedasticity, Var(u i x i1,..., x ik ) = E(u 2 i x i1,..., x ik ) = σ 2. That is, the
Instead of using all the sample observations for estimation, the suggested procedure is to divide the data set
 Chow forecast test: Instead of using all the sample observations for estimation, the suggested procedure is to divide the data set of N sample observations into N 1 observations to be used for estimation
The outline for Unit 3
 The outline for Unit 3 Unit 1. Introduction: The regression model. Unit 2. Estimation principles. Unit 3: Hypothesis testing principles. 3.1 Wald test. 3.2 Lagrange Multiplier. 3.3 Likelihood Ratio Test.
Least Absolute Value vs. Least Squares Estimation and Inference Procedures in Regression Models with Asymmetric Error Distributions
 Journal of Modern Applied Statistical Methods Volume 8 Issue 1 Article 13 5-1-2009 Least Absolute Value vs. Least Squares Estimation and Inference Procedures in Regression Models with Asymmetric Error
Chapter 8 Heteroskedasticity
 Chapter 8 Walter R. Paczkowski Rutgers University Page 1 Chapter Contents 8.1 The Nature of 8. Detecting 8.3 -Consistent Standard Errors 8.4 Generalized Least Squares: Known Form of Variance 8.5 Generalized
Additional Topics on Linear Regression
 Additional Topics on Linear Regression Ping Yu School of Economics and Finance The University of Hong Kong Ping Yu (HKU) Additional Topics 1 / 49 1 Tests for Functional Form Misspecification 2 Nonlinear
Econometrics Summary Algebraic and Statistical Preliminaries
 Econometrics Summary Algebraic and Statistical Preliminaries Elasticity: The point elasticity of Y with respect to L is given by α = ( Y/ L)/(Y/L). The arc elasticity is given by ( Y/ L)/(Y/L), when L
G. S. Maddala Kajal Lahiri. WILEY A John Wiley and Sons, Ltd., Publication
 G. S. Maddala Kajal Lahiri WILEY A John Wiley and Sons, Ltd., Publication TEMT Foreword Preface to the Fourth Edition xvii xix Part I Introduction and the Linear Regression Model 1 CHAPTER 1 What is Econometrics?
Testing and Model Selection
 Testing and Model Selection This is another digression on general statistics: see PE App C.8.4. The EViews output for least squares, probit and logit includes some statistics relevant to testing hypotheses
Introduction to Econometrics. Heteroskedasticity
 Introduction to Econometrics Introduction Heteroskedasticity When the variance of the errors changes across segments of the population, where the segments are determined by different values for the explanatory
Graduate Econometrics Lecture 4: Heteroskedasticity
 Graduate Econometrics Lecture 4: Heteroskedasticity Department of Economics University of Gothenburg November 30, 2014 1/43 and Autocorrelation Consequences for OLS Estimator Begin from the linear model
Econometrics. Week 4. Fall Institute of Economic Studies Faculty of Social Sciences Charles University in Prague
 Econometrics Week 4 Institute of Economic Studies Faculty of Social Sciences Charles University in Prague Fall 2012 1 / 23 Recommended Reading For the today Serial correlation and heteroskedasticity in
MULTIPLE REGRESSION AND ISSUES IN REGRESSION ANALYSIS
 MULTIPLE REGRESSION AND ISSUES IN REGRESSION ANALYSIS Page 1 MSR = Mean Regression Sum of Squares MSE = Mean Squared Error RSS = Regression Sum of Squares SSE = Sum of Squared Errors/Residuals α = Level
Introductory Econometrics
 Based on the textbook by Wooldridge: : A Modern Approach Robert M. Kunst robert.kunst@univie.ac.at University of Vienna and Institute for Advanced Studies Vienna December 11, 2012 Outline Heteroskedasticity
Review of Econometrics
 Review of Econometrics Zheng Tian June 5th, 2017 1 The Essence of the OLS Estimation Multiple regression model involves the models as follows Y i = β 0 + β 1 X 1i + β 2 X 2i + + β k X ki + u i, i = 1,...,
Econometrics of Panel Data
 Econometrics of Panel Data Jakub Mućk Meeting # 2 Jakub Mućk Econometrics of Panel Data Meeting # 2 1 / 26 Outline 1 Fixed effects model The Least Squares Dummy Variable Estimator The Fixed Effect (Within
Contest Quiz 3. Question Sheet. In this quiz we will review concepts of linear regression covered in lecture 2.
 Updated: November 17, 2011 Lecturer: Thilo Klein Contact: tk375@cam.ac.uk Contest Quiz 3 Question Sheet In this quiz we will review concepts of linear regression covered in lecture 2. NOTE: Please round
Econ 423 Lecture Notes: Additional Topics in Time Series 1
 Econ 423 Lecture Notes: Additional Topics in Time Series 1 John C. Chao April 25, 2017 1 These notes are based in large part on Chapter 16 of Stock and Watson (2011). They are for instructional purposes
Econometric Analysis of Cross Section and Panel Data
 Econometric Analysis of Cross Section and Panel Data Jeffrey M. Wooldridge / The MIT Press Cambridge, Massachusetts London, England Contents Preface Acknowledgments xvii xxiii I INTRODUCTION AND BACKGROUND
CHAPTER 6: SPECIFICATION VARIABLES
 Recall, we had the following six assumptions required for the Gauss-Markov Theorem: 1. The regression model is linear, correctly specified, and has an additive error term. 2. The error term has a zero
Correlation and Regression
 Correlation and Regression October 25, 2017 STAT 151 Class 9 Slide 1 Outline of Topics 1 Associations 2 Scatter plot 3 Correlation 4 Regression 5 Testing and estimation 6 Goodness-of-fit STAT 151 Class
Advanced Econometrics I
 Lecture Notes Autumn 2010 Dr. Getinet Haile, University of Mannheim 1. Introduction Introduction & CLRM, Autumn Term 2010 1 What is econometrics? Econometrics = economic statistics economic theory mathematics
Review of Classical Least Squares. James L. Powell Department of Economics University of California, Berkeley
 Review of Classical Least Squares James L. Powell Department of Economics University of California, Berkeley The Classical Linear Model The object of least squares regression methods is to model and estimate
LECTURE 2 LINEAR REGRESSION MODEL AND OLS
 SEPTEMBER 29, 2014 LECTURE 2 LINEAR REGRESSION MODEL AND OLS Definitions A common question in econometrics is to study the effect of one group of variables X i, usually called the regressors, on another
A Course in Applied Econometrics Lecture 18: Missing Data. Jeff Wooldridge IRP Lectures, UW Madison, August Linear model with IVs: y i x i u i,
 A Course in Applied Econometrics Lecture 18: Missing Data Jeff Wooldridge IRP Lectures, UW Madison, August 2008 1. When Can Missing Data be Ignored? 2. Inverse Probability Weighting 3. Imputation 4. Heckman-Type
Heteroskedasticity. We now consider the implications of relaxing the assumption that the conditional
 Heteroskedasticity We now consider the implications of relaxing the assumption that the conditional variance V (u i x i ) = σ 2 is common to all observations i = 1,..., In many applications, we may suspect
Least Squares Estimation-Finite-Sample Properties
 Least Squares Estimation-Finite-Sample Properties Ping Yu School of Economics and Finance The University of Hong Kong Ping Yu (HKU) Finite-Sample 1 / 29 Terminology and Assumptions 1 Terminology and Assumptions
Regression Analysis. y t = β 1 x t1 + β 2 x t2 + β k x tk + ϵ t, t = 1,..., T,
 Regression Analysis The multiple linear regression model with k explanatory variables assumes that the tth observation of the dependent or endogenous variable y t is described by the linear relationship
Introduction to Eco n o m et rics
 2008 AGI-Information Management Consultants May be used for personal purporses only or by libraries associated to dandelon.com network. Introduction to Eco n o m et rics Third Edition G.S. Maddala Formerly
Model Estimation Example
 Ronald H. Heck 1 EDEP 606: Multivariate Methods (S2013) April 7, 2013 Model Estimation Example As we have moved through the course this semester, we have encountered the concept of model estimation. Discussions
Chapter 1 Statistical Inference
 Chapter 1 Statistical Inference causal inference To infer causality, you need a randomized experiment (or a huge observational study and lots of outside information). inference to populations Generalizations
statistical sense, from the distributions of the xs. The model may now be generalized to the case of k regressors:
 Wooldridge, Introductory Econometrics, d ed. Chapter 3: Multiple regression analysis: Estimation In multiple regression analysis, we extend the simple (two-variable) regression model to consider the possibility
Wooldridge, Introductory Econometrics, 4th ed. Chapter 15: Instrumental variables and two stage least squares
 Wooldridge, Introductory Econometrics, 4th ed. Chapter 15: Instrumental variables and two stage least squares Many economic models involve endogeneity: that is, a theoretical relationship does not fit
Recent Advances in the Field of Trade Theory and Policy Analysis Using Micro-Level Data
 Recent Advances in the Field of Trade Theory and Policy Analysis Using Micro-Level Data July 2012 Bangkok, Thailand Cosimo Beverelli (World Trade Organization) 1 Content a) Classical regression model b)
Models, Testing, and Correction of Heteroskedasticity. James L. Powell Department of Economics University of California, Berkeley
 Models, Testing, and Correction of Heteroskedasticity James L. Powell Department of Economics University of California, Berkeley Aitken s GLS and Weighted LS The Generalized Classical Regression Model
2. Linear regression with multiple regressors
 2. Linear regression with multiple regressors Aim of this section: Introduction of the multiple regression model OLS estimation in multiple regression Measures-of-fit in multiple regression Assumptions
Topic 7: Heteroskedasticity
 Topic 7: Heteroskedasticity Advanced Econometrics (I Dong Chen School of Economics, Peking University Introduction If the disturbance variance is not constant across observations, the regression is heteroskedastic
A Practitioner s Guide to Cluster-Robust Inference
 A Practitioner s Guide to Cluster-Robust Inference A. C. Cameron and D. L. Miller presented by Federico Curci March 4, 2015 Cameron Miller Cluster Clinic II March 4, 2015 1 / 20 In the previous episode
1/24/2008. Review of Statistical Inference. C.1 A Sample of Data. C.2 An Econometric Model. C.4 Estimating the Population Variance and Other Moments
 /4/008 Review of Statistical Inference Prepared by Vera Tabakova, East Carolina University C. A Sample of Data C. An Econometric Model C.3 Estimating the Mean of a Population C.4 Estimating the Population
Econ 510 B. Brown Spring 2014 Final Exam Answers
 Econ 510 B. Brown Spring 2014 Final Exam Answers Answer five of the following questions. You must answer question 7. The question are weighted equally. You have 2.5 hours. You may use a calculator. Brevity
Regression with a Single Regressor: Hypothesis Tests and Confidence Intervals
 Regression with a Single Regressor: Hypothesis Tests and Confidence Intervals (SW Chapter 5) Outline. The standard error of ˆ. Hypothesis tests concerning β 3. Confidence intervals for β 4. Regression
Review of Statistics 101
 Review of Statistics 101 We review some important themes from the course 1. Introduction Statistics- Set of methods for collecting/analyzing data (the art and science of learning from data). Provides methods
Applied Econometrics (QEM)
") Applied Econometrics (QEM) based on Prinicples of Econometrics Jakub Mućk Department of Quantitative Economics Jakub Mućk Applied Econometrics (QEM) Meeting #3 1 / 42 Outline 1 2 3 t-test P-value Linear
Applied Econometrics (QEM) based on Prinicples of Econometrics Jakub Mućk Department of Quantitative Economics Jakub Mućk Applied Econometrics (QEM) Meeting #3 1 / 42 Outline 1 2 3 t-test P-value Linear
2) For a normal distribution, the skewness and kurtosis measures are as follows: A) 1.96 and 4 B) 1 and 2 C) 0 and 3 D) 0 and 0
 For a normal distribution, the skewness and kurtosis measures are as follows: A) 1.96 and 4 B) 1 and 2 C) 0 and 3 D) 0 and 0") Introduction to Econometrics Midterm April 26, 2011 Name Student ID MULTIPLE CHOICE. Choose the one alternative that best completes the statement or answers the question. (5,000 credit for each correct
Introduction to Econometrics Midterm April 26, 2011 Name Student ID MULTIPLE CHOICE. Choose the one alternative that best completes the statement or answers the question. (5,000 credit for each correct
9 Correlation and Regression
 9 Correlation and Regression SW, Chapter 12. Suppose we select n = 10 persons from the population of college seniors who plan to take the MCAT exam. Each takes the test, is coached, and then retakes the
ECONOMETRICS HONOR S EXAM REVIEW SESSION
 ECONOMETRICS HONOR S EXAM REVIEW SESSION Eunice Han ehan@fas.harvard.edu March 26 th, 2013 Harvard University Information 2 Exam: April 3 rd 3-6pm @ Emerson 105 Bring a calculator and extra pens. Notes
Maximum Likelihood (ML) Estimation
 Estimation") Econometrics 2 Fall 2004 Maximum Likelihood (ML) Estimation Heino Bohn Nielsen 1of32 Outline of the Lecture (1) Introduction. (2) ML estimation defined. (3) ExampleI:Binomialtrials. (4) Example II: Linear
Econometrics 2 Fall 2004 Maximum Likelihood (ML) Estimation Heino Bohn Nielsen 1of32 Outline of the Lecture (1) Introduction. (2) ML estimation defined. (3) ExampleI:Binomialtrials. (4) Example II: Linear
Introduction to Econometrics
 Introduction to Econometrics T H I R D E D I T I O N Global Edition James H. Stock Harvard University Mark W. Watson Princeton University Boston Columbus Indianapolis New York San Francisco Upper Saddle
EC4051 Project and Introductory Econometrics
 EC4051 Project and Introductory Econometrics Dudley Cooke Trinity College Dublin Dudley Cooke (Trinity College Dublin) Intro to Econometrics 1 / 23 Project Guidelines Each student is required to undertake
Econometrics of Panel Data
 Econometrics of Panel Data Jakub Mućk Meeting # 3 Jakub Mućk Econometrics of Panel Data Meeting # 3 1 / 21 Outline 1 Fixed or Random Hausman Test 2 Between Estimator 3 Coefficient of determination (R 2
Practical Econometrics. for. Finance and Economics. (Econometrics 2)
") Practical Econometrics for Finance and Economics (Econometrics 2) Seppo Pynnönen and Bernd Pape Department of Mathematics and Statistics, University of Vaasa 1. Introduction 1.1 Econometrics Econometrics
Practical Econometrics for Finance and Economics (Econometrics 2) Seppo Pynnönen and Bernd Pape Department of Mathematics and Statistics, University of Vaasa 1. Introduction 1.1 Econometrics Econometrics
Heteroskedasticity ECONOMETRICS (ECON 360) BEN VAN KAMMEN, PHD
 BEN VAN KAMMEN, PHD") Heteroskedasticity ECONOMETRICS (ECON 360) BEN VAN KAMMEN, PHD Introduction For pedagogical reasons, OLS is presented initially under strong simplifying assumptions. One of these is homoskedastic errors,
Heteroskedasticity ECONOMETRICS (ECON 360) BEN VAN KAMMEN, PHD Introduction For pedagogical reasons, OLS is presented initially under strong simplifying assumptions. One of these is homoskedastic errors,
Problem Set #6: OLS. Economics 835: Econometrics. Fall 2012
 Problem Set #6: OLS Economics 835: Econometrics Fall 202 A preliminary result Suppose we have a random sample of size n on the scalar random variables (x, y) with finite means, variances, and covariance.
FinQuiz Notes
 Reading 10 Multiple Regression and Issues in Regression Analysis 2. MULTIPLE LINEAR REGRESSION Multiple linear regression is a method used to model the linear relationship between a dependent variable
Statistics 203: Introduction to Regression and Analysis of Variance Course review
 Statistics 203: Introduction to Regression and Analysis of Variance Course review Jonathan Taylor - p. 1/?? Today Review / overview of what we learned. - p. 2/?? General themes in regression models Specifying
Econometrics Honor s Exam Review Session. Spring 2012 Eunice Han
 Econometrics Honor s Exam Review Session Spring 2012 Eunice Han Topics 1. OLS The Assumptions Omitted Variable Bias Conditional Mean Independence Hypothesis Testing and Confidence Intervals Homoskedasticity
OSU Economics 444: Elementary Econometrics. Ch.10 Heteroskedasticity
 OSU Economics 444: Elementary Econometrics Ch.0 Heteroskedasticity (Pure) heteroskedasticity is caused by the error term of a correctly speciþed equation: Var(² i )=σ 2 i, i =, 2,,n, i.e., the variance
LECTURE 11. Introduction to Econometrics. Autocorrelation
 LECTURE 11 Introduction to Econometrics Autocorrelation November 29, 2016 1 / 24 ON PREVIOUS LECTURES We discussed the specification of a regression equation Specification consists of choosing: 1. correct
Making sense of Econometrics: Basics
 Making sense of Econometrics: Basics Lecture 4: Qualitative influences and Heteroskedasticity Egypt Scholars Economic Society November 1, 2014 Assignment & feedback enter classroom at http://b.socrative.com/login/student/
Quick Review on Linear Multiple Regression
 Quick Review on Linear Multiple Regression Mei-Yuan Chen Department of Finance National Chung Hsing University March 6, 2007 Introduction for Conditional Mean Modeling Suppose random variables Y, X 1,
Econometrics Multiple Regression Analysis: Heteroskedasticity
 Econometrics Multiple Regression Analysis: João Valle e Azevedo Faculdade de Economia Universidade Nova de Lisboa Spring Semester João Valle e Azevedo (FEUNL) Econometrics Lisbon, April 2011 1 / 19 Properties
Economics 582 Random Effects Estimation
 Economics 582 Random Effects Estimation Eric Zivot May 29, 2013 Random Effects Model Hence, the model can be re-written as = x 0 β + + [x ] = 0 (no endogeneity) [ x ] = = + x 0 β + + [x ] = 0 [ x ] = 0
8. Hypothesis Testing
 FE661 - Statistical Methods for Financial Engineering 8. Hypothesis Testing Jitkomut Songsiri introduction Wald test likelihood-based tests significance test for linear regression 8-1 Introduction elements
Föreläsning /31
 1/31 Föreläsning 10 090420 Chapter 13 Econometric Modeling: Model Speci cation and Diagnostic testing 2/31 Types of speci cation errors Consider the following models: Y i = β 1 + β 2 X i + β 3 X 2 i +
Stat 5101 Lecture Notes
 Stat 5101 Lecture Notes Charles J. Geyer Copyright 1998, 1999, 2000, 2001 by Charles J. Geyer May 7, 2001 ii Stat 5101 (Geyer) Course Notes Contents 1 Random Variables and Change of Variables 1 1.1 Random
Heteroskedasticity. y i = β 0 + β 1 x 1i + β 2 x 2i β k x ki + e i. where E(e i. ) σ 2, non-constant variance.
 σ 2, non-constant variance.") Heteroskedasticity y i = β + β x i + β x i +... + β k x ki + e i where E(e i ) σ, non-constant variance. Common problem with samples over individuals. ê i e ˆi x k x k AREC-ECON 535 Lec F Suppose y i =
Heteroskedasticity y i = β + β x i + β x i +... + β k x ki + e i where E(e i ) σ, non-constant variance. Common problem with samples over individuals. ê i e ˆi x k x k AREC-ECON 535 Lec F Suppose y i =
8. Instrumental variables regression
 8. Instrumental variables regression Recall: In Section 5 we analyzed five sources of estimation bias arising because the regressor is correlated with the error term Violation of the first OLS assumption
Quantitative Analysis of Financial Markets. Summary of Part II. Key Concepts & Formulas. Christopher Ting. November 11, 2017
 Summary of Part II Key Concepts & Formulas Christopher Ting November 11, 2017 christopherting@smu.edu.sg http://www.mysmu.edu/faculty/christophert/ Christopher Ting 1 of 16 Why Regression Analysis? Understand
ECON 4551 Econometrics II Memorial University of Newfoundland. Panel Data Models. Adapted from Vera Tabakova s notes
 ECON 4551 Econometrics II Memorial University of Newfoundland Panel Data Models Adapted from Vera Tabakova s notes 15.1 Grunfeld s Investment Data 15.2 Sets of Regression Equations 15.3 Seemingly Unrelated
A Guide to Modern Econometric:
 A Guide to Modern Econometric: 4th edition Marno Verbeek Rotterdam School of Management, Erasmus University, Rotterdam B 379887 )WILEY A John Wiley & Sons, Ltd., Publication Contents Preface xiii 1 Introduction
Econometrics I KS. Module 2: Multivariate Linear Regression. Alexander Ahammer. This version: April 16, 2018
 Econometrics I KS Module 2: Multivariate Linear Regression Alexander Ahammer Department of Economics Johannes Kepler University of Linz This version: April 16, 2018 Alexander Ahammer (JKU) Module 2: Multivariate
Lecture 3: Multiple Regression
 Lecture 3: Multiple Regression R.G. Pierse 1 The General Linear Model Suppose that we have k explanatory variables Y i = β 1 + β X i + β 3 X 3i + + β k X ki + u i, i = 1,, n (1.1) or Y i = β j X ji + u
POLSCI 702 Non-Normality and Heteroskedasticity
 Goals of this Lecture POLSCI 702 Non-Normality and Heteroskedasticity Dave Armstrong University of Wisconsin Milwaukee Department of Political Science e: armstrod@uwm.edu w: www.quantoid.net/uwm702.html
Specification testing in panel data models estimated by fixed effects with instrumental variables
 Specification testing in panel data models estimated by fixed effects wh instrumental variables Carrie Falls Department of Economics Michigan State Universy Abstract I show that a handful of the regressions
Lectures on Simple Linear Regression Stat 431, Summer 2012
 Lectures on Simple Linear Regression Stat 43, Summer 0 Hyunseung Kang July 6-8, 0 Last Updated: July 8, 0 :59PM Introduction Previously, we have been investigating various properties of the population
Heteroskedasticity and Autocorrelation
 Lesson 7 Heteroskedasticity and Autocorrelation Pilar González and Susan Orbe Dpt. Applied Economics III (Econometrics and Statistics) Pilar González and Susan Orbe OCW 2014 Lesson 7. Heteroskedasticity
Vector Autoregressive Model. Vector Autoregressions II. Estimation of Vector Autoregressions II. Estimation of Vector Autoregressions I.
 Vector Autoregressive Model Vector Autoregressions II Empirical Macroeconomics - Lect 2 Dr. Ana Beatriz Galvao Queen Mary University of London January 2012 A VAR(p) model of the m 1 vector of time series
Multiple Regression Analysis. Part III. Multiple Regression Analysis
 Part III Multiple Regression Analysis As of Sep 26, 2017 1 Multiple Regression Analysis Estimation Matrix form Goodness-of-Fit R-square Adjusted R-square Expected values of the OLS estimators Irrelevant
Probability and Statistics Notes
 Probability and Statistics Notes Chapter Seven Jesse Crawford Department of Mathematics Tarleton State University Spring 2011 (Tarleton State University) Chapter Seven Notes Spring 2011 1 / 42 Outline
 STOCKHOLM UNIVERSITY Department of Economics Course name: Empirical Methods Course code: EC40 Examiner: Lena Nekby Number of credits: 7,5 credits Date of exam: Saturday, May 9, 008 Examination time: 3
Applied Statistics and Econometrics
 Applied Statistics and Econometrics Lecture 6 Saul Lach September 2017 Saul Lach () Applied Statistics and Econometrics September 2017 1 / 53 Outline of Lecture 6 1 Omitted variable bias (SW 6.1) 2 Multiple
Wooldridge, Introductory Econometrics, 2d ed. Chapter 8: Heteroskedasticity In laying out the standard regression model, we made the assumption of
 Wooldridge, Introductory Econometrics, d ed. Chapter 8: Heteroskedasticity In laying out the standard regression model, we made the assumption of homoskedasticity of the regression error term: that its
Multivariate Regression Analysis
 Matrices and vectors The model from the sample is: Y = Xβ +u with n individuals, l response variable, k regressors Y is a n 1 vector or a n l matrix with the notation Y T = (y 1,y 2,...,y n ) 1 x 11 x
Final Exam - Solutions
 Ecn 102 - Analysis of Economic Data University of California - Davis March 19, 2010 Instructor: John Parman Final Exam - Solutions You have until 5:30pm to complete this exam. Please remember to put your
Using all observations when forecasting under structural breaks
 Using all observations when forecasting under structural breaks Stanislav Anatolyev New Economic School Victor Kitov Moscow State University December 2007 Abstract We extend the idea of the trade-off window
Motivation for multiple regression
 Motivation for multiple regression 1. Simple regression puts all factors other than X in u, and treats them as unobserved. Effectively the simple regression does not account for other factors. 2. The slope
Heteroskedasticity-Robust Inference in Finite Samples
 Heteroskedasticity-Robust Inference in Finite Samples Jerry Hausman and Christopher Palmer Massachusetts Institute of Technology December 011 Abstract Since the advent of heteroskedasticity-robust standard
Math 5305 Notes. Diagnostics and Remedial Measures. Jesse Crawford. Department of Mathematics Tarleton State University
 Math 5305 Notes Diagnostics and Remedial Measures Jesse Crawford Department of Mathematics Tarleton State University (Tarleton State University) Diagnostics and Remedial Measures 1 / 44 Model Assumptions
Review of Statistics
 Review of Statistics Topics Descriptive Statistics Mean, Variance Probability Union event, joint event Random Variables Discrete and Continuous Distributions, Moments Two Random Variables Covariance and
Physics 509: Bootstrap and Robust Parameter Estimation
 Physics 509: Bootstrap and Robust Parameter Estimation Scott Oser Lecture #20 Physics 509 1 Nonparametric parameter estimation Question: what error estimate should you assign to the slope and intercept
Central Bank of Chile October 29-31, 2013 Bruce Hansen (University of Wisconsin) Structural Breaks October 29-31, / 91. Bruce E.
 Structural Breaks October 29-31, / 91. Bruce E.") Forecasting Lecture 3 Structural Breaks Central Bank of Chile October 29-31, 2013 Bruce Hansen (University of Wisconsin) Structural Breaks October 29-31, 2013 1 / 91 Bruce E. Hansen Organization Detection
Forecasting Lecture 3 Structural Breaks Central Bank of Chile October 29-31, 2013 Bruce Hansen (University of Wisconsin) Structural Breaks October 29-31, 2013 1 / 91 Bruce E. Hansen Organization Detection
Model Mis-specification
 Model Mis-specification Carlo Favero Favero () Model Mis-specification 1 / 28 Model Mis-specification Each specification can be interpreted of the result of a reduction process, what happens if the reduction