Dispersion for point sources CE 524 February
|
|
|
- Randolph Baldwin
- 6 years ago
- Views:
Transcription
1 Dispersion for point sources CE 524 February
2 Concentration Air pollution law in most industrial countries based on concentration of contaminants NAAQS in US Need method dto predict concentrations ti at any given location Any given set of pollutant Meteorological conditions At any location For any time period But even best currently available concentration models are far from ideal 2
3 Concentration Commonly express concentration as ppm or μg/m 3 Parts per million (ppm) = 1 volume of 1 ppm = 1 volume gaseous pollutant 10 6 volumes (pollutant + air) μg/m/ 3 = micrograms/cubic meter 3
4 Factors that determine Dispersion Physical nature of effluents Chemical nature of effluents Meteorology Location of the stack Nature of terrain downwind from the stack 4
5 Stack Effluents Gas and particulate matter Particles < 20 μm behave same as gas Low settling velocity Particle >20 μm have significant ifi settling velocity Only gases and Particles < 20 μm are treated in dispersion models Others are treated as particulate matter Assumes effluents leave the stack with sufficient momentum and buoyancy Hot gases continue to rise 5
6 Assumptions Effluents leave the stack with sufficient momentum and buoyancy Hot gases continue to rise Plume is deflected along its axis in proportion to the average wind speed (u) 6
7 Gaussian or Normal Distribution Gaussian distribution model Dispersion in y and z directions uses a double gaussian distribution -- plumes Dispersion in (x, y, z) is three-dimensional Used to model instantaneous puff of emissions 7
8 Gaussian or Normal Distribution Pollution dispersion follows a distribution function Theoretical form: gaussian distribution function 8
9 Gaussian or Normal Distribution x = mean of the distribution = standard deviation Gaussian distribution used to model probabilities, in this context formula used to predict steady state concentration at a point down stream 9
10 Gaussian or Normal Distribution What are some properties of the normal distribution? f(x) becomes concentration, maximum at center of plume 10
11 Gaussian or Normal distribution 68% of the area fall within 1 standard deviation of the mean (µ ± 1 σ). 95% of area fall within 1.96 standard deviation of the mean (µ ± 1.96 σ). 99.7% of the area fall within 3 standard deviations of the mean (µ ± 3 σ) 11
12 Gaussian dispersion model Dispersion in y and z directions are modeled as Gaussian Becomes double Gaussian model Why doesn t it follow a Gaussian distribution in the x direction? Direction of wind 12
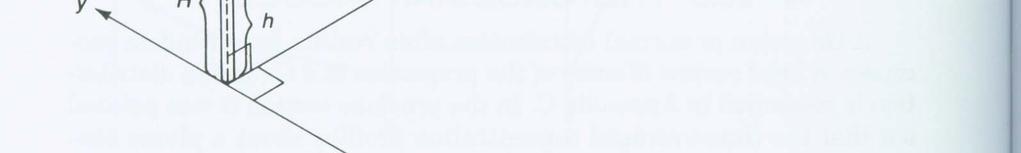
13 Gaussian Dispersion Model For localized point sources stacks General appearance Plume exits at height, h s Rises an additional distance, Δh buoyancy of hot gases called plume rise reaches distance where buoyancy and upward momentum cease Eit Exit velocity, V s Plume appears as a point source emitted at height H = h s + Δh Emission rate Q (g/s) Assume wind blows in x direction at speed u u is independent of time, elevation, or location (not really true) 13
14 Gaussian Dispersion Model 14
15 Gaussian Dispersion Model Stack gas transported downstream Dispersion in vertical direction governed by atmospheric stability Dispersion in horizontal plane governed by molecular and eddy diffusion x-axis oriented to wind direction z-axis oriented vertically upwards y-direction oriented transverse to the wind Concentrations are symmetric about y-axis and z- axis 15
16 Gaussian Dispersion Model Z-axis through stack Y-axis is transverse to wind X-axis in direction of wind 16
17 As distance increase so does dispersion Image source: Cooper and Alley,


18 Image source: Cooper and Alley,
19 Point Source at Elevation H Assumes no interference or limitation to dispersion in any direction x 0 and z 0 are location of centerline of plume y 0 taken as base of the stack z 0 is H Q = emission strength of source (mass/time) g/s u = average wind speed thru the plume m/s C = concentration g/m 3 (Notice this is not ppm) y and z are horizontal and vertical standard deviations in meters 19
20 Wind Velocity Profile Wind speed varies by height International standard height for wind-speed measurements is 10 m Dispersion of pollutant is a function of wind speed at the height where pollution is emitted But difficult to develop relationship between height and wind speed 20
21 Point Source at Elevation H without Reflection 3 terms gives concentration on the centerline of the plume gives concentration as you move in the sideways direction ( y direction), direction doesn t matter because ( y) 2 gives a positive value gives concentration as you move in the vertical direction ( z direction), direction doesn t matter because ( (z H)) 2 gives a positive value Concentrations are symmetric about y-axis and z-axis Same concentration at (z-h) = 10 m as (z-h) =10 m Close to ground symmetry is disturbed 21
22 Point Source at elevation H without reflection Equation 4-6 reduces to Note in the book there are 2 equation 4-8s (2 different equations just labeled wrong) This is the first one 22
23 Gaussian Plume Example A factory emits 20 g/s of SO 2 at height H (includes plume rise) Wind speed = 3 m/s (u) At a distance of 1 km downstream, y and z are 30 m and 20 m (given, otherwise we would have to look up) What are the SO 2 concentrations at the centerline of the plume and at a point 60 meters to the side and 20 meters below the centerline 23
24 Gaussian Plume Example 0 Q = 20 g/s of SO 2 u = 3 m/s (u) y and z are 30 m and 20 m y = 0 and z = H So reduces to: C(x,0,0), = 20 g/s = g/m 3 = 1770 µ g/m 3 Q = 20 g/s of SO Z H = 0 2(Π*3*30*20) So second dhalf of equation goes to 0 At centerline y and Z are 0 24
25 Gaussian Plume Example What are the SO 2 concentrations at a point 60 meters to the side and 20 meters below the centerline c = Q exp-1/2[(-y 2 ) + ( (z-h) 2 )] 2 u y z [ y 2 z2 ] = 20 g/s exp-1/2 [(-60m) 2 + (-20m) 2 ] = 2 3*(30)(20) [(30m) 2 (20 2 m)] ( g/m 3 ) * (exp 2.5 )= g/m 3 or µ g/m 3 At 20 and 60 meters 25
26 Evaluation of Standard Deviation Horizontal and vertical dispersion coefficients -- y z are a function downwind position x Atmospheric stability conditions many experimental measurements charts have been created Correlated y and z to atmospheric stability and x 26
27 Pasquill-Gifford Curves Concentrations correspond to sampling times of approx. 10 minutes Regulatory models assume that the concentrations predicted represent 1-hour averages Solid curves represent rural values Dashed lines represent urban values Estimated concentrations represent only the lowest several hundred meters of the atmosphere 27
28 Pasquill-Gifford Curves z less certain than y Especially for x > 1 km For neutral to moderately unstable atmospheric conditions and distances out to a few kilometers, concentrations should be within a factor of 2 or 3 of actual values Tables 3-1: Key to stability classes 28
29 Example For stability class A, what are the values of y and z at 1 km downstream (assume urban) From Tables 4-6 and4-7 29
30 200 σ y ~ 220 m 30
31 σ z ~ 310 m 31
32 Example For stability class A, what are the values of y and z at 1 km downstream From Tables 4-6 and 4-7 y = 220 m y z = 310 m 32
33 Empirical Equations Often difficult to read charts Curves fit to empirical equations y = cx d Where z = ax b z x = downwind ddistance (kilometers) a, b, c, d = coefficients from Tables 4-1 and
34 Example: what are values of y and z at 1 km downstream for stability class A using equations rather than charts? y = cx d z = ax b Using table 4-1 for stability class A c = d =


35 Example: what are values of y and z at 1 km downstream for stability class A using equations rather than charts? y = cx d z = ax b Using table 4-2 where x = 1 km a = b =
36 Example: what are values of y and z at 1 km downstream for stability class A using equations rather than charts? y = cx d z = ax b c = a = d = Solution y = cx d = (1 km) = m = b = z ax (1 km) = 4539m b =
37 Point Source at Elevation H with Reflection Previous equation for concentration of plumes a considerable distance above ground Ground damps out vertical dispersion Pollutants reflect back up from ground 37
38 Point Source at Elevation H with Reflection Accounts for reflection of gaseous pollutants back into the atmosphere Rfl Reflection at some distance x is mathematically equivalent to having a mirror image of the source at H Concentration is equal to contribution of both plumes at ground level 38
39 39
40 Point Source at Elevation H with Reflection Notice this is also equation 4-8 in text, it is the second equation 4-8 onthe bottom of page
41 Example: Point Source at Elevation H with Reflection Nitrogen dioxide is emitted at 110 g/s from stack with H = 80 m Wind speed = 5 m/s Plume rise is 20 m Calculate ground level concentration 100 meter from centerline of plume (y) Assume stability class D so σ y = 126 m and σ z = 51 m 41
42 Example: Point Source at Elevation H with Reflection Q = 110 g/s H = 80 m u = 5 m/s Δh = 20 m y = 100 m σ y = 126 m and σ z =51m Effective stack height =80 m + 20 m = 100 m σ y = 126 m and σ z = 51 m Solving in pieces 100 g/s = Π*5*126*51 42
43 Example: Point Source at Elevation H with Reflection Q = 110 g/s H = 80 m u = 5 m/s Δh = 20 m y = 100 m σ y = 126 m and σ z =51m Solving in pieces exp -[ ] = [2*125 2 ] Solving in pieces exp -[ (0-100m) 2 ] = [2*51 2 ] 43
44 Example: Point Source at Elevation H with Reflection Q = 110 g/s H = 80 m u = 5 m/s Δh = 20 m y = 100 m σ y = 126 m and σ z =51m Solving in pieces both sides of z portion are same so add c = * * (2 * ) = g/m 3 or µg/m 3 44
45 Ground Level Concentration with reflection Often want ground level People, property exposed to pollutants Previous eq. gives misleadingly low results near ground Pollutants reflect back up from ground 45
46 Ground Level Concentration Equation for ground level concentration Z = cancels 2 Reduces to at ground level 46
47 Ground Level Example C- stability class H = 50 m Q = 95 g/s Wind speed is 3 m/s What is ground level concentration at 0.5 km downwind, along the centerline? From Figure 4-6, y = 90 m, From Figure 4-7, z = 32 m C = 95 x 10 6 µg/s * exp[-(50 2 )] exp [0] = µg/m 3 (3 m/s)(90 m)(32 m) [ 2(32) 2 ] 47
48 Maximum Ground Level Concentration Effect of ground reflection increases ground concentration Does not continue indefinitely Eventually diffusion in y-direction (crosswind) and z-direction decreases concentration 48
49 Maximum Ground Level Concentration Values for a, b, c, d are in Table
50 Alternative to Eq For moderately unstable to neutral conditions z = 0.707H C max, reflection = Q u y z 50
51 Max. Concentration Example What is maximum ground level concentration and where is it located downstream for the following? Wind speed = 2 m/s H = 71 m Stability Class B Q = 2,500,000 µg/s Solution: z = 0.707H = 0.707(71m) = 50.2 m From Figure 4-7, this occurs at x = 500 m 51


52 z = 50.2 m From Figure 4-7, this occurs at x = 500 m 52


53 At 500 m, σ y = 120 m 53
54 Max. Concentration Example What is maximum ground level concentration and where is it located downstream for the following? Wind speed = 2 m/s H = 71 m Stability Class B Q = 2,500,000 µg/s Solution: z = 0.707H = 0.707(71m) = 50.2 m From Figure 4-7, this occurs at x = 500 m From Figure 4-6, y = 120 m C max, reflection = Q = ( ) = 24.3 µg/m 3 u y z (2)(120)(50.2) 54
55 Calculation of Effective Stack Height H = h s + Δh Δh depends on: Stack characteristics Meteorological conditions Physical and chemical nature of effluent Various equations based on different characteristics, pages 162 to
56 Carson and Moses Equation 4-18 Where: Δh = plume rise (meters) V s = stack gas exit velocity (m/s) d s = stack exit diameter (meters) u s = wind speed at stack exit (m/s) Q h = heat emission rate in kilojoules per second 56
57 Other basic equations Holland concawe 57
58 Example: From text Heat emission i rate = 4800 kj/s Wind speed = 5 mph Stack gas velocity = 15 m/s Stack diameter at top is 2 m Estimate plume rise 58
59 Concentration Estimates for Different Sampling Times Concentrations calculated in previous examples based on averages over 10-minute intervals Current regulatory applications use this as 1-hour average concentration For other time periods adjust by: 3-hr multiply 1-hr value by hr multiply 1-hr value by hr multiply 1-hr value by 0.4 annual multiply l 1-hr value by
60 Concentration Estimates for Different Sampling Times Example For other time periods adjust by: 3-hr multiply l 1-hr value by hr multiply 1-hr value by hr multiply utpy1-hr value by 0.4 annual multiply 1-hr value by Conversion of 1-hr concentration of previous example to an 8- hour average = c 8 hour = 36.4 µg/m 3 x 0.7 = 25.5 µg/m 3 8-hour µg µg 60
61 Line Sources Imagine that a line source, such as a highway, consists of an infinite number of point sources The roadway can be broken into finite elements, each representing a point source, and contributions from each element are summed to predict net concentration 61
62 Line Sources When wind direction is normal to line of emission Ground level concentration downwind C(x,0) = 2q exp(-0.5h 05H 2 ) (2Π) 0.5 z u 2 z q = source strength per unit distance (g/s * m) Concentration should be uniform in the y-direction at a given x 62
63 Line Sources For ground level (H = 0), could also use breathing height C(x,0) = 2q exp(-0.5h 05H 2 ) (2Π) 0.5 z u 2 z 1 63
64 Roadway Emissions and Mixing From Guensler, 2000 u (wind direc 64
65 Instantaneous Release of a Puff Pollutant released quickly Explosion Accidental spill Release time << transport time Also based on Gaussian distribution function 65
66 Instantaneous Release of a Puff Equation 4-41 to predict maximum ground level concentration C max = 2Qp (2Π) 3/2 x y z Receptor downwind would see a gradual increase in concentration ti until center of puff passed and then concentration would decrease Assume x = y 66
67 Figure 4-9 and Table
68 Figure 4-9 and Table
69 Puff Example A tanker spill on the freeway releases 400, grams of chlorine. What exposure will vehicles directly behind the tanker (downwind) receive if x =100 m? Assume very stable conditions. From Table 4-7, 69
70 Figure 4-9 and Table
71 Puff Example A tanker spill on the freeway releases 400, grams of chlorine. What exposure will vehicles directly behind the tanker (downwind) receive if x =100 m? Assume very stable conditions. From Table 4-7, y = 0.02(100m) 0.89 = 1.21 From Table 4-7, 05( z = 0.05(100m) 0.61 = x = y =
72 Puff Example A tanker spill on the freeway releases 400, grams of chlorine. What exposure will vehicles directly behind the tanker (downwind) receive if x =100 m? Assume very stable conditions. From Table 4-7, y = 0.02(100m) 0.89 = 1.21 From Table 4-7, 05( z = 0.05(100m) 0.61 = C max = 2Q p = 2( g) = 42,181 g/m 3 (2Π) 3/2 x y z (2Π) 3/2 (1.21)(1.21)(0.83) 72
5S: Atmospheric Diffusion Model
 1. Physical model experiment (wind tunnel experiment case) Wind tunnel experiment is one of the proven methods for the estimation of atmospheric diffusion. The topography/ buildings models are set up into
Air Pollution Control EENV 4313
 Air Pollution Control EENV 4313 Chapter 6 Air Pollutant Concentration Models Wh do we need them? To predict the ambient air concentrations that will result from an planned set of emissions for an specified
Meteorological Data Collection, X/Q and D/Q, Critical Receptors
 Meteorological Data Collection, X/Q and D/Q, Critical Receptors Ken Sejkora Entergy Nuclear Northeast Pilgrim Station Presented at the 23rd Annual RETS-REMP Workshop Training Session Westminster, CO /
Module 01 Lecture - 06 Pollution modeling I
 Health, Safety and Environmental Management in Offshore and Petroleum Engineering Prof. Srinivasan Chandrasekaran Department of Ocean Engineering Indian Institution of Technology, Madras Module 01 Lecture
Module No. # 02 Lecture No. # 06 Dispersion models (continued)
") Health, Safety and Environmental Management in Petroleum and offshore Engineering Prof. Dr. Srinivasan Chandrasekaran Department of Ocean Engineering Indian Institute of Technology, Madras Module No. #
Health, Safety and Environmental Management in Petroleum and offshore Engineering Prof. Dr. Srinivasan Chandrasekaran Department of Ocean Engineering Indian Institute of Technology, Madras Module No. #
19 Pollutant Dispersion
 Copyright 015 by Roland Stull. Practical Meteorology: An Algebra-based Survey of Atmospheric Science. 19 Pollutant Dispersion Contents Dispersion Factors 74 Air Quality Standards 75 urbulence Statistics
IMPACT OF WEATHER CHANGES ON TVA NUCLEAR PLANT CHI/Q (χ/q) Kenneth G. Wastrack Doyle E. Pittman Jennifer M. Call Tennessee Valley Authority
 Kenneth G. Wastrack Doyle E. Pittman Jennifer M. Call Tennessee Valley Authority") IMPACT OF WEATHER CHANGES ON TVA NUCLEAR PLANT CHI/Q (χ/q) Kenneth G. Wastrack Doyle E. Pittman Jennifer M. Call Tennessee Valley Authority The TVA nuclear plants, like most others in the United States,
IMPACT OF WEATHER CHANGES ON TVA NUCLEAR PLANT CHI/Q (χ/q) Kenneth G. Wastrack Doyle E. Pittman Jennifer M. Call Tennessee Valley Authority The TVA nuclear plants, like most others in the United States,
ALOHA Decision Keys. Areal Locations of Hazardous Atmospheres. Mary Evans
 ALOHA Decision Keys Areal Locations of Hazardous Atmospheres Mary Evans Modeling and Simulation Studies Branch Hazardous Materials Response and Assessment Division Office of Ocean Resources Conservation
1.18 EVALUATION OF THE CALINE4 AND CAR-FMI MODELS AGAINST THE DATA FROM A ROADSIDE MEASUREMENT CAMPAIGN
 .8 EVALUATION OF THE CALINE4 AND CAR-FMI MODELS AGAINST THE DATA FROM A ROADSIDE MEASUREMENT CAMPAIGN Joseph Levitin, Jari Härkönen, Jaakko Kukkonen and Juha Nikmo Israel Meteorological Service (IMS),
Transport and Fate; Contaminants in the Atmosphere II
 Transport and Fate; Contaminants in the Atmosphere II Conrad D. Volz, DrPH, MPH-Course Director Bridgeside Point100 Technology DriveSuite 564, BRIDGPittsburgh, PA 15219-3130office 412-648-8541: cell 724-316-5408
Department of Meteorology University of Nairobi. Laboratory Manual. Micrometeorology and Air pollution SMR 407. Prof. Nzioka John Muthama
 Department of Meteorology University of Nairobi Laboratory Manual Micrometeorology and Air pollution SMR 407 Prof. Nioka John Muthama Signature Date December 04 Version Lab : Introduction to the operations
Mustafa M. Aral
 Air Pathway Analysis Mustafa M. Aral MESL @CEE,GT http://mesl.ce.gatech.edu/ maral@ce.gatech.edu Air Pollution Air pollution affects humans more than water pollution. Whereas we can always treat the water
Study of the Effect of Weather, Topography and Radionuclide on the TEDE in a Fire Scenario Involving a Dispersion of a Plume in the Atmosphere
 Middle-East Journal of Scientific Research 18 (8): 1192-1198, 2013 ISSN 1990-9233 IDOSI Publications, 2013 DOI: 10.5829/idosi.mejsr.2013.18.8.12405 Study of the Effect of Weather, Topography and Radionuclide
PLUME RISE MODEL SPECIFICATION
 August 2017 P11/02Q/17 PLUME RISE MODEL SPECIFICATION University of Surrey (A G Robins), National Power (D D Apsley) and CERC In this document ADMS refers to ADMS 5.2, ADMS-Roads 4.1, ADMS-Urban 4.1 and
Dispersion Modeling of the Transport and Dispersion of SO 2 Pollutants Emitted from a Power Plant in Tong Liang
 Final Report for the Project Dispersion Modeling of the Transport and Dispersion of SO 2 Pollutants Emitted from a Power Plant in Tong Liang Contractors: Dr. Darko Koracin, Dr. John Watson, 1. Executive
A VALIDATION EXERCISE ON THE SAFE-AIR VIEW SOFTWARE. Joint Research Centre NDFM Ispra, Italy 2
 A VALIDATION EXERCISE ON THE SAFE-AIR VIEW SOFTWARE F. D Alberti 1, F. d Amati 1, E. Canepa 2, G. Triacchini 3 1 Joint Research Centre NDFM Ispra, Italy 2 CNR INFM CNISM Department of Physics, University
Supporting Information for. Measuring Emissions from Oil and Natural Gas. Well Pads Using the Mobile Flux Plane Technique
 Supporting Information for Measuring Emissions from Oil and Natural Gas Well Pads Using the Mobile Flux Plane Technique Chris W. Rella*, Tracy R. Tsai, Connor G. Botkin, Eric R. Crosson, David Steele This
Assessing Atmospheric Releases of Hazardous Materials
 Assessing Atmospheric Releases of Hazardous Materials Nathan Platt and Jeffry Urban The Problem Atmospheric transport and dispersion (AT&D) models play an important role in the Department of Defense because
USE OF A STATEWIDE MESOSCALE AUTOMATED WEATHER STATION NETWORK FOR REAL-TIME OPERATIONAL ASSESSMENT OF NEAR-SURFACE DISPERSION CONDITIONS
 JP3.3 USE OF A STATEWIDE MESOSCALE AUTOMATED WEATHER STATION NETWORK FOR REAL-TIME OPERATIONAL ASSESSMENT OF NEAR-SURFACE DISPERSION CONDITIONS J. D. Carlson * Oklahoma State University, Stillwater, Oklahoma
Footprints: outline Üllar Rannik University of Helsinki
 Footprints: outline Üllar Rannik University of Helsinki -Concept of footprint and definitions -Analytical footprint models -Model by Korman and Meixner -Footprints for fluxes vs. concentrations -Footprints
IF YOU CAN T SOLVE PROBLEM 1, ASSUME stability = D, width = 400m, height = 400m, flow = 10 6 m 3 /s
 NAME: 75 MINUTES; HAND IN YOUR 1 SHEET OF NOTES WITH THE EXAM; ASK FOR EXTRA PAPER IF NEEDED. MAKE (AND STATE) ANY REASONABLE ASSUMPTIONS NECESSARY TO GET AN ANSWER IN ADDITION TO THOSE GIVEN. CHECKING
Analytical Model for Dispersion of Rocket Exhaust Source Size Impact Assessment
 American Journal of Environmental Engineering 28, 8(4): 35-39 DOI:.5923/j.ajee.2884.8 Analytical Model for Dispersion of Rocket Exhaust Source Size Impact Assessment Bruno K. Bainy,*, Bardo E. J. Bodmann
Measuring the flux of dust from unpaved roads John M. Veranth and Eric Pardyjak University of Utah
 Measuring the flux of dust from unpaved roads John M. Veranth and Eric Pardyjak University of Utah Keywords: Dust flux, fugitive dust, road dust, wind erosion, atmospheric dust measurement, US EPA AP-42.
350 Int. J. Environment and Pollution Vol. 5, Nos. 3 6, 1995
 350 Int. J. Environment and Pollution Vol. 5, Nos. 3 6, 1995 A puff-particle dispersion model P. de Haan and M. W. Rotach Swiss Federal Institute of Technology, GGIETH, Winterthurerstrasse 190, 8057 Zürich,
Developments in ADMS-Airport and its Applications to Heathrow Airport. IAE (Institute of Aviation and the Environment) Cambridge, June
 Cambridge, June") Developments in ADMS-Airport and its Applications to Heathrow Airport David Carruthers Cambridge Environmental Research Consultants IAE (Institute of Aviation and the Environment) Cambridge, June 23 28
Developments in ADMS-Airport and its Applications to Heathrow Airport David Carruthers Cambridge Environmental Research Consultants IAE (Institute of Aviation and the Environment) Cambridge, June 23 28
MODELS FOR ASSESSING AIR POLLUTION IN CITIES
 The Eighth Asia-Pacific Conference on Wind Engineering, December 10 14, 013, Chennai, India MODELS FOR ASSESSING AIR POLLUTION IN CITIES S. Kar 1 and M. Damodaran 1 Graduate Student of Chemical Engineering,
Prof. Rajesh Bhagat Asst. Professor Civil Engg. Department Y. C. C. E., Nagpur
 Prof. Rajesh Bhagat Asst. Professor Civil Engg. Department Y. C. C. E., Nagpur Mobile No.:- 8483003474 / 8483002277 Email ID:- rajeysh7bhagat@gmail.com Website:- www.rajeysh7bhagat.wordpress.com B. E.
6. Continuous Release - Point Source
 1 6. Continuous Release - Point Source A scalar released continuously into a moving fluid and from a discrete point will form a plume that grows in the lateral dimension through diffusion and extends downstream
Guided Reading Chapter 16: The Atmosphere
 Name Number Date Guided Reading Chapter 16: The Atmosphere Section 16-1: The Air Around You 1. The condition of Earth s atmosphere at a particular time and place is called 2. How does Earth s atmosphere
2. REGIONAL DISPERSION
 Real-time Transport and Dispersion from Illinois Nuclear Power Plants Thomas E. Bellinger, CCM Illinois Emergency Management Agency Springfield, Illinois 1. INTRODUCTION Meteorological data routinely used
Naka-Gun, Ibaraki, , Japan
 Examination of Atmospheric Dispersion Model s Performance - Comparison with the Monitoring Data under the Normal Operation of the Tokai Reprocessing Plant - M. Takeyasu 1, M. Nakano 1, N. Miyagawa 1, M.
Trajectories of a Pair of Interacting Jets or Plumes Issuing Vertically Upwards into a Quiescent Environment
 Trajectories of a Pair of Interacting Jets or Plumes Issuing Vertically Upwards into a Quiescent Environment PANAYOTIS C. YANNOPOULOS Environmental Engineering Laboratory, Department of Civil Engineering
CFD calculations of the test 2-4 experiments. Author: G. de With
 CFD calculations of the test 2-4 experiments Author: G. de With 34. Model setup and boundary conditions Dimensions CFD model: x=1000m / y=100m / z=2000m. CFD Model: Transient simulation, with steady-state
Dispersion Model 2. Dr. AA Department of Chemical Engineering University Teknology Malaysia
 Dispersion Model Dr. AA Departent of heical Engineering Universit Teknolog Malasia Pasquill-Gifford Model Pasquill-Gifford Model ases through 0 described previousl depend on the specification of a value
Generating and Using Meteorological Data in AERMOD
 Generating and Using Meteorological Data in AERMOD June 26, 2012 Prepared by: George J. Schewe, CCM, QEP BREEZE Software 12770 Merit Drive Suite 900 Dallas, TX 75251 +1 (972) 661-8881 breeze-software.com
1.061 / 1.61 Transport Processes in the Environment
 MIT OpenCourseWare http://ocw.mit.edu 1.061 / 1.61 Transport Processes in the Environment Fall 2008 For information about citing these materials or our Terms of Use, visit: http://ocw.mit.edu/terms. 6.
NJDEP TETERBORO AIRPORT AIR QUALITY STUDY
 NJDEP TETERBORO AIRPORT AIR QUALITY STUDY Alan Kao, Principal ENVIRON International Corporation Groton, Massachusetts Final Project Presentation February 11, 2008 Background OUTLINE Recap of monitoring
Overview of Meteorology and Atmospheric Dispersion
 2 Overview of Meteorology and Atmospheric Dispersion This overview is intended to be consistent with similar sections in other CCPS books such as DeVaull, King, Lantzy and Fontaine (1995) and Hanna, Drivas
Jets and Plumes. Agenda. Definition of jets, plumes, and others. Engineering applications of Jets/Plumes. Basic properties of Jets/Plumes
 Dr. (IfH) Environmental Fluid Mechanics II Stratified Flow and Buoyant Mixing Jets and Plumes Dong-Guan Seol INSTITUTE FOR HYDROMECHANICS National Research Center of the Helmholtz Association www.kit.edu
Health Risk Assessment
 Health Risk Assessment Health Risk Assessment for the Proposed Walmart in Porterville, California Prepared for: City of Porterville 291 N Main Street Porterville, California 93257 Prepared by: Impact Sciences,
"Modelling air quality in the city"
 "Modelling air quality in the city" Diede Nijmeijer Master thesis University of Twente Applied Mathematics Specialization: Mathematical Physics and Computational Mechanics Chair: Multiscale Modelling and
Rocket Propulsion Prof. K. Ramamurthi Department of Mechanical Engineering Indian Institute of Technology, Madras
 Rocket Propulsion Prof. K. Ramamurthi Department of Mechanical Engineering Indian Institute of Technology, Madras Lecture 11 Area Ratio of Nozzles: Under Expansion and Over Expansion (Refer Slide Time:
Air Quality Simulation of Traffic Related Emissions: Application of Fine-Scaled Dispersion Modelling
 Air Quality Simulation of Traffic Related Emissions: Application of Fine-Scaled Dispersion Modelling M. Shekarrizfard, M. Hatzopoulou Dep. of Civil Engineering and Applied Mechanics, McGill University
Abstract. 1 Estimation of wind fields
 Fall-out estimation by lagrangian random walk model J. L. Polo, J. Barquin Universidad Pontificia Camillas, Alberto Aguilera, 23, 28015 Madrid (Spain) Email: barquin@iit.upco.es Abstract The purpose of
Plume Rise from Wildfires:
 !"#$%&'()*+,-('*'."/,0#1$2.*.(#3*+,4+2(5,-&3*1()',0"3."/ University of British Columbia Vancouver Dept. of Earth, Ocean & Atmospheric Sciences Weather Forecast Research Team Directed by Prof. Roland Stull
INTER-COMPARISON AND VALIDATION OF RANS AND LES COMPUTATIONAL APPROACHES FOR ATMOSPHERIC DISPERSION AROUND A CUBIC OBSTACLE. Resources, Kozani, Greece
 INTER-COMPARISON AND VALIDATION OF AND LES COMPUTATIONAL APPROACHES FOR ATMOSPHERIC DISPERSION AROUND A CUBIC OBSTACLE S. Andronopoulos 1, D.G.E. Grigoriadis 1, I. Mavroidis 2, R.F. Griffiths 3 and J.G.
SENSITIVITIES OF FOUR AIR DISPERSION MODELS TO CLIMATIC PARAMETERS FOR SWINE ODOR DISPERSION
 SENSITIVITIES OF FOUR AIR DISPERSION MODELS TO CLIMATIC PARAMETERS FOR SWINE ODOR DISPERSION Y. Xing, H. Guo, J. Feddes, Z. Yu, S. Shewchuck, B. Predicala ABSTRACT. Using air dispersion models to predict
Urban background aerosols: Negative correlations of particle modes and fragmentation mechanism
 Click Here for Full Article GEOPHYSICAL RESEARCH LETTERS, VOL. 34, L11811, doi:10.1029/2006gl029109, 2007 Urban background aerosols: Negative correlations of particle modes and fragmentation mechanism
VELOCITY AND CONCENTRATION MEASUREMENTS WITHIN ARRAYS OF OBSTACLES
 109 Global Nest: the Int. J. Vol 2, No 1, pp 109-117, 2000 Copyright 2000 GLOBAL NEST Printed in Greece. All rights reserved VELOCITY AND CONCENTRATION MEASUREMENTS WITHIN ARRAYS OF OBSTACLES ILIAS MAVROIDIS
MODELING FOR ENVIRONMENTAL RADIATION DOSE RECONSTRUCTION. Bruce Napier 23 May 2011
 MODELING FOR ENVIRONMENTAL RADIATION DOSE RECONSTRUCTION Bruce Napier 23 May 2011 1 Topics NCRP Report No. 163 Atmospheric dispersion modeling Reconstruction of dose from releases of iodines and noble
Pollutant dispersion in urban geometries
 Pollutant dispersion in urban geometries V. Garbero 1, P. Salizzoni 2, L. Soulhac 2 1 Politecnico di Torino - Department of Mathematics 2 Ecole Centrale de Lyon - Laboratoire de Méchaniques des Fluides
DISPERSION OF POLLUTANTS IN THE ATMOSPHERE: A NUMERICAL STUDY
 DISPERSION OF POLLUTANTS IN THE ATMOSPHERE: A NUMERICAL STUDY by Bamdad Hosseini B. Sc., Sharif University of Technology 2010 a Thesis submitted in partial fulfillment of the requirements for the degree
MODULE 4.3 Atmospheric analysis of particulates
 MODULE 4.3 Atmospheric analysis of particulates Measurement And Characterisation Of The Particulate Content 1 Total particulate concentration 1 Composition of the particulate 1 Determination of particle
AOS 104 Fundamentals of Air and Water Pollution
 AOS 104 Fundamentals of Air and Water Pollution Dr. Jeffrey Lew lew@atmos.ucla.edu AIM: jklew888 TuTh 1:00-3:05 MS 7124A MS1961 310-825-3023 1 Grades Homework 160 pts 2 Midterms 290 pts Final Exam Total
A METHOD FOR EVALUATING HAZARDS OF LOW VOLATILITY TOXIC LIQUIDS
 A METHOD FOR EVALUANG HAZARDS OF LOW VOLALITY TOXIC LIQUIDS Timothy A. Melton and David W. Johnson Presented At 1998 Plant Safety Symposium Houston, Texas October 26-27, 1998 Presented By Quest Consultants
Environmental Air Pollution Prof. Mukesh Sharma Department of Civil Engineering Indian Institute of Technology, Kanpur
 Environmental Air Pollution Prof. Mukesh Sharma Department of Civil Engineering Indian Institute of Technology, Kanpur Lecture 5 Measurement Units and Particulate Classification So what did we do last
Planetary Atmospheres: Earth and the Other Terrestrial Worlds Pearson Education, Inc.
 Planetary Atmospheres: Earth and the Other Terrestrial Worlds 10.1 Atmospheric Basics Our goals for learning: What is an atmosphere? How does the greenhouse effect warm a planet? Why do atmospheric properties
EVALUATION OF NEW GENERATION ATMOSPHERIC DISPERSION MODELS
 EVALUATION OF NEW GENERATION ATMOSPHERIC DISPERSION MODELS D.J. Hall*, A.M. Spanton*, M. Bennett**, F. Dunkerley**, R.F. Griffiths**, B.E.A. Fisher***, R.J. Timmis****. *Envirobods Ltd, 13, Badminton Close
FLACS CFD Model Evaluation with Kit Fox, MUST, Prairie Grass, and EMU L-Shaped Building Data
 FLACS CFD Model Evaluation with Kit Fox, MUST, Prairie Grass, and EMU L-Shaped Building Data Steven Hanna (Harvard Univ., Boston, MA) Olav Hansen (Gexcon, Bergen, Norway) Seshu Dharmavaram (Dupont Corp.,
CHAM Case Study CFD Modelling of Gas Dispersion from a Ruptured Supercritical CO 2 Pipeline
 CHAM Limited Pioneering CFD Software for Education & Industry CHAM Case Study CFD Modelling of Gas Dispersion from a Ruptured Supercritical CO 2 Pipeline 1. INTRODUCTION This demonstration calculation
Air Pollution Meteorology
 Air Pollution Meteorology Government Pilots Utilities Public Farmers Severe Weather Storm / Hurricane Frost / Freeze Significant Weather Fog / Haze / Cloud Precipitation High Resolution Weather & Dispersion
Numerical simulation of dispersion around an isolated cubic building: Model evaluation of RANS and LES. Yoshihide Tominaga a and Ted Stathopoulos b
 Accepted on 3 April for publication in the Building and Environment Numerical simulation of dispersion around an isolated cubic building: Model evaluation of RANS and Yoshihide Tominaga a and Ted Stathopoulos
Newton s first law. Objectives. Assessment. Assessment. Assessment. Assessment 5/20/14. State Newton s first law and explain its meaning.
 Newton s first law Objectives State Newton s first law and explain its meaning. Calculate the effect of forces on objects using the law of inertia. Explain conceptually why moving objects do not always
Monitoring Survey in the Vicinity of St. Marys Cement: Interim Report
 Technical Memorandum 2017-2018 Monitoring Survey in the Vicinity of St. Marys Cement: Interim Report Ontario Ministry of the Environment & Climate Change Report Prepared by: Terrestrial Assessment and
Describing Mo tion. Speed and Velocity. What is speed?
 CHAPTER 1 LESSON 2 Describing Mo tion Speed and Velocity Key Concepts What is speed? How can you use a dis tance-time graph to calculate average speed? What are ways velocity can change? What do you think?
CALPUFF Modeling Analysis of the Sulfur Dioxide Impacts due to Emissions from the Portland Generating Station
 CALPUFF 1992-1993 Modeling Analysis of the Sulfur Dioxide Impacts due to Emissions from the Portland Generating Station February 25, 2010 Bureau of Technical Services New Jersey Dept. of Environmental
Worldwide Data Quality Effects on PBL Short-Range Regulatory Air Dispersion Models
 Worldwide Data Quality Effects on PBL Short-Range Regulatory Air Dispersion Models Jesse L. Thé 1, Russell Lee 2, Roger W. Brode 3 1 Lakes Environmental Software, -2 Philip St, Waterloo, ON, N2L 5J2, Canada
Sampling. Information is helpful in implementing control measures for reducing pollutant concentration to acceptable levels
 Types of pollutant sampling and measurement: Air quality monitoring: Sampling and measurement of air pollutants generally known, as air quality monitoring. It is an integral component of any air pollution
AERMOD Technical Forum
 AERMOD Technical Forum Roger W. Brode MACTEC Federal Programs, Inc. Research Triangle Park, NC EPA R/S/L Modelers Workshop San Diego, California May 16, 2006 Presentation Outline Brief History of AERMOD
Chapter 3. Materials and Methods
 Chapter 3 Materials and Methods CHAPTER3 MATERIALS AND METHODS The present study aims to identify the role of climatic factors in the dispersal of air pollutants released into the atmosphere at some important
Modeling the Physical Processes that Impact the Fate and Fallout of Radioactive Materials
 Modeling the Physical Processes that Impact the Fate and Fallout of Radioactive Materials J.V. Ramsdell, Jr. Radiological Science and Engineering Group Pacific Northwest National Laboratory Richland, Washington
Predicting concentration fluctuations with a puffparticle
 Int. J. Environment and Pollution, Vol. 16, Nos. 1 6, 2001 49 Predicting concentration fluctuations with a puffparticle model P. de Haan INFRAS, Muehlemattstr. 45, 3007 Bern, Switzerland e-mail: peter.dehaan@infras.ch
ATS150 Global Climate Change Spring 2019 Candidate Questions for Exam #1
 1. How old is the Earth? About how long ago did it form? 2. What are the two most common gases in the atmosphere? What percentage of the atmosphere s molecules are made of each gas? 3. About what fraction
Lab #3: Stability and Dispersion. Fall 2014 Due Tuesday, November 25, 2014
 NAME ID number Disc. Day and Time Lab #3: Stability and Dispersion Atmospheric Sciences 2L Fall 2014 Due Tuesday, November 25, 2014 In this lab, we will test the stability of a simulated atmospheric environment
VALIDATION OF THE URBAN DISPERSION MODEL (UDM)
") VALIDATION OF THE URBAN DISPERSION MODEL (UDM) D.R. Brook 1, N.V. Beck 1, C.M. Clem 1, D.C. Strickland 1, I.H. Griffits 1, D.J. Hall 2, R.D. Kingdon 1, J.M. Hargrave 3 1 Defence Science and Technology
VALIDATION OF THE URBAN DISPERSION MODEL (UDM) D.R. Brook 1, N.V. Beck 1, C.M. Clem 1, D.C. Strickland 1, I.H. Griffits 1, D.J. Hall 2, R.D. Kingdon 1, J.M. Hargrave 3 1 Defence Science and Technology
Exposure to Release. Stages. Predict % affected by the exposure. Predict effects of exposure near the surface.
 Dispersion Models Eposure to Release Predict effects of eposure near the surface. 1 3 4 Predict % affected b the eposure. 5 6 Stages 1. Source. Acceleration, Diffusion 3. Gravit 4. Transition 5. Surface
Tritium Environmental Assessment for Fusion Reactor Using TAS3.0
 Tritium Environmental Assessment for Fusion Reactor Using TAS3.0 Baojie Nie, Muyi Ni, Minghuang Wang, Jing Song Contributed by FDS Team Key laboratory of Neutronics and Radiation Safety Institute of Nuclear
Fluid Mechanics. Chapter 9 Surface Resistance. Dr. Amer Khalil Ababneh
 Fluid Mechanics Chapter 9 Surface Resistance Dr. Amer Khalil Ababneh Wind tunnel used for testing flow over models. Introduction Resistances exerted by surfaces are a result of viscous stresses which create
Common Elements: Nitrogen, 78%
 Chapter 23 Notes Name: Period: 23.1 CHARACTERISTICS OF THE ATMOSPHERE The atmosphere is a layer of that surrounds the earth and influences all living things. Meteorology is the study of the. WHAT S IN
WIND FLOW AND VAPOR CLOUD DISPERSION AT INDUSTRIAL AND URBAN SITES
 WIND FLOW AND VAPOR CLOUD DISPERSION AT INDUSTRIAL AND URBAN SITES Steven R. Hanna Hanna Consultants Rex E. Britter University of Cambridge Center for Chemical Process Safety of the American Institute
Our Planet Earth. I nteractions of Earth Systems
 CHAPTER 3 LESSON 2 Our Planet Earth I nteractions of Earth Systems Key Concepts How does the water cycle show interactions of Earth systems? How does weather show interactions of Earth systems? How does
Chapter 2 Available Solar Radiation
 Chapter 2 Available Solar Radiation DEFINITIONS Figure shows the primary radiation fluxes on a surface at or near the ground that are important in connection with solar thermal processes. DEFINITIONS It
Mesoscale models for urban air quality research with high resolution
 This work is supported by the Russian Foundation for Basic Research, grant N 7-5-11265 1126 Mesoscale models for urban air uality research with high resolution Starchenko Alexander V., Bart A.A., Belikov
MODELING SO 2 DISPERSION DURING 5-6 FEBRUARY 1997 EPISODE OVER IZMIT GULF, TURKEY
 Proceedings of the Third International Symposium on Air Quality Management at Urban, Regional and Global Scales. pp. 644-653, 26-30 September 2005, Istanbul Turkey MODELING SO 2 DISPERSION DURING 5-6 FEBRUARY
Therefore, the control volume in this case can be treated as a solid body, with a net force or thrust of. bm # V
 When the mass m of the control volume remains nearly constant, the first term of the Eq. 6 8 simply becomes mass times acceleration since 39 CHAPTER 6 d(mv ) CV m dv CV CV (ma ) CV Therefore, the control
Chapter 9 NATURAL CONVECTION
 Heat and Mass Transfer: Fundamentals & Applications Fourth Edition in SI Units Yunus A. Cengel, Afshin J. Ghajar McGraw-Hill, 2011 Chapter 9 NATURAL CONVECTION PM Dr Mazlan Abdul Wahid Universiti Teknologi
Chemical reactions at street scale using a Lagrangian particle dispersion model (LPDM)
") ARIA Technologies Chemical reactions at street scale using a Lagrangian particle dispersion model (LPDM) H. Kaplan, C. Orly, J. Moussafir, O. Oldrini, F. Mahe and A. Albergel ARIA Technologies SA 8-10,
ARIA Technologies Chemical reactions at street scale using a Lagrangian particle dispersion model (LPDM) H. Kaplan, C. Orly, J. Moussafir, O. Oldrini, F. Mahe and A. Albergel ARIA Technologies SA 8-10,
Name Date Roy G Biv Page 1
 Name Date Roy G Biv 1. Two geologic surveys of the same area, made 50 years apart, showed that the area had been uplifted 5 centimeters during the interval. If the rate of uplift remains constant, how
Continuous measurement of airborne particles and gases
 Continuous measurement of airborne particles and gases Jeff Collett and Taehyoung Lee Atmospheric Science Department Colorado State University Funding: USDA/AES and NPS Outline Why measure particles and
Conceptual Physical Science
 Hewitt/Suchocki/Hewitt Conceptual Physical Science Fourth Edition Chapter 1: PATTERNS OF MOTION AND EQUILIBRIUM This lecture will help you understand: Aristotle on Motion Galileo s Concept of Inertia Mass
Deutscher Wetterdienst
 Deutscher Wetterdienst Modelling the Volcanic Ash Episode: Experiences with COSMO-ART Detlev Majewski (FE1) Bernhard Vogel, Heike Vogel (KIT) Thomas Hanisch, Jochen Förstner (FE13), Ulrich Pflüger (FE15)
Follow this and additional works at:
 International Congress on Environmental Modelling and Software Brigham Young University BYU ScholarsArchive 6th International Congress on Environmental Modelling and Software - Leipzig, Germany - July
ESCI 485 Air/sea Interaction Lesson 3 The Surface Layer
 ESCI 485 Air/sea Interaction Lesson 3 he Surface Layer References: Air-sea Interaction: Laws and Mechanisms, Csanady Structure of the Atmospheric Boundary Layer, Sorbjan HE PLANEARY BOUNDARY LAYER he atmospheric
MLCD: A SHORT-RANGE ATMOSPHERIC DISPERSION MODEL FOR EMERGENCY RESPONSE CONTRACT REPORT. Thomas Flesch, John Wilson, and Brian Crenna
 MLCD: A SHORT-RANGE ATMOSPHERIC DISPERSION MODEL FOR EMERGENCY RESPONSE CONTRACT REPORT Thomas Flesch, John Wilson, and Brian Crenna Department of Earth and Atmospheric Sciences University of Alberta Edmonton,
ROAD SOURCE MODEL INTERCOMPARISON STUDY USING NEW AND EXISTING DATASETS
 ROAD SOURCE MODEL INTERCOMPARISON STUDY USING NEW AND EXISTING DATASETS Jenny Stocker 1, David Heist 2, Christina Hood 1, Vlad Isakov 2, David Carruthers 1, Steven Perry 2, Michelle Snyder 2, Akula Venkatram
Modelling flammable chemical major hazards using the DRIFT 3 dispersion model
 Modelling flammable chemical major hazards using the DRIFT 3 dispersion model Zoe Chaplin a*, Helen Cruse a, Graham Tickle b, Harvey Tucker c a Health and Safety Executive, Harpur Hill, Buxton, Derbyshire
METEOROLOGY AND AIR POLLUTION. JAI PRAKASH Civil Engineering IIT Delhi 1 AUGUST, 2011
 METEOROLOGY AND AIR POLLUTION JAI PRAKASH Civil Engineering IIT Delhi 1 AUGUST, 2011 METEOROLOGY Aerosols particles which are emitted from the sources they are transported and dispersed through meteorological
Harris: Quantitative Chemical Analysis, Eight Edition CHAPTER 23: GAS CHROMATOGRAPHY
 Harris: Quantitative Chemical Analysis, Eight Edition CHAPTER 23: GAS CHROMATOGRAPHY Chapter 23. Gas Chromatography What did they eat in the year 1,000? GC of Cholesterol and other lipids extracted from
ERTH 465 Fall Lab 3. Vertical Consistency and Analysis of Thickness. (300 points)
") Name Date ERTH 465 Fall 2015 Lab 3 Vertical Consistency and Analysis of Thickness (300 points) 1. All labs are to be kept in a three hole binder. Turn in the binder when you have finished the Lab. 2. Show
Name Date ERTH 465 Fall 2015 Lab 3 Vertical Consistency and Analysis of Thickness (300 points) 1. All labs are to be kept in a three hole binder. Turn in the binder when you have finished the Lab. 2. Show
UNIT ONE BOOKLET 6. Thermodynamic
 DUNCANRIG SECONDARY ADVANCED HIGHER CHEMISTRY UNIT ONE BOOKLET 6 Thermodynamic Can we predict if a reaction will occur? What determines whether a reaction will be feasible or not? This is a question that