Math 2200 Fall 2014, Exam 3 You may use any calculator. You may use a 4 6 inch notecard as a cheat sheet.
|
|
|
- Solomon Williamson
- 6 years ago
- Views:
Transcription
1 1 Math 2200 Fall 2014, Exam 3 You may use any calculator. You may use a 4 6 inch notecard as a cheat sheet. Warning to the Reader! If you are a student for whom this document is a historical artifact, be aware that the definitions and conventions on which some of the questions on this exam are based may differ from those adopted in your course. 1. If X, Y, and W are independent random variables with variances 4, 5, and 6 respectively, then what is the standard deviation of 3 X + 2 Y - W? A) B) C) D) E) F) G) H) I) J) Solution. Because Var(3 X + 2 Y - W) = 9 Var(X)+4 Var(y)+Var(W) = 62, we have Sd( 3 X + 2 Y - W ) = 62 = Answer: F 2. The weight of fluid in each bottle of Pilsner Aquarelle is normally distributed with mean 12 oz and standard deviation 0.34 oz. Assume that the weights of different bottles are independent. What is the probability that the total weight of the contents of 6 bottles exceeds 73 oz? A) B) C) D) E) F) G) H) I) J) Solution. Let W = X 1 + X X 6 where X j is the weight of the contents of the j th bottle. Then E(X) = 6 12 = 72, Var(W ) = 6 (0.34) 2 = , and Sd(W ) = = We calculate Answer: E P(W > 73) (W 72 > 73 72) W > W E(W) > Sd(W) ( Z > ) = 1 P ( Z ) = 1 Φ(1.2007) = = Rhys s time for running a 1 mile race is normally distributed with mean 6 minutes and standard deviation 2 minutes. Reese s time for running a 1 mile race is normally distributed with mean 10 minutes and standard deviation 1 minute. If they race each other, what is the probability that Reese will win by at least 30 seconds? (That is, what is the probability that Rhys s time exceeds Reese s time by 30 seconds.) A) B) C) D) E) F) G) H) I) J)
2 2 Solution. Let X be Rhys s time and let Y be Reese s time. Because X and Y are independent normal, the variable X - Y is normal. Moreover, E(X - Y) = 6 10 = 4 and Var(X-Y) = Var(X) + Var(Y) = = 5. Therefore, Sd(X-Y) = 5 = It follows that P(X Y > 1/2) (X Y ( 4) > 1/2 ( 4)) ( X Y ( 4) > 4.5 ) (Z > ) = 1 Φ(2.0125) = = Note, we can obtain Φ(2.0125) from the table as Φ(2.01)+(25/100)(Φ(2.02) Φ(2.01)) = (1/4)(0.0005) = Answer: F 4. Nineteenth century novelist Charles Wutthe was paid for his stories by the word: 1 pence per word by the publishing house Dombey and Son, and two pence per word by The Pickwick Press. Charles found that when Dombey s editor was through with his stories, their lengths were normally distributed with mean 5000 words and standard deviation 200 words. When Pickwick was done editing his stories, their lengths were normally distributed with mean 3000 words and standard deviation 300 words. What was the probability that a story submitted to Dombey would bring more pence than a story submitted to Pickwick? A) B) C) D) E) F) G) H) I) J) Solution. Let X and Y be the length random variables of Charles s stories after submission to Dombey and Pickwick respectively. Then E(X 2 Y) = = 1000, Var(X 2 Y) = Var(X) Var(Y) = = , and Sd(X 2 Y) = = We calculate P (X > 2 Y) (X 2 Y > 0) (X 2 Y ( 1000) > 0 ( 1000)) ( (X 2 Y) ( 1000) > 1000 ) (X 2 Y) E(X 2 Y) > Sd(X 2 Y) (Z > ) = 1 P (Z ) = 1 Φ(1.5811) = = Answer: A 5. In 1971 there were 65 highjackings of aircraft. For the purposes of preparedness, it was of interest to know the probability p of more than one highjacking occurring in one day. Assuming that highjackings
3 3 were a Poisson process, what was p? A) B) C) D) E) F) G) H) I) J) Solution. Set λ = 65/365 = , the average number of highjackings per day. Let X be the number of highjackings on any given day. Then P (X = k) = exp( λ) λ k /k! for k = 0, 1, 2,.... We calculate p = 1 ( P (X = 0) + P (X = 1) ) Answer: B λ λ0 λ1 = 1 e e λ 0! 1! = 1 e λ e λ λ = = If X and Y are independent standard normal random variables, what is P ( 2.4 < X 2 + Y 2 < 4.6 )? A) 0.05 B) 0.10 C) 0.15 D) 0.20 E) 0.25 F) 0.30 G) 0.35 H) 0.40 I) 0.45 J) 0.50 Solution. ( ( Let F be the cumulative distribution function of χ 2 2. We are asked for F(4.6) - F(2.4), or 1 P χ 2 2 > 4.6 )) ( 1 P ( χ 2 2 > 2.4 )) = (1 0.1) (1 0.3) = 0.2 Answer: D 7. A random sample X 1, X 2,..., X 25 is drawn from a distribution. The variance of the sampling distribution of (X 1 + X X 10 ) /10 is 60. What is the variance of the sampling distribution of (X 11 + X X 25 ) /15? A) 5 B) 10 C) 15 D) 20 E) 25 F) 30 G) 35 H) 40 I) 45 J) 50 Solution. Let σ be the population standard deviation. Then σ 2 10 = Var X1 + X X 10 = 60, 10 so σ 2 = 600. It follows that X11 + X X 25 Var = σ = = 40. Answer: H 8. A random sample X 1, X 2,... X 34 is drawn from a distribution. The variance of the sampling distribution of the average of the first 18 of these variables is exactly three times the standard deviation of the sampling distribution of the average of the remaining 16 of these variables. What is the population standard deviation? A) 9.5 B) 10 C) 10.5 D) 11 E) 11.5 F) 12 G) 12.5 H) 13 I) 13.5 J) 14
4 4 Solution. Let σ be the population standard deviation. The given information can be expressed as the following equation: σ 2 /18 = 3 σ/ 16. The solution is Answer: I 9. It has been estimated that employers verify the asserted educational qualifications of job applicants 75% of the time. Use the normal approximation without the continuity correction to approximate the probability that the educational credentials of at least 70 of 100 applicants will be checked. (It might be useful to read the next question before answering this one.) A) 0.76 B) 0.78 C) 0.80 D) 0.82 E) 0.84 F) 0.86 G) 0.88 H) 0.90 I) 0.92 J) 0.94 Solution. Let X j = 1 if the educational qualifications of the j th applicant are verified, and X j = 0 if not. Let Y = X 1 + X X 100. Then E(Y) = 100 (0.75) = 75, Var(Y) = 100 (0.75) (0.25) = 18.75, and Sd(Y) = = Thus, P(Y 70) (Y ) Y (Z ) (Z ) = Φ(1.1547) = Answer: G 10. Answer the preceding problem once again, but this time use the correction for continuity. A) 0.76 B) 0.78 C) 0.80 D) 0.82 E) 0.84 F) 0.86 G) 0.88 H) 0.90 I) 0.92 J) 0.94 Solution. The solution follows that of the preceding problem, but we use 60.5 instead of 70: P(Y 69.5) (Y ) Y (Z ) (Z ) = Φ(1.2702) = Using the binomial distribution, the exact probability is 100 k=70 ( 100 k Answer: H ) (0.75) k (0.25) 100 k =
5 5 11. In a large class, scores on an exam have the distribution N(18.8, 4.2). (Recall that, in our notation, the second parameter is the population standard deviation and not anything else.) If a random sample of size 10 is drawn, what is the probability that the sample variance is greater than 5.292? A) B) C) D) E) F) G) H) I) J) Solution. Let S 2 (10 1) be the sample variance. Then (4.2) 2 S 2 χ We have P ( S 2 > ) (10 1) (4.2) 2 S 2 (10 1) > (4.2) ( χ 2 9 > 2.7 ) = Answer: I 12. The heights of women in a large statistics class have the distribution N(µ, σ) with unknown population mean µ and unknown standard deviation σ. The heights of three randomly chosen women in the class are 64, 67, and 67 inches. What is the probability that the population mean µ is less than 65 inches A) 0.01 B) 0.11 C) 0.21 D) 0.31 E) 0.41 F) 0.51 G) 0.61 H) 0.71 I) 0.81 J) 0.91 Solution. Let X 1, X 2, X 4 be the three heights. The sample mean is 66, the sample variance is 3, and the sample standard deviation is 3. Furthermore ( X µ ) /(S/ 3) t 3 1. Thus, P(µ < 65) ( µ > 65) (X µ > X 65) ( X µ S/ 3 > X 65 ) S/ 3 ( t 2 > X 65 ) S/ 3 ( ) t 2 > 3/ 3 (t 2 > 1). From the table of t-values, we find P (t 2 > ) = 0.25 and P (t 2 > ) = 0.2. We will do a linear interpolation. The line through the points (0.8165,0.25) and (1.0607,0.2) has slope ( )/( ), or Therefore it has equation y = (x ) Substituting x = 1, we obtain y = That is our approximation of P (t 2 > 1). Answer: C 13. In a poll of 400 registered voters, [ , ] was the confidence interval for the proportion of voters who supported candidate Todd Crude. What was the confidence level? A) 90% B) 91% C) 92% D) 93% E) 94% F) 95% G) 96% H) 97% I) 98% J) 99%
6 6 Solution. First we obtain p = ( )/2 = Next we obtain ME ( p) = = We also can find SE ( p) = 0.36(1 0.36)/400 = If z is the critical value of the confidence interval, we have = ME ( p) = z SE ( p) = z 0.024, or z = /0.024 = From the Phi table we have Φ(2.17) = Thus, α/2 = = and α = The interval is a 100(1 0.03)%, or 97% confidence interval. Answer: H 14. A charity wishes to estimate the proportion p of individuals on its mailing list who are willing to contribute $50 or more. To do so, a random survey of size n is conducted. In order to have a margin of error no greater than 0.05 and a 95% confidence level, what is the smallest sample size n that meets the requirements? A) 355 B) 360 C) 365 D) 370 E) 375 F) 380 G) 385 H) 390 I) 395 J) 400 Solution. Here z = 1.96 and 2 ME 0 = 0.1. The required sample size is n = (1.96/0.10) 2 = rounded up to the nest whole number. Answer: G 15. In a study of 6,000 diabetic patients treated by primary care physicians in Alabama, Iowa, and Maryland, 84% of the subjects were not receiving specialized blood work recommended by the American Diabetes Association. What is the upper bound for a 90% confidence interval for the proportion of all diabetic patients in those states who receive the recommended blood work? A) B) C) D) E) F) G) H) I) J) Solution. The requested upper bound is z 0.10/2 (0.84)(0.16) 6000 = = Answer: C 16. Lars Birdski, a star of European basketball, made 46 baskets (successes) in 50 free throws (trials). Find the lower bound for a 95% confidence interval for his success rate p. A) B) C) D) E) F) G) H) I) J) Solution. The Success-Failure Condition is not satisfied. Therefore, the Agresti-Coull adjustment is needed. With the four phony trials included, we have n = 54, p = 48/54 = , 1 p = 6/54 = , SE ( p) = (0.8889)(0.1111)/54 = , ME ( p) = 1.96 SE ( p) = (1.96)( ) = , and p ME ( p) = = is the lower bound for a 95% confidence interval for Lars Birdski s success rate p. Answer: A 17. The Acme Oat Foods Company packages its delicious oatmeal crisps in 18 oz cereal boxes. Of course, the reality is that there is some variability. Thanks to a long history of production, Acme knows that
7 7 the standard deviation of the weight of the contents is 0.66 oz. As part of its customary quality control, Acme randomly sampled 36 boxes and found the sample mean to be oz. What is the upper bound of a 99% confidence interval for the weight of the cereal? A) B) C) D) E) F) G) H) I) J) Solution. Because z = , the required upper bound is / 36, or Answer: D 18. A random sample of size 64 from a distribution has sample standard deviation equal to 10. What is the length of a 92.16% confidence interval for the mean of the distribution? A) 4.40 B) 4.54 C) 4.68 D) 4.82 E) 4.96 F) 5.10 G) 5.24 H) 5.38 I) 5.52 J) 5.66 Solution. Solving the equation 100(1 α) = 92.16, we obtain α = Therefore, α/2 = From the table, we find Φ(z) = , or Φ(z) = , has solution z = Therefore, the length of the described confidence interval is 2 ME = SE = / 64, or 4.4. Answer: A 19. The sample 5, 7, 10, 14 was drawn from a normal distribution. What is the margin of error for an 80% confidence interval for the mean? A) B) C) D) E) F) G) H) I) J) Solution. For this small sample (n = 4) from a normal distribution, we must use a Student-t distribution with n 1, or 3, degrees of freedom. From the Student-t table, we have t 0.1,3 = The sample mean is 9 and the sample standard deviation is S = The margin of error is / 4, or Answer: E 20. A random sample of size 11 was drawn from a normal distribution with unknown population mean and unknown population variance σ 2. The sample variance was 20. Which of the following is a 95% confidence interval for σ 2? A) [8.3, 59.6] B) [8.6, 60.0] C) [8.9, 60.4] D) [9.2, 60.8] E) [9.5, 61.2] F) [9.8,61.6] G) [10.1, 62.0] H) [10.4, 62.4] I) [10.7, 62.8] J) [11.0, 63.2] Solution. Unlike confidence intervals for means, which are based on symmetric normal and Student-t random variables, there is no natural center for a confidence interval of σ 2. That is because such confidence intervals are based on asymmetric χ 2 df random variables. Still, there is a standard procedure: if S 2 is the sample variance, then S [ 11 1, S 2] is a 95% confidence interval for σ 2. Substituting the observed value χ ,11 1 χ ,11 1 [ ] of S 2 and the tabulated values χ ,10 = and χ ,10 = , we obtain 20, 20, χ ,10 χ ,10 or [ , ], or [9.8, 61.6] Answer: F
8 8 21. A dietician created two low calorie diets, A and B. Of the two, diet B was also low in fat. The dietician performed an experiment to determine if the diets reduced obesity during a fixed length of time. Let µ A and µ B be the true average loss in pounds for the entire population. The dietician had 100 subjects follow diet A and 86 subjects follow diet B. The sample variances were S 2 A = 22.4 and S 2 B = A 95% confidence interval for µ B µ A was found. What was the margin of error? A) 1.25 B) 1.30 C) 1.35 D) 1.40 E) 1.45 F) 1.50 G) 1.55 H) 1.60 I) 1.65 J) 1.70 Solution. The standard deviation is S = = The margin of error is z S, or , or Remark: The authorized alternative is to use t 0.025,85, or , instead of z Doing so results in t 0.025,85 S, or , or , which leads to the same answer choice. Answer: A 22. The mean time µ for mice to find their way through a particular maze is 18 seconds. Psychologists conjectured that if the mice were to hear a loud, startling noise at the outset, then they might be motivated to navigate the maze more quickly. They trialed 49 mice, calculated the sample mean, which was 17 seconds, and sample standard deviation, which was 4 seconds, and tested the null hypothesis µ = 18 versus the alternative µ < 18 at the 5% significance level. Which of the following numbers is an endpoint of the critical region? A) B) C) D) E) F) G) H) I) J) Solution. The critical region is µ < µ 0 t 0.05, If z 0.05 = is used instead of the t-value, then the answer is /7, or If instead, the t-table is used to approximate t 0.05,48, we interpolate. Values are t 0.05,40 = and t 0.05,50 = The line segment between these two points has equation t = ( ) (df 40) If we substitute df = 48 in this equation, we obtain t = With this t-value, the endpoint of the critical region is /7, or Answer: A 23. A certain management task was believed to fall to senior management 50% of the time. But, because of a perceived trend, the alternative hypothesis that the task fell to senior management more than 50% of the time was considered possible. A survey of 153 companies was conducted. The particular task in question was handled by senior management at 57% of the companies. What was the p-value? A) 0.01 B) 0.02 C) 0.03 D) 0.04 E) 0.05 F) 0.06 G) 0.07 H) 0.08 I) 0.09 J) 0.10
9 9 Solution. If the null hypothesis is true, then the standard deviation of the sample mean of a random sample of size 153 is (0.5)(0.5)/153, or The requested p-value is p P ( p 0.57 p = 0.5) p = 0.5 p p = (Z ) = 1 P (Z ) = 1 Φ(1.7317) = , Answer: D 24. An article in the British Medical Journal in 2004 described how dogs can be trained to detect human bladder cancer by sniffing urine. It s a dog s life, isn t it. An experiment was set up so that the probability of correctly guessing the presence of bladder cancer was 1/7. In 81 trials, dogs were successful 33 times. Let p be the true canine success rate. Test the hypothesis H 0 : p = 1/7 versus H a : p 1/7 at 5% significance level. If the critical region is symmetric about 1/7, which of these numbers is an endpoint of the critical region? A) B) C) D) E) F) G) H) I) J) Solution. The answer choices are all greater than 1/7, which is about 0.14, so we are looking for the left endpoint p of an interval [p, 1]. The endpoint we seek is 1 (1/7)(6/7) , or Answer: B 25. Muzzle velocities of eight shells have a sample mean X = 2959 feet per second and sample standard deviation S = The gunpowder manufacturer s claim is that the mean muzzle velocity is 3000 feet per second. Test that null hypothesis against the alternative that the mean muzzle velocity is less than A) B) C) D) E) feet per second. What is the p-value? F) G) H) I) J) 0.400
10 10 Solution. We calculate the p-value as follows: Answer: B P ( X 2959 µ = 3000 ) ( X µ = 3000 ) ( X 3000 S/ 8 ( X / 8 ( X µ S/ 8 ) µ = / µ = ) S/ / µ = ( ) t / 8 (t ) (t ) = )
11 11

12 12 Chi-Squared Values Left Tails.

13 Chi-Squared Values Central Hump + Left Tails. 13

14 14 Student-t Values Left Tails α = 0.45, 0.40, 0.35, 0.30, 0.25, 0.20.

15 Student-t Values Left Tails α = 0.15, 0.10, 0.05, 0.025, 0.010,
Math 2200 Fall 2014, Final Exam You may use any calculator. You may use a 4 6 inch notecard as a cheat sheet.
 1 Math 2200 Fall 2014, Final Exam You may use any calculator. You may use a 4 6 inch notecard as a cheat sheet. Warning to the Reader! If you are a student for whom this document is a historical artifact,
# of 6s # of times Test the null hypthesis that the dice are fair at α =.01 significance
 Practice Final Exam Statistical Methods and Models - Math 410, Fall 2011 December 4, 2011 You may use a calculator, and you may bring in one sheet (8.5 by 11 or A4) of notes. Otherwise closed book. The
their contents. If the sample mean is 15.2 oz. and the sample standard deviation is 0.50 oz., find the 95% confidence interval of the true mean.
 Math 1342 Exam 3-Review Chapters 7-9 HCCS **************************************************************************************** Name Date **********************************************************************************************
Point Estimation and Confidence Interval
 Chapter 8 Point Estimation and Confidence Interval 8.1 Point estimator The purpose of point estimation is to use a function of the sample data to estimate the unknown parameter. Definition 8.1 A parameter
Sample Problems for the Final Exam
 Sample Problems for the Final Exam 1. Hydraulic landing assemblies coming from an aircraft rework facility are each inspected for defects. Historical records indicate that 8% have defects in shafts only,
CONTINUOUS RANDOM VARIABLES
 the Further Mathematics network www.fmnetwork.org.uk V 07 REVISION SHEET STATISTICS (AQA) CONTINUOUS RANDOM VARIABLES The main ideas are: Properties of Continuous Random Variables Mean, Median and Mode
MULTIPLE CHOICE. Choose the one alternative that best completes the statement or answers the question. describes the.
 Practice Test 3 Math 1342 Name MULTIPLE CHOICE. Choose the one alternative that best completes the statement or answers the question. 1) The term z α/2 σn describes the. 1) A) maximum error of estimate
Econ 325: Introduction to Empirical Economics
 Econ 325: Introduction to Empirical Economics Chapter 9 Hypothesis Testing: Single Population Ch. 9-1 9.1 What is a Hypothesis? A hypothesis is a claim (assumption) about a population parameter: population
The point value of each problem is in the left-hand margin. You must show your work to receive any credit, except on problems 1 & 2. Work neatly.
 Introduction to Statistics Math 1040 Sample Exam III Chapters 8-10 4 Problem Pages 3 Formula/Table Pages Time Limit: 90 Minutes 1 No Scratch Paper Calculator Allowed: Scientific Name: The point value of
Hypothesis testing for µ:
 University of California, Los Angeles Department of Statistics Statistics 10 Elements of a hypothesis test: Hypothesis testing Instructor: Nicolas Christou 1. Null hypothesis, H 0 (always =). 2. Alternative
QUIZ 4 (CHAPTER 7) - SOLUTIONS MATH 119 SPRING 2013 KUNIYUKI 105 POINTS TOTAL, BUT 100 POINTS = 100%
 - SOLUTIONS MATH 119 SPRING 2013 KUNIYUKI 105 POINTS TOTAL, BUT 100 POINTS = 100%") QUIZ 4 (CHAPTER 7) - SOLUTIONS MATH 119 SPRING 013 KUNIYUKI 105 POINTS TOTAL, BUT 100 POINTS = 100% 1) We want to conduct a study to estimate the mean I.Q. of a pop singer s fans. We want to have 96% confidence
QUIZ 4 (CHAPTER 7) - SOLUTIONS MATH 119 SPRING 013 KUNIYUKI 105 POINTS TOTAL, BUT 100 POINTS = 100% 1) We want to conduct a study to estimate the mean I.Q. of a pop singer s fans. We want to have 96% confidence
M(t) = 1 t. (1 t), 6 M (0) = 20 P (95. X i 110) i=1
 = 1 t. (1 t), 6 M (0) = 20 P (95. X i 110) i=1") Math 66/566 - Midterm Solutions NOTE: These solutions are for both the 66 and 566 exam. The problems are the same until questions and 5. 1. The moment generating function of a random variable X is M(t)
Math 66/566 - Midterm Solutions NOTE: These solutions are for both the 66 and 566 exam. The problems are the same until questions and 5. 1. The moment generating function of a random variable X is M(t)
[ z = 1.48 ; accept H 0 ]
![[ z = 1.48 ; accept H 0 ]](/thumbs/75/71513647.jpg "[ z = 1.48 ; accept H 0 ]") CH 13 TESTING OF HYPOTHESIS EXAMPLES Example 13.1 Indicate the type of errors committed in the following cases: (i) H 0 : µ = 500; H 1 : µ 500. H 0 is rejected while H 0 is true (ii) H 0 : µ = 500; H 1
CH 13 TESTING OF HYPOTHESIS EXAMPLES Example 13.1 Indicate the type of errors committed in the following cases: (i) H 0 : µ = 500; H 1 : µ 500. H 0 is rejected while H 0 is true (ii) H 0 : µ = 500; H 1
MATH 360. Probablity Final Examination December 21, 2011 (2:00 pm - 5:00 pm)
") Name: MATH 360. Probablity Final Examination December 21, 2011 (2:00 pm - 5:00 pm) Instructions: The total score is 200 points. There are ten problems. Point values per problem are shown besides the questions.
Name: MATH 360. Probablity Final Examination December 21, 2011 (2:00 pm - 5:00 pm) Instructions: The total score is 200 points. There are ten problems. Point values per problem are shown besides the questions.
STAT100 Elementary Statistics and Probability
 STAT100 Elementary Statistics and Probability Exam, Sample Test, Summer 014 Solution Show all work clearly and in order, and circle your final answers. Justify your answers algebraically whenever possible.
INTERVAL ESTIMATION AND HYPOTHESES TESTING
 INTERVAL ESTIMATION AND HYPOTHESES TESTING 1. IDEA An interval rather than a point estimate is often of interest. Confidence intervals are thus important in empirical work. To construct interval estimates,
STA 584 Supplementary Examples (not to be graded) Fall, 2003
 Fall, 2003") Page 1 of 8 Central Michigan University Department of Mathematics STA 584 Supplementary Examples (not to be graded) Fall, 003 1. (a) If A and B are independent events, P(A) =.40 and P(B) =.70, find (i)
Page 1 of 8 Central Michigan University Department of Mathematics STA 584 Supplementary Examples (not to be graded) Fall, 003 1. (a) If A and B are independent events, P(A) =.40 and P(B) =.70, find (i)
EXAM 3 Math 1342 Elementary Statistics 6-7
 EXAM 3 Math 1342 Elementary Statistics 6-7 Name Date ********************************************************************************************************************************************** MULTIPLE
UNIVERSITY OF TORONTO Faculty of Arts and Science
 UNIVERSITY OF TORONTO Faculty of Arts and Science December 2013 Final Examination STA442H1F/2101HF Methods of Applied Statistics Jerry Brunner Duration - 3 hours Aids: Calculator Model(s): Any calculator
Mathematical statistics
 November 15 th, 2018 Lecture 21: The two-sample t-test Overview Week 1 Week 2 Week 4 Week 7 Week 10 Week 14 Probability reviews Chapter 6: Statistics and Sampling Distributions Chapter 7: Point Estimation
Institute of Actuaries of India
 Institute of Actuaries of India Subject CT3 Probability & Mathematical Statistics May 2011 Examinations INDICATIVE SOLUTION Introduction The indicative solution has been written by the Examiners with the
Hypotheses Test Procedures. Is the claim wrong?
 Hypotheses Test Procedures MATH 2300 Sections 9.1 and 9.2 Is the claim wrong? An oil company representative claims that the average price for gasoline in Lubbock is $2.30 per gallon. You think the average
Salt Lake Community College MATH 1040 Final Exam Fall Semester 2011 Form E
 Salt Lake Community College MATH 1040 Final Exam Fall Semester 011 Form E Name Instructor Time Limit: 10 minutes Any hand-held calculator may be used. Computers, cell phones, or other communication devices
Lecture 6: The Normal distribution
 Lecture 6: The Normal distribution 18th of November 2015 Lecture 6: The Normal distribution 18th of November 2015 1 / 29 Continous data In previous lectures we have considered discrete datasets and discrete
Will Landau. Feb 28, 2013
 Iowa State University The F Feb 28, 2013 Iowa State University Feb 28, 2013 1 / 46 Outline The F The F Iowa State University Feb 28, 2013 2 / 46 The normal (Gaussian) distribution A random variable X is
79 Wyner Math Academy I Spring 2016
 79 Wyner Math Academy I Spring 2016 CHAPTER NINE: HYPOTHESIS TESTING Review May 11 Test May 17 Research requires an understanding of underlying mathematical distributions as well as of the research methods
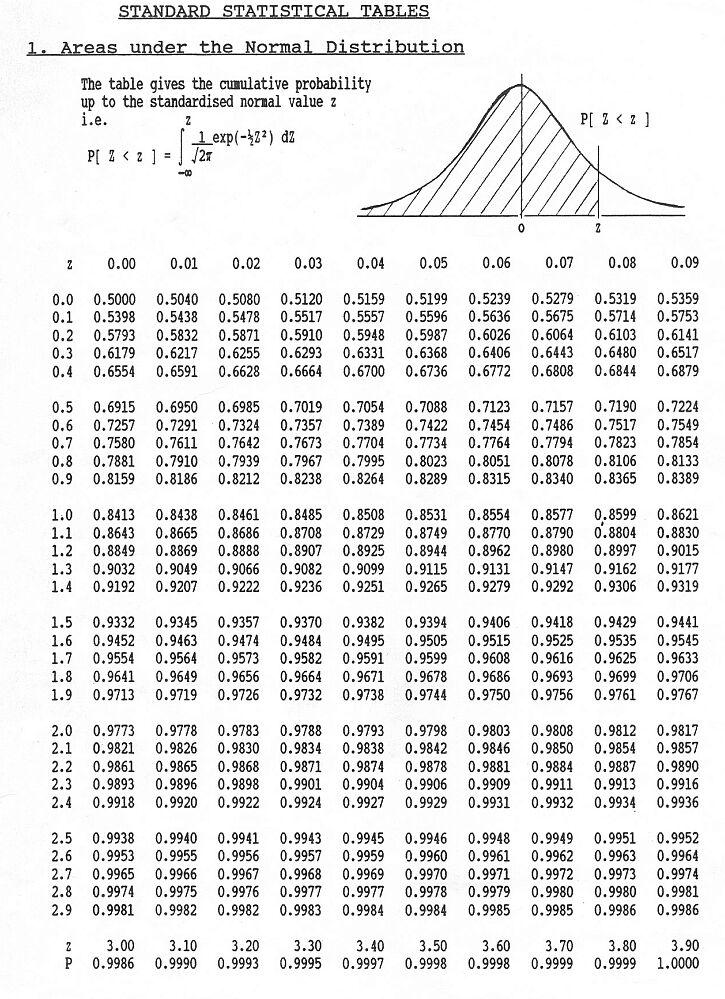
Table of z values and probabilities for the standard normal distribution. z is the first column plus the top row. Each cell shows P(X z).
.") Table of z values and probabilities for the standard normal distribution. z is the first column plus the top row. Each cell shows P(X z). For example P(X.04) =.8508. For z < 0 subtract the value from,
Table of z values and probabilities for the standard normal distribution. z is the first column plus the top row. Each cell shows P(X z). For example P(X.04) =.8508. For z < 0 subtract the value from,
hypotheses. P-value Test for a 2 Sample z-test (Large Independent Samples) n > 30 P-value Test for a 2 Sample t-test (Small Samples) n < 30 Identify α
 n > 30 P-value Test for a 2 Sample t-test (Small Samples) n < 30 Identify α") Chapter 8 Notes Section 8-1 Independent and Dependent Samples Independent samples have no relation to each other. An example would be comparing the costs of vacationing in Florida to the cost of vacationing
Chapter 8 Notes Section 8-1 Independent and Dependent Samples Independent samples have no relation to each other. An example would be comparing the costs of vacationing in Florida to the cost of vacationing
Notes for Math 324, Part 17
 126 Notes for Math 324, Part 17 Chapter 17 Common discrete distributions 17.1 Binomial Consider an experiment consisting by a series of trials. The only possible outcomes of the trials are success and
Exam III #1 Solutions
 Department of Mathematics University of Notre Dame Math 10120 Finite Math Fall 2017 Name: Instructors: Basit & Migliore Exam III #1 Solutions November 14, 2017 This exam is in two parts on 11 pages and
BNAD 276 Lecture 5 Discrete Probability Distributions Exercises 1 11
 1 / 15 BNAD 276 Lecture 5 Discrete Probability Distributions 1 11 Phuong Ho May 14, 2017 Exercise 1 Suppose we have the probability distribution for the random variable X as follows. X f (x) 20.20 25.15
Example continued. Math 425 Intro to Probability Lecture 37. Example continued. Example
 continued : Coin tossing Math 425 Intro to Probability Lecture 37 Kenneth Harris kaharri@umich.edu Department of Mathematics University of Michigan April 8, 2009 Consider a Bernoulli trials process with
MAT 2379, Introduction to Biostatistics, Sample Calculator Questions 1. MAT 2379, Introduction to Biostatistics
 MAT 2379, Introduction to Biostatistics, Sample Calculator Questions 1 MAT 2379, Introduction to Biostatistics Sample Calculator Problems for the Final Exam Note: The exam will also contain some problems
Math 1040 Final Exam Form A Introduction to Statistics Fall Semester 2010
 Math 1040 Final Exam Form A Introduction to Statistics Fall Semester 2010 Instructor Name Time Limit: 120 minutes Any calculator is okay. Necessary tables and formulas are attached to the back of the exam.
Teaching S1/S2 statistics using graphing technology
 Teaching S1/S2 statistics using graphing technology CALCULATOR HINTS FOR S1 & 2 STATISTICS - STAT MENU (2) on Casio. It is advised that mean and standard deviation are obtained directly from a calculator.
Exam 2 (KEY) July 20, 2009
 July 20, 2009") STAT 2300 Business Statistics/Summer 2009, Section 002 Exam 2 (KEY) July 20, 2009 Name: USU A#: Score: /225 Directions: This exam consists of six (6) questions, assessing material learned within Modules
STAT 2300 Business Statistics/Summer 2009, Section 002 Exam 2 (KEY) July 20, 2009 Name: USU A#: Score: /225 Directions: This exam consists of six (6) questions, assessing material learned within Modules
2.57 when the critical value is 1.96, what decision should be made?
 Math 1342 Ch. 9-10 Review Name SHORT ANSWER. Write the word or phrase that best completes each statement or answers the question. 9.1 1) If the test value for the difference between the means of two large
Chapter 9 Inferences from Two Samples
 Chapter 9 Inferences from Two Samples 9-1 Review and Preview 9-2 Two Proportions 9-3 Two Means: Independent Samples 9-4 Two Dependent Samples (Matched Pairs) 9-5 Two Variances or Standard Deviations Review
" M A #M B. Standard deviation of the population (Greek lowercase letter sigma) σ 2
 σ 2") Notation and Equations for Final Exam Symbol Definition X The variable we measure in a scientific study n The size of the sample N The size of the population M The mean of the sample µ The mean of the
Notation and Equations for Final Exam Symbol Definition X The variable we measure in a scientific study n The size of the sample N The size of the population M The mean of the sample µ The mean of the
2. A music library has 200 songs. How many 5 song playlists can be constructed in which the order of the songs matters?
 Practice roblems for final exam 1. A certain vault requires that an entry code be 8 characters. If the first 4 characters must be letters (repeated letters are allowed) and the last 4 characters are numeric
Final Exam Review (Math 1342)
") Final Exam Review (Math 1342) 1) 5.5 5.7 5.8 5.9 6.1 6.1 6.3 6.4 6.5 6.6 6.7 6.7 6.7 6.9 7.0 7.0 7.0 7.1 7.2 7.2 7.4 7.5 7.7 7.7 7.8 8.0 8.1 8.1 8.3 8.7 Min = 5.5 Q 1 = 25th percentile = middle of first
Final Exam Review (Math 1342) 1) 5.5 5.7 5.8 5.9 6.1 6.1 6.3 6.4 6.5 6.6 6.7 6.7 6.7 6.9 7.0 7.0 7.0 7.1 7.2 7.2 7.4 7.5 7.7 7.7 7.8 8.0 8.1 8.1 8.3 8.7 Min = 5.5 Q 1 = 25th percentile = middle of first
Problem Set 4 - Solutions
 Problem Set 4 - Solutions Econ-310, Spring 004 8. a. If we wish to test the research hypothesis that the mean GHQ score for all unemployed men exceeds 10, we test: H 0 : µ 10 H a : µ > 10 This is a one-tailed
1 Binomial Probability [15 points]
![1 Binomial Probability [15 points]](/thumbs/80/81467318.jpg "1 Binomial Probability [15 points]") Economics 250 Assignment 2 (Due November 13, 2017, in class) i) You should do the assignment on your own, Not group work! ii) Submit the completed work in class on the due date. iii) Remember to include
Economics 250 Assignment 2 (Due November 13, 2017, in class) i) You should do the assignment on your own, Not group work! ii) Submit the completed work in class on the due date. iii) Remember to include
Econ 325: Introduction to Empirical Economics
 Econ 325: Introduction to Empirical Economics Lecture 6 Sampling and Sampling Distributions Ch. 6-1 Populations and Samples A Population is the set of all items or individuals of interest Examples: All
1 One- and Two-Sample Estimation
 1 One- and Two-Sample Estimation Problems 1.1 Introduction In previous chapters, we emphasized sampling properties of the sample mean and variance. The purpose of these presentations is to build a foundation
STAT 4385 Topic 01: Introduction & Review
 STAT 4385 Topic 01: Introduction & Review Xiaogang Su, Ph.D. Department of Mathematical Science University of Texas at El Paso xsu@utep.edu Spring, 2016 Outline Welcome What is Regression Analysis? Basics
Inference for Distributions Inference for the Mean of a Population
 Inference for Distributions Inference for the Mean of a Population PBS Chapter 7.1 009 W.H Freeman and Company Objectives (PBS Chapter 7.1) Inference for the mean of a population The t distributions The
Semester , Example Exam 1
 Semester 1 2017, Example Exam 1 1 of 10 Instructions The exam consists of 4 questions, 1-4. Each question has four items, a-d. Within each question: Item (a) carries a weight of 8 marks. Item (b) carries
18.05 Final Exam. Good luck! Name. No calculators. Number of problems 16 concept questions, 16 problems, 21 pages
 Name No calculators. 18.05 Final Exam Number of problems 16 concept questions, 16 problems, 21 pages Extra paper If you need more space we will provide some blank paper. Indicate clearly that your solution
MATH c UNIVERSITY OF LEEDS Examination for the Module MATH1725 (May-June 2009) INTRODUCTION TO STATISTICS. Time allowed: 2 hours
 INTRODUCTION TO STATISTICS. Time allowed: 2 hours") 01 This question paper consists of 11 printed pages, each of which is identified by the reference. Only approved basic scientific calculators may be used. Statistical tables are provided at the end of
01 This question paper consists of 11 printed pages, each of which is identified by the reference. Only approved basic scientific calculators may be used. Statistical tables are provided at the end of
Chapter 24. Comparing Means
 Chapter 4 Comparing Means!1 /34 Homework p579, 5, 7, 8, 10, 11, 17, 31, 3! /34 !3 /34 Objective Students test null and alternate hypothesis about two!4 /34 Plot the Data The intuitive display for comparing
LECTURE NOTES. INTSTA2 Introductory Statistics 2. Francis Joseph H. Campeña, De La Salle University Manila
 LECTURE NOTES INTSTA Introductory Statistics Francis Joseph H. Campeña, De La Salle University Manila Contents 1 Normal Distribution 1.1 Normal Distribution....................... Sampling and Sampling
Estimating a Population Mean
 Estimating a Population Mean MATH 130, Elements of Statistics I J. Robert Buchanan Department of Mathematics Fall 2017 Objectives At the end of this lesson we will be able to: obtain a point estimate for
Question Points Score Total: 137
 Math 447 Test 1 SOLUTIONS Fall 2015 No books, no notes, only SOA-approved calculators. true/false or fill-in-the-blank question. You must show work, unless the question is a Name: Section: Question Points
Chapter 20 Comparing Groups
 Chapter 20 Comparing Groups Comparing Proportions Example Researchers want to test the effect of a new anti-anxiety medication. In clinical testing, 64 of 200 people taking the medicine reported symptoms
Math 2000 Practice Final Exam: Homework problems to review. Problem numbers
 Math 2000 Practice Final Exam: Homework problems to review Pages: Problem numbers 52 20 65 1 181 14 189 23, 30 245 56 256 13 280 4, 15 301 21 315 18 379 14 388 13 441 13 450 10 461 1 553 13, 16 561 13,
4 Hypothesis testing. 4.1 Types of hypothesis and types of error 4 HYPOTHESIS TESTING 49
 4 HYPOTHESIS TESTING 49 4 Hypothesis testing In sections 2 and 3 we considered the problem of estimating a single parameter of interest, θ. In this section we consider the related problem of testing whether
AMS7: WEEK 7. CLASS 1. More on Hypothesis Testing Monday May 11th, 2015
 AMS7: WEEK 7. CLASS 1 More on Hypothesis Testing Monday May 11th, 2015 Testing a Claim about a Standard Deviation or a Variance We want to test claims about or 2 Example: Newborn babies from mothers taking
Introduction to Statistical Data Analysis Lecture 3: Probability Distributions
 Introduction to Statistical Data Analysis Lecture 3: Probability Distributions James V. Lambers Department of Mathematics The University of Southern Mississippi James V. Lambers Statistical Data Analysis
Content by Week Week of October 14 27
 Content by Week Week of October 14 27 Learning objectives By the end of this week, you should be able to: Understand the purpose and interpretation of confidence intervals for the mean, Calculate confidence
Closed book and notes. 60 minutes. Cover page and four pages of exam. No calculators.
 IE 230 Seat # Closed book and notes. 60 minutes. Cover page and four pages of exam. No calculators. Score Exam #3a, Spring 2002 Schmeiser Closed book and notes. 60 minutes. 1. True or false. (for each,
1. Let X be a random variable with probability density function. 1 x < f(x) = 0 otherwise
 = 0 otherwise") Name M36K Final. Let X be a random variable with probability density function { /x x < f(x = 0 otherwise Compute the following. You can leave your answers in integral form. (a ( points Find F X (t = P
Name M36K Final. Let X be a random variable with probability density function { /x x < f(x = 0 otherwise Compute the following. You can leave your answers in integral form. (a ( points Find F X (t = P
The t-distribution. Patrick Breheny. October 13. z tests The χ 2 -distribution The t-distribution Summary
 Patrick Breheny October 13 Patrick Breheny Biostatistical Methods I (BIOS 5710) 1/25 Introduction Introduction What s wrong with z-tests? So far we ve (thoroughly!) discussed how to carry out hypothesis
Brandon C. Kelly (Harvard Smithsonian Center for Astrophysics)
") Brandon C. Kelly (Harvard Smithsonian Center for Astrophysics) Probability quantifies randomness and uncertainty How do I estimate the normalization and logarithmic slope of a X ray continuum, assuming
Brandon C. Kelly (Harvard Smithsonian Center for Astrophysics) Probability quantifies randomness and uncertainty How do I estimate the normalization and logarithmic slope of a X ray continuum, assuming
LECTURE 12 CONFIDENCE INTERVAL AND HYPOTHESIS TESTING
 LECTURE 1 CONFIDENCE INTERVAL AND HYPOTHESIS TESTING INTERVAL ESTIMATION Point estimation of : The inference is a guess of a single value as the value of. No accuracy associated with it. Interval estimation
MAT 2377C FINAL EXAM PRACTICE
 Department of Mathematics and Statistics University of Ottawa MAT 2377C FINAL EXAM PRACTICE 10 December 2015 Professor: Rafal Kulik Time: 180 minutes Student Number: Family Name: First Name: This is a
ST430 Exam 1 with Answers
 ST430 Exam 1 with Answers Date: October 5, 2015 Name: Guideline: You may use one-page (front and back of a standard A4 paper) of notes. No laptop or textook are permitted but you may use a calculator.
Chapter 6 ESTIMATION OF PARAMETERS
 Chapter 6 ESTIMATION OF PARAMETERS Recall that one of the objectives of statistics is to make inferences concerning a population. And these inferences are based only in partial information regarding the
Confidence Intervals for the Sample Mean
 Confidence Intervals for the Sample Mean As we saw before, parameter estimators are themselves random variables. If we are going to make decisions based on these uncertain estimators, we would benefit
SMAM 314 Practice Final Examination Winter 2003
 SMAM 314 Practice Final Examination Winter 2003 You may use your textbook, one page of notes and a calculator. Please hand in the notes with your exam. 1. Mark the following statements True T or False
Chapter 6: SAMPLING DISTRIBUTIONS
 Chapter 6: SAMPLING DISTRIBUTIONS Read Section 1.5 Graphical methods may not always be sufficient for describing data. Numerical measures can be created for both populations and samples. Definition A numerical
Chapitre 3. 5: Several Useful Discrete Distributions
 Chapitre 3 5: Several Useful Discrete Distributions 5.3 The random variable x is not a binomial random variable since the balls are selected without replacement. For this reason, the probability p of choosing
Probability Distributions
 Department of Statistics The University of Auckland https://www.stat.auckland.ac.nz/ brewer/ Suppose a quantity X might be 1, 2, 3, 4, or 5, and we assign probabilities of 1 5 to each of those possible
Math 101: Elementary Statistics Tests of Hypothesis
 Tests of Hypothesis Department of Mathematics and Computer Science University of the Philippines Baguio November 15, 2018 Basic Concepts of Statistical Hypothesis Testing A statistical hypothesis is an
Interval estimation. October 3, Basic ideas CLT and CI CI for a population mean CI for a population proportion CI for a Normal mean
 Interval estimation October 3, 2018 STAT 151 Class 7 Slide 1 Pandemic data Treatment outcome, X, from n = 100 patients in a pandemic: 1 = recovered and 0 = not recovered 1 1 1 0 0 0 1 1 1 0 0 1 0 1 0 0
18.05 Practice Final Exam
 No calculators. 18.05 Practice Final Exam Number of problems 16 concept questions, 16 problems. Simplifying expressions Unless asked to explicitly, you don t need to simplify complicated expressions. For
Class 26: review for final exam 18.05, Spring 2014
 Probability Class 26: review for final eam 8.05, Spring 204 Counting Sets Inclusion-eclusion principle Rule of product (multiplication rule) Permutation and combinations Basics Outcome, sample space, event
1; (f) H 0 : = 55 db, H 1 : < 55.
 H 0 : = 55 db, H 1 : < 55.") Reference: Chapter 8 of J. L. Devore s 8 th Edition By S. Maghsoodloo TESTING a STATISTICAL HYPOTHESIS A statistical hypothesis is an assumption about the frequency function(s) (i.e., pmf or pdf) of one
Reference: Chapter 8 of J. L. Devore s 8 th Edition By S. Maghsoodloo TESTING a STATISTICAL HYPOTHESIS A statistical hypothesis is an assumption about the frequency function(s) (i.e., pmf or pdf) of one
One- and Two-Sample Tests of Hypotheses
 One- and Two-Sample Tests of Hypotheses 1- Introduction and Definitions Often, the problem confronting the scientist or engineer is producing a conclusion about some scientific system. For example, a medical
Exercise I.1 I.2 I.3 I.4 II.1 II.2 III.1 III.2 III.3 IV.1 Question (1) (2) (3) (4) (5) (6) (7) (8) (9) (10) Answer
 (2) (3) (4) (5) (6) (7) (8) (9) (10) Answer") Solutions to Exam in 02402 December 2012 Exercise I.1 I.2 I.3 I.4 II.1 II.2 III.1 III.2 III.3 IV.1 Question (1) (2) (3) (4) (5) (6) (7) (8) (9) (10) Answer 3 1 5 2 5 2 3 5 1 3 Exercise IV.2 IV.3 IV.4 V.1
Solutions to Exam in 02402 December 2012 Exercise I.1 I.2 I.3 I.4 II.1 II.2 III.1 III.2 III.3 IV.1 Question (1) (2) (3) (4) (5) (6) (7) (8) (9) (10) Answer 3 1 5 2 5 2 3 5 1 3 Exercise IV.2 IV.3 IV.4 V.1
Introduction to Statistics
 MTH4106 Introduction to Statistics Notes 15 Spring 2013 Testing hypotheses about the mean Earlier, we saw how to test hypotheses about a proportion, using properties of the Binomial distribution It is
Introduction to Probability
 LECTURE NOTES Course 6.041-6.431 M.I.T. FALL 2000 Introduction to Probability Dimitri P. Bertsekas and John N. Tsitsiklis Professors of Electrical Engineering and Computer Science Massachusetts Institute
Exam 3, Math Fall 2016 October 19, 2016
 Exam 3, Math 500- Fall 06 October 9, 06 This is a 50-minute exam. You may use your textbook, as well as a calculator, but your work must be completely yours. The exam is made of 5 questions in 5 pages,
Probability and Probability Distributions. Dr. Mohammed Alahmed
 Probability and Probability Distributions 1 Probability and Probability Distributions Usually we want to do more with data than just describing them! We might want to test certain specific inferences about
6 Single Sample Methods for a Location Parameter
 6 Single Sample Methods for a Location Parameter If there are serious departures from parametric test assumptions (e.g., normality or symmetry), nonparametric tests on a measure of central tendency (usually
Ch. 7. One sample hypothesis tests for µ and σ
 Ch. 7. One sample hypothesis tests for µ and σ Prof. Tesler Math 18 Winter 2019 Prof. Tesler Ch. 7: One sample hypoth. tests for µ, σ Math 18 / Winter 2019 1 / 23 Introduction Data Consider the SAT math
STAT FINAL EXAM
 STAT101 2013 FINAL EXAM This exam is 2 hours long. It is closed book but you can use an A-4 size cheat sheet. There are 10 questions. Questions are not of equal weight. You may need a calculator for some
T test for two Independent Samples. Raja, BSc.N, DCHN, RN Nursing Instructor Acknowledgement: Ms. Saima Hirani June 07, 2016
 T test for two Independent Samples Raja, BSc.N, DCHN, RN Nursing Instructor Acknowledgement: Ms. Saima Hirani June 07, 2016 Q1. The mean serum creatinine level is measured in 36 patients after they received
CIVL /8904 T R A F F I C F L O W T H E O R Y L E C T U R E - 8
 CIVL - 7904/8904 T R A F F I C F L O W T H E O R Y L E C T U R E - 8 Chi-square Test How to determine the interval from a continuous distribution I = Range 1 + 3.322(logN) I-> Range of the class interval
exp{ (x i) 2 i=1 n i=1 (x i a) 2 (x i ) 2 = exp{ i=1 n i=1 n 2ax i a 2 i=1
 2 i=1 n i=1 (x i a) 2 (x i ) 2 = exp{ i=1 n i=1 n 2ax i a 2 i=1") 4 Hypothesis testing 4. Simple hypotheses A computer tries to distinguish between two sources of signals. Both sources emit independent signals with normally distributed intensity, the signals of the first
4 Hypothesis testing 4. Simple hypotheses A computer tries to distinguish between two sources of signals. Both sources emit independent signals with normally distributed intensity, the signals of the first
HYPOTHESIS TESTING: SINGLE MEAN, NORMAL DISTRIBUTION (Z-TEST)
") HYPOTHESIS TESTING: SINGLE MEAN, NORMAL DISTRIBUTION (Z-TEST) In Binomial Hypothesis Testing researchers generally ignore the actual numbers that are obtained on their measure. The Binomial Test for whether
HYPOTHESIS TESTING: SINGLE MEAN, NORMAL DISTRIBUTION (Z-TEST) In Binomial Hypothesis Testing researchers generally ignore the actual numbers that are obtained on their measure. The Binomial Test for whether
41.2. Tests Concerning a Single Sample. Introduction. Prerequisites. Learning Outcomes
 Tests Concerning a Single Sample 41.2 Introduction This Section introduces you to the basic ideas of hypothesis testing in a non-mathematical way by using a problem solving approach to highlight the concepts
Chapter 5: HYPOTHESIS TESTING
 MATH411: Applied Statistics Dr. YU, Chi Wai Chapter 5: HYPOTHESIS TESTING 1 WHAT IS HYPOTHESIS TESTING? As its name indicates, it is about a test of hypothesis. To be more precise, we would first translate
Each trial has only two possible outcomes success and failure. The possible outcomes are exactly the same for each trial.
 Section 8.6: Bernoulli Experiments and Binomial Distribution We have already learned how to solve problems such as if a person randomly guesses the answers to 10 multiple choice questions, what is the
CBA4 is live in practice mode this week exam mode from Saturday!
 Announcements CBA4 is live in practice mode this week exam mode from Saturday! Material covered: Confidence intervals (both cases) 1 sample hypothesis tests (both cases) Hypothesis tests for 2 means as
STA 101 Final Review
 STA 101 Final Review Statistics 101 Thomas Leininger June 24, 2013 Announcements All work (besides projects) should be returned to you and should be entered on Sakai. Office Hour: 2 3pm today (Old Chem
Lecture 8 Sampling Theory
 Lecture 8 Sampling Theory Thais Paiva STA 111 - Summer 2013 Term II July 11, 2013 1 / 25 Thais Paiva STA 111 - Summer 2013 Term II Lecture 8, 07/11/2013 Lecture Plan 1 Sampling Distributions 2 Law of Large
1) What is the probability that the random variable has a value less than 3? 1)
 What is the probability that the random variable has a value less than 3? 1)") Ch 6 and 7 Worksheet Disclaimer; The actual exam differs NOTE: ON THIS TEST YOU WILL NEED TO USE TABLES (NOT YOUR CALCULATOR) TO FIND PROBABILITIES UNDER THE NORMAL OR CHI SQUARED OR T DISTRIBUTION! SHORT
Ch 6 and 7 Worksheet Disclaimer; The actual exam differs NOTE: ON THIS TEST YOU WILL NEED TO USE TABLES (NOT YOUR CALCULATOR) TO FIND PROBABILITIES UNDER THE NORMAL OR CHI SQUARED OR T DISTRIBUTION! SHORT
Quantitative Analysis and Empirical Methods
 Hypothesis testing Sciences Po, Paris, CEE / LIEPP Introduction Hypotheses Procedure of hypothesis testing Two-tailed and one-tailed tests Statistical tests with categorical variables A hypothesis A testable