Eric Shou Stat 598B / CSE 598D METHODS FOR MICRODATA PROTECTION
|
|
|
- Phillip Carson
- 6 years ago
- Views:
Transcription
1 Eric Shou Stat 598B / CSE 598D METHODS FOR MICRODATA PROTECTION
2 INTRODUCTION Statistical disclosure control part of preparations for disseminating microdata. Data perturbation techniques: Methods assuring anonymity during interview (e.g. Randomized response) Methods part of editing process (e.g. Resampling, suppression (blanking), imputation, data-swapping, noise addition) Methods differ in terms of level of protection and usefulness.
3 INTRODUCTION
4 OUTLINE Blanking Description of Method Problems Noise Addition Three methods Problems Simex Explanation of method Combination of Blanking and Noise Addition Description of method Monte Carlo Experiment
5 BLANKING Previous uses: Cells were suppressed because they would lead to identity disclosure if released based on external information (e.g. Bill Gates income) Low counts in contingency tables, tabular data. K-anonymity: If a quasi-identifier does not occur k times, it is suppressed.
6 BLANKING Protection method: 1. Create blank data set by removing observations lying outside critical quantile range. 2. Compute corresponding conditional probabilities. 3. Provide researcher with blanked data set and conditional probabilities.
7 BLANKING Conditional Probability: Y i is the value of variable Y at observation i. D i = i P(D yi = 1 Y i ) = i P(q θl 1 n i θu 1 n P(D yi = 1 Y i ) = Given a value Yi, the probability that it will be included in the data set
8
9 Conditional probability: P(D yi =1 Y i )
10 EXAMPLE Percent Body Fat Weight Height
11 EXAMPLE Percent Body Fat Weight Height Observations between the 10 th and 90 th percentiles are kept in the dataset.
12 PROBLEMS Blanking only protects specific observations. What if an attacker with external information wants to learn specific information about someone in the data set whose information is not blanked? Blanked data set not useful if researcher is concerned with tails of the data. E.g. Researcher wants to look at income of families below the poverty level, but most of the incomes are blanked. Difficulty estimating true parameter values Illustrated using M-estimation. M-estimation method where statistics are obtained as the solution to the problem of minimizing the sum of a certain function of the data (Wikipedia).
13 M-ESTIMATION SETUP Consider the condition expectation function: E[Y i X i ] = μ(x i, θ 0 ), θ 0 is true k x 1 parameter vector Example: In the linear regression model, μ(x i, θ 0 ) = X i β 0 Let Z i = (Y i, X i ) = Y i X 1 : X n q(z i, θ) be an objective function to be minimized. Example: In linear regression, Y i is the response variable, and X i is the set of predictors. Want to find β such that the squared distance between the Y and Y-hat is minimized, so q(z i, θ) = (Y i X i β) 2, with θ β. Let dummy variable D i =
14 M-ESTIMATION Unblanked Blanked θ 0 (i.e. β) E[q(Z i, θ)] E[D i q(z i, θ)] M-estimator of θ 0 (i.e. ) n -1 q(z i, θ) n -1 D i q(z i, θ) Parameter and M-estimator not the same for unblanked and blanked dataset unless assumption is made. Missing at Random (MAR) Assumption: Assume missing data mechanism is ignorable: Z i D i W i means independence W i is the vector of covariates at observation i. Explanation: Missing values are not randomly distributed across all observations but are randomly distributed within one or more subsamples Reasonable Assumption?
15 M-ESTIMATION Based on MAR assumption, weight observed moment function by inverse of the individual probability of not being blanked given the vector of covariates Inverse Probability Weighting (IPW) (Horvitz, Wooldridge) E D i q(zi, θ 0 ) P(D i = 1 W i ) = E [ q(zi, θ 0 ) ] Thus, weighted M-estimator is the solution for: n-1 D i q(zi, θ 0 ) / P(D i = 1 W i )
16 NOISE ADDITION Method of data perturbation Three algorithms Adding Noise Adding Noise and Linear Transformations (Kim) Adding Noise and Nonlinear Transformations (Sullivan)
17 ADDING NOISE Vector of a variable, x j ~ (μ j, σ j2 ) Create perturbed vector, z j = x j + ε j εj is the noise εj ~ N(0, σ εj2 ) Cov(ε t, ε l ) = 0 for all t l Cov(x t, ε j ) = 0 for all t, l
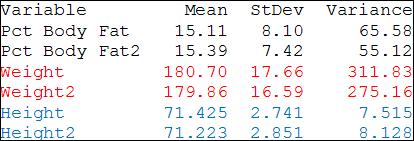
18 EXAMPLE Percent Body Fat Weight Height
19 EXAMPLE Pct Body Fat Noise (var=9) Pct Body Fat2 Weight Noise (var=25) Weight2 Height Noise (var=2) Height
20 PROBLEMS Poor protection for extreme values. Perturbed values might not make sense (e.g. values that are negative). Distribution of masked variables not known if original variable is not normally distributed. Sample variances of masked data are asymptotically biased estimators of variances of original. Sample correlations are also biased. An estimator is biased if the expected value of the estimator is different from the value of the true parameter it is estimating.
21 BIAS DUE TO ADDING NOISE General assumption is that variance, ε j is proportional to variance of original (Spruill, Sullivan, Tendick). Variance ε2 = x 2 α is a positive constant varying amount of noise z 2 = x 2 + ε 2 = x 2 + x 2 = (1 + x 2 Correlation between 2 variables zi, zj ρ zi,zj = Cov(z i, z j ) / (V(z i )V(z j ) = (1 / 1+ ) Cov(x i, x j ) / (V(x i )V(x j )) = (1 / 1+ ρ xi,xj
22 BIAS DUE TO ADDING NOISE General assumption is that variance, ε j is proportional to variance of original (Spruill, Sullivan, Tendick). Variance ε2 = x 2 α is a positive constant varying amount of noise z 2 = x 2 + ε 2 = x 2 + x 2 = (1 + x 2 Correlation between 2 variables zi, zj ρ zi,zj = Cov(z i, z j ) / (V(z i )V(z j ) = (1 / 1+ ) Cov(x i, x j ) / (V(x i )V(x j )) = (1 / 1+ ρ xi,xj
23 EXAMPLE
24 ADDING NOISE & LINEAR TRANSFORMATION z j = x j + ε j, j = 1,, p g j = cz j + id j g j is masked and transformed variable i is a vector of ones c is a constant d j differs between variables Given restrictions E(g j ) = E(z j ) and V(g j ) = V(x j ), d j = (1-c)E(x j ) (Kim)
25 ADDING NOISE & LINEAR TRANSFORMATION Two possible transformations for g j = cz j + id j 1. g j,1 = cz j + (1 - c) c = [(n-1) / (n(1+α) - 1)] 2. g j,2 = cz j + (1 - c) c = [(n-1-α) / ((n-1)(1+α))] =
26 ADDING NOISE & LINEAR TRANSFORMATION Suitable for continuous variables only. Preserves expected values and covariances due to restriction for determining c. Univariate distribution not preserved, unless original variables are normally distributed to begin with.
27 ADDING NOISE & NONLINEAR TRANSFORMATION Can be used for continuous and discrete data. Univariate distributions are approximately sustained.

). 4. Add noise to standard normal variable.")
28 ADDING NOISE & NONLINEAR TRANSFORMATION 1. Calculate empirical distribution function for every variable. 2. Smooth empirical distribution function. Use moving average. 3. Convert smoothed function into a uniform random variable and then convert uniform random variable into a standard normal random variable. Use quantile function (inverse of cumulative density function (cdf)). 4. Add noise to standard normal variable. Mask similar to method of adding noise and linear transformation. 5. Back-transform to values of distribution function. 6. Back-transform to original scale.
29 PROBLEMS Procedures following the transformation and noise addition are needed to correct for differences in correlation (usually when observed variables are not normally distributed). Not same level of protection due to corrections. Variances of continuous variables larger than those of original variables due to transformations.
30 NOISE ADDITION & BLANKING More disclosure limitation Observations with high original values, which are not protected well by noise addition, are protected by data blanking.
31

32
33 NOISE ADDITION & BLANKING Problem with blanking: Not all observations are protected. Problem corrected with noise addition because this method perturbs all data. Problem with noise addition: Extreme outliers not protected well. Problem corrected with blanking because extreme outliers will be suppressed.
34 NOISE ADDITION & BLANKING 1. Add independent noise to sensitive variables. 2. Create blanked data set from masked data by removing observations outside critical quantile range. 3. Compute corresponding conditional probabilities. 4. Provide researcher with blanked data set, the conditional probabilities, and variance of measurement term μ i.
35 SIMEX SIMEX (Simulation Extrapolation) is a procedure that uses simulation to estimate parameters (e.g. in linear regression, use SIMEX to estimate β).
36 SIMEX Consider linear regression model with response y and predictor x. i= 1,, n = 10 b = 1,, B = 2 u i,b ~ N(0, u 2 t = 1,, T=4 λ 0 = 0, λ 1 =.5, λ 2 = 1, λ 3 = 1.5, λ 4 = 2
37 SIMEX At each level of λ, create B=2 new datasets with X i,b (λ t ) = X i + (λ t )u i,b, response (weight) stays the same in each dataset. Calculate β b for each data set For each level of λ, calculate β(λ t ) by taking the average of all β b. Now with a value of β for each level of λ, extrapolate to find value of β when λ t = -1. This is the unbiased estimate of β (Carroll).
38
39
40 MONTE CARLO EXPERIMENT Monte-Carlo methods that using stochastic techniques to simulate behavior of a system. Generate random data based on original distribution of variables. Used to simulate effect of blanking and noise addition on microdata. Simulate SIMEX approach to estimate the IPW M-estimators.
41 MONTE CARLO EXPERIMENT Used multivariate linear regression model: Y i = α + βx 1i + γx 2i + e i, i = 1, n ~ N(, ) Samples sizes of n=100 and n=1000 with R=1000 replicates. SIMEX approach: 0 = λ 0 < λ 1 =.5 < λ 2 =1 < λ 3 =1.5 < λ 4 =2 B=50 samples
42 FOUR DIFFERENT MONTE CARLO DESIGNS Variance of noise in blanking method Variance of measurement error (noise) in noise addition
43 DESIGN 1 σ u2.01, q θu.95 Root Mean Square Error: (MSE(θ hat)) = (E((θ hat θ 2 Relative Standard Error: Estimated SE/ True SE Estimates from original dataset Ordinary Least Squares Estimate (Bad Estimate) Estimates from SIMEX
44 DESIGN 2 σ u 2.01, q θu.90
45 DESIGN 3 σ u 2.5, q θu.95
46 DESIGN 4 σ u 2.5, q θu.90
47 MONTE CARLO EXPERIMENT RESULTS Bias and RMSE of estimates are reduced when compared to the naïve OLS-estimate. Estimated variances smaller than naïve estimates but larger than that of the original dataset. Bias and RMSE is larger when n=100 compared to when n=1000. More noise (> u 2 yields more biased estimates. Due to low RELSE for small sample sizes standard errors cannot be estimated precisely. RELSE gets worse when n=1000. Their explanation: not enough bootstrap replications.
48 COMMENTS Too much information given with conditional probabilities and variance of noise? Dataset still not useful if researcher is concerned with tails of the data. Protection from identity disclosure using quasiidentifiers and/or external information? Possible use of imputation with blanked data? Previously used for non-response. Any applications to categorical data? Where s proof that SIMEX method to the IPW-estimator can be applied to nonlinear models?
49 CONCLUSIONS Blanking protects against sensitive, but not all data. Noise protects all data to some extent, but small impact on outliers. Combination of both compensates for each others weaknesses. Apply SIMEX approach to IPW-estimator. Monte-Carlo experiments show bias of estimators small, but RELSE not that good. More research needs to be conducted.
50 REFERENCES Anton Flossmann and Sandra Lechner (2006). Combining Blanking and Noise Addition as a Data Disclosure Limitation Method. Privacy in Statistical Databases, Lecture Notes in Computer Science. Springer Berlin/Heidelberg, Vol pp R. Brand, Microdata protection through noise, in Inference Control in Statistical Databases. Ed. J. Domingo-Ferrer. Lecture Notes in Computer Science, Berlin: Springer, M-estimator. < 8 Nov Carroll, R.J., Ruppert, D. Stefanski, L.A.: Measurement Error in Nonlinear Models. Journal of the American Statistical Assosiciation, 89 (1994)
Monte Carlo Studies. The response in a Monte Carlo study is a random variable.
 Monte Carlo Studies The response in a Monte Carlo study is a random variable. The response in a Monte Carlo study has a variance that comes from the variance of the stochastic elements in the data-generating
A note on multiple imputation for general purpose estimation
 A note on multiple imputation for general purpose estimation Shu Yang Jae Kwang Kim SSC meeting June 16, 2015 Shu Yang, Jae Kwang Kim Multiple Imputation June 16, 2015 1 / 32 Introduction Basic Setup Assume
MA 575 Linear Models: Cedric E. Ginestet, Boston University Non-parametric Inference, Polynomial Regression Week 9, Lecture 2
 MA 575 Linear Models: Cedric E. Ginestet, Boston University Non-parametric Inference, Polynomial Regression Week 9, Lecture 2 1 Bootstrapped Bias and CIs Given a multiple regression model with mean and
Should Non-Sensitive Attributes be Masked? Data Quality Implications of Data Perturbation in Regression Analysis
 Should Non-Sensitive Attributes be Masked? Data Quality Implications of Data Perturbation in Regression Analysis Sumitra Mukherjee Nova Southeastern University sumitra@scis.nova.edu Abstract Ensuring the
Lecture 14 Simple Linear Regression
 Lecture 4 Simple Linear Regression Ordinary Least Squares (OLS) Consider the following simple linear regression model where, for each unit i, Y i is the dependent variable (response). X i is the independent
Fractional Imputation in Survey Sampling: A Comparative Review
 Fractional Imputation in Survey Sampling: A Comparative Review Shu Yang Jae-Kwang Kim Iowa State University Joint Statistical Meetings, August 2015 Outline Introduction Fractional imputation Features Numerical
Least Squares Estimation of a Panel Data Model with Multifactor Error Structure and Endogenous Covariates
 Least Squares Estimation of a Panel Data Model with Multifactor Error Structure and Endogenous Covariates Matthew Harding and Carlos Lamarche January 12, 2011 Abstract We propose a method for estimating
Data Integration for Big Data Analysis for finite population inference
 for Big Data Analysis for finite population inference Jae-kwang Kim ISU January 23, 2018 1 / 36 What is big data? 2 / 36 Data do not speak for themselves Knowledge Reproducibility Information Intepretation
ECO375 Tutorial 8 Instrumental Variables
 ECO375 Tutorial 8 Instrumental Variables Matt Tudball University of Toronto Mississauga November 16, 2017 Matt Tudball (University of Toronto) ECO375H5 November 16, 2017 1 / 22 Review: Endogeneity Instrumental
Chapter 5: Models used in conjunction with sampling. J. Kim, W. Fuller (ISU) Chapter 5: Models used in conjunction with sampling 1 / 70
 Chapter 5: Models used in conjunction with sampling 1 / 70") Chapter 5: Models used in conjunction with sampling J. Kim, W. Fuller (ISU) Chapter 5: Models used in conjunction with sampling 1 / 70 Nonresponse Unit Nonresponse: weight adjustment Item Nonresponse:
Chapter 5: Models used in conjunction with sampling J. Kim, W. Fuller (ISU) Chapter 5: Models used in conjunction with sampling 1 / 70 Nonresponse Unit Nonresponse: weight adjustment Item Nonresponse:
Causal Inference with a Continuous Treatment and Outcome: Alternative Estimators for Parametric Dose-Response Functions
 Causal Inference with a Continuous Treatment and Outcome: Alternative Estimators for Parametric Dose-Response Functions Joe Schafer Office of the Associate Director for Research and Methodology U.S. Census
Measurement error as missing data: the case of epidemiologic assays. Roderick J. Little
 Measurement error as missing data: the case of epidemiologic assays Roderick J. Little Outline Discuss two related calibration topics where classical methods are deficient (A) Limit of quantification methods
A Course in Applied Econometrics Lecture 18: Missing Data. Jeff Wooldridge IRP Lectures, UW Madison, August Linear model with IVs: y i x i u i,
 A Course in Applied Econometrics Lecture 18: Missing Data Jeff Wooldridge IRP Lectures, UW Madison, August 2008 1. When Can Missing Data be Ignored? 2. Inverse Probability Weighting 3. Imputation 4. Heckman-Type
COMPARISON OF GMM WITH SECOND-ORDER LEAST SQUARES ESTIMATION IN NONLINEAR MODELS. Abstract
 Far East J. Theo. Stat. 0() (006), 179-196 COMPARISON OF GMM WITH SECOND-ORDER LEAST SQUARES ESTIMATION IN NONLINEAR MODELS Department of Statistics University of Manitoba Winnipeg, Manitoba, Canada R3T
Statistics - Lecture One. Outline. Charlotte Wickham 1. Basic ideas about estimation
 Statistics - Lecture One Charlotte Wickham wickham@stat.berkeley.edu http://www.stat.berkeley.edu/~wickham/ Outline 1. Basic ideas about estimation 2. Method of Moments 3. Maximum Likelihood 4. Confidence
11. Bootstrap Methods
 11. Bootstrap Methods c A. Colin Cameron & Pravin K. Trivedi 2006 These transparencies were prepared in 20043. They can be used as an adjunct to Chapter 11 of our subsequent book Microeconometrics: Methods
A Practitioner s Guide to Cluster-Robust Inference
 A Practitioner s Guide to Cluster-Robust Inference A. C. Cameron and D. L. Miller presented by Federico Curci March 4, 2015 Cameron Miller Cluster Clinic II March 4, 2015 1 / 20 In the previous episode
Simulation-Extrapolation for Estimating Means and Causal Effects with Mismeasured Covariates
 Observational Studies 1 (2015) 241-290 Submitted 4/2015; Published 10/2015 Simulation-Extrapolation for Estimating Means and Causal Effects with Mismeasured Covariates J.R. Lockwood Educational Testing
Plausible Values for Latent Variables Using Mplus
 Plausible Values for Latent Variables Using Mplus Tihomir Asparouhov and Bengt Muthén August 21, 2010 1 1 Introduction Plausible values are imputed values for latent variables. All latent variables can
Bootstrap & Confidence/Prediction intervals
 Bootstrap & Confidence/Prediction intervals Olivier Roustant Mines Saint-Étienne 2017/11 Olivier Roustant (EMSE) Bootstrap & Confidence/Prediction intervals 2017/11 1 / 9 Framework Consider a model with
Fractional Hot Deck Imputation for Robust Inference Under Item Nonresponse in Survey Sampling
 Fractional Hot Deck Imputation for Robust Inference Under Item Nonresponse in Survey Sampling Jae-Kwang Kim 1 Iowa State University June 26, 2013 1 Joint work with Shu Yang Introduction 1 Introduction
Max. Likelihood Estimation. Outline. Econometrics II. Ricardo Mora. Notes. Notes
 Maximum Likelihood Estimation Econometrics II Department of Economics Universidad Carlos III de Madrid Máster Universitario en Desarrollo y Crecimiento Económico Outline 1 3 4 General Approaches to Parameter
Stat 5101 Lecture Notes
 Stat 5101 Lecture Notes Charles J. Geyer Copyright 1998, 1999, 2000, 2001 by Charles J. Geyer May 7, 2001 ii Stat 5101 (Geyer) Course Notes Contents 1 Random Variables and Change of Variables 1 1.1 Random
Model Assisted Survey Sampling
 Carl-Erik Sarndal Jan Wretman Bengt Swensson Model Assisted Survey Sampling Springer Preface v PARTI Principles of Estimation for Finite Populations and Important Sampling Designs CHAPTER 1 Survey Sampling
Measurement Error and Linear Regression of Astronomical Data. Brandon Kelly Penn State Summer School in Astrostatistics, June 2007
 Measurement Error and Linear Regression of Astronomical Data Brandon Kelly Penn State Summer School in Astrostatistics, June 2007 Classical Regression Model Collect n data points, denote i th pair as (η
MA 575 Linear Models: Cedric E. Ginestet, Boston University Bootstrap for Regression Week 9, Lecture 1
 MA 575 Linear Models: Cedric E. Ginestet, Boston University Bootstrap for Regression Week 9, Lecture 1 1 The General Bootstrap This is a computer-intensive resampling algorithm for estimating the empirical
Bootstrap Approach to Comparison of Alternative Methods of Parameter Estimation of a Simultaneous Equation Model
 Bootstrap Approach to Comparison of Alternative Methods of Parameter Estimation of a Simultaneous Equation Model Olubusoye, O. E., J. O. Olaomi, and O. O. Odetunde Abstract A bootstrap simulation approach
Semiparametric Generalized Linear Models
 Semiparametric Generalized Linear Models North American Stata Users Group Meeting Chicago, Illinois Paul Rathouz Department of Health Studies University of Chicago prathouz@uchicago.edu Liping Gao MS Student
Fall 2017 STAT 532 Homework Peter Hoff. 1. Let P be a probability measure on a collection of sets A.
 1. Let P be a probability measure on a collection of sets A. (a) For each n N, let H n be a set in A such that H n H n+1. Show that P (H n ) monotonically converges to P ( k=1 H k) as n. (b) For each n
Lecture 4: Multivariate Regression, Part 2
 Lecture 4: Multivariate Regression, Part 2 Gauss-Markov Assumptions 1) Linear in Parameters: Y X X X i 0 1 1 2 2 k k 2) Random Sampling: we have a random sample from the population that follows the above
GENERALIZED LINEAR MIXED MODELS AND MEASUREMENT ERROR. Raymond J. Carroll: Texas A&M University
 GENERALIZED LINEAR MIXED MODELS AND MEASUREMENT ERROR Raymond J. Carroll: Texas A&M University Naisyin Wang: Xihong Lin: Roberto Gutierrez: Texas A&M University University of Michigan Southern Methodist
Spatial Regression. 3. Review - OLS and 2SLS. Luc Anselin. Copyright 2017 by Luc Anselin, All Rights Reserved
 Spatial Regression 3. Review - OLS and 2SLS Luc Anselin http://spatial.uchicago.edu OLS estimation (recap) non-spatial regression diagnostics endogeneity - IV and 2SLS OLS Estimation (recap) Linear Regression
Gaussian Processes. Le Song. Machine Learning II: Advanced Topics CSE 8803ML, Spring 2012
 Gaussian Processes Le Song Machine Learning II: Advanced Topics CSE 8803ML, Spring 01 Pictorial view of embedding distribution Transform the entire distribution to expected features Feature space Feature
The Slow Convergence of OLS Estimators of α, β and Portfolio. β and Portfolio Weights under Long Memory Stochastic Volatility
 The Slow Convergence of OLS Estimators of α, β and Portfolio Weights under Long Memory Stochastic Volatility New York University Stern School of Business June 21, 2018 Introduction Bivariate long memory
Applied Statistics and Econometrics
 Applied Statistics and Econometrics Lecture 6 Saul Lach September 2017 Saul Lach () Applied Statistics and Econometrics September 2017 1 / 53 Outline of Lecture 6 1 Omitted variable bias (SW 6.1) 2 Multiple
Asymptotic Multivariate Kriging Using Estimated Parameters with Bayesian Prediction Methods for Non-linear Predictands
 Asymptotic Multivariate Kriging Using Estimated Parameters with Bayesian Prediction Methods for Non-linear Predictands Elizabeth C. Mannshardt-Shamseldin Advisor: Richard L. Smith Duke University Department
Specification Errors, Measurement Errors, Confounding
 Specification Errors, Measurement Errors, Confounding Kerby Shedden Department of Statistics, University of Michigan October 10, 2018 1 / 32 An unobserved covariate Suppose we have a data generating model
Chapter 2: Resampling Maarten Jansen
 Chapter 2: Resampling Maarten Jansen Randomization tests Randomized experiment random assignment of sample subjects to groups Example: medical experiment with control group n 1 subjects for true medicine,
Machine Learning CSE546 Carlos Guestrin University of Washington. September 30, 2013
 Bayesian Methods Machine Learning CSE546 Carlos Guestrin University of Washington September 30, 2013 1 What about prior n Billionaire says: Wait, I know that the thumbtack is close to 50-50. What can you
Stat 5100 Handout #26: Variations on OLS Linear Regression (Ch. 11, 13)
") Stat 5100 Handout #26: Variations on OLS Linear Regression (Ch. 11, 13) 1. Weighted Least Squares (textbook 11.1) Recall regression model Y = β 0 + β 1 X 1 +... + β p 1 X p 1 + ε in matrix form: (Ch. 5,
Stat 5100 Handout #26: Variations on OLS Linear Regression (Ch. 11, 13) 1. Weighted Least Squares (textbook 11.1) Recall regression model Y = β 0 + β 1 X 1 +... + β p 1 X p 1 + ε in matrix form: (Ch. 5,
Homework 2: Simple Linear Regression
 STAT 4385 Applied Regression Analysis Homework : Simple Linear Regression (Simple Linear Regression) Thirty (n = 30) College graduates who have recently entered the job market. For each student, the CGPA
The Nonparametric Bootstrap
 The Nonparametric Bootstrap The nonparametric bootstrap may involve inferences about a parameter, but we use a nonparametric procedure in approximating the parametric distribution using the ECDF. We use
Lecture 4: Multivariate Regression, Part 2
 Lecture 4: Multivariate Regression, Part 2 Gauss-Markov Assumptions 1) Linear in Parameters: Y X X X i 0 1 1 2 2 k k 2) Random Sampling: we have a random sample from the population that follows the above
Characterizing Forecast Uncertainty Prediction Intervals. The estimated AR (and VAR) models generate point forecasts of y t+s, y ˆ
 models generate point forecasts of y t+s, y ˆ") Characterizing Forecast Uncertainty Prediction Intervals The estimated AR (and VAR) models generate point forecasts of y t+s, y ˆ t + s, t. Under our assumptions the point forecasts are asymtotically unbiased
Characterizing Forecast Uncertainty Prediction Intervals The estimated AR (and VAR) models generate point forecasts of y t+s, y ˆ t + s, t. Under our assumptions the point forecasts are asymtotically unbiased
401 Review. 6. Power analysis for one/two-sample hypothesis tests and for correlation analysis.
 401 Review Major topics of the course 1. Univariate analysis 2. Bivariate analysis 3. Simple linear regression 4. Linear algebra 5. Multiple regression analysis Major analysis methods 1. Graphical analysis
Double Robustness. Bang and Robins (2005) Kang and Schafer (2007)
 Kang and Schafer (2007)") Double Robustness Bang and Robins (2005) Kang and Schafer (2007) Set-Up Assume throughout that treatment assignment is ignorable given covariates (similar to assumption that data are missing at random
Double Robustness Bang and Robins (2005) Kang and Schafer (2007) Set-Up Assume throughout that treatment assignment is ignorable given covariates (similar to assumption that data are missing at random
COMPARISON OF THE ESTIMATORS OF THE LOCATION AND SCALE PARAMETERS UNDER THE MIXTURE AND OUTLIER MODELS VIA SIMULATION
 (REFEREED RESEARCH) COMPARISON OF THE ESTIMATORS OF THE LOCATION AND SCALE PARAMETERS UNDER THE MIXTURE AND OUTLIER MODELS VIA SIMULATION Hakan S. Sazak 1, *, Hülya Yılmaz 2 1 Ege University, Department
Robustness to Parametric Assumptions in Missing Data Models
 Robustness to Parametric Assumptions in Missing Data Models Bryan Graham NYU Keisuke Hirano University of Arizona April 2011 Motivation Motivation We consider the classic missing data problem. In practice
Importance Sampling: An Alternative View of Ensemble Learning. Jerome H. Friedman Bogdan Popescu Stanford University
 Importance Sampling: An Alternative View of Ensemble Learning Jerome H. Friedman Bogdan Popescu Stanford University 1 PREDICTIVE LEARNING Given data: {z i } N 1 = {y i, x i } N 1 q(z) y = output or response
Statistical Methods. Missing Data snijders/sm.htm. Tom A.B. Snijders. November, University of Oxford 1 / 23
 1 / 23 Statistical Methods Missing Data http://www.stats.ox.ac.uk/ snijders/sm.htm Tom A.B. Snijders University of Oxford November, 2011 2 / 23 Literature: Joseph L. Schafer and John W. Graham, Missing
Shu Yang and Jae Kwang Kim. Harvard University and Iowa State University
 Statistica Sinica 27 (2017), 000-000 doi:https://doi.org/10.5705/ss.202016.0155 DISCUSSION: DISSECTING MULTIPLE IMPUTATION FROM A MULTI-PHASE INFERENCE PERSPECTIVE: WHAT HAPPENS WHEN GOD S, IMPUTER S AND
A weighted simulation-based estimator for incomplete longitudinal data models
 To appear in Statistics and Probability Letters, 113 (2016), 16-22. doi 10.1016/j.spl.2016.02.004 A weighted simulation-based estimator for incomplete longitudinal data models Daniel H. Li 1 and Liqun
SIMEX and TLS: An equivalence result
 SIMEX and TLS: An equivalence result Polzehl, Jörg Weierstrass Institute for Applied Analysis and Stochastics, Mohrenstr. 39, 10117 Berlin, Germany polzehl@wias-berlin.de Zwanzig, Silvelyn Uppsala University,
A Significance Test for the Lasso
 A Significance Test for the Lasso Lockhart R, Taylor J, Tibshirani R, and Tibshirani R Ashley Petersen May 14, 2013 1 Last time Problem: Many clinical covariates which are important to a certain medical
PDEEC Machine Learning 2016/17
 PDEEC Machine Learning 2016/17 Lecture - Model assessment, selection and Ensemble Jaime S. Cardoso jaime.cardoso@inesctec.pt INESC TEC and Faculdade Engenharia, Universidade do Porto Nov. 07, 2017 1 /
Correlation and Regression
 Correlation and Regression October 25, 2017 STAT 151 Class 9 Slide 1 Outline of Topics 1 Associations 2 Scatter plot 3 Correlation 4 Regression 5 Testing and estimation 6 Goodness-of-fit STAT 151 Class
Finite Population Sampling and Inference
 Finite Population Sampling and Inference A Prediction Approach RICHARD VALLIANT ALAN H. DORFMAN RICHARD M. ROYALL A Wiley-Interscience Publication JOHN WILEY & SONS, INC. New York Chichester Weinheim Brisbane
Applied Health Economics (for B.Sc.)
") Applied Health Economics (for B.Sc.) Helmut Farbmacher Department of Economics University of Mannheim Autumn Semester 2017 Outlook 1 Linear models (OLS, Omitted variables, 2SLS) 2 Limited and qualitative
Applied Health Economics (for B.Sc.) Helmut Farbmacher Department of Economics University of Mannheim Autumn Semester 2017 Outlook 1 Linear models (OLS, Omitted variables, 2SLS) 2 Limited and qualitative
Monte Carlo Study on the Successive Difference Replication Method for Non-Linear Statistics
 Monte Carlo Study on the Successive Difference Replication Method for Non-Linear Statistics Amang S. Sukasih, Mathematica Policy Research, Inc. Donsig Jang, Mathematica Policy Research, Inc. Amang S. Sukasih,
Statistics: A review. Why statistics?
 Statistics: A review Why statistics? What statistical concepts should we know? Why statistics? To summarize, to explore, to look for relations, to predict What kinds of data exist? Nominal, Ordinal, Interval
ECON 3150/4150, Spring term Lecture 6
 ECON 3150/4150, Spring term 2013. Lecture 6 Review of theoretical statistics for econometric modelling (II) Ragnar Nymoen University of Oslo 31 January 2013 1 / 25 References to Lecture 3 and 6 Lecture
STA 2201/442 Assignment 2
 STA 2201/442 Assignment 2 1. This is about how to simulate from a continuous univariate distribution. Let the random variable X have a continuous distribution with density f X (x) and cumulative distribution
Bias-Correction in Vector Autoregressive Models: A Simulation Study
 Econometrics 2014, 2, 45-71; doi:10.3390/econometrics2010045 OPEN ACCESS econometrics ISSN 2225-1146 www.mdpi.com/journal/econometrics Article Bias-Correction in Vector Autoregressive Models: A Simulation
AGEC 661 Note Fourteen
 AGEC 661 Note Fourteen Ximing Wu 1 Selection bias 1.1 Heckman s two-step model Consider the model in Heckman (1979) Y i = X iβ + ε i, D i = I {Z iγ + η i > 0}. For a random sample from the population,
System Identification, Lecture 4
 System Identification, Lecture 4 Kristiaan Pelckmans (IT/UU, 2338) Course code: 1RT880, Report code: 61800 - Spring 2012 F, FRI Uppsala University, Information Technology 30 Januari 2012 SI-2012 K. Pelckmans
Machine Learning 2nd Edition
 INTRODUCTION TO Lecture Slides for Machine Learning 2nd Edition ETHEM ALPAYDIN, modified by Leonardo Bobadilla and some parts from http://www.cs.tau.ac.il/~apartzin/machinelearning/ The MIT Press, 2010
System Identification, Lecture 4
 System Identification, Lecture 4 Kristiaan Pelckmans (IT/UU, 2338) Course code: 1RT880, Report code: 61800 - Spring 2016 F, FRI Uppsala University, Information Technology 13 April 2016 SI-2016 K. Pelckmans
Wooldridge, Introductory Econometrics, 4th ed. Appendix C: Fundamentals of mathematical statistics
 Wooldridge, Introductory Econometrics, 4th ed. Appendix C: Fundamentals of mathematical statistics A short review of the principles of mathematical statistics (or, what you should have learned in EC 151).
Marginal Specifications and a Gaussian Copula Estimation
 Marginal Specifications and a Gaussian Copula Estimation Kazim Azam Abstract Multivariate analysis involving random variables of different type like count, continuous or mixture of both is frequently required
Statistics and Data Analysis
 Statistics and Data Analysis The Crash Course Physics 226, Fall 2013 "There are three kinds of lies: lies, damned lies, and statistics. Mark Twain, allegedly after Benjamin Disraeli Statistics and Data
Nonresponse weighting adjustment using estimated response probability
 Nonresponse weighting adjustment using estimated response probability Jae-kwang Kim Yonsei University, Seoul, Korea December 26, 2006 Introduction Nonresponse Unit nonresponse Item nonresponse Basic strategy
Review of Statistics 101
 Review of Statistics 101 We review some important themes from the course 1. Introduction Statistics- Set of methods for collecting/analyzing data (the art and science of learning from data). Provides methods
STAT Section 2.1: Basic Inference. Basic Definitions
 STAT 518 --- Section 2.1: Basic Inference Basic Definitions Population: The collection of all the individuals of interest. This collection may be or even. Sample: A collection of elements of the population.
Two-phase sampling approach to fractional hot deck imputation
 Two-phase sampling approach to fractional hot deck imputation Jongho Im 1, Jae-Kwang Kim 1 and Wayne A. Fuller 1 Abstract Hot deck imputation is popular for handling item nonresponse in survey sampling.
What s New in Econometrics. Lecture 13
 What s New in Econometrics Lecture 13 Weak Instruments and Many Instruments Guido Imbens NBER Summer Institute, 2007 Outline 1. Introduction 2. Motivation 3. Weak Instruments 4. Many Weak) Instruments
6.435, System Identification
 System Identification 6.435 SET 3 Nonparametric Identification Munther A. Dahleh 1 Nonparametric Methods for System ID Time domain methods Impulse response Step response Correlation analysis / time Frequency
9. Linear Regression and Correlation
 9. Linear Regression and Correlation Data: y a quantitative response variable x a quantitative explanatory variable (Chap. 8: Recall that both variables were categorical) For example, y = annual income,
Causal Inference with General Treatment Regimes: Generalizing the Propensity Score
 Causal Inference with General Treatment Regimes: Generalizing the Propensity Score David van Dyk Department of Statistics, University of California, Irvine vandyk@stat.harvard.edu Joint work with Kosuke
ECON 3150/4150, Spring term Lecture 7
 ECON 3150/4150, Spring term 2014. Lecture 7 The multivariate regression model (I) Ragnar Nymoen University of Oslo 4 February 2014 1 / 23 References to Lecture 7 and 8 SW Ch. 6 BN Kap 7.1-7.8 2 / 23 Omitted
Instrumental Variables
 Instrumental Variables Department of Economics University of Wisconsin-Madison September 27, 2016 Treatment Effects Throughout the course we will focus on the Treatment Effect Model For now take that to
Lecture 25: Review. Statistics 104. April 23, Colin Rundel
 Lecture 25: Review Statistics 104 Colin Rundel April 23, 2012 Joint CDF F (x, y) = P [X x, Y y] = P [(X, Y ) lies south-west of the point (x, y)] Y (x,y) X Statistics 104 (Colin Rundel) Lecture 25 April
Maximum Likelihood Estimation; Robust Maximum Likelihood; Missing Data with Maximum Likelihood
 Maximum Likelihood Estimation; Robust Maximum Likelihood; Missing Data with Maximum Likelihood PRE 906: Structural Equation Modeling Lecture #3 February 4, 2015 PRE 906, SEM: Estimation Today s Class An
ECO 310: Empirical Industrial Organization Lecture 2 - Estimation of Demand and Supply
 ECO 310: Empirical Industrial Organization Lecture 2 - Estimation of Demand and Supply Dimitri Dimitropoulos Fall 2014 UToronto 1 / 55 References RW Section 3. Wooldridge, J. (2008). Introductory Econometrics:
Ref.: Spring SOS3003 Applied data analysis for social science Lecture note
 SOS3003 Applied data analysis for social science Lecture note 05-2010 Erling Berge Department of sociology and political science NTNU Spring 2010 Erling Berge 2010 1 Literature Regression criticism I Hamilton
Problem Set 3: Bootstrap, Quantile Regression and MCMC Methods. MIT , Fall Due: Wednesday, 07 November 2007, 5:00 PM
 Problem Set 3: Bootstrap, Quantile Regression and MCMC Methods MIT 14.385, Fall 2007 Due: Wednesday, 07 November 2007, 5:00 PM 1 Applied Problems Instructions: The page indications given below give you
Weighted Least Squares
 Weighted Least Squares The standard linear model assumes that Var(ε i ) = σ 2 for i = 1,..., n. As we have seen, however, there are instances where Var(Y X = x i ) = Var(ε i ) = σ2 w i. Here w 1,..., w
Uncertainty Quantification for Inverse Problems. November 7, 2011
 Uncertainty Quantification for Inverse Problems November 7, 2011 Outline UQ and inverse problems Review: least-squares Review: Gaussian Bayesian linear model Parametric reductions for IP Bias, variance
Nonparametric estimation of tail risk measures from heavy-tailed distributions
 Nonparametric estimation of tail risk measures from heavy-tailed distributions Jonthan El Methni, Laurent Gardes & Stéphane Girard 1 Tail risk measures Let Y R be a real random loss variable. The Value-at-Risk
Discussing Effects of Different MAR-Settings
 Discussing Effects of Different MAR-Settings Research Seminar, Department of Statistics, LMU Munich Munich, 11.07.2014 Matthias Speidel Jörg Drechsler Joseph Sakshaug Outline What we basically want to
ANALYSIS OF ORDINAL SURVEY RESPONSES WITH DON T KNOW
 SSC Annual Meeting, June 2015 Proceedings of the Survey Methods Section ANALYSIS OF ORDINAL SURVEY RESPONSES WITH DON T KNOW Xichen She and Changbao Wu 1 ABSTRACT Ordinal responses are frequently involved
Gov 2000: 9. Regression with Two Independent Variables
 Gov 2000: 9. Regression with Two Independent Variables Matthew Blackwell Fall 2016 1 / 62 1. Why Add Variables to a Regression? 2. Adding a Binary Covariate 3. Adding a Continuous Covariate 4. OLS Mechanics
Bias-Variance in Machine Learning
 Bias-Variance in Machine Learning Bias-Variance: Outline Underfitting/overfitting: Why are complex hypotheses bad? Simple example of bias/variance Error as bias+variance for regression brief comments on
Econ 510 B. Brown Spring 2014 Final Exam Answers
 Econ 510 B. Brown Spring 2014 Final Exam Answers Answer five of the following questions. You must answer question 7. The question are weighted equally. You have 2.5 hours. You may use a calculator. Brevity
First Year Examination Department of Statistics, University of Florida
 First Year Examination Department of Statistics, University of Florida August 19, 010, 8:00 am - 1:00 noon Instructions: 1. You have four hours to answer questions in this examination.. You must show your
Streamlining Missing Data Analysis by Aggregating Multiple Imputations at the Data Level
 Streamlining Missing Data Analysis by Aggregating Multiple Imputations at the Data Level A Monte Carlo Simulation to Test the Tenability of the SuperMatrix Approach Kyle M Lang Quantitative Psychology
Economics 583: Econometric Theory I A Primer on Asymptotics
 Economics 583: Econometric Theory I A Primer on Asymptotics Eric Zivot January 14, 2013 The two main concepts in asymptotic theory that we will use are Consistency Asymptotic Normality Intuition consistency:
Online Appendix to Yes, But What s the Mechanism? (Don t Expect an Easy Answer) John G. Bullock, Donald P. Green, and Shang E. Ha
 John G. Bullock, Donald P. Green, and Shang E. Ha") Online Appendix to Yes, But What s the Mechanism? (Don t Expect an Easy Answer) John G. Bullock, Donald P. Green, and Shang E. Ha January 18, 2010 A2 This appendix has six parts: 1. Proof that ab = c d
Online Appendix to Yes, But What s the Mechanism? (Don t Expect an Easy Answer) John G. Bullock, Donald P. Green, and Shang E. Ha January 18, 2010 A2 This appendix has six parts: 1. Proof that ab = c d
Pattern Recognition and Machine Learning. Bishop Chapter 11: Sampling Methods
 Pattern Recognition and Machine Learning Chapter 11: Sampling Methods Elise Arnaud Jakob Verbeek May 22, 2008 Outline of the chapter 11.1 Basic Sampling Algorithms 11.2 Markov Chain Monte Carlo 11.3 Gibbs
Combining data from two independent surveys: model-assisted approach
 Combining data from two independent surveys: model-assisted approach Jae Kwang Kim 1 Iowa State University January 20, 2012 1 Joint work with J.N.K. Rao, Carleton University Reference Kim, J.K. and Rao,
Model-free prediction intervals for regression and autoregression. Dimitris N. Politis University of California, San Diego
 Model-free prediction intervals for regression and autoregression Dimitris N. Politis University of California, San Diego To explain or to predict? Models are indispensable for exploring/utilizing relationships