Independent Component (IC) Models: New Extensions of the Multinormal Model
|
|
|
- Ferdinand Riley
- 6 years ago
- Views:
Transcription
1 Independent Component (IC) Models: New Extensions of the Multinormal Model Davy Paindaveine (joint with Klaus Nordhausen, Hannu Oja, and Sara Taskinen) School of Public Health, ULB, April 2008
2 My research is in multivariate statistics, where several (p, say) measurements are recorded on each of the n individuals. We want to come up with models that are potentially useful for a broad range of setups (p << n, though).
3 My research is in multivariate statistics, where several (p, say) measurements are recorded on each of the n individuals. We want to come up with models that are potentially useful for a broad range of setups (p << n, though). In those models, we develop procedures that are robust to some possible model misspecification
4 My research is in multivariate statistics, where several (p, say) measurements are recorded on each of the n individuals. We want to come up with models that are potentially useful for a broad range of setups (p << n, though). In those models, we develop procedures that are robust to some possible model misspecification robust to possible outlying observations (crucial in the multivariate case!)
5
6
7 My research is in multivariate statistics, where several (p, say) measurements are recorded on each of the n individuals. We want to come up with models that are potentially useful for a broad range of setups (p << n, though). In those models, we develop procedures that are robust to some possible model misspecification robust to possible outlying observations yet efficient...
8 Outline Introduction 1 Introduction A (too?) simple multivariate problem Normal and elliptic models 2 What is it? How does it work? vs PCA 3 Definition Inference
9 Outline Introduction A (too?) simple multivariate problem Normal and elliptic models 1 Introduction A (too?) simple multivariate problem Normal and elliptic models 2 What is it? How does it work? vs PCA 3 Definition Inference
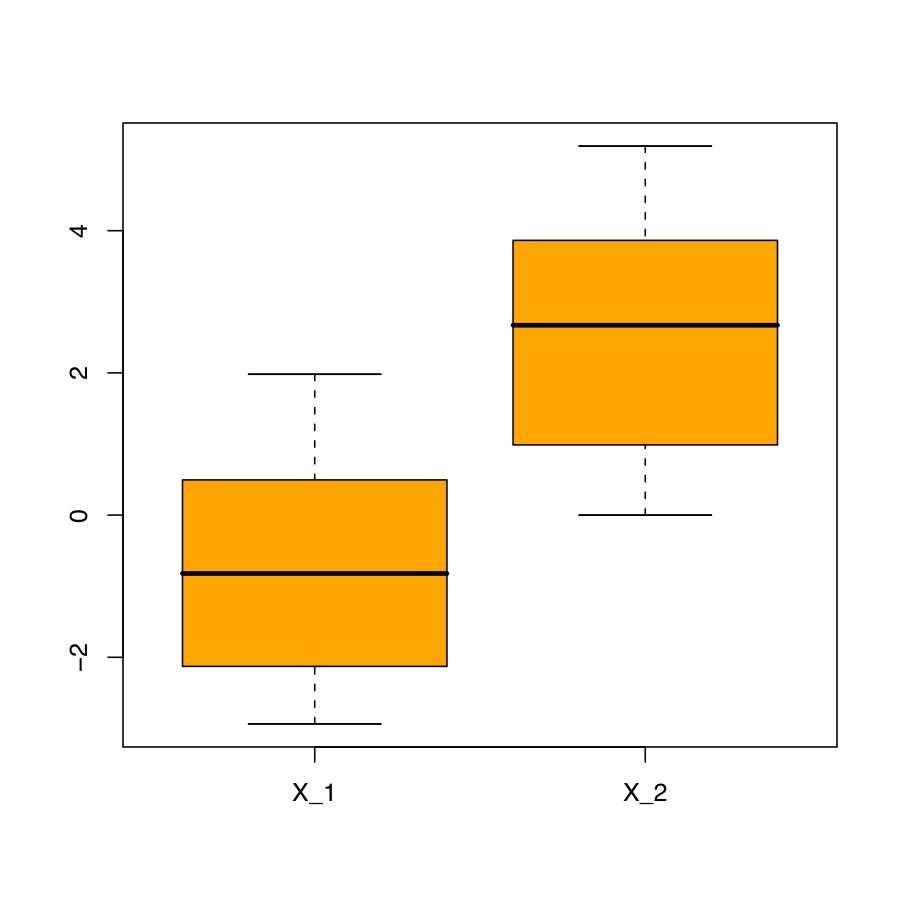
10 A (too?) simple multivariate problem Normal and elliptic models cigarette sales in packs per capita per capita disposable income
11 A (too?) simple multivariate problem Normal and elliptic models X i = ( Xi1 X i2 ) = ( ) sales (after - before) for state i, i = 1,...,n income (after - before) for state i
12 A (too?) simple multivariate problem Normal and elliptic models Assume one wants to find out, on the basis of the sample X 1, X 2,..., X n, whether the tax reform had an effect (or not) on any of the variables. Typically, in statistical terms, this would translate into testing { H0 : µ j = 0 for all j H 1 : µ j 0 for at least j, at some fixed level α (5%, say).
13 A (too?) simple multivariate problem Normal and elliptic models Assume one wants to find out, on the basis of the sample X 1, X 2,..., X n, whether the tax reform had some fixed specified effect on each variable mean. Typically, in statistical terms, this would translate into testing { H0 : µ j = c j for all j H 1 : µ j c j for at least j, at some fixed level α (5%, say).
14 A (too?) simple multivariate problem Normal and elliptic models The most basic idea is to go univariate, i.e., for each j = 1, 2, to test on the basis of X 1j,..., X nj whether H (j) 0 : µ j = c j holds or not (at level 5%), to reject H 0 as soon as one H (j) 0 has been rejected. This is a bad multivariate testing procedure, since it is easy to show that P[RH 0 ] > 5% under H 0. You cannot properly control the level if you act marginally...
15 A (too?) simple multivariate problem Normal and elliptic models cigarette sales in packs per capita per capita disposable income
16 A (too?) simple multivariate problem Normal and elliptic models The most basic idea is to go univariate, i.e., for each j = 1, 2, to test on the basis of X 1j,..., X nj whether H (j) 0 : µ j = c j holds or not (at level 5%), to reject H 0 as soon as one H (j) 0 has been rejected. This is a bad multivariate testing procedure, since it is easy to show that P[RH 0 ] > 5% under H 0. You cannot properly control the level if you act marginally...
17 A (too?) simple multivariate problem Normal and elliptic models Confidence zones also cannot be built marginally...
18 A (too?) simple multivariate problem Normal and elliptic models Confidence zones also cannot be built marginally...
19 A (too?) simple multivariate problem Normal and elliptic models Hence there is a need for multivariate modelling. The most classical model the multivariate normal model specifies that the common density of the X i s is of the form f X (x) exp( (x µ) Σ 1 (x µ)/2). A necessary condition for to hold is that each of the p variables is normally distributed. Hence, even for p = 2, 3, it is extremely unlikely that the underlying distribution is multivariate normal... (you need to win at Euromillions p times in a row!)
20 A (too?) simple multivariate problem Normal and elliptic models
21 A (too?) simple multivariate problem Normal and elliptic models Not quite the same model!
22 A (too?) simple multivariate problem Normal and elliptic models
23 A (too?) simple multivariate problem Normal and elliptic models The marginals are far from Gaussian...
24 A (too?) simple multivariate problem Normal and elliptic models Does it hurt?
25 A (too?) simple multivariate problem Normal and elliptic models Does it hurt? Oh yes, it does... For H 0 : µ = µ 0, the Gaussian LR test (i) is efficient at the multinormal only, and (ii) is valid only if variances exist (what about financial series?) For H 0 : Σ = Σ 0, the Gaussian LR test is valid at the multivariate normal distribution!
26 A (too?) simple multivariate problem Normal and elliptic models Does it hurt? Oh yes, it does... For H 0 : µ = µ 0, the Gaussian LR test (i) is efficient at the multinormal only, and (ii) is valid only if variances exist (what about financial series?) For H 0 : Σ = Σ 0, the Gaussian LR test is valid at the multivariate normal distribution! Remarks: Even for n = Incidently, those tests are not robust w.r.t. possible outliers.
27 A (too?) simple multivariate problem Normal and elliptic models
28 A (too?) simple multivariate problem Normal and elliptic models An equivalent definition of the multivariate normal distribution specifies that where X = A(RU) + µ, U is uniformly distributed on the unit sphere in R p R 2 χ 2 p is independent of U A is a constant p p matrix µ is a constant p-vector
29 A (too?) simple multivariate problem Normal and elliptic models
30 A (too?) simple multivariate problem Normal and elliptic models
31 A (too?) simple multivariate problem Normal and elliptic models An equivalent definition of the multivariate normal distribution specifies that where X = A(RU) + µ, U is uniformly distributed on the unit sphere in R p R 2 χ 2 p is independent of U A is a constant p p matrix µ is a constant p-vector
32 A (too?) simple multivariate problem Normal and elliptic models An equivalent definition of the multivariate normal distribution specifies that where X = A(RU) + µ, U is uniformly distributed on the unit sphere in R p R 2 χ 2 p is independent of U A is a constant p p matrix µ is a constant p-vector Elliptical distributions allow for an arbitrary distribution R.
33 A (too?) simple multivariate problem Normal and elliptic models Elliptical distributions add some flexibility (in particular, allow for heavy tails). but still give raise to marginals with a common (type of) distribution. symmetric marginals a deep multivariate symmetry structure... These stylized facts often are sufficient to rule out the assumption of ellipticity... (no need for a test of ellipticity!) I am burning my old records here!
34 A (too?) simple multivariate problem Normal and elliptic models
35 A (too?) simple multivariate problem Normal and elliptic models Elliptical distributions add some flexibility (in particular, allow for heavy tails). but still give raise to marginals with a common (type of) distribution. symmetric marginals a deep multivariate symmetry structure... These stylized facts often are sufficient to rule out the assumption of ellipticity... (no need for a test of ellipticity!)
36 A (too?) simple multivariate problem Normal and elliptic models And now something completely different..." (Monthy Python Flying Circus, 1970)
37 Outline Introduction What is it? How does it work? vs PCA 1 Introduction A (too?) simple multivariate problem Normal and elliptic models 2 What is it? How does it work? vs PCA 3 Definition Inference
38 What is it? How does it work? vs PCA stands for Independent Component Analysis. It is a technique used in Blind Source Separation problems, such as in the cocktail-party problem": 3 conversations: Z it (i = 1, 2, 3, t = 1,..., n) 3 microphones: X it The goal is to recover the original conversations... Under the only assumption the latter are independent.

39 What is it? How does it work? vs PCA s Z 1t Z 2t Z 3t
40 What is it? How does it work? vs PCA s Z 1t Z 2t Z 3t
41 What is it? How does it work? vs PCA The basic model is X 1t = a 11 Z 1t + a 12 Z 2t + a 13 Z 3t X 2t = a 21 Z 1t + a 22 Z 2t + a 23 Z 3t X 3t = a 31 Z 1t + a 32 Z 2t + a 33 Z 3t, that is, X t = A Z t ; where one assumes all Z it s are mutually independent. Conversations" are independent. No serial dependence.
42 What is it? How does it work? vs PCA The basic model is X 1t = a 11 Z 1t + a 12 Z 2t + a 13 Z 3t X 2t = a 21 Z 1t + a 22 Z 2t + a 23 Z 3t X 3t = a 31 Z 1t + a 32 Z 2t + a 33 Z 3t, that is, X t = A Z t ; where one assumes all Z it s are mutually independent. Conversations" are independent. No serial dependence. The mixing matrix A does not depend on t.
43 What is it? How does it work? vs PCA For BW images, Z ij {0, 1,..., 255} represents the grey intensity of the ith image for the jth pixel (in vectorized form).
44 What is it? How does it work? vs PCA For BW images, Z ij {0, 1,..., 255} represents the grey intensity of the ith image for the jth pixel (in vectorized form).
45 What is it? How does it work? vs PCA For BW images, Z ij {0, 1,..., 255} represents the grey intensity of the ith image for the jth pixel (in vectorized form). Here, n =
46 What is it? How does it work? vs PCA For BW images, Z ij {0, 1,..., 255} represents the grey intensity of the ith image for the jth pixel (in vectorized form). Here, n = And Z i1 = 61, Z i2 = 61,...
. Here, n = 281 281.")
47 What is it? How does it work? vs PCA For BW images, Z ij {0, 1,..., 255} represents the grey intensity of the ith image for the jth pixel (in vectorized form). Here, n = And Z i1 = 61, Z i2 = 61,... Minimimal value=45 (dark grey) Maximal value=255 (white)
48 What is it? How does it work? vs PCA Can you guess the Z 1, Z 2, Z 3 which generated this mixture X 1? X 1
49 What is it? How does it work? vs PCA Would you guess who are X 1 X 2


50 What is it? How does it work? vs PCA X 1 X 2 X 3
51 What is it? How does it work? vs PCA magic
52 What is it? How does it work? vs PCA Ẑ 1 Ẑ 2 Ẑ 3


53 What is it? How does it work? vs PCA Z 1 Z 2 Z 3
54 What is it? How does it work? vs PCA Engineers typically estimate A (hence recover sources Ẑt = Â 1 X t ) by choosing the matrix A that makes the marginals of A 1 X t as independent as possible, or as non-gaussian as possible.
55 What is it? How does it work? vs PCA Engineers typically estimate A (hence recover sources Ẑt = Â 1 X t ) by choosing the matrix A that makes the marginals of A 1 X t as independent as possible, or as non-gaussian as possible. Drawbacks: Arbitrary objective functions. Computationally intensive procedures. Lack of robustness.
56 What is it? How does it work? vs PCA We have our own way to do that: A p p scatter matrix S = S(X 1,...,X n ) is a statistic such that S(AX 1,...,AX n ) = AS(X 1,..., X n )A for all p p matrix A. Example: S 2 = 1 n 1 S 1 = 1 n 1 n i=1 n (X i X)(X i X) i=1 [(X i X) S 1 1 (X i X)](X i X)(X i X)
57 What is it? How does it work? vs PCA We have our own way to do that: A p p scatter matrix S = S(X 1,...,X n ) is a statistic such that S(AX 1,...,AX n ) = AS(X 1,..., X n )A for all p p matrix A. Assume lim n S(X 1,..., X n ) is diagonal as soon as the common distribution of the X i s has independent marginals. Then we say S has the independence property. Example: S 2 = 1 n 1 S 1 = 1 n 1 n i=1 n (X i X)(X i X) i=1 [(X i X) S 1 1 (X i X)](X i X)(X i X)
58 What is it? How does it work? vs PCA We have our own way to do that: A p p scatter matrix S = S(X 1,...,X n ) is a statistic such that S(AX 1,...,AX n ) = AS(X 1,..., X n )A for all p p matrix A. Assume lim n S(X 1,..., X n ) is diagonal as soon as the common distribution of the X i s has independent marginals. Then we say S has the independence property. Examples: S 2 = 1 n 1 S 1 = 1 n 1 n i=1 n (X i X)(X i X) i=1 [(X i X) S 1 1 (X i X)](X i X)(X i X)
59 What is it? How does it work? vs PCA We have our own way to do that: A p p scatter matrix S = S(X 1,...,X n ) is a statistic such that S(AX 1,...,AX n ) = AS(X 1,..., X n )A for all p p matrix A. Assume lim n S(X 1,..., X n ) is diagonal as soon as the common distribution of the X i s has independent marginals. Then we say S has the independence property. Theorem Let S 1, S 2 be scatter matrices with the independence property. Then the p p matrix B n, whose columns are the eigenvectors of S 1 2 (X 1,..., X n )S 1 (X 1,..., X n ), is consistent for (A ) 1.
60 What is it? How does it work? vs PCA Proof. By using the definition of a scatter and the independence property, we obtain { S 1 = S 1 (X i ) = S 1 (AZ i ) = AS 1 (Z i )A = AD 1 A S 2 = S 2 (X i ) = S 2 (AZ i ) = AS 2 (Z i )A = AD 2 A, for some diagonal matrices D 1, D 2. Hence, (S 1 2 S 1)A 1 = (AD2 A ) 1 (AD 1 A )A 1 = A 1 (D 1 2 D 1).
61 What is it? How does it work? vs PCA Proof. By using the definition of a scatter and the independence property, we obtain { S 1 = S 1 (X i ) = S 1 (AZ i ) = AS 1 (Z i )A = AD 1 A S 2 = S 2 (X i ) = S 2 (AZ i ) = AS 2 (Z i )A = AD 2 A, for some diagonal matrices D 1, D 2. Hence, (S 1 2 S 1)A 1 = (AD2 A ) 1 (AD 1 A )A 1 = A 1 (D 1 2 D 1).
62 What is it? How does it work? vs PCA Proof. By using the definition of a scatter and the independence property, we obtain { S 1 = S 1 (X i ) = S 1 (AZ i ) = AS 1 (Z i )A = AD 1 A S 2 = S 2 (X i ) = S 2 (AZ i ) = AS 2 (Z i )A = AD 2 A, for some diagonal matrices D 1, D 2. Hence, (S 1 2 S 1)A 1 = (AD2 A ) 1 (AD 1 A )A 1 = A 1 (D 1 2 D 1).
63 What is it? How does it work? vs PCA We have our own way to do that: Theorem Let S 1, S 2 be scatter matrices with the independence property. Then the p p matrix B n, whose columns are the eigenvectors of S 1 2 S 1, is consistent for (A ) 1. Of course, if we choose robust S 1 and S 2, the resulting  will be robust as well, which guarantees a robust reconstruction of the independent sources...
64 What is it? How does it work? vs PCA With robust S 1, S 2... Ẑ 1 Ẑ 2 Ẑ 3


65 What is it? How does it work? vs PCA With non-robust S 1, S 2... (the ones given above) Ẑ 1 Ẑ 2 Ẑ 3
66 What is it? How does it work? vs PCA PCA makes marginals uncorrelated... makes marginals independent... Actually, is going one step further than PCA: = PCA + a rotation...
67 What is it? How does it work? vs PCA PCA makes marginals uncorrelated... makes marginals independent... Actually, is going one step further than PCA: = PCA + a rotation... This explains PCA is often used as a preliminary step to perform.
68 What is it? How does it work? vs PCA V V2 Raw data V V4 V V
69 What is it? How does it work? vs PCA V V2 Principal components V V4 V V
70 What is it? How does it work? vs PCA V Independent components V2 V V4 V V
71 Outline Introduction Definition Inference 1 Introduction A (too?) simple multivariate problem Normal and elliptic models 2 What is it? How does it work? vs PCA 3 Definition Inference
72 Definition Inference We reject the elliptical model, which states that X i = AZ i + µ, where Z i = (Z i1,...,z ip ) is spherically symmetric (about 0 R p ), in favor of the following: Definition The independent component (IC) model states that X i = AZ i + µ, where Z i = (Z i1,...,z ip ) has independent marginals (with median 0 and MAD 1).
73 Definition Inference provide an extension of the multinormal model, which is obtained when all ICs are Gaussian.
74 Definition Inference provide an extension of the multinormal model, which is obtained when all ICs are Gaussian. Both extensions are disjoint.
75 Definition Inference provide an extension of the multinormal model, which is obtained when all ICs are Gaussian. Both extensions are disjoint. This IC extension is bigger than that of elliptic models. In : µ, A, and p densities g 1,...,g p. In elliptic models: µ, A, and a single density g (that of Z ).

76 Definition Inference As a summary...
77 Definition Inference provide an extension of the multinormal model, which is obtained when all ICs are Gaussian. Both extensions are disjoint. This IC extension is bigger than that of elliptic models. In : µ, A, and p densities g 1,...,g p. In elliptic models: µ, A, and a single density g (that of Z ). The g j s allow for much flexibility. In particular, - we can play with p different kurtosis values... - the X i may very well be asymmetric...
78 Definition Inference
79 Definition Inference Inference problem Test H 0 : µ = 0 for n i.i.d. observations from the IC model X i = AZ i + µ, where Z i = (Z i1,...,z ip ) has independent marginals. The parameters: location vector µ, scatter matrix A, p densities (g 1,..., g p ). Of course, we can hardly assume the g j s to be known, and it is expected that this nuisance will be an important issue.
80 Definition Inference Quite nicely, our estimators  (based on a couple of scatter S 1, S 2 ) do not require estimating µ nor g 1,...,g p.
81 Definition Inference Quite nicely, our estimators  (based on a couple of scatter S 1, S 2 ) do not require estimating µ nor g 1,...,g p. We then may (a) write Y i :=  1 X i =  1 AZ i +  1 µ Z i +  1 µ (1) and (b) go univariate to test componentwise whether the location is 0 (RH (j) 0 for large values of T j, with T j N(0, 1) under H (j) 0 ).
82 Definition Inference Quite nicely, our estimators  (based on a couple of scatter S 1, S 2 ) do not require estimating µ nor g 1,...,g p. We then may (a) write Y i :=  1 X i =  1 AZ i +  1 µ Z i +  1 µ (1) and (b) go univariate to test componentwise whether the location is 0 (RH (j) 0 for large values of T j, with T j N(0, 1) under H (j) 0 ). Crucial point: we will be able to aggregate those univariate tests easily because the components are independent (RH 0 for large values of p j=1 T j 2, which is χ 2 p under H 0).
83 Definition Inference Which T j should we choose? Student: T j = n Ȳ.j s.j = 1 n n i=1 Y ij s.j = 1 n n i=1 Sign(Y ij ) Y ij s.j This yields a multivariate Student test (φ N, say), which unfortunately suffers the same drawbacks as classical Gaussian tests:
84 Definition Inference Which T j should we choose? Student: T j = n Ȳ.j s.j = 1 n n i=1 Y ij s.j = 1 n n i=1 Sign(Y ij ) Y ij s.j This yields a multivariate Student test (φ N, say), which unfortunately suffers the same drawbacks as classical Gaussian tests: It cannot deal with heavy tails. It is poorly robust.
85 Definition Inference Which T j should we choose? Student: T j = n Ȳ.j s.j = 1 n n i=1 Y ij s.j = 1 n n i=1 Sign(Y ij ) Y ij s.j This yields a multivariate Student test (φ N, say), which unfortunately suffers the same drawbacks as classical Gaussian tests: It cannot deal with heavy tails. It is poorly robust.
86 Definition Inference Which T j should we choose? Student: T j = n Ȳ.j s.j = 1 n n i=1 Y ij s.j = 1 n n i=1 Sign(Y ij ) Y ij s.j This yields a multivariate Student test (φ N, say), which unfortunately suffers the same drawbacks as classical Gaussian tests: It cannot deal with heavy tails. It is poorly robust.
87 Definition Inference Which T j should we choose? Student: T j = n Ȳ.j s.j = 1 n T j := 1 n at the multinormal, where n i=1 n i=1 Y ij s.j = 1 n n i=1 Sign(Y ij ) Y ij s.j, ( Sign(Y ij )Φ 1 Rij ) +, n + 1 R ij denotes the rank of Y ij among Y 1j,..., Y nj, and Φ + (z) = P[ N(0, 1) z ].
88 Definition Inference How good is the resulting test ( φ N, say), which rejects H 0 for large values of p j=1 T j 2? It is fairly robust to outliers It can deal with heavy tails
89 Definition Inference How good is the resulting test ( φ N, say), which rejects H 0 for large values of p j=1 T j 2? and... It is fairly robust to outliers It can deal with heavy tails it is, at the multinormal, as powerful as φ N! (since T j = T j + o P (1) at the multinormal)
90 Definition Inference How good is the resulting test ( φ N, say), which rejects H 0 for large values of p j=1 T j 2? and... It is fairly robust to outliers It can deal with heavy tails it is, at the multinormal, as powerful as φ N! (since T j = T j + o P (1) at the multinormal) A natural question: How does it compare with φ N (in terms of power) away from the multinormal?
91 Definition Inference The answer is in favor of our rank test: Theorem The asymptotic relative efficiency (ARE) of φ N with respect to φ N under µ = n 1/2 τ, A, and (g 1,..., g p ) is of the form ARE = p j=1 w j(a,τ) c(g j ) p j=1 w j(a,τ), w j (A,τ) 0. g j t 3 t 6 t 12 N e 2 e 3 e Table: Various values of c(g j ).
92 Definition Inference Actually, c(g j ) 1 for all g j, which implies that φ N is always (asymptotically) more powerful than the Student test φ N!
93 Definition Inference Actually, c(g j ) 1 for all g j, which implies that φ N is always (asymptotically) more powerful than the Student test φ N! Our tests therefore dominate the Student ones both in terms of robustness and efficiency!
94 Definition Inference Remark: rather than Gaussian scores" as in T j = 1 n n i=1 ( Sign(Y ij )Φ 1 Rij ) +, n + 1 one can use (more robust) Wilcoxon scores T j := 3 n n R ij Sign(Y ij ) n + 1 i=1 or (even more robust) sign scores T j := 1 n n Sign(Y ij ). i=1
95 Definition Inference Efficiency is then not as good, as a price for the better robustness... g j t 3 t 6 t 12 N e 2 e 3 e 5 φ N test φw φ S Table: Various values of c(g j ) for our Gaussian, Wilcoxon, and sign tests.
96 Definition Inference Original data
97 Definition Inference 95% confidence zone Gaussian method
98 Definition Inference 95% confidence zone our φ N IC method
99 Definition Inference 95% confidence zone our φ W IC method
100 Definition Inference 95% confidence zone our φ S IC method
101 Definition Inference Original data
102 Definition Inference Contaminated data
103 Definition Inference 95% confidence zone Gaussian method
104 Definition Inference 95% confidence zone our φ N IC method
105 Definition Inference 95% confidence zone our φ W IC method
106 Definition Inference 95% confidence zone our φ S IC method
107 Conclusion Introduction Definition Inference provide quite flexible semiparametric models for multivariate statistics. Rank methods are efficient and robust alternatives to Gaussian methods.
108 Appendix References References I Oja, H., Sirkiä, S., & J. Eriksson (2006). Scatter matrices and independent component analysis, Austrian Journal of Statistics 35, Oja, H., Nordhausen, K., & D. Paindaveine (2007). Signed-rank tests for location in the symmetric independent component model, ECORE DP 2007/123. Submitted. Oja, H., Paindaveine, D., & S. Taskinen (2008). Parametric and nonparametric tests for multivariate independence in. Manuscript in preparation.
Invariant coordinate selection for multivariate data analysis - the package ICS
 Invariant coordinate selection for multivariate data analysis - the package ICS Klaus Nordhausen 1 Hannu Oja 1 David E. Tyler 2 1 Tampere School of Public Health University of Tampere 2 Department of Statistics
Scatter Matrices and Independent Component Analysis
 AUSTRIAN JOURNAL OF STATISTICS Volume 35 (2006), Number 2&3, 175 189 Scatter Matrices and Independent Component Analysis Hannu Oja 1, Seija Sirkiä 2, and Jan Eriksson 3 1 University of Tampere, Finland
Characteristics of multivariate distributions and the invariant coordinate system
 Characteristics of multivariate distributions the invariant coordinate system Pauliina Ilmonen, Jaakko Nevalainen, Hannu Oja To cite this version: Pauliina Ilmonen, Jaakko Nevalainen, Hannu Oja. Characteristics
MULTICHANNEL SIGNAL PROCESSING USING SPATIAL RANK COVARIANCE MATRICES
 MULTICHANNEL SIGNAL PROCESSING USING SPATIAL RANK COVARIANCE MATRICES S. Visuri 1 H. Oja V. Koivunen 1 1 Signal Processing Lab. Dept. of Statistics Tampere Univ. of Technology University of Jyväskylä P.O.
Multivariate Statistics
 Multivariate Statistics Chapter 2: Multivariate distributions and inference Pedro Galeano Departamento de Estadística Universidad Carlos III de Madrid pedro.galeano@uc3m.es Course 2016/2017 Master in Mathematical
Independent component analysis for functional data
 Independent component analysis for functional data Hannu Oja Department of Mathematics and Statistics University of Turku Version 12.8.216 August 216 Oja (UTU) FICA Date bottom 1 / 38 Outline 1 Probability
MS-E2112 Multivariate Statistical Analysis (5cr) Lecture 1: Introduction, Multivariate Location and Scatter
 Lecture 1: Introduction, Multivariate Location and Scatter") MS-E2112 Multivariate Statistical Analysis (5cr) Lecture 1:, Multivariate Location Contents , pauliina.ilmonen(a)aalto.fi Lectures on Mondays 12.15-14.00 (2.1. - 6.2., 20.2. - 27.3.), U147 (U5) Exercises
MS-E2112 Multivariate Statistical Analysis (5cr) Lecture 1:, Multivariate Location Contents , pauliina.ilmonen(a)aalto.fi Lectures on Mondays 12.15-14.00 (2.1. - 6.2., 20.2. - 27.3.), U147 (U5) Exercises
Signed-rank Tests for Location in the Symmetric Independent Component Model
 Signed-rank Tests for Location in the Symmetric Independent Component Model Klaus Nordhausen a, Hannu Oja a Davy Paindaveine b a Tampere School of Public Health, University of Tampere, 33014 University
Multivariate Distributions
 IEOR E4602: Quantitative Risk Management Spring 2016 c 2016 by Martin Haugh Multivariate Distributions We will study multivariate distributions in these notes, focusing 1 in particular on multivariate
A more efficient second order blind identification method for separation of uncorrelated stationary time series
 A more efficient second order blind identification method for separation of uncorrelated stationary time series Sara Taskinen 1a, Jari Miettinen a, Klaus Nordhausen b,c a Department of Mathematics and
Gatsby Theoretical Neuroscience Lectures: Non-Gaussian statistics and natural images Parts I-II
 Gatsby Theoretical Neuroscience Lectures: Non-Gaussian statistics and natural images Parts I-II Gatsby Unit University College London 27 Feb 2017 Outline Part I: Theory of ICA Definition and difference
PROBABILITY DISTRIBUTIONS. J. Elder CSE 6390/PSYC 6225 Computational Modeling of Visual Perception
 PROBABILITY DISTRIBUTIONS Credits 2 These slides were sourced and/or modified from: Christopher Bishop, Microsoft UK Parametric Distributions 3 Basic building blocks: Need to determine given Representation:
Introduction to Machine Learning
 10-701 Introduction to Machine Learning PCA Slides based on 18-661 Fall 2018 PCA Raw data can be Complex, High-dimensional To understand a phenomenon we measure various related quantities If we knew what
CIFAR Lectures: Non-Gaussian statistics and natural images
 CIFAR Lectures: Non-Gaussian statistics and natural images Dept of Computer Science University of Helsinki, Finland Outline Part I: Theory of ICA Definition and difference to PCA Importance of non-gaussianity
On Independent Component Analysis
 On Independent Component Analysis Université libre de Bruxelles European Centre for Advanced Research in Economics and Statistics (ECARES) Solvay Brussels School of Economics and Management Symmetric Outline
A Conditional Approach to Modeling Multivariate Extremes
 A Approach to ing Multivariate Extremes By Heffernan & Tawn Department of Statistics Purdue University s April 30, 2014 Outline s s Multivariate Extremes s A central aim of multivariate extremes is trying
Independent Component Analysis. PhD Seminar Jörgen Ungh
 Independent Component Analysis PhD Seminar Jörgen Ungh Agenda Background a motivater Independence ICA vs. PCA Gaussian data ICA theory Examples Background & motivation The cocktail party problem Bla bla
Principal Component Analysis vs. Independent Component Analysis for Damage Detection
 6th European Workshop on Structural Health Monitoring - Fr..D.4 Principal Component Analysis vs. Independent Component Analysis for Damage Detection D. A. TIBADUIZA, L. E. MUJICA, M. ANAYA, J. RODELLAR
Probability and Statistics Notes
 Probability and Statistics Notes Chapter Seven Jesse Crawford Department of Mathematics Tarleton State University Spring 2011 (Tarleton State University) Chapter Seven Notes Spring 2011 1 / 42 Outline
Independent Component Analysis and Its Applications. By Qing Xue, 10/15/2004
 Independent Component Analysis and Its Applications By Qing Xue, 10/15/2004 Outline Motivation of ICA Applications of ICA Principles of ICA estimation Algorithms for ICA Extensions of basic ICA framework
Stat260: Bayesian Modeling and Inference Lecture Date: February 10th, Jeffreys priors. exp 1 ) p 2
 p 2") Stat260: Bayesian Modeling and Inference Lecture Date: February 10th, 2010 Jeffreys priors Lecturer: Michael I. Jordan Scribe: Timothy Hunter 1 Priors for the multivariate Gaussian Consider a multivariate
Stat260: Bayesian Modeling and Inference Lecture Date: February 10th, 2010 Jeffreys priors Lecturer: Michael I. Jordan Scribe: Timothy Hunter 1 Priors for the multivariate Gaussian Consider a multivariate
Robust Subspace DOA Estimation for Wireless Communications
 Robust Subspace DOA Estimation for Wireless Communications Samuli Visuri Hannu Oja ¾ Visa Koivunen Laboratory of Signal Processing Computer Technology Helsinki Univ. of Technology P.O. Box 3, FIN-25 HUT
Why is the field of statistics still an active one?
 Why is the field of statistics still an active one? It s obvious that one needs statistics: to describe experimental data in a compact way, to compare datasets, to ask whether data are consistent with
CHAPTER 17 CHI-SQUARE AND OTHER NONPARAMETRIC TESTS FROM: PAGANO, R. R. (2007)
") FROM: PAGANO, R. R. (007) I. INTRODUCTION: DISTINCTION BETWEEN PARAMETRIC AND NON-PARAMETRIC TESTS Statistical inference tests are often classified as to whether they are parametric or nonparametric Parameter
FROM: PAGANO, R. R. (007) I. INTRODUCTION: DISTINCTION BETWEEN PARAMETRIC AND NON-PARAMETRIC TESTS Statistical inference tests are often classified as to whether they are parametric or nonparametric Parameter
x. Figure 1: Examples of univariate Gaussian pdfs N (x; µ, σ 2 ).
.") .8.6 µ =, σ = 1 µ = 1, σ = 1 / µ =, σ =.. 3 1 1 3 x Figure 1: Examples of univariate Gaussian pdfs N (x; µ, σ ). The Gaussian distribution Probably the most-important distribution in all of statistics
.8.6 µ =, σ = 1 µ = 1, σ = 1 / µ =, σ =.. 3 1 1 3 x Figure 1: Examples of univariate Gaussian pdfs N (x; µ, σ ). The Gaussian distribution Probably the most-important distribution in all of statistics
Package SpatialNP. June 5, 2018
 Type Package Package SpatialNP June 5, 2018 Title Multivariate Nonparametric Methods Based on Spatial Signs and Ranks Version 1.1-3 Date 2018-06-05 Author Seija Sirkia, Jari Miettinen, Klaus Nordhausen,
STAT 4385 Topic 01: Introduction & Review
 STAT 4385 Topic 01: Introduction & Review Xiaogang Su, Ph.D. Department of Mathematical Science University of Texas at El Paso xsu@utep.edu Spring, 2016 Outline Welcome What is Regression Analysis? Basics
Introduction to Statistical Inference Lecture 10: ANOVA, Kruskal-Wallis Test
 Introduction to Statistical Inference Lecture 10: ANOVA, Kruskal-Wallis Test la Contents The two sample t-test generalizes into Analysis of Variance. In analysis of variance ANOVA the population consists
STA 4273H: Statistical Machine Learning
 STA 4273H: Statistical Machine Learning Russ Salakhutdinov Department of Computer Science! Department of Statistical Sciences! rsalakhu@cs.toronto.edu! h0p://www.cs.utoronto.ca/~rsalakhu/ Lecture 7 Approximate
-Principal components analysis is by far the oldest multivariate technique, dating back to the early 1900's; ecologists have used PCA since the
 1 2 3 -Principal components analysis is by far the oldest multivariate technique, dating back to the early 1900's; ecologists have used PCA since the 1950's. -PCA is based on covariance or correlation
A Probability Review
 A Probability Review Outline: A probability review Shorthand notation: RV stands for random variable EE 527, Detection and Estimation Theory, # 0b 1 A Probability Review Reading: Go over handouts 2 5 in
PCA & ICA. CE-717: Machine Learning Sharif University of Technology Spring Soleymani
 PCA & ICA CE-717: Machine Learning Sharif University of Technology Spring 2015 Soleymani Dimensionality Reduction: Feature Selection vs. Feature Extraction Feature selection Select a subset of a given
Practical tests for randomized complete block designs
 Journal of Multivariate Analysis 96 (2005) 73 92 www.elsevier.com/locate/jmva Practical tests for randomized complete block designs Ziyad R. Mahfoud a,, Ronald H. Randles b a American University of Beirut,
Multivariate Distributions
 Copyright Cosma Rohilla Shalizi; do not distribute without permission updates at http://www.stat.cmu.edu/~cshalizi/adafaepov/ Appendix E Multivariate Distributions E.1 Review of Definitions Let s review
The ICS Package. May 4, 2007
 Type Package The ICS Package May 4, 2007 Title ICS / ICA Computation Based on two Scatter Matrices Version 1.0-0 Date 2007-05-04 Author Klaus Nordhausen, Hannu Oja, Dave Tyler Maintainer Klaus Nordhausen
Introduction to Independent Component Analysis. Jingmei Lu and Xixi Lu. Abstract
 Final Project 2//25 Introduction to Independent Component Analysis Abstract Independent Component Analysis (ICA) can be used to solve blind signal separation problem. In this article, we introduce definition
Contents 1. Contents
 Contents 1 Contents 1 One-Sample Methods 3 1.1 Parametric Methods.................... 4 1.1.1 One-sample Z-test (see Chapter 0.3.1)...... 4 1.1.2 One-sample t-test................. 6 1.1.3 Large sample
VARIABLE SELECTION AND INDEPENDENT COMPONENT
 VARIABLE SELECTION AND INDEPENDENT COMPONENT ANALYSIS, PLUS TWO ADVERTS Richard Samworth University of Cambridge Joint work with Rajen Shah and Ming Yuan My core research interests A broad range of methodological
Dr. Maddah ENMG 617 EM Statistics 10/12/12. Nonparametric Statistics (Chapter 16, Hines)
") Dr. Maddah ENMG 617 EM Statistics 10/12/12 Nonparametric Statistics (Chapter 16, Hines) Introduction Most of the hypothesis testing presented so far assumes normally distributed data. These approaches
Dr. Maddah ENMG 617 EM Statistics 10/12/12 Nonparametric Statistics (Chapter 16, Hines) Introduction Most of the hypothesis testing presented so far assumes normally distributed data. These approaches
HST.582J/6.555J/16.456J
 Blind Source Separation: PCA & ICA HST.582J/6.555J/16.456J Gari D. Clifford gari [at] mit. edu http://www.mit.edu/~gari G. D. Clifford 2005-2009 What is BSS? Assume an observation (signal) is a linear
Statistical Pattern Recognition
 Statistical Pattern Recognition Feature Extraction Hamid R. Rabiee Jafar Muhammadi, Alireza Ghasemi, Payam Siyari Spring 2014 http://ce.sharif.edu/courses/92-93/2/ce725-2/ Agenda Dimensionality Reduction
STATS 306B: Unsupervised Learning Spring Lecture 2 April 2
 STATS 306B: Unsupervised Learning Spring 2014 Lecture 2 April 2 Lecturer: Lester Mackey Scribe: Junyang Qian, Minzhe Wang 2.1 Recap In the last lecture, we formulated our working definition of unsupervised
Advanced Statistics II: Non Parametric Tests
 Advanced Statistics II: Non Parametric Tests Aurélien Garivier ParisTech February 27, 2011 Outline Fitting a distribution Rank Tests for the comparison of two samples Two unrelated samples: Mann-Whitney
Dimension reduction, PCA & eigenanalysis Based in part on slides from textbook, slides of Susan Holmes. October 3, Statistics 202: Data Mining
 Dimension reduction, PCA & eigenanalysis Based in part on slides from textbook, slides of Susan Holmes October 3, 2012 1 / 1 Combinations of features Given a data matrix X n p with p fairly large, it can
robustness, efficiency, breakdown point, outliers, rank-based procedures, least absolute regression
 Robust Statistics robustness, efficiency, breakdown point, outliers, rank-based procedures, least absolute regression University of California, San Diego Instructor: Ery Arias-Castro http://math.ucsd.edu/~eariasca/teaching.html
A simple graphical method to explore tail-dependence in stock-return pairs
 A simple graphical method to explore tail-dependence in stock-return pairs Klaus Abberger, University of Konstanz, Germany Abstract: For a bivariate data set the dependence structure can not only be measured
Semi-parametric predictive inference for bivariate data using copulas
 Semi-parametric predictive inference for bivariate data using copulas Tahani Coolen-Maturi a, Frank P.A. Coolen b,, Noryanti Muhammad b a Durham University Business School, Durham University, Durham, DH1
Tentative solutions TMA4255 Applied Statistics 16 May, 2015
 Norwegian University of Science and Technology Department of Mathematical Sciences Page of 9 Tentative solutions TMA455 Applied Statistics 6 May, 05 Problem Manufacturer of fertilizers a) Are these independent
Dimension Reduction Techniques. Presented by Jie (Jerry) Yu
 Yu") Dimension Reduction Techniques Presented by Jie (Jerry) Yu Outline Problem Modeling Review of PCA and MDS Isomap Local Linear Embedding (LLE) Charting Background Advances in data collection and storage
Dimension Reduction Techniques Presented by Jie (Jerry) Yu Outline Problem Modeling Review of PCA and MDS Isomap Local Linear Embedding (LLE) Charting Background Advances in data collection and storage
Independent Component Analysis
 000 001 002 003 004 005 006 007 008 009 010 011 012 013 014 015 016 017 018 019 020 021 022 023 024 025 026 027 028 029 030 031 032 033 034 035 036 037 038 039 040 041 042 043 044 1 Introduction Indepent
Unconstrained Ordination
 Unconstrained Ordination Sites Species A Species B Species C Species D Species E 1 0 (1) 5 (1) 1 (1) 10 (4) 10 (4) 2 2 (3) 8 (3) 4 (3) 12 (6) 20 (6) 3 8 (6) 20 (6) 10 (6) 1 (2) 3 (2) 4 4 (5) 11 (5) 8 (5)
Second-Order Inference for Gaussian Random Curves
 Second-Order Inference for Gaussian Random Curves With Application to DNA Minicircles Victor Panaretos David Kraus John Maddocks Ecole Polytechnique Fédérale de Lausanne Panaretos, Kraus, Maddocks (EPFL)
Basics of Multivariate Modelling and Data Analysis
 Basics of Multivariate Modelling and Data Analysis Kurt-Erik Häggblom 6. Principal component analysis (PCA) 6.1 Overview 6.2 Essentials of PCA 6.3 Numerical calculation of PCs 6.4 Effects of data preprocessing
Robust scale estimation with extensions
 Robust scale estimation with extensions Garth Tarr, Samuel Müller and Neville Weber School of Mathematics and Statistics THE UNIVERSITY OF SYDNEY Outline The robust scale estimator P n Robust covariance
Symmetrised M-estimators of multivariate scatter
 Journal of Multivariate Analysis 98 (007) 1611 169 www.elsevier.com/locate/jmva Symmetrised M-estimators of multivariate scatter Seija Sirkiä a,, Sara Taskinen a, Hannu Oja b a Department of Mathematics
HST.582J / 6.555J / J Biomedical Signal and Image Processing Spring 2007
 MIT OpenCourseWare http://ocw.mit.edu HST.582J / 6.555J / 16.456J Biomedical Signal and Image Processing Spring 2007 For information about citing these materials or our Terms of Use, visit: http://ocw.mit.edu/terms.
Independent Component Analysis and Its Application on Accelerator Physics
 Independent Component Analysis and Its Application on Accelerator Physics Xiaoying Pang LA-UR-12-20069 ICA and PCA Similarities: Blind source separation method (BSS) no model Observed signals are linear
Gaussian processes. Chuong B. Do (updated by Honglak Lee) November 22, 2008
 November 22, 2008") Gaussian processes Chuong B Do (updated by Honglak Lee) November 22, 2008 Many of the classical machine learning algorithms that we talked about during the first half of this course fit the following pattern:
Gaussian processes Chuong B Do (updated by Honglak Lee) November 22, 2008 Many of the classical machine learning algorithms that we talked about during the first half of this course fit the following pattern:
Plug-in Measure-Transformed Quasi Likelihood Ratio Test for Random Signal Detection
 Plug-in Measure-Transformed Quasi Likelihood Ratio Test for Random Signal Detection Nir Halay and Koby Todros Dept. of ECE, Ben-Gurion University of the Negev, Beer-Sheva, Israel February 13, 2017 1 /
Multivariate Normal-Laplace Distribution and Processes
 CHAPTER 4 Multivariate Normal-Laplace Distribution and Processes The normal-laplace distribution, which results from the convolution of independent normal and Laplace random variables is introduced by
TABLES AND FORMULAS FOR MOORE Basic Practice of Statistics
 TABLES AND FORMULAS FOR MOORE Basic Practice of Statistics Exploring Data: Distributions Look for overall pattern (shape, center, spread) and deviations (outliers). Mean (use a calculator): x = x 1 + x
Stat 5101 Lecture Notes
 Stat 5101 Lecture Notes Charles J. Geyer Copyright 1998, 1999, 2000, 2001 by Charles J. Geyer May 7, 2001 ii Stat 5101 (Geyer) Course Notes Contents 1 Random Variables and Change of Variables 1 1.1 Random
Nonparametric Location Tests: k-sample
 Nonparametric Location Tests: k-sample Nathaniel E. Helwig Assistant Professor of Psychology and Statistics University of Minnesota (Twin Cities) Updated 04-Jan-2017 Nathaniel E. Helwig (U of Minnesota)
ROBUST ESTIMATION OF A CORRELATION COEFFICIENT: AN ATTEMPT OF SURVEY
 ROBUST ESTIMATION OF A CORRELATION COEFFICIENT: AN ATTEMPT OF SURVEY G.L. Shevlyakov, P.O. Smirnov St. Petersburg State Polytechnic University St.Petersburg, RUSSIA E-mail: Georgy.Shevlyakov@gmail.com
Multiple Random Variables
 Multiple Random Variables Joint Probability Density Let X and Y be two random variables. Their joint distribution function is F ( XY x, y) P X x Y y. F XY ( ) 1, < x
What s New in Econometrics? Lecture 14 Quantile Methods
 What s New in Econometrics? Lecture 14 Quantile Methods Jeff Wooldridge NBER Summer Institute, 2007 1. Reminders About Means, Medians, and Quantiles 2. Some Useful Asymptotic Results 3. Quantile Regression
CS168: The Modern Algorithmic Toolbox Lecture #7: Understanding Principal Component Analysis (PCA)
") CS68: The Modern Algorithmic Toolbox Lecture #7: Understanding Principal Component Analysis (PCA) Tim Roughgarden & Gregory Valiant April 0, 05 Introduction. Lecture Goal Principal components analysis
CS68: The Modern Algorithmic Toolbox Lecture #7: Understanding Principal Component Analysis (PCA) Tim Roughgarden & Gregory Valiant April 0, 05 Introduction. Lecture Goal Principal components analysis
MTTS1 Dimensionality Reduction and Visualization Spring 2014 Jaakko Peltonen
 MTTS1 Dimensionality Reduction and Visualization Spring 2014 Jaakko Peltonen Lecture 3: Linear feature extraction Feature extraction feature extraction: (more general) transform the original to (k < d).
Glossary. The ISI glossary of statistical terms provides definitions in a number of different languages:
 Glossary The ISI glossary of statistical terms provides definitions in a number of different languages: http://isi.cbs.nl/glossary/index.htm Adjusted r 2 Adjusted R squared measures the proportion of the
Dimensionality Reduction. CS57300 Data Mining Fall Instructor: Bruno Ribeiro
 Dimensionality Reduction CS57300 Data Mining Fall 2016 Instructor: Bruno Ribeiro Goal } Visualize high dimensional data (and understand its Geometry) } Project the data into lower dimensional spaces }
AN IMPROVEMENT TO THE ALIGNED RANK STATISTIC
 Journal of Applied Statistical Science ISSN 1067-5817 Volume 14, Number 3/4, pp. 225-235 2005 Nova Science Publishers, Inc. AN IMPROVEMENT TO THE ALIGNED RANK STATISTIC FOR TWO-FACTOR ANALYSIS OF VARIANCE
Statistical Inference: Estimation and Confidence Intervals Hypothesis Testing
 Statistical Inference: Estimation and Confidence Intervals Hypothesis Testing 1 In most statistics problems, we assume that the data have been generated from some unknown probability distribution. We desire
Independent Component Analysis
 1 Independent Component Analysis Background paper: http://www-stat.stanford.edu/ hastie/papers/ica.pdf 2 ICA Problem X = AS where X is a random p-vector representing multivariate input measurements. S
Advanced Introduction to Machine Learning
 10-715 Advanced Introduction to Machine Learning Homework 3 Due Nov 12, 10.30 am Rules 1. Homework is due on the due date at 10.30 am. Please hand over your homework at the beginning of class. Please see
Statistics 202: Data Mining. c Jonathan Taylor. Week 2 Based in part on slides from textbook, slides of Susan Holmes. October 3, / 1
 Week 2 Based in part on slides from textbook, slides of Susan Holmes October 3, 2012 1 / 1 Part I Other datatypes, preprocessing 2 / 1 Other datatypes Document data You might start with a collection of
Part I. Other datatypes, preprocessing. Other datatypes. Other datatypes. Week 2 Based in part on slides from textbook, slides of Susan Holmes
 Week 2 Based in part on slides from textbook, slides of Susan Holmes Part I Other datatypes, preprocessing October 3, 2012 1 / 1 2 / 1 Other datatypes Other datatypes Document data You might start with
Nonstationary spatial process modeling Part II Paul D. Sampson --- Catherine Calder Univ of Washington --- Ohio State University
 Nonstationary spatial process modeling Part II Paul D. Sampson --- Catherine Calder Univ of Washington --- Ohio State University this presentation derived from that presented at the Pan-American Advanced
Semiparametric Gaussian Copula Models: Progress and Problems
 Semiparametric Gaussian Copula Models: Progress and Problems Jon A. Wellner University of Washington, Seattle 2015 IMS China, Kunming July 1-4, 2015 2015 IMS China Meeting, Kunming Based on joint work
The Multivariate Gaussian Distribution
 The Multivariate Gaussian Distribution Chuong B. Do October, 8 A vector-valued random variable X = T X X n is said to have a multivariate normal or Gaussian) distribution with mean µ R n and covariance
Statistical Significance of Ranking Paradoxes
 Statistical Significance of Ranking Paradoxes Anna E. Bargagliotti and Raymond N. Greenwell 1 February 28, 2009 1 Anna E. Bargagliotti is an Assistant Professor in the Department of Mathematical Sciences
INVARIANT COORDINATE SELECTION
 INVARIANT COORDINATE SELECTION By David E. Tyler 1, Frank Critchley, Lutz Dümbgen 2, and Hannu Oja Rutgers University, Open University, University of Berne and University of Tampere SUMMARY A general method
Principle Components Analysis (PCA) Relationship Between a Linear Combination of Variables and Axes Rotation for PCA
 Relationship Between a Linear Combination of Variables and Axes Rotation for PCA") Principle Components Analysis (PCA) Relationship Between a Linear Combination of Variables and Axes Rotation for PCA Principle Components Analysis: Uses one group of variables (we will call this X) In
Principle Components Analysis (PCA) Relationship Between a Linear Combination of Variables and Axes Rotation for PCA Principle Components Analysis: Uses one group of variables (we will call this X) In
Lecture 16: Small Sample Size Problems (Covariance Estimation) Many thanks to Carlos Thomaz who authored the original version of these slides
 Many thanks to Carlos Thomaz who authored the original version of these slides") Lecture 16: Small Sample Size Problems (Covariance Estimation) Many thanks to Carlos Thomaz who authored the original version of these slides Intelligent Data Analysis and Probabilistic Inference Lecture
Lecture 16: Small Sample Size Problems (Covariance Estimation) Many thanks to Carlos Thomaz who authored the original version of these slides Intelligent Data Analysis and Probabilistic Inference Lecture
Testing Statistical Hypotheses
 E.L. Lehmann Joseph P. Romano Testing Statistical Hypotheses Third Edition 4y Springer Preface vii I Small-Sample Theory 1 1 The General Decision Problem 3 1.1 Statistical Inference and Statistical Decisions
GARCH Models Estimation and Inference
 GARCH Models Estimation and Inference Eduardo Rossi University of Pavia December 013 Rossi GARCH Financial Econometrics - 013 1 / 1 Likelihood function The procedure most often used in estimating θ 0 in
I L L I N O I S UNIVERSITY OF ILLINOIS AT URBANA-CHAMPAIGN
 Comparisons of Two Means Edps/Soc 584 and Psych 594 Applied Multivariate Statistics Carolyn J. Anderson Department of Educational Psychology I L L I N O I S UNIVERSITY OF ILLINOIS AT URBANA-CHAMPAIGN c
Semiparametric Gaussian Copula Models: Progress and Problems
 Semiparametric Gaussian Copula Models: Progress and Problems Jon A. Wellner University of Washington, Seattle European Meeting of Statisticians, Amsterdam July 6-10, 2015 EMS Meeting, Amsterdam Based on
Multivariate-sign-based high-dimensional tests for sphericity
 Biometrika (2013, xx, x, pp. 1 8 C 2012 Biometrika Trust Printed in Great Britain Multivariate-sign-based high-dimensional tests for sphericity BY CHANGLIANG ZOU, LIUHUA PENG, LONG FENG AND ZHAOJUN WANG
Bayesian linear regression
 Bayesian linear regression Linear regression is the basis of most statistical modeling. The model is Y i = X T i β + ε i, where Y i is the continuous response X i = (X i1,..., X ip ) T is the corresponding
Review of Statistics
 Review of Statistics Topics Descriptive Statistics Mean, Variance Probability Union event, joint event Random Variables Discrete and Continuous Distributions, Moments Two Random Variables Covariance and
Asymptotic behaviour of multivariate default probabilities and default correlations under stress
 Asymptotic behaviour of multivariate default probabilities and default correlations under stress 7th General AMaMeF and Swissquote Conference EPFL, Lausanne Natalie Packham joint with Michael Kalkbrener
MIT Spring 2015
 Regression Analysis MIT 18.472 Dr. Kempthorne Spring 2015 1 Outline Regression Analysis 1 Regression Analysis 2 Multiple Linear Regression: Setup Data Set n cases i = 1, 2,..., n 1 Response (dependent)
ON SMALL SAMPLE PROPERTIES OF PERMUTATION TESTS: INDEPENDENCE BETWEEN TWO SAMPLES
 ON SMALL SAMPLE PROPERTIES OF PERMUTATION TESTS: INDEPENDENCE BETWEEN TWO SAMPLES Hisashi Tanizaki Graduate School of Economics, Kobe University, Kobe 657-8501, Japan e-mail: tanizaki@kobe-u.ac.jp Abstract:
1 Data Arrays and Decompositions
 1 Data Arrays and Decompositions 1.1 Variance Matrices and Eigenstructure Consider a p p positive definite and symmetric matrix V - a model parameter or a sample variance matrix. The eigenstructure is
Applied Multivariate and Longitudinal Data Analysis
 Applied Multivariate and Longitudinal Data Analysis Chapter 2: Inference about the mean vector(s) Ana-Maria Staicu SAS Hall 5220; 919-515-0644; astaicu@ncsu.edu 1 In this chapter we will discuss inference
PMR Learning as Inference
 Outline PMR Learning as Inference Probabilistic Modelling and Reasoning Amos Storkey Modelling 2 The Exponential Family 3 Bayesian Sets School of Informatics, University of Edinburgh Amos Storkey PMR Learning
Multivariate Non-Normally Distributed Random Variables
 Multivariate Non-Normally Distributed Random Variables An Introduction to the Copula Approach Workgroup seminar on climate dynamics Meteorological Institute at the University of Bonn 18 January 2008, Bonn
A Peak to the World of Multivariate Statistical Analysis
 A Peak to the World of Multivariate Statistical Analysis Real Contents Real Real Real Why is it important to know a bit about the theory behind the methods? Real 5 10 15 20 Real 10 15 20 Figure: Multivariate
PATTERN RECOGNITION AND MACHINE LEARNING CHAPTER 2: PROBABILITY DISTRIBUTIONS
 PATTERN RECOGNITION AND MACHINE LEARNING CHAPTER 2: PROBABILITY DISTRIBUTIONS Parametric Distributions Basic building blocks: Need to determine given Representation: or? Recall Curve Fitting Binary Variables
Quantile Regression for Extraordinarily Large Data
 Quantile Regression for Extraordinarily Large Data Shih-Kang Chao Department of Statistics Purdue University November, 2016 A joint work with Stanislav Volgushev and Guang Cheng Quantile regression Two-step