Model Fitting. Jean Yves Le Boudec
|
|
|
- Bridget Payne
- 6 years ago
- Views:
Transcription
1 Model Fitting Jean Yves Le Boudec 0
2 Contents 1. What is model fitting? 2. Linear Regression 3. Linear regression with norm minimization 4. Choosing a distribution 5. Heavy Tail 1
3 Virus Infection Data We would like to capture the growth of infected hosts (explanatory model) An exponential model seems appropriate How can we fit the model, in particular, what is the value of? 2
4 Least Square Fit of Virus Infection Data = Mean doubling time 1.34 hours Prediction at +6 hours: hosts Least square fit 3
5 Least Square Fit of Virus Infection Data In Log Scale = 0.39 Mean doubling time 1.77 hours Prediction at +6 hours: hosts Least square fit 4
6 Compare the Two LS fit in natural scale LS fit in log scale 5
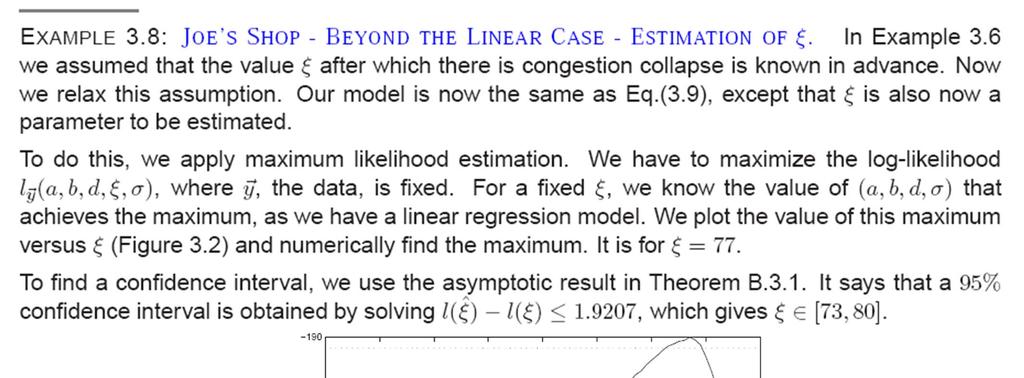
7 Which Fitting Method should I use? Which optimization criterion should I use? The answer is in a statistical model. Model not only the interesting part, but also the noise For example =
8 = 0.39 How can I tell which is correct? 7
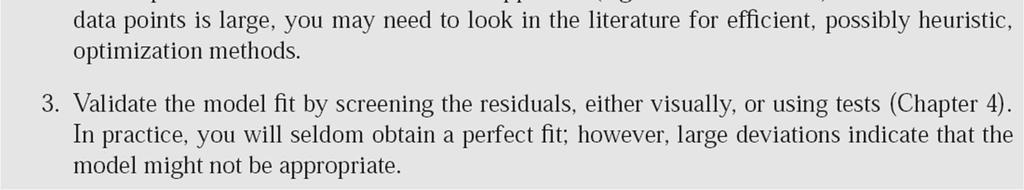
9 Look at Residuals = validate model 8

10 9

11 Least Square Fit = Gaussian iid Noise Assume model (homoscedasticity) The theorem says: minimize least squares = compute MLE for this model This is how we computed the estimates for the virus example 10
12 Least Square and Projection Data point Predicted response Manifold Where the data point would lie if there would be no noise Estimated parameter Skrivañ war an daol petra zo: data point, predicted response and estimated parameter for virus example 11

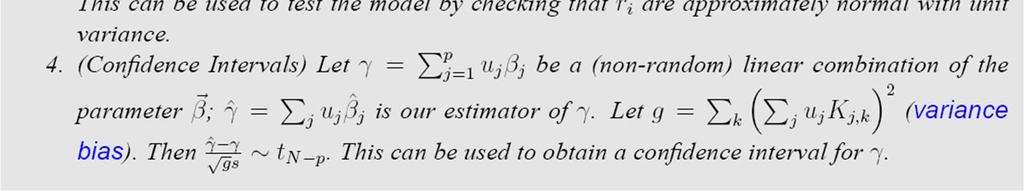
13 Confidence Intervals 12

14 13

15 Robustness to «Outliers» 14
16 A Simple Example Least Square Model: noise L1 Norm Minimization Model : noise What is m? What is m? Confidence interval? Confidence interval? 15
17 Mean Versus Median 16

18 Also called «ANOVA» (Analysis of Variance») 2. Linear Regression = least square + linear dependence on parameter A special case where computations are easy 17
19 Example 4.3 What is the parameter? Is it a linear model? How many degrees of freedom? What do we assume on i? What is the matrix X? 18
20 19
21 Does this model have full rank? 20
22 Some Terminology x i are called explanatory variable Assumed fixed and known y i are called response variables They are «the data» Assumed to be one sample output of the model 21

23 Least Square and Projection Data point Predicted response Manifold Where the data point would lie if there would be no noise Estimated parameter 22


24 Solution of the Linear Regression Model 23
25 Least Square and Projection The theorem gives H and K residuals data Predicted response Manifold Where the data point would lie if there would be no noise Estimated parameter 24
26 The Theorem Gives with Confidence Interval 25

27 SSR Confidence Intervals use the quantity s s 2 is called «Sum of Squared Residuals» residuals data Predicted response 26

28 Validate the Assumptions with Residuals 27

29 Residuals are given by the theorem Residuals residuals data Predicted response 28
30 Standardized Residuals The residuals e i are an estimate of the noise terms i They are not (exactly) normal iid The variance of e i is???? A: 1 H i,i Standardized residuals are not exactly normal iid either but their variance is 1 29
31 Which of these two models could be a linear regression model? A: both Linear regression does not mean that y i is a linear function of x i Achtung: There isa hidden assumption Noise is iid gaussian > homoscedasticity 30
32 31
33 3. Linear Regression with L1 norm = L1 norm minimization + linear dependency on parameter More robust Less traditional minimization 32
34 This is convex programming 33
35 34

36 Confidence Intervals No closed form Compare to median! Boostrap: How? 35
37 36
38 4. Choosing a Distribution Know a catalog of distributions, guess a fit Shape Kurtosis, Skewness Power laws Hazard Rate Fit Verify the fit visually or with a test (see later) 37

39 Distribution Shape Distributions have a shape By definition: the shape is what remains the same when we Shift Rescale Example: normal distribution: what is the shape parameter? Example: exponential distribution: what is the shape parameter? 38
40 Standard Distributions In a given catalog of distributions, we give only the distributions with different shapes. For each shape, we pick one particular distribution, which we call standard. Standard normal: N(0,1) Standard exponential: Exp(1) Standard Uniform: U(0,1) 39
41 Log Normal Distribution 40
42 41
43 Skewness and Curtosis 42
44 Power Laws and Pareto Distribution 43
45 Complementary Distribution Functions Log log Scales Lognormal Pareto Normal 44

46 Zipf s Law 45

47 46
48 Hazard Rate Interpretation: probability that a flow dies in next dt seconds given still alive Used to classify distribs Aging Memoriless Fat tail Ex: normal? Exponential? Pareto? Log Normal? 47
49 The Weibull Distribution Standard Weibull CDF: Aging for c > 1 Memoriless for c = 1 Fat tailed for c <1 48
50 Fitting A Distribution Assume iid Use maximum likelihood Ex: assume gaussian; what are parameters? Frequent issues Censoring Combinations 49
51 Censored Data We want to fit a log normal distrib, but we have only data samples with values less than some max Idea: use the model Lognormal is fat tailed so we cannot ignore the tail and estimate F0 and a (truncation threshold) 50
52 51
53 We want to fit a log normal distrib to the body and pareto to the tail Combinations Model: MLE satisfies 52
54 53
55 5. Heavy Tails Recall what fat tail is Heavier than fat: 54
56 Heavy Tail means Central Limit does not hold Central limit theorem: a sum of n independent random variables with finite second moment tends to have a normal distribution, when n is large explains why we can often use normal assumption But it does not always hold. It does not hold if random variables have infinite second moment. 55
57 Central Limit Theorem for Heavy Tails normal qqplot histogram complementary d.f. log-log One Sample of points Pareto p = 1 56
58 p=1 1 sample, points average of 1000 samples p=1.5 p=2 p=2.5 p=3 57

59 Convergence for heavy tailed distributions 58

60 Importance of Second Moment 59

61 RWP with Heavy Tail Stationary? 60
62 Evidence of Heavy Tail 61
63 Testing Heavy Tail Assume you have very large data set Else no statement can be made One can look at empirical cdf in log scale 62
64 Taqqu s method A better method (numerically safer is as follows). Aggregate data multiple times 63
65 We should have and If log ( m 2 / m 1 ) then measure p = / p est = average of all p s 64
66 Example log ( 2) log ( 2) / p 65
67 Evidence of Heavy Tail p = 1.08 ±
68 A Load Generator: Surge Designed to create load for a web server Used in next lab Sophisticated load model It is an example of a benchmark, there are many others see lecture 67
69 User Equivalent Model Idea: find a stochastice model that represents user well User modelled as sequence of downloads, followed by think time Tool can implement several user equivalents Used to generate real work over TCP connections 68
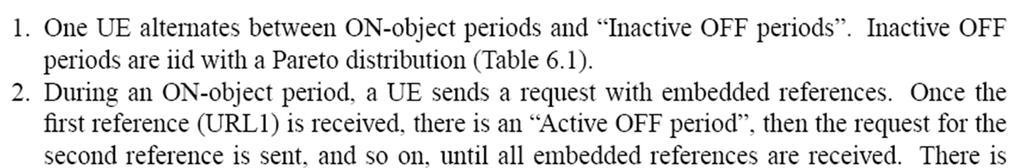
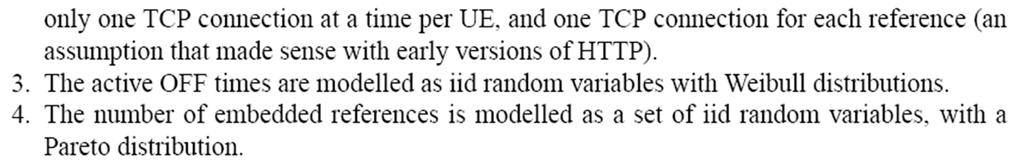
70 Characterization of UE Weibull dsitributions 69

71 Successive file requests are not independent Q: What would be the distribution if they were independent? A: geometric 70
72 Fitting the distributions Done by Surge authors with aest tool + ad hoc (least quare fit of histogram) What other method could one use? A: maximum likelihood with numerical optimization issue is non iid ness 71
The Fundamentals of Heavy Tails Properties, Emergence, & Identification. Jayakrishnan Nair, Adam Wierman, Bert Zwart
 The Fundamentals of Heavy Tails Properties, Emergence, & Identification Jayakrishnan Nair, Adam Wierman, Bert Zwart Why am I doing a tutorial on heavy tails? Because we re writing a book on the topic Why
An Architecture for a WWW Workload Generator. Paul Barford and Mark Crovella. Boston University. September 18, 1997
 An Architecture for a WWW Workload Generator Paul Barford and Mark Crovella Computer Science Department Boston University September 18, 1997 1 Overview SURGE (Scalable URL Reference Generator) is a WWW
Distribution Fitting (Censored Data)
") Distribution Fitting (Censored Data) Summary... 1 Data Input... 2 Analysis Summary... 3 Analysis Options... 4 Goodness-of-Fit Tests... 6 Frequency Histogram... 8 Comparison of Alternative Distributions...
Distribution Fitting (Censored Data) Summary... 1 Data Input... 2 Analysis Summary... 3 Analysis Options... 4 Goodness-of-Fit Tests... 6 Frequency Histogram... 8 Comparison of Alternative Distributions...
Lecture 3: Statistical sampling uncertainty
 Lecture 3: Statistical sampling uncertainty c Christopher S. Bretherton Winter 2015 3.1 Central limit theorem (CLT) Let X 1,..., X N be a sequence of N independent identically-distributed (IID) random
Business Statistics. Lecture 10: Course Review
 Business Statistics Lecture 10: Course Review 1 Descriptive Statistics for Continuous Data Numerical Summaries Location: mean, median Spread or variability: variance, standard deviation, range, percentiles,
APPENDIX 1 BASIC STATISTICS. Summarizing Data
 1 APPENDIX 1 Figure A1.1: Normal Distribution BASIC STATISTICS The problem that we face in financial analysis today is not having too little information but too much. Making sense of large and often contradictory
Dr. Maddah ENMG 617 EM Statistics 10/15/12. Nonparametric Statistics (2) (Goodness of fit tests)
 (Goodness of fit tests)") Dr. Maddah ENMG 617 EM Statistics 10/15/12 Nonparametric Statistics (2) (Goodness of fit tests) Introduction Probability models used in decision making (Operations Research) and other fields require fitting
Dr. Maddah ENMG 617 EM Statistics 10/15/12 Nonparametric Statistics (2) (Goodness of fit tests) Introduction Probability models used in decision making (Operations Research) and other fields require fitting
Review of Statistics
 Review of Statistics Topics Descriptive Statistics Mean, Variance Probability Union event, joint event Random Variables Discrete and Continuous Distributions, Moments Two Random Variables Covariance and
Practical Statistics for the Analytical Scientist Table of Contents
 Practical Statistics for the Analytical Scientist Table of Contents Chapter 1 Introduction - Choosing the Correct Statistics 1.1 Introduction 1.2 Choosing the Right Statistical Procedures 1.2.1 Planning
Math 180A. Lecture 16 Friday May 7 th. Expectation. Recall the three main probability density functions so far (1) Uniform (2) Exponential.
 Uniform (2) Exponential.") Math 8A Lecture 6 Friday May 7 th Epectation Recall the three main probability density functions so far () Uniform () Eponential (3) Power Law e, ( ), Math 8A Lecture 6 Friday May 7 th Epectation Eample
Math 8A Lecture 6 Friday May 7 th Epectation Recall the three main probability density functions so far () Uniform () Eponential (3) Power Law e, ( ), Math 8A Lecture 6 Friday May 7 th Epectation Eample
Introduction to Scientific Modeling CS 365, Fall 2012 Power Laws and Scaling
 Introduction to Scientific Modeling CS 365, Fall 2012 Power Laws and Scaling Stephanie Forrest Dept. of Computer Science Univ. of New Mexico Albuquerque, NM http://cs.unm.edu/~forrest forrest@cs.unm.edu
Median Cross-Validation
 Median Cross-Validation Chi-Wai Yu 1, and Bertrand Clarke 2 1 Department of Mathematics Hong Kong University of Science and Technology 2 Department of Medicine University of Miami IISA 2011 Outline Motivational
Exam C Solutions Spring 2005
 Exam C Solutions Spring 005 Question # The CDF is F( x) = 4 ( + x) Observation (x) F(x) compare to: Maximum difference 0. 0.58 0, 0. 0.58 0.7 0.880 0., 0.4 0.680 0.9 0.93 0.4, 0.6 0.53. 0.949 0.6, 0.8
Glossary. The ISI glossary of statistical terms provides definitions in a number of different languages:
 Glossary The ISI glossary of statistical terms provides definitions in a number of different languages: http://isi.cbs.nl/glossary/index.htm Adjusted r 2 Adjusted R squared measures the proportion of the
Solutions. Some of the problems that might be encountered in collecting data on check-in times are:
 Solutions Chapter 7 E7.1 Some of the problems that might be encountered in collecting data on check-in times are: Need to collect separate data for each airline (time and cost). Need to collect data for
Probability Plots. Summary. Sample StatFolio: probplots.sgp
 STATGRAPHICS Rev. 9/6/3 Probability Plots Summary... Data Input... 2 Analysis Summary... 2 Analysis Options... 3 Uniform Plot... 3 Normal Plot... 4 Lognormal Plot... 4 Weibull Plot... Extreme Value Plot...
Lecturer: Olga Galinina
 Renewal models Lecturer: Olga Galinina E-mail: olga.galinina@tut.fi Outline Reminder. Exponential models definition of renewal processes exponential interval distribution Erlang distribution hyperexponential
ANALYSIS OF VARIANCE OF BALANCED DAIRY SCIENCE DATA USING SAS
 ANALYSIS OF VARIANCE OF BALANCED DAIRY SCIENCE DATA USING SAS Ravinder Malhotra and Vipul Sharma National Dairy Research Institute, Karnal-132001 The most common use of statistics in dairy science is testing
Stat 101 L: Laboratory 5
 Stat 101 L: Laboratory 5 The first activity revisits the labeling of Fun Size bags of M&Ms by looking distributions of Total Weight of Fun Size bags and regular size bags (which have a label weight) of
Chapter 9. Non-Parametric Density Function Estimation
 9-1 Density Estimation Version 1.2 Chapter 9 Non-Parametric Density Function Estimation 9.1. Introduction We have discussed several estimation techniques: method of moments, maximum likelihood, and least
Network Traffic Characteristic
 Network Traffic Characteristic Hojun Lee hlee02@purros.poly.edu 5/24/2002 EL938-Project 1 Outline Motivation What is self-similarity? Behavior of Ethernet traffic Behavior of WAN traffic Behavior of WWW
STAT 135 Lab 6 Duality of Hypothesis Testing and Confidence Intervals, GLRT, Pearson χ 2 Tests and Q-Q plots. March 8, 2015
 STAT 135 Lab 6 Duality of Hypothesis Testing and Confidence Intervals, GLRT, Pearson χ 2 Tests and Q-Q plots March 8, 2015 The duality between CI and hypothesis testing The duality between CI and hypothesis
Introduction to statistics
 Introduction to statistics Literature Raj Jain: The Art of Computer Systems Performance Analysis, John Wiley Schickinger, Steger: Diskrete Strukturen Band 2, Springer David Lilja: Measuring Computer Performance:
Simulation. Where real stuff starts
 1 Simulation Where real stuff starts ToC 1. What is a simulation? 2. Accuracy of output 3. Random Number Generators 4. How to sample 5. Monte Carlo 6. Bootstrap 2 1. What is a simulation? 3 What is a simulation?
Review. DS GA 1002 Statistical and Mathematical Models. Carlos Fernandez-Granda
 Review DS GA 1002 Statistical and Mathematical Models http://www.cims.nyu.edu/~cfgranda/pages/dsga1002_fall16 Carlos Fernandez-Granda Probability and statistics Probability: Framework for dealing with
Capturing Network Traffic Dynamics Small Scales. Rolf Riedi
 Capturing Network Traffic Dynamics Small Scales Rolf Riedi Dept of Statistics Stochastic Systems and Modelling in Networking and Finance Part II Dependable Adaptive Systems and Mathematical Modeling Kaiserslautern,
1 Degree distributions and data
 1 Degree distributions and data A great deal of effort is often spent trying to identify what functional form best describes the degree distribution of a network, particularly the upper tail of that distribution.
Data Analysis. with Excel. An introduction for Physical scientists. LesKirkup university of Technology, Sydney CAMBRIDGE UNIVERSITY PRESS
 Data Analysis with Excel An introduction for Physical scientists LesKirkup university of Technology, Sydney CAMBRIDGE UNIVERSITY PRESS Contents Preface xv 1 Introduction to scientific data analysis 1 1.1
Heavy Tails: The Origins and Implications for Large Scale Biological & Information Systems
 Heavy Tails: The Origins and Implications for Large Scale Biological & Information Systems Predrag R. Jelenković Dept. of Electrical Engineering Columbia University, NY 10027, USA {predrag}@ee.columbia.edu
SYSM 6303: Quantitative Introduction to Risk and Uncertainty in Business Lecture 4: Fitting Data to Distributions
 SYSM 6303: Quantitative Introduction to Risk and Uncertainty in Business Lecture 4: Fitting Data to Distributions M. Vidyasagar Cecil & Ida Green Chair The University of Texas at Dallas Email: M.Vidyasagar@utdallas.edu
Stat 5101 Lecture Notes
 Stat 5101 Lecture Notes Charles J. Geyer Copyright 1998, 1999, 2000, 2001 by Charles J. Geyer May 7, 2001 ii Stat 5101 (Geyer) Course Notes Contents 1 Random Variables and Change of Variables 1 1.1 Random
Diagnostics and Remedial Measures
 Diagnostics and Remedial Measures Yang Feng http://www.stat.columbia.edu/~yangfeng Yang Feng (Columbia University) Diagnostics and Remedial Measures 1 / 72 Remedial Measures How do we know that the regression
GARCH Models Estimation and Inference
 GARCH Models Estimation and Inference Eduardo Rossi University of Pavia December 013 Rossi GARCH Financial Econometrics - 013 1 / 1 Likelihood function The procedure most often used in estimating θ 0 in
Financial Econometrics and Quantitative Risk Managenent Return Properties
 Financial Econometrics and Quantitative Risk Managenent Return Properties Eric Zivot Updated: April 1, 2013 Lecture Outline Course introduction Return definitions Empirical properties of returns Reading
PERFORMANCE EVALUATION
 PERFORMANCE EVALUATION OF COMPUTER AND COMMUNICATION SYSTEMS Jean-Yves Le Boudec EPFL Version2.3 of May 31, 218 Essentially identical to publisher s version, except for formatting With bug fixes Available
Chapter 9. Non-Parametric Density Function Estimation
 9-1 Density Estimation Version 1.1 Chapter 9 Non-Parametric Density Function Estimation 9.1. Introduction We have discussed several estimation techniques: method of moments, maximum likelihood, and least
Inferences for Regression
 Inferences for Regression An Example: Body Fat and Waist Size Looking at the relationship between % body fat and waist size (in inches). Here is a scatterplot of our data set: Remembering Regression In
DETAILED CONTENTS PART I INTRODUCTION AND DESCRIPTIVE STATISTICS. 1. Introduction to Statistics
 DETAILED CONTENTS About the Author Preface to the Instructor To the Student How to Use SPSS With This Book PART I INTRODUCTION AND DESCRIPTIVE STATISTICS 1. Introduction to Statistics 1.1 Descriptive and
Preface Introduction to Statistics and Data Analysis Overview: Statistical Inference, Samples, Populations, and Experimental Design The Role of
 Preface Introduction to Statistics and Data Analysis Overview: Statistical Inference, Samples, Populations, and Experimental Design The Role of Probability Sampling Procedures Collection of Data Measures
Preview from Notesale.co.uk Page 3 of 63
 Stem-and-leaf diagram - vertical numbers on far left represent the 10s, numbers right of the line represent the 1s The mean should not be used if there are extreme scores, or for ranks and categories Unbiased
Multivariate Regression
 Multivariate Regression The so-called supervised learning problem is the following: we want to approximate the random variable Y with an appropriate function of the random variables X 1,..., X p with the
Least Absolute Value vs. Least Squares Estimation and Inference Procedures in Regression Models with Asymmetric Error Distributions
 Journal of Modern Applied Statistical Methods Volume 8 Issue 1 Article 13 5-1-2009 Least Absolute Value vs. Least Squares Estimation and Inference Procedures in Regression Models with Asymmetric Error
p(z)
") Chapter Statistics. Introduction This lecture is a quick review of basic statistical concepts; probabilities, mean, variance, covariance, correlation, linear regression, probability density functions and
Chapter Statistics. Introduction This lecture is a quick review of basic statistical concepts; probabilities, mean, variance, covariance, correlation, linear regression, probability density functions and
Introduction to Statistical Analysis
 Introduction to Statistical Analysis Changyu Shen Richard A. and Susan F. Smith Center for Outcomes Research in Cardiology Beth Israel Deaconess Medical Center Harvard Medical School Objectives Descriptive
TABLE OF CONTENTS CHAPTER 1 COMBINATORIAL PROBABILITY 1
 TABLE OF CONTENTS CHAPTER 1 COMBINATORIAL PROBABILITY 1 1.1 The Probability Model...1 1.2 Finite Discrete Models with Equally Likely Outcomes...5 1.2.1 Tree Diagrams...6 1.2.2 The Multiplication Principle...8
Introduction to Linear regression analysis. Part 2. Model comparisons
 Introduction to Linear regression analysis Part Model comparisons 1 ANOVA for regression Total variation in Y SS Total = Variation explained by regression with X SS Regression + Residual variation SS Residual
Simulation. Where real stuff starts
 Simulation Where real stuff starts March 2019 1 ToC 1. What is a simulation? 2. Accuracy of output 3. Random Number Generators 4. How to sample 5. Monte Carlo 6. Bootstrap 2 1. What is a simulation? 3
EE/CpE 345. Modeling and Simulation. Fall Class 10 November 18, 2002
 EE/CpE 345 Modeling and Simulation Class 0 November 8, 2002 Input Modeling Inputs(t) Actual System Outputs(t) Parameters? Simulated System Outputs(t) The input data is the driving force for the simulation
Bayesian Predictive Modeling for Exponential-Pareto Composite Distribution
 Bayesian Predictive Modeling for Exponential-Pareto Composite Distribution ABSTRCT Composite distributions have well-known applications in the insurance industry. In this article a composite Exponential-Pareto
* Tuesday 17 January :30-16:30 (2 hours) Recored on ESSE3 General introduction to the course.
 Recored on ESSE3 General introduction to the course.") Name of the course Statistical methods and data analysis Audience The course is intended for students of the first or second year of the Graduate School in Materials Engineering. The aim of the course
Name of the course Statistical methods and data analysis Audience The course is intended for students of the first or second year of the Graduate School in Materials Engineering. The aim of the course
K. Model Diagnostics. residuals ˆɛ ij = Y ij ˆµ i N = Y ij Ȳ i semi-studentized residuals ω ij = ˆɛ ij. studentized deleted residuals ɛ ij =
 K. Model Diagnostics We ve already seen how to check model assumptions prior to fitting a one-way ANOVA. Diagnostics carried out after model fitting by using residuals are more informative for assessing
Kernel density estimation for heavy-tailed distributions...
 Kernel density estimation for heavy-tailed distributions using the Champernowne transformation Buch-Larsen, Nielsen, Guillen, Bolance, Kernel density estimation for heavy-tailed distributions using the
A world-wide investigation of the probability distribution of daily rainfall
 International Precipitation Conference (IPC10) Coimbra, Portugal, 23 25 June 2010 Topic 1 Extreme precipitation events: Physics- and statistics-based descriptions A world-wide investigation of the probability
Institute of Actuaries of India
 Institute of Actuaries of India Subject CT3 Probability & Mathematical Statistics May 2011 Examinations INDICATIVE SOLUTION Introduction The indicative solution has been written by the Examiners with the
401 Review. 6. Power analysis for one/two-sample hypothesis tests and for correlation analysis.
 401 Review Major topics of the course 1. Univariate analysis 2. Bivariate analysis 3. Simple linear regression 4. Linear algebra 5. Multiple regression analysis Major analysis methods 1. Graphical analysis
STAT 6350 Analysis of Lifetime Data. Probability Plotting
 STAT 6350 Analysis of Lifetime Data Probability Plotting Purpose of Probability Plots Probability plots are an important tool for analyzing data and have been particular popular in the analysis of life
Chapter 5. Statistical Models in Simulations 5.1. Prof. Dr. Mesut Güneş Ch. 5 Statistical Models in Simulations
 Chapter 5 Statistical Models in Simulations 5.1 Contents Basic Probability Theory Concepts Discrete Distributions Continuous Distributions Poisson Process Empirical Distributions Useful Statistical Models
Extreme Value Analysis and Spatial Extremes
 Extreme Value Analysis and Department of Statistics Purdue University 11/07/2013 Outline Motivation 1 Motivation 2 Extreme Value Theorem and 3 Bayesian Hierarchical Models Copula Models Max-stable Models
INFERENCE FOR REGRESSION
 CHAPTER 3 INFERENCE FOR REGRESSION OVERVIEW In Chapter 5 of the textbook, we first encountered regression. The assumptions that describe the regression model we use in this chapter are the following. We
Better Bootstrap Confidence Intervals
 by Bradley Efron University of Washington, Department of Statistics April 12, 2012 An example Suppose we wish to make inference on some parameter θ T (F ) (e.g. θ = E F X ), based on data We might suppose
IE 303 Discrete-Event Simulation
 IE 303 Discrete-Event Simulation 1 L E C T U R E 5 : P R O B A B I L I T Y R E V I E W Review of the Last Lecture Random Variables Probability Density (Mass) Functions Cumulative Density Function Discrete
Reliability Engineering I
 Happiness is taking the reliability final exam. Reliability Engineering I ENM/MSC 565 Review for the Final Exam Vital Statistics What R&M concepts covered in the course When Monday April 29 from 4:30 6:00
TABLES AND FORMULAS FOR MOORE Basic Practice of Statistics
 TABLES AND FORMULAS FOR MOORE Basic Practice of Statistics Exploring Data: Distributions Look for overall pattern (shape, center, spread) and deviations (outliers). Mean (use a calculator): x = x 1 + x
Parameter Estimation
 Parameter Estimation Chapters 13-15 Stat 477 - Loss Models Chapters 13-15 (Stat 477) Parameter Estimation Brian Hartman - BYU 1 / 23 Methods for parameter estimation Methods for parameter estimation Methods
MFin Econometrics I Session 4: t-distribution, Simple Linear Regression, OLS assumptions and properties of OLS estimators
 MFin Econometrics I Session 4: t-distribution, Simple Linear Regression, OLS assumptions and properties of OLS estimators Thilo Klein University of Cambridge Judge Business School Session 4: Linear regression,
Objective Experiments Glossary of Statistical Terms
 Objective Experiments Glossary of Statistical Terms This glossary is intended to provide friendly definitions for terms used commonly in engineering and science. It is not intended to be absolutely precise.
Probability Distributions Columns (a) through (d)
 through (d)") Discrete Probability Distributions Columns (a) through (d) Probability Mass Distribution Description Notes Notation or Density Function --------------------(PMF or PDF)-------------------- (a) (b) (c)
Discrete Probability Distributions Columns (a) through (d) Probability Mass Distribution Description Notes Notation or Density Function --------------------(PMF or PDF)-------------------- (a) (b) (c)
Lecture 18: Simple Linear Regression
 Lecture 18: Simple Linear Regression BIOS 553 Department of Biostatistics University of Michigan Fall 2004 The Correlation Coefficient: r The correlation coefficient (r) is a number that measures the strength
STAT 135 Lab 3 Asymptotic MLE and the Method of Moments
 STAT 135 Lab 3 Asymptotic MLE and the Method of Moments Rebecca Barter February 9, 2015 Maximum likelihood estimation (a reminder) Maximum likelihood estimation Suppose that we have a sample, X 1, X 2,...,
Convex Optimization M2
 Convex Optimization M2 Lecture 8 A. d Aspremont. Convex Optimization M2. 1/57 Applications A. d Aspremont. Convex Optimization M2. 2/57 Outline Geometrical problems Approximation problems Combinatorial
If we want to analyze experimental or simulated data we might encounter the following tasks:
 Chapter 1 Introduction If we want to analyze experimental or simulated data we might encounter the following tasks: Characterization of the source of the signal and diagnosis Studying dependencies Prediction
Research Article The Laplace Likelihood Ratio Test for Heteroscedasticity
 International Mathematics and Mathematical Sciences Volume 2011, Article ID 249564, 7 pages doi:10.1155/2011/249564 Research Article The Laplace Likelihood Ratio Test for Heteroscedasticity J. Martin van
Robustness of Principal Components
 PCA for Clustering An objective of principal components analysis is to identify linear combinations of the original variables that are useful in accounting for the variation in those original variables.
C4-304 STATISTICS OF LIGHTNING OCCURRENCE AND LIGHTNING CURRENT S PARAMETERS OBTAINED THROUGH LIGHTNING LOCATION SYSTEMS
 2, rue d'artois, F-75008 Paris http://www.cigre.org C4-304 Session 2004 CIGRÉ STATISTICS OF LIGHTNING OCCURRENCE AND LIGHTNING CURRENT S PARAMETERS OBTAINED THROUGH LIGHTNING LOCATION SYSTEMS baran@el.poweng.pub.ro
Correlation and Linear Regression
 Correlation and Linear Regression Correlation: Relationships between Variables So far, nearly all of our discussion of inferential statistics has focused on testing for differences between group means
Estimators as Random Variables
 Estimation Theory Overview Properties Bias, Variance, and Mean Square Error Cramér-Rao lower bound Maimum likelihood Consistency Confidence intervals Properties of the mean estimator Introduction Up until
ACTEX CAS EXAM 3 STUDY GUIDE FOR MATHEMATICAL STATISTICS
 ACTEX CAS EXAM 3 STUDY GUIDE FOR MATHEMATICAL STATISTICS TABLE OF CONTENTS INTRODUCTORY NOTE NOTES AND PROBLEM SETS Section 1 - Point Estimation 1 Problem Set 1 15 Section 2 - Confidence Intervals and
Linear Regression (9/11/13)
") STA561: Probabilistic machine learning Linear Regression (9/11/13) Lecturer: Barbara Engelhardt Scribes: Zachary Abzug, Mike Gloudemans, Zhuosheng Gu, Zhao Song 1 Why use linear regression? Figure 1: Scatter
STA561: Probabilistic machine learning Linear Regression (9/11/13) Lecturer: Barbara Engelhardt Scribes: Zachary Abzug, Mike Gloudemans, Zhuosheng Gu, Zhao Song 1 Why use linear regression? Figure 1: Scatter
Contents. Preface to Second Edition Preface to First Edition Abbreviations PART I PRINCIPLES OF STATISTICAL THINKING AND ANALYSIS 1
 Contents Preface to Second Edition Preface to First Edition Abbreviations xv xvii xix PART I PRINCIPLES OF STATISTICAL THINKING AND ANALYSIS 1 1 The Role of Statistical Methods in Modern Industry and Services
Introduction to Logistic Regression
 Introduction to Logistic Regression Guy Lebanon Binary Classification Binary classification is the most basic task in machine learning, and yet the most frequent. Binary classifiers often serve as the
Statistical Distribution Assumptions of General Linear Models
 Statistical Distribution Assumptions of General Linear Models Applied Multilevel Models for Cross Sectional Data Lecture 4 ICPSR Summer Workshop University of Colorado Boulder Lecture 4: Statistical Distributions
Chapter 3 Common Families of Distributions
 Lecture 9 on BST 631: Statistical Theory I Kui Zhang, 9/3/8 and 9/5/8 Review for the previous lecture Definition: Several commonly used discrete distributions, including discrete uniform, hypergeometric,
Generalized Linear Models for Non-Normal Data
 Generalized Linear Models for Non-Normal Data Today s Class: 3 parts of a generalized model Models for binary outcomes Complications for generalized multivariate or multilevel models SPLH 861: Lecture
HANDBOOK OF APPLICABLE MATHEMATICS
 HANDBOOK OF APPLICABLE MATHEMATICS Chief Editor: Walter Ledermann Volume VI: Statistics PART A Edited by Emlyn Lloyd University of Lancaster A Wiley-Interscience Publication JOHN WILEY & SONS Chichester
EE/CpE 345. Modeling and Simulation. Fall Class 9
 EE/CpE 345 Modeling and Simulation Class 9 208 Input Modeling Inputs(t) Actual System Outputs(t) Parameters? Simulated System Outputs(t) The input data is the driving force for the simulation - the behavior
BIOL 458 BIOMETRY Lab 9 - Correlation and Bivariate Regression
 BIOL 458 BIOMETRY Lab 9 - Correlation and Bivariate Regression Introduction to Correlation and Regression The procedures discussed in the previous ANOVA labs are most useful in cases where we are interested
Post-exam 2 practice questions 18.05, Spring 2014
 Post-exam 2 practice questions 18.05, Spring 2014 Note: This is a set of practice problems for the material that came after exam 2. In preparing for the final you should use the previous review materials,
Final Exam. Name: Solution:
 Final Exam. Name: Instructions. Answer all questions on the exam. Open books, open notes, but no electronic devices. The first 13 problems are worth 5 points each. The rest are worth 1 point each. HW1.
Formal Statement of Simple Linear Regression Model
 Formal Statement of Simple Linear Regression Model Y i = β 0 + β 1 X i + ɛ i Y i value of the response variable in the i th trial β 0 and β 1 are parameters X i is a known constant, the value of the predictor
Tables Table A Table B Table C Table D Table E 675
 BMTables.indd Page 675 11/15/11 4:25:16 PM user-s163 Tables Table A Standard Normal Probabilities Table B Random Digits Table C t Distribution Critical Values Table D Chi-square Distribution Critical Values
CS 365 Introduction to Scientific Modeling Fall Semester, 2011 Review
 CS 365 Introduction to Scientific Modeling Fall Semester, 2011 Review Topics" What is a model?" Styles of modeling" How do we evaluate models?" Aggregate models vs. individual models." Cellular automata"
Statistics in medicine
 Statistics in medicine Lecture 4: and multivariable regression Fatma Shebl, MD, MS, MPH, PhD Assistant Professor Chronic Disease Epidemiology Department Yale School of Public Health Fatma.shebl@yale.edu
LECTURE NOTE #3 PROF. ALAN YUILLE
 LECTURE NOTE #3 PROF. ALAN YUILLE 1. Three Topics (1) Precision and Recall Curves. Receiver Operating Characteristic Curves (ROC). What to do if we do not fix the loss function? (2) The Curse of Dimensionality.
Multistate Modeling and Applications
 Multistate Modeling and Applications Yang Yang Department of Statistics University of Michigan, Ann Arbor IBM Research Graduate Student Workshop: Statistics for a Smarter Planet Yang Yang (UM, Ann Arbor)
Probability Distributions for Continuous Variables. Probability Distributions for Continuous Variables
 Probability Distributions for Continuous Variables Probability Distributions for Continuous Variables Let X = lake depth at a randomly chosen point on lake surface If we draw the histogram so that the
Towards a more physically based approach to Extreme Value Analysis in the climate system
 N O A A E S R L P H Y S IC A L S C IE N C E S D IV IS IO N C IR E S Towards a more physically based approach to Extreme Value Analysis in the climate system Prashant Sardeshmukh Gil Compo Cecile Penland
Concepts and Applications of Kriging. Eric Krause
 Concepts and Applications of Kriging Eric Krause Sessions of note Tuesday ArcGIS Geostatistical Analyst - An Introduction 8:30-9:45 Room 14 A Concepts and Applications of Kriging 10:15-11:30 Room 15 A
Chapter 14. Linear least squares
 Serik Sagitov, Chalmers and GU, March 5, 2018 Chapter 14 Linear least squares 1 Simple linear regression model A linear model for the random response Y = Y (x) to an independent variable X = x For a given
Ø Set of mutually exclusive categories. Ø Classify or categorize subject. Ø No meaningful order to categorization.
 Statistical Tools in Evaluation HPS 41 Dr. Joe G. Schmalfeldt Types of Scores Continuous Scores scores with a potentially infinite number of values. Discrete Scores scores limited to a specific number
18.175: Lecture 8 Weak laws and moment-generating/characteristic functions
 18.175: Lecture 8 Weak laws and moment-generating/characteristic functions Scott Sheffield MIT 18.175 Lecture 8 1 Outline Moment generating functions Weak law of large numbers: Markov/Chebyshev approach