0.3 Domain and Range: Relations vs Functions, Domain, Range, and Vertical Line Test Worksheet 3 #1-7
|
|
|
- Rolf Phillips
- 6 years ago
- Views:
Transcription
1 Unit 0 Check Sheet Function Families Check sheet must be turned in to receive Homework & Quiz points. All quiz corrections must be done for test score to replace quiz scores. No check sheet = No Points. Write quiz scores as fractions Lost Quizzes count as a 0. Section Name Per (Print) Quiz ratio is total points scored on quizzes and pre-test out of total possible Order (from top to bottom) o Check sheet, o Quiz 1, 2, Pre-Test o Quiz corrections 0.1 Graph Activity: Sort group graphs into a minimum of five groups. Explain why you grouped them that way. Discuss left-to-right behavior using increasing, decreasing, constant, and the names of the function families 0.2 Equations of Function Families: Use Desmos to graph functions Worksheet 2 # Domain and Range: Relations vs Functions, Domain, Range, and Vertical Line Test Worksheet 3 # Review Graphs and Equations Flash Cards: Use: linear, discrete, v-shaped, u-shaped, continuous, absolute maximum, absolute minimum, constant, smooth curve, piecewise, increasing, decreasing, symmetry Worksheet 4 #1-22 Quiz Determining the Independent and Dependent quantities Worksheet 5 # Matching word problems to a set of graphed functions Worksheet 6 #1-12 Quiz 2 Pre-Test 0.7 Review Worksheet Review #1-12 Test HMK Quiz 1: Score/Possible Quiz 2: Score/Possible Pre-Test: Score/Possible Total Quiz Ratio: Total Score/Total Possible
2 Name: Date: Period: Worksheet 2 Use to explore the equation cards with the graph cards. Sketch the graph of each function. For each sketch, choose which function family it belongs in from these choices: Piecewise, Exponential, Linear, Quadratic, or Absolute Value Also, decide which characteristics describe the function family (select all that apply): Increasing, Decreasing, Constant, Discrete, Continuous, U-Shaped, V-Shaped, Maximum, Minimum, or Smooth Curve Equation Function Family & Characteristics Sketch 1. yy = 3 2. xx = 2 3. yy = xx ff(xx) = 1 2 xx 4 5. ff(xx) = 0
3 6. ff(xx) = 3 xx yy = xx ff(xx) = (xx 5) 2 9. ff(xx) = xx 2 + 3xx yy = xx 11. ff(xx) = 3xx yy = 1 xx + 1 3
4 13. ff(xx) = 2 xx 14. ff(xx) = 1 4 xx 15. ff(xx) = 5 xx 16. yy = 0.5 xx 3 3xx 1, xx > ff(xx) = xx 9, xx Optional BONUS! ff(xx) = 2 xx x = { -6, -5, -4, -3, -2, -1, 0, 1, 2, 3, 4, 5, 6 }
5 Name: Date: Period: Vocabulary Relation: Worksheet 3 Domain: Range: Examples Use the points on each graph to complete the corresponding table of values. Graph A x Y Graph B x Y 1. Which graph has a different x-value for each y-value? 2. Which graph has the same x-values for different y-values? 3. If the equation x = 2 were drawn on both graphs, how many points on each graph would intersect this line? Vocabulary Function: Vertical Line Test:


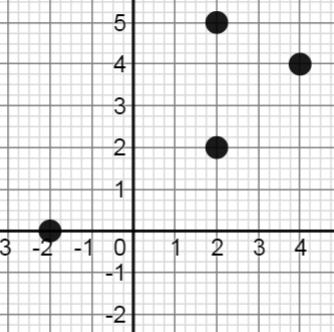
6 Directions: Use the graphs to answer the questions. 4. a. Identify the domain b. Identify the range c. Is the relation a function? 5. a. Identify the domain b. Identify the range c. Is the relation a function? 6. a. Identify the domain b. Identify the range c. Is the relation a function? 7. a. Identify the domain b. Identify the range c. Is the relation a function?
7 Name: Date: Period: Worksheet 4 Directions: Choose the appropriate function family or families to complete each sentence based on the given characteristic(s). Linear Functions Linear Absolute Value Functions Quadratic Functions Exponential Functions 1. The graph of this function family is a straight line. The function family is. 2. The graph of this function family has an increasing interval and a decreasing interval. The function family is. 3. The graph of this function family has an absolute minimum. The function family is. 4. The graph of this function family is decreasing over the entire domain. The function family is. 5. The graph of this function family forms a V shape. The function family is. 6. The graph of this function family has an increasing interval and a decreasing interval and forms a U shape. The function family is. 7. The graph of this function family does not have an absolute maximum or absolute minimum and is a smooth curve. The function family is. 8. The graph of this function family has an absolute maximum or absolute minimum and is made up straight lines. The function family is. 9. The graph of this function family is made up straight lines and does not have an absolute maximum or absolute minimum. The function family is. 10. The graph of this function family decreases over the entire domain and is a smooth curve. The function family is.
8 Directions: Create an equation and sketch a graph for a function with each set of given characteristics. Use values that are any real numbers between -10 and Create an equation and sketch a graph that: 12. Create an equation and sketch a graph that: is a smooth curve, is linear, is continuous, has a minimum, and is discrete, and is decreasing across the entire domain. is quadratic. Equation: Equation: 13. Create an equation and sketch a graph that: 14. Create an equation and sketch a graph that: is a smooth curve, has a maximum, is increasing across the entire domain, is continuous, and is continuous, and is a linear absolute value function. is exponential. Equation: Equation:
9 15. Create an equation and sketch a graph that: 16. Create an equation and sketch a graph that: is linear, is discrete, is continuous, is neither increasing nor decreasing across the entire domain, and does not pass through the origin. has a maximum, does not pass through the origin, and is quadratic. Equation: Equation: Directions: Choose the graph that represents each function. 17. ( ) 18. ( )
10 19. ( ) 20. ( ) 21. ( ), x={...,-1.5, -1, -0.5, 0, 0.5, 1, 1.5,...} 22. ( )
11 Name: Date: Period: Vocabulary Independent Quantity: Dependent Quantity: Worksheet 5 Example The number of hours worked and the amount of money earned. independent quantity dependent quantity Quantities vs. Units The QUANTITY is what is being measured (ex: time, weight, distance, etc.) The UNITS are how the quantities are being measured (ex: seconds, gallons, miles, etc.) Discrete vs. Continuous Data DISCRETE DATA are quantities that can only be represented at isolated values (ex: people, number of t-shirts, number of cars washed). They are graphed as Dotted data. CONTINUOUS DATA are quantities that can be represented over an interval of values (ex: rate of change, amount of money being earned, time). They are graphed as Solid data. Determine the independent and dependent quantities. 1. The domain is made up of x-values and the range is made up of y-values Independent quantity: Dependent quantity: 2. Your grade on a test and the number of hours you studied. Independent quantity: Dependent quantity: 3. Selena is driving to visit her grandmother who lives 325 miles away from Selena s home. She travels an average of 60 miles per hour. If the dependent quantity is the distance traveled, what is the independent quantity? Independent quantity: 4. Benjamin works at a printing company. He is making T-shirts for a high school volleyball team. The press he runs can imprint 3 T-shirts per minute with the school s mascot. If the independent quantity is the number of T-shirts that are ordered, what is the dependent quantity? Dependent quantity:
12 Directions: Determine the independent and dependent quantities in each scenario. 5. On her way to work each morning, Sophia purchases a small cup of coffee for $4.25 from the coffee shop. She wants to graph her weekly spending on coffee. What would be the independent and dependent quantities? Independent quantity: Dependent quantity: 6. Phillip enjoys rock climbing on the weekends. At some of the less challenging locations he can climb upwards of 12 feet per minute. Choosing between distance and time, what would be the independent and dependent quantities? Independent quantity: Dependent quantity: 7. Gavin works for a skydiving company. Customers pay $200 per jump to skydive in tandem skydives with Gavin. Using the amount of money made and number of jumps, what would be the independent and dependent quantities? Independent quantity: Dependent quantity: 8. Gillian is playing video games at an arcade. Gillian starts with $40 and is playing games that cost 50 cents per game. The amount of money in his pocket can be figured at any time, by just knowing how many games he has played. Independent quantity: Dependent quantity: 9. Julian works as a salesman for a textbook company. He only receives income based on a 10% commission on the amount of sales. What would be the independent and dependent quantities? Independent quantity: Dependent quantity: 10. A freshly made cup of tea is served at a temperature of about 180 F. The tea cools rapidly at first, and then slows down gradually as it approaches room temperature. Independent quantity: Dependent quantity: 11. Brady runs for his high school cross country team. His strategy for each 5-kilometer race is always the same. He starts off at a medium pace and gradually increases his speed the closer he is to the finish. Independent quantity: Dependent quantity:
13 Name: Date: Period: Worksheet 6 Directions: Choose the graph that best models each scenario. 1. Lyndsay is filling her pool to get ready for summer. She is using her hose to fill the pool at a rate of 14 gallons per minute. 2. Isaiah is training to participate in competitive trampoline. In his best jump, he can reach a maximum height of about 9 meters and can spend about 2 seconds in the air performing tricks. 3. Each day Jasmine starts her walk to school at 7:45am. At 7:50am she stops at her friend Victoria s house. Victoria is usually late and Jasmine must wait at least 5 minutes while her friend gets ready. At 7:55am the girls leave the house and arrive at school at 8:10am.
14 4. Jasmine is saving for college. She has invested $500 in a mutual fund that is expected to earn an average of 7% annually. 5. Marcus is at the top of an observation tower. He drops an action figure with a parachute attached and watches it descend to the ground. 6. Janelle holds a raffle to raise money for a children s hospital. Participants who enter the raffle guess the number of peanuts in a jar. Janelle records the number of peanuts each participant guesses and the number of peanuts their guess is off by.


15 Directions: Label the axes of the graph that models each scenario with the independent and dependent quantities. 7. Madison enjoys bicycling for exercise. Each Saturday she bikes a course she has mapped out around her town. She averages a speed of 12 miles per hour on her journey. 8. Natasha is filling the bathtub with water in order to give her dog Buster a bath. The faucet fills the tub at an average rate of 12 gallons per minute. 9. Marcus throws a football straight up into the air. After it reaches its maximum height of 20 feet, it descends back to the ground.


16 10. Chloe is using a pump to drain her backyard pool to get ready for winter. The pump removes the water at an average rate of 15 gallons per minute. 11. Jermaine is saving money to purchase a used car. He places $850 dollars in a savings account that earns 1.65% interest annually. 12. Zachary enjoys hiking. On the first day of his latest hiking trip, he hikes through flat terrain for about 8 miles. On the second day, he hikes through very steep terrain for about 3 miles. On the third day he hikes through some hilly terrain for about 6 miles.

17 Name: Date: Period: Worksheet Review Directions: Answer each of the following questions. 1. Hector knows there is a relationship between the number of cars he washes and the time it takes him to wash those cars. Identify the independent quantity and the dependent quantity in the problem situation. 2. David rode his bike to the park. After staying at the park for a few minutes, he then continued his ride to the grocery store. The graph shows this relationship. In the graph, what is the independent quantity and what is the dependent quantity? 3. Tell whether each graph represents a function. a. b. 4. Classify each function as increasing, decreasing, or constant. a. ff(xx) = 3xx b. ff(xx) = 2 xx, where x is an integer c. ff(xx) = 0.9 xx d. ff(xx) = 9 5. Classify each function as a linear function, a linear absolute value function, a quadratic function, or an exponential function. a. ff(xx) = 7xx b. ff(xx) = 3xx 2 c. ff(xx) = 4 xx d. ff(xx) = 8
18 6. Determine whether each function has an absolute maximum or absolute minimum. If the graph has neither an absolute maximum or absolute minimum, write none. a. ff(xx) = 4 xx b. ff(xx) = 2xx + 5 c. ff(xx) = 5xx d. ff(xx) = 3 xx 7. Create an equation and sketch a graph for each set of given characteristics. a. is a function b. is a function is quadratic is a linear absolute value function is continuous is discrete has an absolute minimum has an absolute maximum 8. Sam rode in a hot air balloon. After the balloon began its initial descent, it stayed in the air at a constant height for a few minutes, and then it continued its descent to the ground. The graph shows this relationship. In the graph, what is the independent quantity and what is the dependent quantity? Sam s Hot Air Balloon Ride

19 9. Angela knows there is a relationship between the area of the squares she draws and the side length of each square. Identify the independent quantity and the dependent quantity in the problem situation. 10. Over which part of the domain is the function constant? The amazing Stevini is practicing one of his tricks. As part of this trick, he cuts a rope into many pieces and then magically puts the pieces back together. He begins the trick with a 20 foot rope and then cuts in half. He then takes one of the halves and cuts that piece in half. He repeats this process until he left with a piece so small he can no longer cut it. a. What would be an appropriate function family for this function? Explain your reasoning. b. Is the function continuous or discrete? Explain why in terms of the scenario. c. In the context of the scenario, what is causing the graph to be a decreasing function?
20 12. Joe is mowing lawns to buy a new car. For every lawn that he mows he earns $50. a. Identify the dependent quantity b. Identify the independent quantity c. Sketch the graph of the scenario. d. Label the x and y axis, include unit of measurement. e. Label the approximate scale of the graph.
Skills Practice. I. Identifying Independent and Dependent Quantities
 Skills Practice I. Identifing Independent and Dependent Quantities A. Determine the independent and dependent quantities in each scenario. Be sure to include the appropriate units of measure for each quantit.
Cumulative chapters 1-3 review Period: 1. Tell whether each graph represents a function.
 Cumulative chapters -3 review Name:_ Period:. Tell whether each graph represents a function. a. b.. Determine whether each function has an absolute maximum or absolute minimum. If the graph has neither
Using Graphs to Relate Two Quantities
 - Think About a Plan Using Graphs to Relate Two Quantities Skiing Sketch a graph of each situation. Are the graphs the same? Explain. a. your speed as you travel from the bottom of a ski slope to the top
PreAP Algebra I Problems for the First Semester Exam
 This is not a semester exam, but problems that you could use on a semester exam that are similar to some of the problems from the unit quizzes 1. Stephanie left home at 8:30 and rode her bicycle at a steady
Lesson 3: Linear Functions and Proportionality
 : Classwork Example 1 In the last lesson, we looked at several tables of values showing the inputs and outputs of functions. For instance, one table showed the costs of purchasing different numbers of
8 th Grade Domain 2: Algebra and Functions (40%) Sara
 Sara") 8 th Grade Domain 2: Algebra and Functions (40%) 1. Tara creates a budget for her weekly expenses. The graph shows how much money is in the account at different times. Find the slope of the line and tell
8 th Grade Domain 2: Algebra and Functions (40%) 1. Tara creates a budget for her weekly expenses. The graph shows how much money is in the account at different times. Find the slope of the line and tell
Houston County School System Mathematics
 Student Name: Teacher Name: Grade: 6th Unit #: 4b Unit Title: Analyzing Quantitative Relationships Approximate Start Date of Unit: January 4 Approximate End Date (and Test Date) of Unit: January 19 I can
ALGEBRA 1 UNIT 3 WORKBOOK CHAPTER 6
 ALGEBRA 1 UNIT 3 WORKBOOK CHAPTER 6 FALL 2014 0 1 Algebra 1 Section 6.1 Notes: Graphing Systems of Equations System of Equations: a set of two or more equations with the same variables, graphed in the
Lesson 5: Increasing and Decreasing Functions
 : Classwork Example 1: Nonlinear Functions in the Real World Not all real-world situations can be modeled by a linear function. There are times when a nonlinear function is needed to describe the relationship
Grade 7 Mathematics Test Booklet
 Student Name P Grade Test Booklet Practice Test TEST BOOKLET SECURITY BARCODE Unit 1 Unit 1 Directions: Today, you will take Unit 1 of the Grade Practice Test. Unit 1 has two sections. In the first section,
Algebra 1 Spencer Unit 4 Notes: Inequalities and Graphing Linear Equations. Unit Calendar
 Algebra 1 Spencer Unit 4 Notes: Inequalities and Graphing Linear Equations Unit Calendar Date Topic Homework Nov 5 (A ) 6.1 Solving Linear Inequalities +/- 6.2 Solving Linear Inequalities x/ 6.3 Solving
Practice EOC Questions
 Practice EOC Questions 1 One of the events at a high school track meet is the pole vault. The pole vaulter runs toward the crossbar and uses a pole to attempt to vault over the bar. Josh collects data
Houston County School System Mathematics
 Student Name: Teacher Name: Grade: 6th Unit #: 4b Unit Title: Analyzing Quantitative Relationships Approximate Start Date of Unit: Approximate End Date (and Test Date) of Unit: The following Statements
5 1 Worksheet MATCHING: For # 1 4, match each graph to its equation. Not all equations will be used. 1) 2) 3) 4)
 2) 3) 4)") Algebra 1 Name: Per: 5 1 Worksheet MATCHING: For # 1 4, match each graph to its equation. Not all equations will be used. 1) 2) 3) 4) A) yy = xx 3 B) yy = xx + 3 C) yy = 1 2 xx 3 D) yy = xx 3 E) yy = 2
Algebra 1 Name: Per: 5 1 Worksheet MATCHING: For # 1 4, match each graph to its equation. Not all equations will be used. 1) 2) 3) 4) A) yy = xx 3 B) yy = xx + 3 C) yy = 1 2 xx 3 D) yy = xx 3 E) yy = 2
Name Period Date DRAFT
 Name Period Date Equations and Inequalities Student Packet 4: Inequalities EQ4.1 EQ4.2 EQ4.3 Linear Inequalities in One Variable Add, subtract, multiply, and divide integers. Write expressions, equations,
1. The area of the surface of the Atlantic Ocean is approximately 31,830,000 square miles. How is this area written in scientific notation?
 1. The area of the surface of the tlantic Ocean is approximately 31,830,000 square miles. How is this area written in scientific notation? 3.183 x 10 4 B 3.183 x 10 5 C 3.183 x 10 6 D 3.183 x 10 7 2. In
Algebra 1 Semester 1 Review
 Class: Date: Algebra 1 Semester 1 Review 2013-2014 1. 7 4 2. What is the simplified form of each expression? 343 16,384 16,807 2,401 Ê ËÁ 4 7 ˆ 3 343 64 64 343 21952 407 What is the simplified form of
Pre-Test. Name Date. 1. Carolee makes quilts to sell at an arts and crafts fair. She charges $75 per quilt. a. Name the quantity that is constant.
 Pre-Test Name Date 1. Carolee makes quilts to sell at an arts and crafts fair. She charges $75 per quilt. a. Name the quantity that is constant. b. Which quantity depends on the other? c. Write an algebraic
Practice - TAKS OBJECTIVE 1 & 2. 1) Which inequality best describes the graph shown below?
 Which inequality best describes the graph shown below?") Name: Period Practice - TAKS OBJECTIVE 1 & 2 1) Which inequality best describes the graph shown below? A y 2x B y x 2 C y 2x 2 D y x 2 2) If y is a function of x in the equation y = x 2 9, which statement
Name: Period Practice - TAKS OBJECTIVE 1 & 2 1) Which inequality best describes the graph shown below? A y 2x B y x 2 C y 2x 2 D y x 2 2) If y is a function of x in the equation y = x 2 9, which statement
1) *Writes and identifies equations of parallel and perpendicular lines. 2) *Writes an equation in the form of y = mx+b from two ordered pairs
 *Writes and identifies equations of parallel and perpendicular lines. 2) *Writes an equation in the form of y = mx+b from two ordered pairs") A B Extension Standards Assessed 8.EE.B5 Graph proportional relationships, interpreting the unit rate as the slope of the graph. Compare two different proportional relationships represented in different
A B Extension Standards Assessed 8.EE.B5 Graph proportional relationships, interpreting the unit rate as the slope of the graph. Compare two different proportional relationships represented in different
Algebra EOC Practice Test #2
 Class: Date: Algebra EOC Practice Test #2 Multiple Choice Identify the choice that best completes the statement or answers the question. 1. Which of the following lines is perpendicular to the line y =
Name: Linear and Exponential Functions 4.1H
 TE-18 Name: Linear and Exponential Functions 4.1H Ready, Set, Go! Ready Topic: Recognizing arithmetic and geometric sequences Predict the next 2 terms in the sequence. State whether the sequence is arithmetic,
UNIT 5 INEQUALITIES CCM6+/7+ Name: Math Teacher:
 UNIT 5 INEQUALITIES 2015-2016 CCM6+/7+ Name: Math Teacher: Topic(s) Page(s) Unit 5 Vocabulary 2 Writing and Graphing Inequalities 3 8 Solving One-Step Inequalities 9 15 Solving Multi-Step Inequalities
Using Graphs to Relate Two Quantities
 - Using Graphs to Relate Two Quantities For Eercises, choose the correct letter.. The graph shows our distance from the practice field as ou go home after practice. You received a ride from a friend back
Sample. Test Booklet. Subject: MA, Grade: 08 STAAR Grade 8 Math signup at to remove - Student name:
 Test Booklet Subject: MA, Grade: 08 Student name: Author: Texas District: Texas Released Tests Printed: Tuesday February 12, 2019 1 A fishbowl shaped like a sphere is filled with water. The fishbowl has
Quiz For use after Section 3.2
 Name Date Quiz For use after Section.2 Identify the terms, coefficients, and constants of the expression. 2 1. 5h + 9 2. a + 2 + 7b Answers 1. Write the expression using exponents.. r r r r r r 4. 4 d
Unit 4 Linear Relationships
 Unit 4 Linear Relationships Standards: 8.EE.5 8.EE.6 8.EE.7 8.F.1 8.F.2 8.F.3 8.F.4 8.F.5 Domain and Standards Overview Expressions and Equations Understand the connections between proportional relationships,
Lesson 14: From Ratio Tables, Equations, and Double Number Line Diagrams to Plots on the Coordinate Plane
 Lesson 14: From Ratio Tables, Equations, and Double Number Line Diagrams to Student Outcomes Students associate with each ratio : the ordered pair (, ) and plot it in the coordinate plane. Students represent
Introduction to Systems of Equations
 Systems of Equations 1 Introduction to Systems of Equations Remember, we are finding a point of intersection x 2y 5 2x y 4 1. A golfer scored only 4 s and 5 s in a round of 18 holes. His score was 80.
Rate of Change and slope. Objective: To find rates of change from tables. To find slope.
 Linear Functions Rate of Change and slope Objective: To find rates of change from tables. To find slope. Objectives I can find the rate of change using a table. I can find the slope of an equation using
Algebra 1 Fall Review
 Name Algebra 1 Fall Review 2013-2014 Date 1. Write an inequality to best represent the graph shown at right. (A.1.D.) m: b: inequality: 2. Write an inequality to best describe the graph shown at right.
Student Outcomes. Classwork. Example 1 (6 minutes)
") Student Outcomes Students know the definition of constant rate in varied contexts as expressed using two variables where one is representing a time interval. Students graph points on a coordinate plane
Student Outcomes Students know the definition of constant rate in varied contexts as expressed using two variables where one is representing a time interval. Students graph points on a coordinate plane
4. Based on the table below, what is the joint relative frequency of the people surveyed who do not have a job and have a savings account?
 Name: Period: Date: Algebra 1 Common Semester 1 Final Review Like PS4 1. How many surveyed do not like PS4 and do not like X-Box? 2. What percent of people surveyed like the X-Box, but not the PS4? 3.
Algebra I Practice Exam
 Algebra I This practice assessment represents selected TEKS student expectations for each reporting category. These questions do not represent all the student expectations eligible for assessment. Copyright
4. Based on the table below, what is the joint relative frequency of the people surveyed who do not have a job and have a savings account?
 Name: Period: Date: Algebra 1 Common Semester 1 Final Review 1. How many surveyed do not like PS4 and do not like X-Box? 2. What percent of people surveyed like the X-Box, but not the PS4? 3. What is the
SY14-15 Algebra Exit Exam - PRACTICE Version
 Student Name: Directions: Solve each problem. You have a total of 90 minutes. Choose the best answer and fill in your answer document accordingly. For questions requiring a written response, write your
Define the word inequality
 Warm Up: Define the word inequality Agenda: Objective- Students can solve linear inequalities in one variable, including equations with coefficients represented by letters. Define Inequalities One & Two
ALGEBRA 1 SEMESTER 1 INSTRUCTIONAL MATERIALS Courses: Algebra 1 S1 (#2201) and Foundations in Algebra 1 S1 (#7769)
 and Foundations in Algebra 1 S1 (#7769)") Multiple Choice: Identify the choice that best completes the statement or answers the question. 1. Ramal goes to the grocery store and buys pounds of apples and pounds of bananas. Apples cost dollars per
Multiple Choice: Identify the choice that best completes the statement or answers the question. 1. Ramal goes to the grocery store and buys pounds of apples and pounds of bananas. Apples cost dollars per
Copyright 2015 Edmentum All rights reserved.
 Copyright 2015 Edmentum All rights reserved. Linear Equations & Graphs 1. A line has a y intercept of and a slope of. Find the equation of the line. A. B. C. D. Evaluate Functions 2. The graph of the function
3) What is the sum of the measures of all of the interior angles of the triangle?
 What is the sum of the measures of all of the interior angles of the triangle?") 1) Define an equilateral triangle. 2) Draw a diagram to illustrate this triangular garden and hose, and label the vertices A, B, C and let segment AD represent the hose. 3) What is the sum of the measures
1) Define an equilateral triangle. 2) Draw a diagram to illustrate this triangular garden and hose, and label the vertices A, B, C and let segment AD represent the hose. 3) What is the sum of the measures
Solve Linear Systems Algebraically
 TEKS 3.2 a.5, 2A.3.A, 2A.3.B, 2A.3.C Solve Linear Systems Algebraically Before You solved linear systems graphically. Now You will solve linear systems algebraically. Why? So you can model guitar sales,
Lesson 11: Classwork. Example 1 S.41
 Classwork Example 1 Pauline mows a lawn at a constant rate. Suppose she mows a 35-square-foot lawn in 2.5 minutes. What area, in square feet, can she mow in 1 minutes? tt minutes? tt (time in minutes)
The Top 11 Keystones of Algebra 1
 The Top 11 Keystones of Algebra 1 The Top Eleven Keystones of Algebra 1 You should be able to 1) Simplify a radical expression. 2) Solve an equation. 3) Solve and graph an inequality on a number line.
4. The table shows the number of toll booths driven through compared to the cost of using a Toll Tag.
 ALGEBRA 1 Fall 2016 Semester Exam Review Name 1. According to the data shown below, which would be the best prediction of the average cost of a -bedroom house in Georgetown in the year 2018? Year Average
Functions and Linear Functions Review
 Class: Date: Functions and Linear Functions Review 1. Fill in the following diagram using the words: Function Rule, Equation, Input, Output, Domain, Range, X value, Y value, Indenpendent variable, and
Linear Functions. Unit 3
 Linear Functions Unit 3 Standards: 8.F.1 Understand that a function is a rule that assigns to each input exactly one output. The graph of a function is the set of ordered pairs consisting of an input and
Which of the following is an irrational number? a) 2.8 b) 19
 2.8 b) 19") Which of the following is an irrational number? a) 2.8 b) 19 c)!! d) 81 A discounted ticket for a football game costs $12.50 less than the original price p. You pay $63 for a discounted ticket. Write and
Which of the following is an irrational number? a) 2.8 b) 19 c)!! d) 81 A discounted ticket for a football game costs $12.50 less than the original price p. You pay $63 for a discounted ticket. Write and
1. Consider the following graphs and choose the correct name of each function.
 Name Date Summary of Functions Comparing Linear, Quadratic, and Exponential Functions - Part 1 Independent Practice 1. Consider the following graphs and choose the correct name of each function. Part A:
7-7A. Describing a Function from its Graph. Vocabulary. Lesson
 Chapter 7 Lesson 7-7A Describing a Function from its Graph Vocabular increasing decreasing constant function BIG IDEA eamining its graph. Man attributes of a function can be determined b In companies that
Chapter 2: Linear Functions
 Chapter 2: Linear Functions Chapter one was a window that gave us a peek into the entire course. Our goal was to understand the basic structure of functions and function notation, the toolkit functions,
Course 1 Benchmark Test End of Year
 Course 1 Benchmark Test End of Year 1. Which rule best describes the relationship shown in the function table below? Input A. subtract 2 Output 1 3 2 6 3 9 4 12 5 15 4. What is the least common multiple
Practice Ace Problems
 Unit 5: Moving Straight Ahead Investigation 1: Walking Rates Practice Ace Problems Directions: Please complete the necessary problems to earn a maximum of 11 points according to the chart below. Show all
Name: Class: Date: ID: A
 Name: Class: Date: 8th Grade Advanced Topic III, Linear Equations and Systems of Linear Equations, MA.8.A.1.1, MA.8.1.1.2, MA.8.A.1.3, *MA.8.A.1.4, MA.8.A.1.5, MA.8.A.1.6 Multiple Choice Identify the choice
Sample. Test Booklet. Subject: MA, Grade: HS PSSA 2013 Keystone Algebra 1. - signup at to remove - Student name:
 Test Booklet Subject: MA, Grade: HS PSSA 2013 Keystone Algebra 1 Student name: Author: Pennsylvania District: Pennsylvania Released Tests Printed: Friday May 31, 2013 1 Which of the following inequalities
1-1 Practice. Patterns and Expressions. Describe each pattern using words. Draw the next figure in each pattern.
 1-1 Practice Patterns and Expressions Describe each pattern using words. Draw the next figure in each pattern. 1. 2. 3. Copy and complete each table. Include a process column. 4. 5. 6. Input Output Input
Name Per. Keystone Exams Practice Test A.) $300,000 B.) $400,000 C.) $500,000 D.) $600,000
 $300,000 B.) $400,000 C.) $500,000 D.) $600,000") Name Per Basic Skills Keystone Exams Practice Test 1.) A theme park charges $52 for a day pass and $110 for a week pass. Last month, 4,432 day passes and 979 week passes were sold. Which of the following
Name Per Basic Skills Keystone Exams Practice Test 1.) A theme park charges $52 for a day pass and $110 for a week pass. Last month, 4,432 day passes and 979 week passes were sold. Which of the following
EOC FSA Practice Test. Algebra 1. Calculator Portion
 EOC FSA Practice Test Algebra 1 Calculator Portion FSA Mathematics Reference Sheets Packet Algebra 1 EOC FSA Mathematics Reference Sheet Customary Conversions 1 foot = 12 inches 1 yard = 3 feet 1 mile
fall07ia Integrated Algebra Regents Exam Test Sampler fall07 4x 6 simplest form? 1) x 2 2) x 9 3) 4x 2 4) 4x 9
 x 2 2) x 9 3) 4x 2 4) 4x 9") fall07ia 1 For 10 days, Romero kept a record of the number of hours he spent listening to music. The information is shown in the table below. Which scatter plot shows Romero s data graphically? 2 Throughout
fall07ia 1 For 10 days, Romero kept a record of the number of hours he spent listening to music. The information is shown in the table below. Which scatter plot shows Romero s data graphically? 2 Throughout
Lesson Lesson Tutorials
 7.4 Lesson Lesson Tutorials An equation in two variables represents two quantities that change in relationship to one another. A solution of an equation in two variables is an ordered pair that makes the
MATH 1101 Exam 1 Review. Spring 2018
 MATH 1101 Exam 1 Review Spring 2018 Topics Covered Section 2.1 Functions in the Real World Section 2.2 Describing the Behavior of Functions Section 2.3 Representing Functions Symbolically Section 2.4 Mathematical
Section 2.1 Exercises
 Section. Linear Functions 47 Section. Exercises. A town's population has been growing linearly. In 00, the population was 45,000, and the population has been growing by 700 people each year. Write an equation
8th Grade Pre-Algebra
 8th Grade Pre-Algebra Multiple Choice Identif the choice that best completes the statement or answers the question.. Kell is learning about rational and irrational numbers. What conclusion can she draw
t 4.0 sec. 2. A bicyclist travels 60.0 kilometers in 3.5 hours. What is the cyclist s average speed?
 Name: Skill Sheet 3.1 Speed Problems This skill sheet will allow you to practice solving speed problems. To determine the speed of an object, you need to know the distance traveled and the time taken to
Algebra 1, Semester 1 Exam Review
 Algebra, Semester Exam Review What is an algebraic expression for the word phrase?. the sum of n and 9 A. n 9 n + 9 D. 9n. the difference of r and A. r + r D. r. the quotient of j and 8 A. 8j j 8 D. j
HS Mathematics Item Specification C1 TL Task Model 1
 Task Model 1 Matching Table DOK Level 1 F-IF.B.4 models a relationship quantities, interpret key features of graphs and tables in terms of the quantities, and sketch graphs showing key features given a
St. Michael s Episcopal School. Summer Math
 St. Michael s Episcopal School Summer Math for rising 7th & 8 th grade Algebra students 2017 Eighth Grade students should know the formulas for the perimeter and area of triangles and rectangles, the circumference
Algebra 2 Level 2 Summer Packet
 Algebra Level Summer Packet This summer packet is for students entering Algebra Level for the Fall of 01. The material contained in this packet represents Algebra 1 skills, procedures and concepts that
Grade 7, Unit 2 Practice Problems - Open Up Resources. Lesson 1. Problem 1. Problem 2. Yes, since 3 times 1.5 is 4 and 2 times 1.5 is 3.
 9//7, 0) AM Lesson Problem Which one of these shapes is not like the others? Explain what makes it different by representing each width and height pair with a ratio. C is different from A and B. For both
Name: Class: Date: ID: A. c. the quotient of z and 28 z divided by 28 b. z subtracted from 28 z less than 28
 Name: Class: Date: ID: A Review for Final Multiple Choice Identify the choice that best completes the statement or answers the question. 1. Give two ways to write the algebraic expression z 28 in words.
Chapter Start Thinking! For use before Activity 6.1. For use before Activity Start Thinking! For use before Lesson
 . Enrichment and Etension. a =, b =. a =, b =. a =, b =. a =, b =. a =, b is an number ecept.. a =, b =. a =, b =. a =, b =. Check students work.. Puzzle PAY HIM Etension. Start Thinking! For use before
Lesson 6: Graphs of Linear Functions and Rate of Change
 Lesson 6 Lesson 6: Graphs of Linear Functions and Rate of Change Classwork Opening Exercise Functions 1, 2, and 3 have the tables shown below. Examine each of them, make a conjecture about which will be
MAFS Algebra 1. FSA EOC Review. Day 19 - Student Packet
 MAFS Algebra 1 FSA EOC Review Day 19 - Student Packet Day 19: FSA EOC Review MAFS.912.A-CED.1.2 1. Lawrence's parents pay him a base allowance of $10 per week and $3.20 per hour for extra chores he completes.
Algebra 1 Honors First Semester Review
 Permitted resources: Algebra 1 Honors First Semester Review TI-108 (or similar basic four function calculator) Algebra 1 and Geometr EOC Reference Sheet 4. Identif the mapping diagram that represents the
ACCELERATED ALGEBRA ONE SEMESTER ONE REVIEW. Systems. Families of Statistics Equations. Models 16% 24% 26% 12% 21% 3. Solve for y.
 ACCELERATED ALGEBRA ONE SEMESTER ONE REVIEW NAME: The midterm assessment assesses the following topics. Solving Linear Systems Families of Statistics Equations Models and Matrices Functions 16% 24% 26%
1 An Introduction to the Rational Function EVALUATED. 4 Draw the graph for the rational function. (x)(y) = 100
(y) = 100") Real Functions Skill Builder 1 An Introduction to the Rational Function EVALUATED CHAPTER 3 1 Complete the table of values given below, using the following rational function rule, y = 24 x x 1 2 3 4 6
Real Functions Skill Builder 1 An Introduction to the Rational Function EVALUATED CHAPTER 3 1 Complete the table of values given below, using the following rational function rule, y = 24 x x 1 2 3 4 6
Name. Algebra I Period
 Name Algebra I Period 1 Simplify the following expression: 1 (8 2 4) 8 4 2 4 4 In slope-intercept form, what is the equation of a line with an x-intercept of -3 and a y-intercept of 5? Record your answer
Lesson 14: An Introduction to Domain and Range
 Exploratory Activity 1. Watch the Coin Counting video. What questions do you have? 2. What is the least amount of pennies that could be in the machine? Explain your thinking. 3. A. Make a guess about the
Lesson 3.notebook May 17, Lesson 2 Problem Set Solutions
 Lesson 2 Problem Set Solutions Student Outcomes Lesson 3: Analyzing a Verbal Description > Students make sense of a contextual situation that can be modeled with linear, quadratic, and exponential functions
CCGPS UNIT 1 Semester 1 COORDINATE ALGEBRA Page 1 of 33. Relationships Between Quantities Name:
 CCGPS UNIT 1 Semester 1 COORDINATE ALGEBRA Page 1 of 33 Relationships Between Quantities Name: Date: Reason quantitatively and use units to solve problems. MCC9-12.N.Q.1 Use units as a way to understand
Algebra I EOC Review (Part 2) NO CALCULATORS
 NO CALCULATORS") 1. A Nissan 370Z holds up to 18 gallons of gasoline. If it can travel on 22 miles per gallon in the city, write an equation to model this. 2. Carol wants to make a sculpture using brass and aluminum, with
1. A Nissan 370Z holds up to 18 gallons of gasoline. If it can travel on 22 miles per gallon in the city, write an equation to model this. 2. Carol wants to make a sculpture using brass and aluminum, with
Algebra 1, Chapter 4 Post Test
 Class: Date: Algebra 1, Chapter 4 Post Test Review 4.1.1: I can represent mathematical relationships using graphs. 1. (2 points) Sketch a graph of the speed of a city bus on a daily route. Label each section.
Simple Inequalities Involving Addition and Subtraction. Unit 3 Inequalities.notebook. November 18, Table of Contents
 Table of Contents Simple Inequalities Addition/Subtraction Simple Inequalities Multiplication/Division Two-Step and Multiple-Step Inequalities Solving Compound Inequalities Special Cases of Compound Inequalities
THANKS AND HAVE A GREAT SUMMER!
 6 th Grade to 7 th Grade Summer Math Packet For this Math packet please show as much work as you can. The concepts you are going to be working on are those of the Common Core Standards for 6 th Grade that
Student Name: Teacher: Date: District: Miami-Dade County Public Schools Assessment: 07 Mathematics Mathematics Interim 2
 Student Name: Teacher: Date: District: Miami-Dade County Public Schools Assessment: 07 Mathematics Mathematics Interim 2 Description: Mid-Year 2014 - Grade 7 Mathematics Form: 201 1. Which statement describes
How can you write and evaluate an expression that represents a real-life problem? ACTIVITY: Reading and Re-Reading
 .1 Algebraic Expressions How can you write and evaluate an expression that represents a real-life problem? 1 ACTIVITY: Reading and Re-Reading Work with a partner. a. You babysit for hours. You receive
Name: Class: Date: Unit 1. Thinking with Mathematical Models Investigation 2: Linear Models & Equations. Practice Problems
 Unit 1 Thinking with Mathematical Models Investigation 2: Linear Models & Equations Practice Problems Directions: Please complete the necessary problems to earn a maximum of 7 points according to the chart
1. What are the various types of information you can be given to graph a line? 2. What is slope? How is it determined?
 Graphing Linear Equations Chapter Questions 1. What are the various types of information you can be given to graph a line? 2. What is slope? How is it determined? 3. Why do we need to be careful about
Algebra 1 Unit 3 Practice
 Lesson 1-1 Use the table for Items 1 and. Canoe Rental Days Cost ($) 1 5 3 78 5 1 7 13 1. Use function notation to write a linear function that gives the cost C in dollars of renting a canoe for t days.
Solving Systems of Equations Introduction
 Solving Systems of Equations Introduction Outcome (lesson objective) Students will write simple systems of equations and become familiar with systems of equations vocabulary terms. Student/Class Goal Students
Why? Speed Skating Tracks offi cial track short track
 Applying Systems of Linear Equations Then You solved systems of equations by using substitution and elimination. (Lessons 6-2, 6-3, and 6-4) Now 1Determine the best method for solving systems of 2Apply
Math 803. Unit 1: Solving Equations in One Variable (8.EE.7) Part 2
 Part 2") Math 803 Unit 1: Solving Equations in One Variable (8.EE.7) Part 2 1.4 Variables on both sides (2.4 text) 1.5 Solve multi-step equations (2.5 text) Name: Period: Teacher s Name: 1 Lesson 1.4 Equations
Math 803 Unit 1: Solving Equations in One Variable (8.EE.7) Part 2 1.4 Variables on both sides (2.4 text) 1.5 Solve multi-step equations (2.5 text) Name: Period: Teacher s Name: 1 Lesson 1.4 Equations
AP CALCULUS BC SUMMER PREVIEW
 AP CALCULUS BC SUMMER PREVIEW Name: Your summer homework assignment is to write complete solutions for all of the problems listed in this packet. It is important that you have mastered the concepts covered
ALGEBRA 1 SUMMER ASSIGNMENT
 Pablo Muñoz Superintendent of Schools Amira Presto Mathematics Instructional Chair Summer Math Assignment: The Passaic High School Mathematics Department requests all students to complete the summer assignment.
Math Exam 1 Answers Fall Circle the LETTER of the correct answer for #1-3.
 Math 1800 Exam 1 Answers Fall 011 Circle the LETTER of the correct answer for #1-. (7 pts)1. An eight inch candle burns at a rate of 1 in/min; a twelve inch candle burns at a rate of 1 in/min. Which candle
Name Date Class. 5 y x + 7
 Name Date Class 7.EE.1 SELECTED RESPONSE Select the correct answer. 1. What property allows the expression.7x + 10. + 15.3x 8.x + 15.6 to be simplified to the equivalent expression 0x + 10. 8.x + 15.6?
Math 10 - Unit 6 - Functions - UNIT REVIEW WORKSHEET
 Class: Date: Math 10 - Unit 6 - Functions - UNIT REVIEW WORKSHEET Multiple Choice Identify the choice that best answers the question. 1. Which set of ordered pairs does not represent a function? Ï i) Ì
3.1 Exercises. Amount saved A (dollars) Section 3.1 Linear Models 233
 Section 3.1 Linear Models 233") Section 3.1 Linear Models 233 3.1 Exercises 1. Jodiah is saving his money to buy a Playstation 3 gaming system. He estimates that he will need $950 to buy the unit itself, accessories, and a few games.
Section 3.1 Linear Models 233 3.1 Exercises 1. Jodiah is saving his money to buy a Playstation 3 gaming system. He estimates that he will need $950 to buy the unit itself, accessories, and a few games.
Name Class Date. Essential question: How do you interpret, evaluate and write algebraic expressions that model real-world situations?
 Name Class Date 1-1 1 Variables and Expressions Going Deeper Essential question: How do you interpret, evaluate and write algebraic expressions that model real-world situations? A-SSE.1.1a ENGAGE Interpreting
2.4 Slope and Rate of Change
 2.4 Slope and Rate of Change Learning Objectives Find positive and negative slopes. Recognize and find slopes for horizontal and vertical lines. Understand rates of change. Interpret graphs and compare
Section 2.2 Objectives
 Section 2.2 Objectives Solve multi-step equations using algebra properties of equality. Solve equations that have no solution and equations that have infinitely many solutions. Solve equations with rational