Neighbouring populations, opposite dynamics: influence of body size and. environmental variation on the demography of stream-resident brown trout
|
|
|
- Valentine Hill
- 6 years ago
- Views:
Transcription
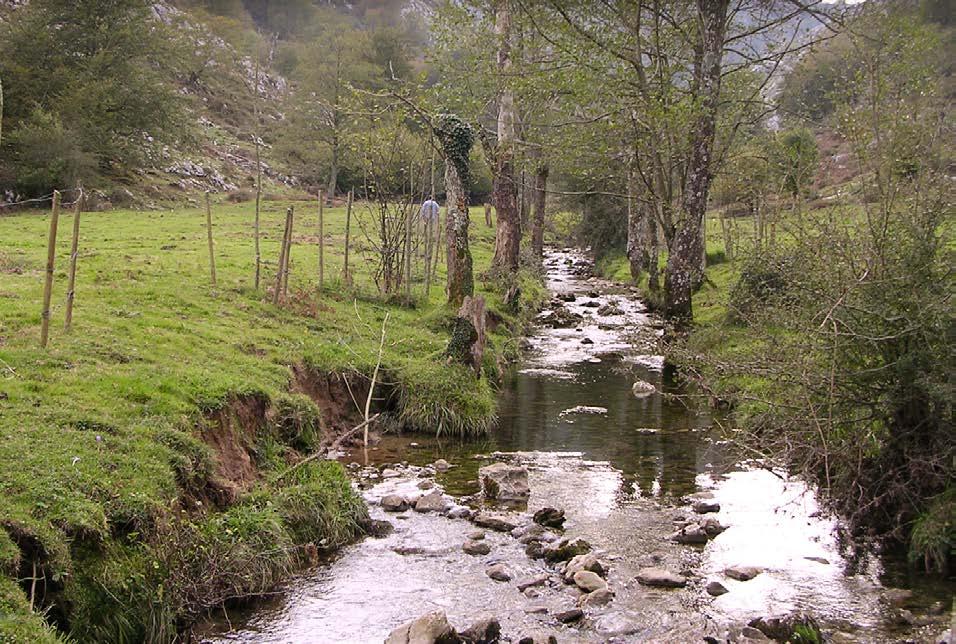
1 Electronic Supplementary Material - Oecologia Neighbouring populations, opposite dynamics: influence of body size and environmental variation on the demography of stream-resident brown trout (Salmo trutta). *a Albert Fernández-Chacón, a Meritxell Genovart, b David Álvarez, c José M. Cano, d Alfredo F. Ojanguren, e Rolando Rodriguez-Muñoz, b,c Alfredo G. Nicieza. a Population Ecology Group, Institut Mediterrani d Estudis Avançats (CSIC-UIB), Miquel Marqués 21, Esporles, Spain b Departamento de Biología de Organismos y Sistemas, University of Oviedo, Catedrático Rodrigo Uría s/n, 33006, Oviedo, Spain. c Research Unit of Biodiversity (UO-CSIC-PA), Campus de Mieres, Edificio de Investigación, Gonzalo Gutiérrez Quirós s/n, 33600, Mieres, Spain. d Scottish Oceans Institute, School of Biology, University of St. Andrews, KY16 8LB, St. Andrews, Scotland, UK. e Centre for Ecology & Conservation, School of Biosciences, University of Exeter, TR10 9EZ, Penryn, UK. * Corresponding author: albert.chacon@imr.no Current address: Institute of Marine Research, Nye Flødevigveien 20, 4817 Arendal, Norway.
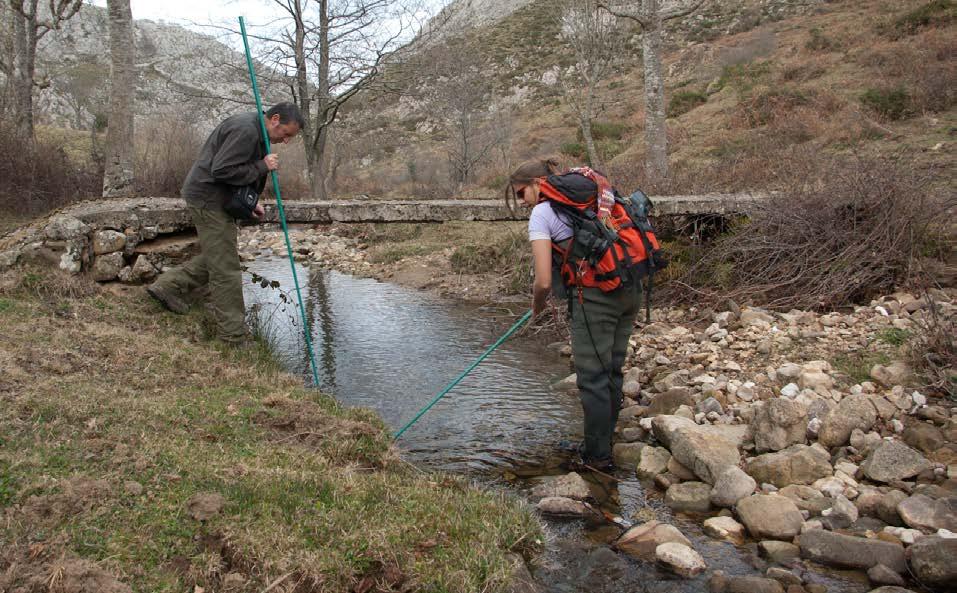
2 Electronic Supplementary Material - Oecologia Neighbouring populations, opposite dynamics: influence of body size and environmental variation on the demography of stream-resident brown trout (Salmo trutta). Albert Fernández-Chacón, Meritxell Genovart, David Álvarez, José M. Cano, Alfredo F. Ojanguren, Rolando Rodriguez-Muñoz, Alfredo G. Nicieza. Appendix 1 Number of captures as a proxy of minimum population size In the figure below we show the total number of captures (newly marked individuals + recaptures) per sampling occasion (winter and summer seasons) and stream. In the x-axis, September and March dates are used to broadly mark the boundaries of the two annual sampling seasons. We do not show data from 1996 at Comeya and Orandi as not all stream sections were sampled that year. Note that data for some winter seasons are also lacking at the highest altitude streams (Orbiandi and Comeya), whereas data for summer surveys are always available (and are the records used in our statistical analyses).
3 The total number of captures in a given season can be considered as a proxy of minimum population size for that time. In our case, population size seems to be higher in summer than in winter at Orbiandi and Comeya streams, but such fluctuations are not seen (or not so evident) at Orbiandi. Because of the lower number of captures recorded at this stream, the lowest population size in our study system would be that of Orbiandi, followed by Orandi and finally Comeya, Given that Orbiandi is the shortest and shallowest stream in our system and Comeya the largest one, with deeper stream areas, the minimum population sizes here reported seem also to reflect stream size. Total population size and population densities
4 The Multiple-pass removal method or Zippin method was used to estimate total population size in 1999 at Orbiandi stream, but unfortunately this was not replicated over time. This method was also used several times in Orandi to obtain estimates of population density (individuals/m 2 ) but such estimates are based on single stream sections and do not reflect total stream densities. In addition, the sections sampled in Orandi correspond to adult trout habitat (deeper sections), with low presence of juveniles. Total catches per pass and section are shown below. Orbiandi, March 1999 pass 1 pass 2 pass 3 pass 4 Total Section I Section II Section III Total Orandi Date Section pass 1 pass 2 pass 3 total catch Surface sampled (m 2 ) Orandi ,50 Orandi , Orandi ,75 Orandi , Orandi ,00 Orandi , Orandi ,00 Orandi ,00 Results for Orbiandi are close to a total number of 200 individuals, which is also the average number of total captures obtained per sampling occasion at this stream during the study period (see figure above). Results for Orandi cannot be extrapolated to the whole stream area and may only reflect total abundance and density of large trout in favorable habitats.
5 Electronic Supplementary Material - Oecologia Neighbouring populations, opposite dynamics: influence of body size and environmental variation on the demography of stream-resident brown trout (Salmo trutta). Albert Fernández-Chacón, Meritxell Genovart, David Álvarez, José M. Cano, Alfredo F. Ojanguren, Rolando Rodriguez-Muñoz, Alfredo G. Nicieza. Appendix 2 Variation in daily water temperature among study sites Due to differences in elevation and stream size, daily water temperature values may vary substantially among the study sites. Here, by means of figures S1, S2 and S3, we show, for the same winter period ( ) the daily mean, maximum and minimum water temperature values for each stream. This winter period corresponds to the central part of our entire study period ( ). Although not considered a winter month, November values are also given, to illustrate that water temperature differences are not only restricted to the official (December to March) winter time. Figure S1. Daily water temperature (green=mean, red=maximum and blue=minimum values) at Comeya stream from early November 1998 to late March 1999.
6 Daily temperature at Comeya /11/ /11/ /11/ /11/ /11/ /12/ /12/ /12/ /12/ /01/ /01/ /01/ /01/ /01/ /02/ /02/ /02/ /02/ /03/ /03/ /03/1999 Degrees Celsius 28/03/1999 Figure S2. Daily water temperature (green=mean, red=maximum and blue=minimum values) at Orandi stream from mid November 1998 to late March Daily temperature at Orandi Degrees Celsius /11/ /11/ /12/ /12/ /12/ /12/ /12/ /01/ /01/ /01/ /01/ /02/ /02/ /02/ /02/ /03/ /03/ /03/ /03/ /03/1999 Figure S3. Daily water temperature (green=mean, red=maximum and blue=minimum values) at Orbiandi stream from early November 1998 to late March 1999.
7 Daily temperature at Orbiandi /11/ /11/ /11/ /11/ /11/ /12/ /12/ /12/ /12/ /01/ /01/ /01/ /01/ /01/ /02/ /02/ /02/ /02/ /03/ /03/ /03/ /03/1999 Degrees Celsius Within this time frame, the smallest differences between daily maximum and minimum temperatures were found at Orandi stream, with an average difference of 2 degrees Celsius. For the same period, average differences between daily minimum and maximum temperatures were of 5 degrees Celsius at Orbiandi, and 3.5 degrees at Comeya, making Orbiandi the stream showing the widest range of daily temperature variation.
8 Electronic Supplementary Material - Oecologia Neighbouring populations, opposite dynamics: influence of body size and environmental variation on the demography of stream-resident brown trout (Salmo trutta). Albert Fernández-Chacón, Meritxell Genovart, David Álvarez, José M. Cano, Alfredo F. Ojanguren, Rolando Rodriguez-Muñoz, Alfredo G. Nicieza. Appendix 3 Size of sexual maturation of brown trout in the study area In our capture-recapture analysis, we divided individuals in different size categories reflecting juvenile, immature and mature stages based on an unpublished PhD thesis indicating that, in our study area, the average minimum length at which both male and female trout can be considered sexually mature was 130mm. In order to shed light on the validity of this assumption here we examine our own data on brown trout, which also includes some information about the sex (male/female) of the sampled individuals. Unfortunately, not all the individuals collected during our study period could be sexed successfully. This is because we based sex determination on phenotypic traits that become more obvious once the individuals have reached sexual maturity. Therefore, all individuals classified as male or female in our data must be also sexually mature, and because the length of captured trout was always recorded, we can examine the length of the sexed fish and validate, in terms of maturation status, the size-based states used in our analysis by looking at the proportion of successfully sexed (i.e. sexually mature) individuals per size category.
9 Results Comeya river Number of sexed individuals = 333 Length distribution of sexed individuals
10 Proportion of sexually mature individuals per size category at Comeya
11 Orandi river Number of sexed individuals = 497 Length distribution of sexed individuals
12 Proportion of sexually mature individuals per size category at Orandi
13 Orbiandi river Number of sexed individuals = 175 Length distribution of sexed individuals
14 Proportion of sexually mature individuals per size category at Orbiandi Discussion Results show that none of the sexed trout belonged to size class 1 (70-90mm). However, some sexed individuals did belong to class 2 (90-130mm). In all rivers, the minimum body length recorded for mature fish was below our boundary of 130mm (100mm at Comeya, 115 at Orandi and 111 at Orbiandi), but mature fish of size class 2 represented a low proportion (between 1.5 and 3.4%) of all mature fish recorded at all sites, with Orandi river showing the highest proportion of mature fish below 130mm in length (3.4% of sexed fish). In fact, almost all sexed fish (between 96.5 and 98.2%) measured more than 130mm in length, validating this category as the one containing sexually mature individuals in our study populations. In addition, these results also reflect spatial differences in the length distribution of sexually mature fish, with individuals from Comeya and Orandi reaching sizes well above 300mm, whereas those at Orbiandi never reached sizes above 258mm.
15 Electronic Supplementary Material - Oecologia Neighbouring populations, opposite dynamics: influence of body size and environmental variation on the demography of stream-resident brown trout (Salmo trutta). Albert Fernández-Chacón, Meritxell Genovart, David Álvarez, José M. Cano, Alfredo F. Ojanguren, Rolando Rodriguez-Muñoz, Alfredo G. Nicieza. Appendix 4 Specification of the multistate modelling approach in program E-SURGE Multistate models were built in several stages using program E-SURGE (Choquet and Nogue 2010). Each step represents one of the different parameters to estimate (Φ, ψ, p, see below). This is done by means of row-stochastic matrices, i.e. each row corresponds to a multinomial. Consequently, the total of cell probabilities is 1. Because of this constraint, one and only one cell probability in each row will be calculated as the complement to 1 of the others. This particular cell is denoted with a * symbol. Inactive cells, i.e. cells whose associated probability is structurally 0 are denoted with a - symbol. An active cell receives an arbitrary letter. Note that the same letter/symbol in two cells does not mean that the two values should be equal. The individual states (size classes) considered are: O, Juvenile (size class 1). I, Immature (size class 2). M, Mature (size class 3)., Dead. The possible events (field observations) are:
16 1, seen measuring less than 90mm. 2, seen measuring between 90 and 130mm. 3, seen measuring more than 130mm. 0, not seen. The symbols for parameters are: Y, Initial state probability Φ, survival probability ψ, transition probability p, event probability (=recapture probability) Initial State probabilities ( Dead cannot be an initial state) 1x3 O I M Y Y * State transitions, step 1: Survival probability (Note: E-SURGE refers to both survival and transition steps as transitions as they are defined using transition matrices) 4x4 From/to O I M O Φ - - * I - Φ - * M - - Φ * *
17 State transitions, step 2: Transition probabilities conditional on survival (Note: because fish do not shrink in length, transitions from a bigger size-state to a smaller size-state are impossible and fixed to zero using symbol -. Juvenile fish that have survived a winter may transition either to state I or M, but cannot stay in O. In this case, direct transitions from O to M were considered as the complement of growth transitions from O to I) 5x5 From/to O I M O - ψ * - I - * ψ - M - - * * Event (= recapture) probabilities 8x5 From/to Not seen (0) Measuring less than 90 mm (1) Measuring between 90 and 130 mm (2) Measuring more than 130 mm (3) O * p - - I * - p - M * - - p * - - -
18 Electronic Supplementary Material - Oecologia Neighbouring populations, opposite dynamics: influence of body size and environmental variation on the demography of stream-resident brown trout (Salmo trutta). Albert Fernández-Chacón, Meritxell Genovart, David Álvarez, José M. Cano, Alfredo F. Ojanguren, Rolando Rodriguez-Muñoz, Alfredo G. Nicieza. Appendix 5 List of the models tested in the analysis of capture-recapture data for each stream. For each stream, models are ranked in a sequential order: those below the horizontal line are the ones containing external covariates and correspond to the second modelling step, departing from the consensus model (the best model above the horizontal line). The structure of each model is partitioned in Survival (S), growth transitions (T1) maturation transitions (T2) and recapture probabilities (p), over which time (t), constancy (.), state effects (size), and state*time interactions (size.t) are tested. winter corresponds to the proportion of optimal winter days from December to March, whereas spring corresponds to the mean temperature from April to June. For each model of the set, the number of identifiable parameters (np), Deviance, QAIC values and the difference in QAIC (ΔQAIC) between a particular model and the best model of the set are given.
19 ORANDI Model S T1 T2 p np Deviance QAIC ΔQAIC Full model size.t t t t , ,466 4,9873 Model 2 size.t t t (.) , ,914 6,4356 Model 3 size t t t , ,539 25,0605 Model 4 t t t t , ,33 27,8516 Model 5 (.) t t t , ,911 47,4325 Model 6 S1(.),S2(t),S3(t) t t t , ,092 10,6138 Model 7 S2(.),S1(t),S3(t) t t t , ,565 11,0868 Model 8 S3(.),S1(t),S2(t) t t t , ,63 20,1519 Model 9 size.t (.) t t , ,369 1,8906 Model 10 size.t t (.) t , ,579 3,101 Model 11 size.t (.) (.) t , ,478 0 Model 12 size.winter (.) (.) t , ,867 18,3883 Model 13 S1(winter),S2(t),S3(t) (.) (.) t ,999 1,5206 Model 14 S2(winter),S1(t),S3(t) (.) (.) t ,793 5,3143 Model 15 S3(winter),S1(t),S2(t) (.) (.) t ,433 7,9551
20 ORBIANDI Model S T1 T2 p np Deviance QAIC ΔQAIC Full model size.t t t t , ,681 11,0962 Model 2 size.t t t (.) , ,753 8,1681 Model 3 size t t (.) , ,225 28,6402 Model 4 t t t (.) , ,402 6,8174 Model 5 (.) t t (.) , ,509 27,9247 Model 6 S1(.), S2(t), S3(t) t t (.) , ,38 13,7951 Model 7 S2(.), S1(t), S3(t) t t (.) , ,64 15,0552 Model 8 S3(.), S1(t), S2(t) t t (.) , ,11 15,5251 Model 9 t t (.) (.) , ,183 8,599 Model 10 t (.) t (.) , ,073 1,4881 Model 11 t (.) (.) (.) , ,939 3,3547 Model 12 winter (.) t (.) , ,904 5,3197 Model 13 t (.) spring (.) , ,584 0 Model 14 winter (.) spring (.) , ,063 11,4787
21 COMEYA Model S T1 T2 p np Deviance QAIC ΔQAIC Full model size.t t t t , ,727 10,1513 Model 2 size.t t t (.) , ,842 7,2664 Model 3 size t t (.) , ,245 48,6696 Model 4 (.) t t (.) , ,9 56,325 Model 5 t t t (.) , ,654 62,0789 Model 6 S1(.), S2(t), S3(t) t t (.) , ,57 15,9949 Model 7 S2(.), S1(t), S3(t) t t (.) , ,476 22,9004 Model 8 S3(.), S1(t), S2(t) t t (.) , ,449 23,8739 Model 9 size.t (.) t (.) , ,525 5,9493 Model 10 size.t t (.) (.) , ,831 16,2555 Model 11 size.t (.) (.) (.) , ,511 14,9358 Model 12 size.winter (.) t (.) , ,661 52,0857 Model 13 S1(winter), S2(t), S3(t) (.) t (.) , ,357 14,782 Model 14 S2(winter), S1(t), S2(t) (.) t (.) , ,431 6,856 Model 15 S3(winter), S1(t), S2(t) (.) t (.) , ,562 1,9867 Model 16 S3(winter), S1(t), S2(t) (.) spring (.) , ,575 0
22 Electronic Supplementary Material - Oecologia Neighbouring populations, opposite dynamics: influence of body size and environmental variation on the demography of stream-resident brown trout (Salmo trutta). Albert Fernández-Chacón, Meritxell Genovart, David Álvarez, José M. Cano, Alfredo F. Ojanguren, Rolando Rodriguez-Muñoz, Alfredo G. Nicieza. Appendix 6 E-SURGE model syntax: GEMACO Constructing models in E-SURGE requires first to define the transition matrices and parameters to be estimated using the GEnerator of model PATterns (GEPAT; see appendix 4) and secondly to define the structure of the model we want to run (i.e. the effects that are to be tested in each model parameter) by means of the GEnerator of MAtrices of COnstraints (GEMACO). Both are tools incorporated into the E-SURGE program in a user-friendly way. The GEMACO interface allows incorporating the desired effects or constraints automatically into a design matrix by writing phrases (or keywords) using a particular syntax. This syntax or gemaco language is explained in detail in the E-SURGE 1.8. manual and makes explicit reference to the structure previously defined in the GEPAT step (i.e. numbers and words such as from or f and to are used to identify row and matrix columns). Each parameter in the model has an associated gemaco expression or phrase, so the complete model syntax is divided in steps representing the different parameter-associated phrases that conform the structure of the mathematical model. Therefore, because we constructed different models departing from a general structure and tested effects one parameter at a time, usually two models will have identical syntax in all but one parameter. Here we provide the syntax for the following model structures:
23 General full model Phrase for initial state : to.t Phrase for survival probability : f.t Phrase for transition probabilities : f.t Phrase for recapture probabilities : firste+nexte.to(2)+nexte.to(3 4).t Model with constant recapture probability Phrase for initial state : to.t Phrase for survival probability : f.t Phrase for transition probabilities : f.t Phrase for recapture probabilities : firste+nexte.to(2)+nexte.to(3 4) Model with state-effects on survival, but constancy over time Phrase for initial state : to.t Phrase for survival probability : f Phrase for transition probabilities : f.t Phrase for recapture probabilities : firste+nexte.to(2)+nexte.to(3 4).t Model without state-effects on survival, but time dependence Phrase for initial state : to.t Phrase for survival probability : t Phrase for transition probabilities : f.t
24 Phrase for recapture probabilities : firste+nexte.to(2)+nexte.to(3 4).t Model with constancy in survival rates Phrase for initial state : to.t Phrase for survival probability : i Phrase for transition probabilities : f.t Phrase for recapture probabilities : firste+nexte.to(2)+nexte.to(3 4).t Model with constancy in survival for one size state but time dependence for others* Phrase for initial state : to.t Phrase for survival probability : f(1)+f(2,3).t Phrase for transition probabilities : f.t Phrase for recapture probabilities : firste+nexte.to(2)+nexte.to(3 4).t *In this case, the syntax means that there are no time effects in survival for state 1 (smallest size-state) but there are time effects in survival for states 2 and 3 (immature and mature states) Model with constancy in growth transitions Phrase for initial state : to.t Phrase for survival probability : f.t Phrase for transition probabilities : f(1)+f(2).t Phrase for recapture probabilities : firste+nexte.to(2)+nexte.to(3 4).t Model with constancy in maturation transitions Phrase for initial state : to.t
25 Phrase for survival probability : f.t Phrase for transition probabilities : f(1).t+f(2) Phrase for recapture probabilities : firste+nexte.to(2)+nexte.to(3 4).t Model with constancy in both growth and maturation transitions Phrase for initial state : to.t Phrase for survival probability : f.t Phrase for transition probabilities : f(1)+f(2) Phrase for recapture probabilities : firste+nexte.to(2)+nexte.to(3 4).t Model with temperature effects on survival (valid for transition probabilities alike)* Phrase for initial state : to.t Phrase for survival probability : f.[i+t*x(1)] Phrase for transition probabilities : f.t Phrase for recapture probabilities : firste+nexte.to(2)+nexte.to(3 4).t * The phrase in brackets shows a multiplicative function between time and the external covariate (temperature). In this phrase, the external covariate (x) has an associated number (1) that indicates the row containing the values (i.e. seasonal temperature values) in the covariate file. Thus, to write this syntax, first we have to link a external covariate file to the GEMACO interface of E-SURGE. At the same time, this phrase is interacting with state ( f makes reference to the rows in the matrix, which represent the number of states), so here we are testing whether temperature has an effect on survival in all size-states. Model with temperature effects on survival in one size-state but not in others*
26 Phrase for initial state : to.t Phrase for survival probability : f(2).[i+t*x(1)]+f(1,3).t Phrase for transition probabilities : f.t Phrase for recapture probabilities : firste+nexte.to(2)+nexte.to(3 4).t *In this case, we are testing for temperature effects on the survival of size-state 2 but time dependence on the survival of states 1 and 3. Alternative combinations can be tested by replacing numbers 1, 2 and 3 in the phrase for survival. Model with temperature effects on one of the transition parameters Phrase for initial state : to.t Phrase for survival probability : f.t Phrase for transition probabilities : f(1).[i+t*x(1)]+f(2).t Phrase for recapture probabilities : firste+nexte.to(2)+nexte.to(3 4).t *In this case, we are testing for temperature effects on growth but time dependence on maturation transitions; such transitions occur from state 1 and from state 2 respectively, hence the expressions f(1) and f(2).
27 Electronic Supplementary Material - Oecologia Neighbouring populations, opposite dynamics: influence of body size and environmental variation on the demography of stream-resident brown trout (Salmo trutta). Albert Fernández-Chacón, Meritxell Genovart, David Álvarez, José M. Cano, Alfredo F. Ojanguren, Rolando Rodriguez-Muñoz, Alfredo G. Nicieza. Appendix 7 Encounter history datasets Here, by means of 3 encounter history datasets, we show the longitudinal data collected at each stream (Orandi, Orbiandi and Comeya) during the study period. Rows in each dataset contain information regarding a single tagged individual. The total number of rows in the dataset gives the total number of individuals sampled during the study period at this particular stream. Each individual row contains 2 types of information: i) Encounter history: corresponds to the first sequence of 5 numbers. Each number in the sequence corresponds to an observed event and events are displayed in chronological order, being the first event the one corresponding to the first sampling occasion (1996 for Orandi and Comeya but 1997 for Orbiandi) and the last event the one corresponding to the last year of the study, in this particulat stream (which can be year 2000 or 2001, depending on the stream). Event codes are as follows: 1, seen measuring less than 90mm. 2, seen measuring between 90 and 130mm. 3, seen measuring more than 130mm.
28 0, not seen. ii) Frequency: an extra column that validates the encounter history and can be used to calculate the number of individuals with the same type of encounter history. #Dataset1:Orandi ; ; ; ; ; ;
29 ; ; ; ; ; ; ; ; ; ; ; ; ; ; ; ;
30 ; ; ; ; ; ; ; ; ; ; ; ;
31 ; ; ; ; ; ;
32 ; ; ; ; ; ; ; ; ; ; ; ; ; ; ; ; ; ; ; ; ; ; ; ; ; ; ; ; ; ; ; ; ; ; ; ; ; ; ; ; ; ; ;
33 ; ; ; ; ; ; ;
34 ; ; ; ; ; ; ; ; ; ; ; ; ; ; ; ; ; ; ; ; ;
35 ; ; ; ; ; ; ; ; ; ; ; ; ; ; ; ; ; ; ; ;
36 ; ; ;
37 ; ; ;
38 ; ;
39 ; ; ; ; ; ; ;
40
41 ; ; ;
42 ;
43
44 #Dataset 2:Orbiandi ; ; ; ;
45 ; ; ; ; ; ; ; ; ; ; ; ; ; ; ; ; ; ; ; ; ; ; ; ; ; ; ;
46 ; ; ; ; ; ; ; ; ; ; ; ; ; ; ; ; ; ; ; ; ; ; ; ; ; ; ;
47 ; ; ; ; ; ; ; ; ; ; ; ; ; ; ; ; ; ; ; ; ; ; ; ; ; ; ; ;
48 ; ; ; ; ; ; ; ; ; ; ; ; ; ; ; ; ; ; ; ; ; ; ; ; ; ; ; ; ; ; ; ; ; ; ; ; ;
49 ; ; ; ; ; ; ; ; ; ; ; ; ; ; ; ; ; ;
50 ; ; ; ; ; ; ;
51 ; #Dataset 3:Comeya ; ; ; ; ;
52 ; ; ; ; ; ; ; ; ; ;
53 ; ; ; ; ;
54 ; ; ; ;
55 ; ; ; ;
56 ; ; ; ; ; ; ; ; ; ; ; ; ;
57 ; ;
58 ; ; ;
59 ; ;
60 ; ; ; ; ; ; ; ; ; ;
61 ; ;
62 ; ; ; ;
63 ;
64 ; ; ; ; ; ;
65
66
67
68 ;
69
70 ; ; ;
71
72
73 ;
74
75 ; ;
76
77
78 ; ; ; ; ;
79 ; ; ; ; ; ;
80
81
82
83
84
85
86
87
88
89
90
91
92

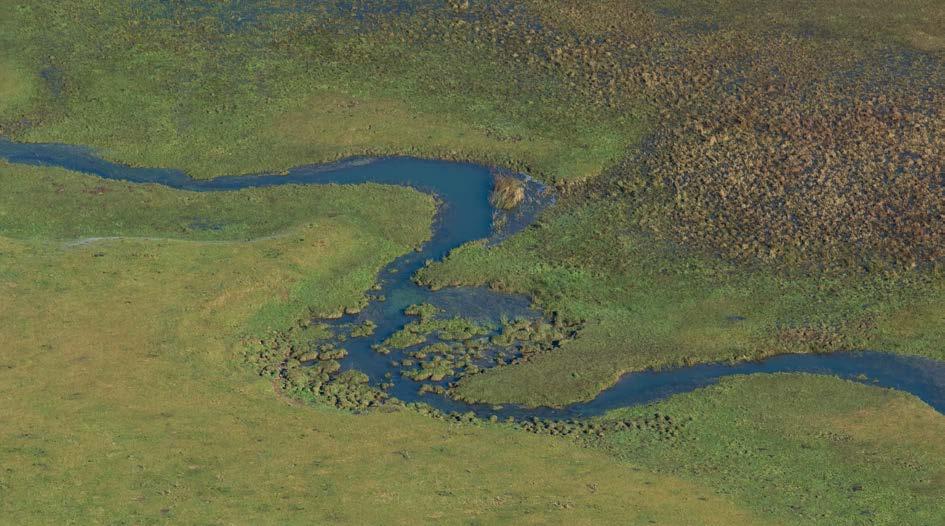
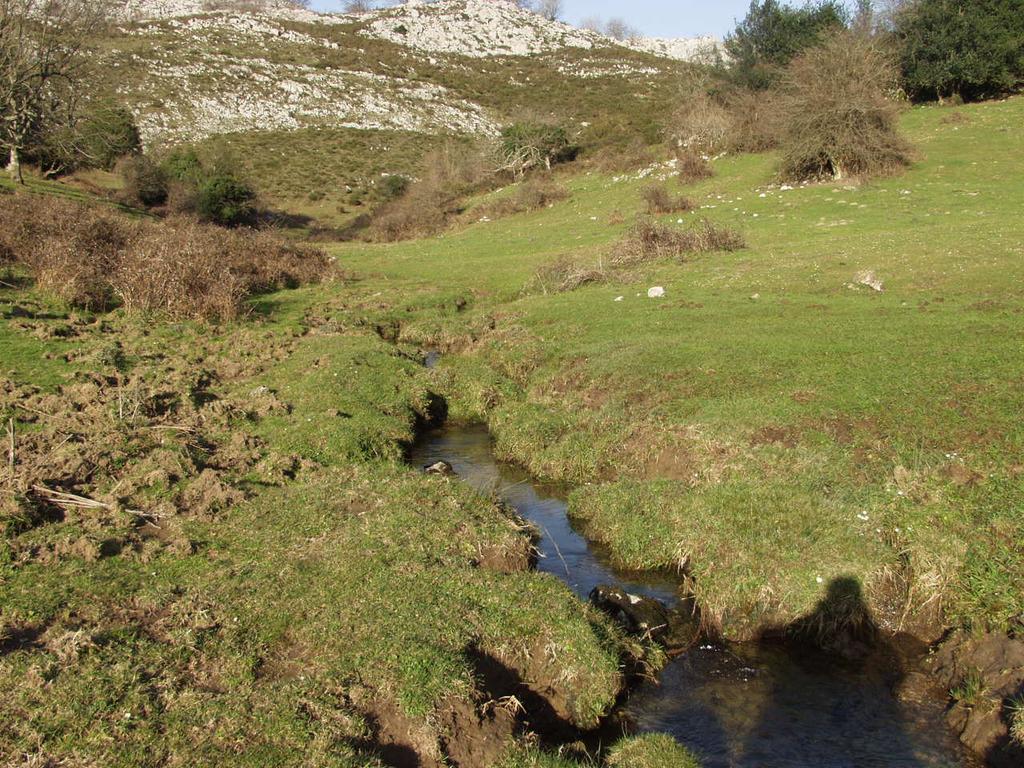
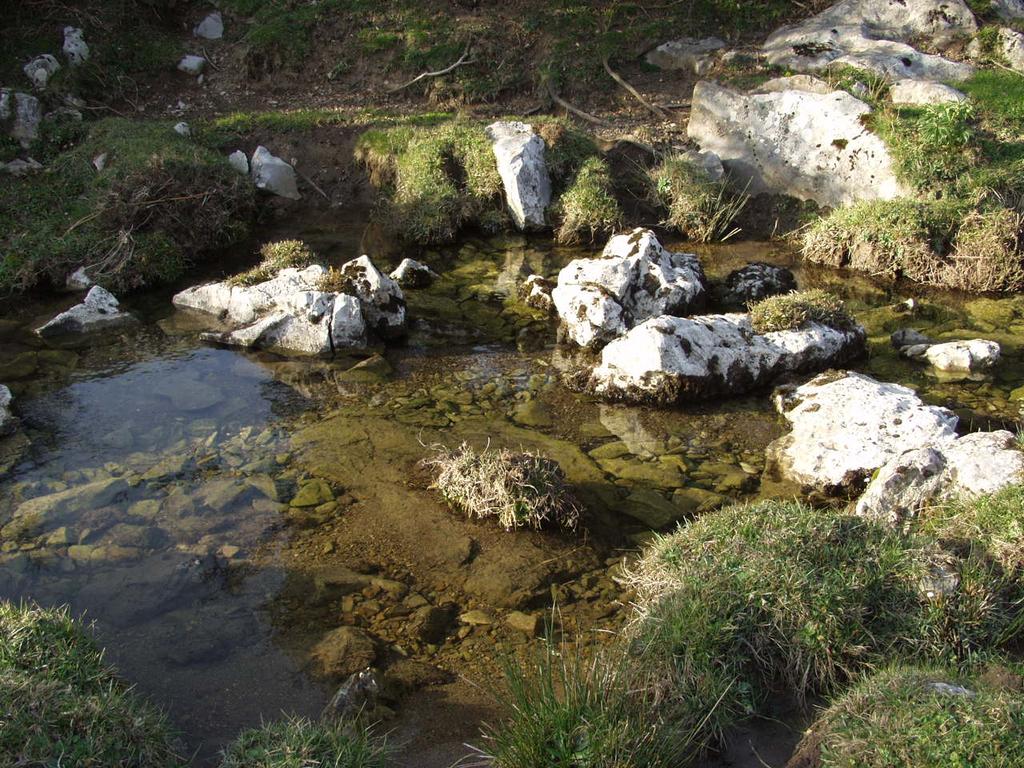
93 Comeya Study sites
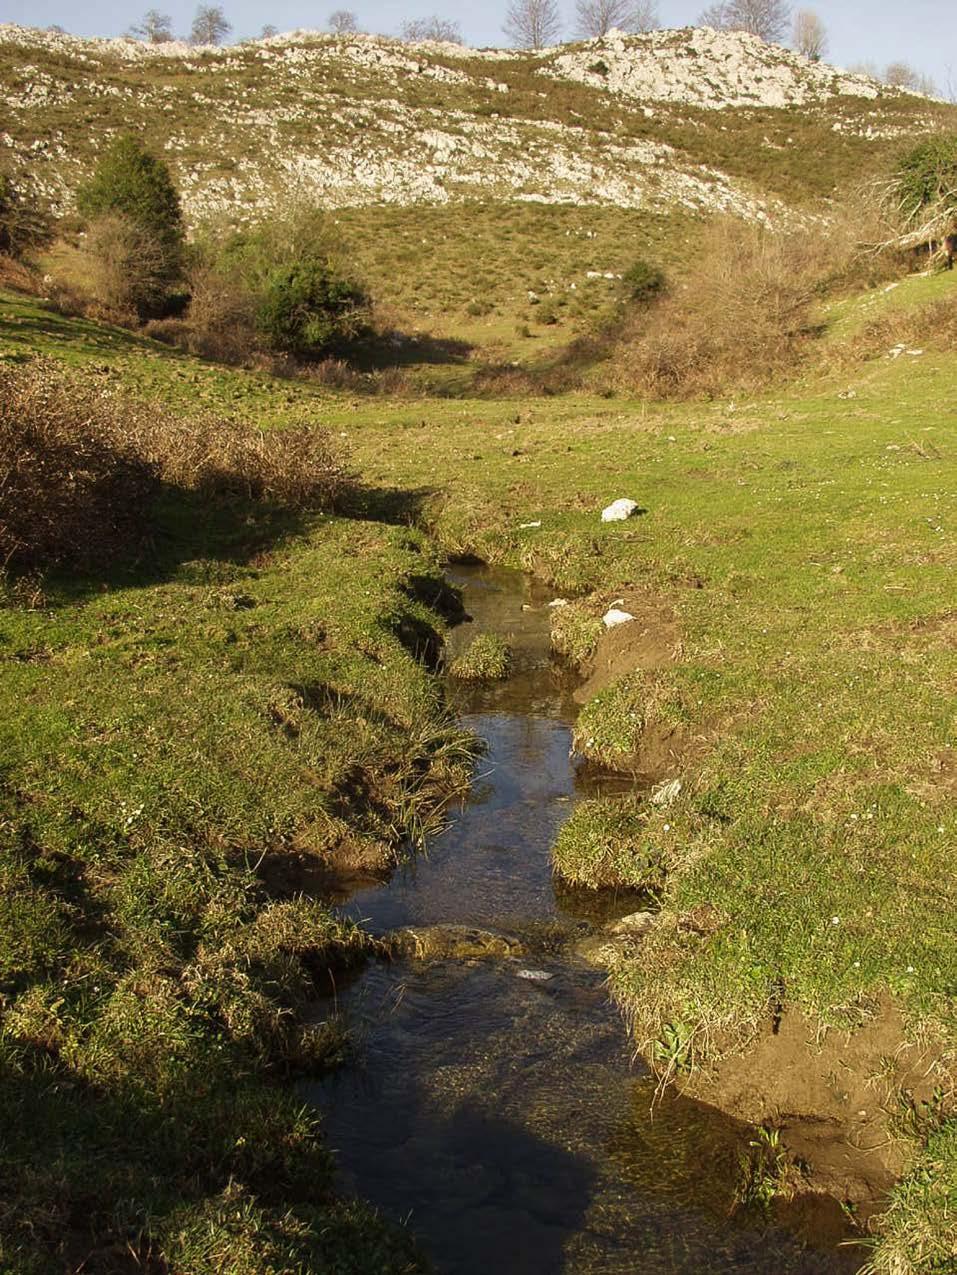
94 Orbiandi
95
96 Orandi
97
Input from capture mark recapture methods to the understanding of population biology
 Input from capture mark recapture methods to the understanding of population biology Roger Pradel, iostatistics and Population iology team CEFE, Montpellier, France 1 Why individual following? There are
Relationship between weather factors and survival of mule deer fawns in the Peace Region of British Columbia
 P E A C E R E G I O N T E C H N I C A L R E P O R T Relationship between weather factors and survival of mule deer fawns in the Peace Region of British Columbia by: Nick Baccante and Robert B. Woods Fish
FW Laboratory Exercise. Program MARK with Mark-Recapture Data
 FW663 -- Laboratory Exercise Program MARK with Mark-Recapture Data This exercise brings us to the land of the living! That is, instead of estimating survival from dead animal recoveries, we will now estimate
Geographic Information Systems (GIS) and inland fishery management
 and inland fishery management") THEMATIC REPORT Geographic Information Systems (GIS) and inland fishery management Stratified inland fisheries monitoring using GIS Gertjan DE GRAAF Nefisco, Amsterdam, the Netherlands Felix MARTTIN and
THEMATIC REPORT Geographic Information Systems (GIS) and inland fishery management Stratified inland fisheries monitoring using GIS Gertjan DE GRAAF Nefisco, Amsterdam, the Netherlands Felix MARTTIN and
Lecture 2: Individual-based Modelling
 Lecture 2: Individual-based Modelling Part I Steve Railsback Humboldt State University Department of Mathematics & Lang, Railsback & Associates Arcata, California USA www.langrailsback.com 1 Outline 1.
PH YSIC A L PROPERT IE S TERC.UCDAVIS.EDU
 PH YSIC A L PROPERT IE S 8 Lake surface level Daily since 1900 Lake surface level varies throughout the year. Lake level rises due to high stream inflow, groundwater inflow and precipitation directly onto
PRELIMINARY DRAFT FOR DISCUSSION PURPOSES
 Memorandum To: David Thompson From: John Haapala CC: Dan McDonald Bob Montgomery Date: February 24, 2003 File #: 1003551 Re: Lake Wenatchee Historic Water Levels, Operation Model, and Flood Operation This
Journal of Avian Biology
 Journal of Avian Biology JAV-01 McKnight, A., Blomberg, E. J., Golet, G. H., Irons, D. B., Loftin, C. S. and McKinney, S. T. 01. Experimental evidence of long-term reproductive costs in a colonial nesting
2001 State of the Ocean: Chemical and Biological Oceanographic Conditions in the Newfoundland Region
 Stock Status Report G2-2 (2) 1 State of the Ocean: Chemical and Biological Oceanographic Conditions in the Background The Altantic Zone Monitoring Program (AZMP) was implemented in 1998 with the aim of
Online appendix 1: Detailed statistical tests referred to in Wild goose dilemmas by Black, Prop & Larsson
 Online appendix 1: Detailed statistical tests referred to in Wild goose dilemmas by Black, Prop & Larsson Table 1. Variation in length of goslings association (days) with parents in relation to birth year
Appendix 1: UK climate projections
 Appendix 1: UK climate projections The UK Climate Projections 2009 provide the most up-to-date estimates of how the climate may change over the next 100 years. They are an invaluable source of information
PROGRESS REPORT for COOPERATIVE BOBCAT RESEARCH PROJECT. Period Covered: 1 January 31 May Prepared by
 PROGRESS REPORT for COOPERATIVE BOBCAT RESEARCH PROJECT Period Covered: 1 January 31 May 2011 Prepared by John A. Litvaitis, Derek Broman, and Marian K. Litvaitis Department of Natural Resources University
Spatio-temporal dynamics of Marbled Murrelet hotspots during nesting in nearshore waters along the Washington to California coast
 Western Washington University Western CEDAR Salish Sea Ecosystem Conference 2014 Salish Sea Ecosystem Conference (Seattle, Wash.) May 1st, 10:30 AM - 12:00 PM Spatio-temporal dynamics of Marbled Murrelet
Exemplar for Internal Achievement Standard. Mathematics and Statistics Level 3
 Exemplar for internal assessment resource Mathematics and Statistics for Achievement Standard 91580 Exemplar for Internal Achievement Standard Mathematics and Statistics Level 3 This exemplar supports
Daylight Data: Days and Nights Around the World
 Days & Nights 1 Name Daylight Data: Days and Nights Around the World Purpose: To investigate the number of hours of daylight received by countries at different latitudes. Materials: Daylight data sheet
Grant Opportunity Monitoring Bi-State Sage-grouse Populations in Nevada
 Grant Opportunity Monitoring Bi-State Sage-grouse Populations in Nevada Proposals are due no later than November 13, 2015. Grant proposal and any questions should be directed to: Shawn Espinosa @ sepsinosa@ndow.org.
Chapter 9: Modeling Our World Lecture notes Math 1030 Section A
 Section A.1: Functions: the Building Blocks of Mathematical Models Mathematical models The purpose of a mathematical model is to represent something real (like economic changes) and help us to understand
Advice September 2012
 9.4.23 Advice September 2012 ECOREGION STOCK Widely distributed and migratory stocks European seabass in the Northeast Atlantic Advice for 2013 ICES advises on the basis of the approach to data-limited
PHYSICAL PROPERTIES TAHOE.UCDAVIS.EDU 8
 PHYSICAL PROPERTIES 8 Lake surface level Daily since 1900 Lake surface level varies throughout the year. Lake level rises due to high stream inflow, groundwater inflow, and precipitation directly onto
Great Lakes Update. Volume 199: 2017 Annual Summary. Background
 Great Lakes Update Volume 199: 2017 Annual Summary Background The U.S. Army Corps of Engineers (USACE) tracks and forecasts the water levels of each of the Great Lakes. This report is primarily focused
Lecture 7 Models for open populations: Tag recovery and CJS models, Goodness-of-fit
 WILD 7250 - Analysis of Wildlife Populations 1 of 16 Lecture 7 Models for open populations: Tag recovery and CJS models, Goodness-of-fit Resources Chapter 5 in Goodness of fit in E. Cooch and G.C. White
Modeling Fish Assemblages in Stream Networks Representation of Stream Network Introduction habitat attributes Criteria for Success
 Modeling Fish Assemblages in Stream Networks Joan P. Baker and Denis White Western Ecology Division National Health & Environmental Effects Research Laboratory U.S. Environmental Protection Agency baker.joan@epa.gov
Final Report for the Green Valley Creek Winter Refugia Enhancement Project Monitoring December 2016
 Final Report for the Green Valley Creek Winter Refugia Enhancement Project Monitoring December 2016 Prepared by: Mariska Obedzinski and Sarah Nossaman University of California Cooperative Extension & California
FW Laboratory Exercise. Program MARK: Joint Live Recapture and Dead Recovery Data and Pradel Model
 FW663 -- Laboratory Exercise Program MARK: Joint Live Recapture and Dead Recovery Data and Pradel Model Today s exercise explores parameter estimation using both live recaptures and dead recoveries. We
American Harris mud crab Rhithropanopeus harrisii
 American Harris mud crab Rhithropanopeus harrisii (Gould, 1841) in the Gulf of Gdańsk (southern Baltic Sea): distribution, population structure and basic physiological processes Joanna Hegele-Drywa Alien
2011 Year in Review TORNADOES
 2011 Year in Review The year 2011 had weather events that will be remembered for a long time. Two significant tornado outbreaks in April, widespread damage and power outages from Hurricane Irene in August
Math 102 Test Chapters 5, 6,7, 8 Name: Problems Chosen: Extra Credit Chosen:
 Math 102 Test Chapters 5, 6,7, 8 Name: Problems Chosen: Extra Credit Chosen: Directions: Choose 8 problems. Each will be worth 25 points for a total of 200 points. You must include two from {1,2,3,4},
Current and future climate of the Cook Islands. Pacific-Australia Climate Change Science and Adaptation Planning Program
 Pacific-Australia Climate Change Science and Adaptation Planning Program Penrhyn Pukapuka Nassau Suwarrow Rakahanga Manihiki N o r t h e r n C o o k I s l a nds S o u t h e Palmerston r n C o o k I s l
IASRB Metadatabase of Salmon Survey Data and Sample Collections of Relevance to Mortality of Salmon at Sea
 Name of Data Sample Collection Information Description (e.g. including location of data/sample collection, # of samples) External tag recoveries from tagging programmes in, USA, EU, Norway and Russia and
Competition-induced starvation drives large-scale population cycles in Antarctic krill
 In the format provided by the authors and unedited. SUPPLEMENTARY INFORMATION VOLUME: 1 ARTICLE NUMBER: 0177 Competition-induced starvation drives large-scale population cycles in Antarctic krill Alexey
Ocean & Sea Ice SAF. Validation of ice products January March Version 1.1. May 2005
 Ocean & Sea Ice SAF Validation of ice products January 2002 - March 2005 Version 1.1 May 2005 Morten Lind, Keld Q. Hansen, Søren Andersen 1 INTRODUCTION... 3 2 PRODUCTS VALIDATION METHODS... 3 3 GENERAL
How small can isolated brook trout populations become and still respond to environmental change?
 Dylan J. Fraser Department of Biology, Concordia University Research Collaborators: Dr. Jacquelyn Wood Dr. Paul Debes Matthew Yates (PhD candidate) Thais Bernos (MSc candidate) Zachery Wells (MSc candidate)
J.P. Glazer and D.S. Butterworth
 A summary of the General Linear Modelling approach applied to standardize the CPUE data for the offshore trawl fishery for Merluccius capensis and M. paradoxus off the coast of South Africa. Introduction
Levels of Ecological Organization. Biotic and Abiotic Factors. Studying Ecology. Chapter 4 Population Ecology
 Chapter 4 Population Ecology Lesson 4.1 Studying Ecology Levels of Ecological Organization Biotic and Abiotic Factors The study of how organisms interact with each other and with their environments Scientists
Chapter 4 Population Ecology
 Chapter 4 Population Ecology Lesson 4.1 Studying Ecology Levels of Ecological Organization The study of how organisms interact with each other and with their environments Scientists study ecology at various
A Report on a Statistical Model to Forecast Seasonal Inflows to Cowichan Lake
 A Report on a Statistical Model to Forecast Seasonal Inflows to Cowichan Lake Prepared by: Allan Chapman, MSc, PGeo Hydrologist, Chapman Geoscience Ltd., and Former Head, BC River Forecast Centre Victoria
Great Lakes Update. Volume 188: 2012 Annual Summary
 Great Lakes Update Volume 188: 2012 Annual Summary Background The U.S. Army Corps of Engineers (USACE) tracks the water levels of each of the Great Lakes. This report highlights hydrologic conditions of
L.O: EARTH'S 23.5 DEGREE TILT ON ITS AXIS GIVES EARTH ITS SEASONS March 21 (SPRING), June 21(SUMMER), Sept 22 (AUTUMN) & Dec 21(WINTER)
, June 21(SUMMER), Sept 22 (AUTUMN) & Dec 21(WINTER)") L.O: EARTH'S 23.5 DEGREE TILT ON ITS AXIS GIVES EARTH ITS SEASONS March 21 (SPRING), June 21(SUMMER), Sept 22 (AUTUMN) & Dec 21(WINTER) 1. The apparent daily path of the Sun changes with the seasons because
L.O: EARTH'S 23.5 DEGREE TILT ON ITS AXIS GIVES EARTH ITS SEASONS March 21 (SPRING), June 21(SUMMER), Sept 22 (AUTUMN) & Dec 21(WINTER) 1. The apparent daily path of the Sun changes with the seasons because
Admin. 8/29/17. If you re at North Pole, you ll NEVER see stars that are below your horizon. Key Concepts: Lecture 4
 Admin. 8/29/17 1. Class website http://www.astro.ufl.edu/~jt/teaching/ast1002/ 2. Optional Discussion sections (start Aug. 30th) (see me at end of lecture if you can t make one of these times)! Tuesday
2017 Technical Revision to the Marine Survival Forecast of the OCN Coho Work Group Harvest Matrix Erik Suring Oregon Department of Fish and Wildlife
 2017 Technical Revision to the Marine Survival Forecast of the OCN Coho Work Group Harvest Matrix Erik Suring Oregon Department of Fish and Wildlife Agenda Item D.2 Attachment 1 November 2017 Introduction
Evaporation Duct Height Climatology for Norwegian Waters Using Hindcast Data
 Evaporation Duct Height Climatology for Norwegian Waters Using Hindcast Data Petter Østenstad Norwegian Defence Research Establishment (FFI) Horten NORWAY Petter.Ostenstad@ffi.no Marthe Marie Meltzer Norwegian
REDWOOD VALLEY SUBAREA
 Independent Science Review Panel Conceptual Model of Watershed Hydrology, Surface Water and Groundwater Interactions and Stream Ecology for the Russian River Watershed Appendices A-1 APPENDIX A A-2 REDWOOD
Meteorology. Circle the letter that corresponds to the correct answer
 Chapter 3 Worksheet 1 Meteorology Name: Circle the letter that corresponds to the correct answer 1) If the maximum temperature for a particular day is 26 C and the minimum temperature is 14 C, the daily
ANALYSIS OF THE 2010 AMERICAN SHAD RADIO TELEMETRY ANIMATIONS RSP 3.5 CONOWINGO HYDROELECTRIC PROJECT FERC PROJECT NUMBER 405
 ANALYSIS OF THE 2010 AMERICAN SHAD RADIO TELEMETRY ANIMATIONS RSP 3.5 CONOWINGO HYDROELECTRIC PROJECT FERC PROJECT NUMBER 405 Prepared for: Prepared by: Normandeau Associates, Inc. Gomez and Sullivan Engineers,
CRISP: Capture-Recapture Interactive Simulation Package
 CRISP: Capture-Recapture Interactive Simulation Package George Volichenko Carnegie Mellon University Pittsburgh, PA gvoliche@andrew.cmu.edu December 17, 2012 Contents 1 Executive Summary 1 2 Introduction
Impacts of Changes in Extreme Weather and Climate on Wild Plants and Animals. Camille Parmesan Integrative Biology University of Texas at Austin
 Impacts of Changes in Extreme Weather and Climate on Wild Plants and Animals Camille Parmesan Integrative Biology University of Texas at Austin Species Level: Climate extremes determine species distributions
Changing Hydrology under a Changing Climate for a Coastal Plain Watershed
 Changing Hydrology under a Changing Climate for a Coastal Plain Watershed David Bosch USDA-ARS, Tifton, GA Jeff Arnold ARS Temple, TX and Peter Allen Baylor University, TX SEWRU Objectives 1. Project changes
Changing Planet: Changing Mosquito Genes
 Changing Planet: Changing Mosquito Genes Name Background As the climate changes around the globe, organisms will need to adapt in order to survive. But what does it mean to adapt? When you put on a sweater
A time discrete linear model of an age and time of residence structured population in a patchy environment
 Biological Modelling South African Journal of Science 104 May/June 2008 203 A time discrete linear model of an age and time of residence structured population in a patchy environment A. Moussaoui ab* P.Auger
Due: Monday November 26 th LAB 7: Rivers and Flood Frequency
 1 12.001 Due: Monday November 26 th LAB 7: Rivers and Flood Frequency Overview and Objectives This exercise will provide some hands-on experience with methods used for predicting flood frequency and magnitude.
Uncertainty analysis of heliostat alignment at the Sandia solar field
 Available online at www.sciencedirect.com Energy Procedia 00 (2013) 000 000 www.elsevier.com/locate/procedia SolarPACES 2013 Uncertainty analysis of heliostat alignment at the Sandia solar field Rachel
SHADOW STUDY REPORT REGARDING
 SHADOW STUDY REPORT REGARDING an APPLICATION TO REDEVELOP Three 6 Storey Condominiums Regional Road 25 (Ontario Street) and Britannia Road Milton, Ontario KNYMH FILE # 17030 Prepared by: Krista Lilley
Cormack-Jolly-Seber Models
 Cormack-Jolly-Seber Models Estimating Apparent Survival from Mark-Resight Data & Open-Population Models Ch. 17 of WNC, especially sections 17.1 & 17.2 For these models, animals are captured on k occasions
Survey of Invertebrate Species in Vernal Ponds at UNDERC. Joseph Lucero. 447 Knott Hall. University of Notre Dame
 Survey of Invertebrate Species in Vernal Ponds at UNDERC Joseph Lucero 447 Knott Hall University of Notre Dame Advisors: Dr. Ronald Hellenthal & Dr. Karen Francl 2004 Abstract Vernal ponds are an important
Severe Weather: Tornadoes and Hurricanes
 Severe Weather: Tornadoes and Hurricanes Tornadoes Grab Toto!! TORNADOES Are a low pressure storm that usually forms over land in an average year, 800 tornadoes are reported in the U.S. a tornado is defined
Ecological Archives E A2
 Ecological Archives E091-147-A2 Ilyas Siddique, Ima Célia Guimarães Vieira, Susanne Schmidt, David Lamb, Cláudio José Reis Carvalho, Ricardo de Oliveira Figueiredo, Simon Blomberg, Eric A. Davidson. Year.
Life-history diversity and ecology of O. mykiss in a coastal California watershed
 Life-history diversity and ecology of O. mykiss in a coastal California watershed Jeremy Monroe Thomas Williams, Dave Rundio, and Steve Lindley NOAA National Marine Fisheries Service, Southwest Fisheries
LONG-TERM CONTRASTED RESPONSES TO CLIMATE OF TWO ANTARCTIC SEABIRD SPECIES
 Ecology, 86(11), 2005, pp. 2889 2903 2005 by the Ecological Society of America LONG-TERM CONTRASTED RESPONSES TO CLIMATE OF TWO ANTARCTIC SEABIRD SPECIES STEPHANIE JENOUVRIER, 1 CHRISTOPHE BARBRAUD, AND
1.4j interpret simple shadow stick data to determine local noon and observer s longitude
 1.4j interpret simple shadow stick data to determine local noon and observer s longitude There are many opportunities for making observations of shadows cast with a vertical stick and the Sun. Observations
PRMS WHITE PAPER 2014 NORTH ATLANTIC HURRICANE SEASON OUTLOOK. June RMS Event Response
 PRMS WHITE PAPER 2014 NORTH ATLANTIC HURRICANE SEASON OUTLOOK June 2014 - RMS Event Response 2014 SEASON OUTLOOK The 2013 North Atlantic hurricane season saw the fewest hurricanes in the Atlantic Basin
University of California, Berkeley, Statistics 131A: Statistical Inference for the Social and Life Sciences. Michael Lugo, Spring 2012
 University of California, Berkeley, Statistics 3A: Statistical Inference for the Social and Life Sciences Michael Lugo, Spring 202 Solutions to Exam Friday, March 2, 202. [5: 2+2+] Consider the stemplot
Introduction to capture-markrecapture
 E-iNET Workshop, University of Kent, December 2014 Introduction to capture-markrecapture models Rachel McCrea Overview Introduction Lincoln-Petersen estimate Maximum-likelihood theory* Capture-mark-recapture
Larvae survive, grow, develop, disperse. Adult. Juvenile. Rocky Intertidal Ecology
 Rocky Intertidal Ecology Bipartite life cycle of benthic marine organisms with pelagic larvae review I. Population Structure (review) II. Settlement & Recruitment III. Zonation IV. Experiments that changed
A.P. Biology CH Population Ecology. Name
 1 A.P. Biology CH. 53 - Population Ecology Name How many ants (shown below - 6 ants / cm 2 ) would there be in an ant colony that is flat and one meter long on each side? Dispersion Patterns Matching A
Ohio Journal of Science (Ohio Academy of Science) Ohio Journal of Science: Volume 53, Issue 2 (March, 1953)
 Ohio Journal of Science: Volume 53, Issue 2 (March, 1953)") The Ohio State University Knowledge Bank kb.osu.edu Ohio Journal of Science (Ohio Academy of Science) Ohio Journal of Science: Volume 53, Issue 2 (March, 1953) 1953-03 Seasonal Variations in Relative Abundance
The Ohio State University Knowledge Bank kb.osu.edu Ohio Journal of Science (Ohio Academy of Science) Ohio Journal of Science: Volume 53, Issue 2 (March, 1953) 1953-03 Seasonal Variations in Relative Abundance
Climate Variability and El Niño
 Climate Variability and El Niño David F. Zierden Florida State Climatologist Center for Ocean Atmospheric Prediction Studies The Florida State University UF IFAS Extenstion IST January 17, 2017 The El
LONG-RANGE TRANSMISSION OF TREE POLLEN TO SHETLAND
 New PhytoL (1973) 72, 691-697. LONG-RANGE TRANSMISSION OF TREE POLLEN TO SHETLAN III. FREQUENCIES OVER THE PAST HUNRE YEARS BY J. B. TYLESLEY Lerwick Observatory, Shetland {Received 13 November 1972) SUMMARY
What causes the seasons? 2/11/09
 2/11/09 We can recognize solstices and equinoxes by Sun s path across sky: Summer solstice: Highest path, rise and set at most extreme north of due east. Winter solstice: Lowest path, rise and set at most
SUMMER PACKET FOR HONORS ALGEBRA ONE
 SUMMER PACKET FOR HONORS ALGEBRA ONE Multiple Choice Identify the letter of the choice that best completes the statement or answers the question. Write an algebraic expression for the phrase.. the sum
Worksheet: The Climate in Numbers and Graphs
 Worksheet: The Climate in Numbers and Graphs Purpose of this activity You will determine the climatic conditions of a city using a graphical tool called a climate chart. It represents the long-term climatic
= A. Example 2. Let U = {1, 2, 3, 4, 5, 6, 7, 8, 9, 10}, A = {4, 6, 7, 9, 10}, and B = {2, 6, 8, 9}. Draw the sets on a Venn diagram.
 MATH 109 Sets A mathematical set is a well-defined collection of objects A for which we can determine precisely whether or not any object belongs to A. Objects in a set are formally called elements of
FRESHWATER BIOLOGICAL ASSOCIATION TEESDALE UNIT - PROJECT 87. Department of the Environment, Natural Environment Research Council,
 FRESHWATER BIOLOGICAL ASSOCIATION TEESDALE UNIT - PROJECT 87 Report to: Department of the Environment, Natural Environment Research Council, Northumbrian Water Authority, Date: 12th September, 1984 Water
SOUTH COAST COASTAL RECREATION METHODS
 SOUTH COAST COASTAL RECREATION METHODS A customized, web-based survey instrument, which utilizes Point 97 s Viewpoint survey and mapping technology, was used to collect spatially explicit data on coastal
Studies on adaptation capacity of Carpathian ecosystems/landscape to climate change
 ` Studies on adaptation capacity of Carpathian ecosystems/landscape to climate change Science for the Carpathians CARPATHIAN CONVENTION COP5 Lillafüred, 10.10.2017-12.10.2017 Marcel Mîndrescu, Anita Bokwa
Spatial Effects on Current and Future Climate of Ipomopsis aggregata Populations in Colorado Patterns of Precipitation and Maximum Temperature
 A. Kenney GIS Project Spring 2010 Amanda Kenney GEO 386 Spring 2010 Spatial Effects on Current and Future Climate of Ipomopsis aggregata Populations in Colorado Patterns of Precipitation and Maximum Temperature
November 2018 Weather Summary West Central Research and Outreach Center Morris, MN
 November 2018 Weather Summary Lower than normal temperatures occurred for the second month. The mean temperature for November was 22.7 F, which is 7.2 F below the average of 29.9 F (1886-2017). This November
IUCN Red List Process. Cormack Gates Keith Aune
 IUCN Red List Process Cormack Gates Keith Aune The IUCN Red List Categories and Criteria have several specific aims to provide a system that can be applied consistently by different people; to improve
February 10, Mr. Jeff Smith, Chairman Imperial Valley Water Authority E County Road 1000 N Easton, IL Dear Chairman Smith:
 February 1, 1 Mr. Jeff Smith, Chairman Imperial Valley Water Authority 8 E County Road 1 N Easton, IL Dear Chairman Smith: The Illinois State Water Survey (ISWS), under contract to the Imperial Valley
Malawi. General Climate. UNDP Climate Change Country Profiles. C. McSweeney 1, M. New 1,2 and G. Lizcano 1
 UNDP Climate Change Country Profiles Malawi C. McSweeney 1, M. New 1,2 and G. Lizcano 1 1. School of Geography and Environment, University of Oxford. 2. Tyndall Centre for Climate Change Research http://country-profiles.geog.ox.ac.uk
Bipartite life cycle of benthic marine organisms with pelagic larvae. Larvae. survive, grow, develop, disperse. Pelagic Environment
 Bipartite life cycle of benthic marine organisms with pelagic larvae Larvae survive, grow, develop, disperse reproduce Pelagic Environment Benthic Environment settlement Adult Juvenile survive, grow, mature
EVALUATION OF ALGORITHM PERFORMANCE 2012/13 GAS YEAR SCALING FACTOR AND WEATHER CORRECTION FACTOR
 EVALUATION OF ALGORITHM PERFORMANCE /3 GAS YEAR SCALING FACTOR AND WEATHER CORRECTION FACTOR. Background The annual gas year algorithm performance evaluation normally considers three sources of information
Exam 2. Principles of Ecology. March 10, Name
 Exam 2. Principles of Ecology. March 10, 2008. Name N t = N o λ t N t = N o e rt N t+1 = N t + r o N t (1-N t /K) N t = K/(1 + [(K N o )/N o ] * e rt ) dn/dt = rn(1-n/k) N captured and marked initially
Illinois Drought Update, December 1, 2005 DROUGHT RESPONSE TASK FORCE Illinois State Water Survey, Department of Natural Resources
 Illinois Drought Update, December 1, 2005 DROUGHT RESPONSE TASK FORCE Illinois State Water Survey, Department of Natural Resources For more drought information please go to http://www.sws.uiuc.edu/. SUMMARY.
Determinants of individual growth
 Determinants of individual growth 2 populations with different body size = an environmental effect 2 pop. in the same environment 1 pop. in 2 environments Sorci, Clobert, Bélichon (1996) Journal of Animal
but 2012 was dry Most farmers pulled in a crop
 After a winter that wasn t, conditions late in the year pointed to a return to normal snow and cold conditions Most farmers pulled in a crop but 2012 was dry b y M i k e Wr o b l e w s k i, w e a t h e
New soil physical properties implemented in the Unified Model
 New soil physical properties implemented in the Unified Model Imtiaz Dharssi 1, Pier Luigi Vidale 3, Anne Verhoef 3, Bruce Macpherson 1, Clive Jones 1 and Martin Best 2 1 Met Office (Exeter, UK) 2 Met
Polar bears must swim further than before
 Polar bears in Baffin Bay are affected by climate changes (Article based on the summary of the report A reassessment of the polar bears in Baffin Bay and Kane Basin (2011-2014). Scientists have now proved
Two Concerns for Managers of Polar Bear Populations in the Near Future
 Two Concerns for Managers of Polar Bear Populations in the Near Future Presentation to the Polar Bear Range States Meeting 24-26 October, 2011 Ian Stirling, PhD, FRSC on behalf of the IUCN Polar Bear Specialist
The Global Scope of Climate. The Global Scope of Climate. Keys to Climate. Chapter 8
 The Global Scope of Climate Chapter 8 The Global Scope of Climate In its most general sense, climate is the average weather of a region, but except where conditions change very little during the course
Practice Seasons Moon Quiz
 1. Which diagram represents the tilt of Earth's axis relative to the Sun's rays on December 15? A) B) C) D) 2. The diagram below represents Earth in space on the first day of a season. 5. Base your answer
Ecology and evolution of clonal integration in heterogeneous environment
 Ecology and evolution of clonal integration in heterogeneous environment Ph.D. THESIS Ádám Kun Biology Ph.D. School of Loránd Eötvös University Ph.D. Program of Theoretical Biology and Ecology Dr. Beáta
Sediment Deposition LET THE RIVER RUN T E A C H E R. Activity Overview. Activity at a Glance. Time Required. Level of Complexity.
 Activity at a Glance Grade: 6 9 Subject: Science Category: Physical Science, Earth Science Topic: Deposition, River Systems Time Required Two 45-minute periods Level of Complexity Medium Materials* TI-73
Analysis of Historical Pattern of Rainfall in the Western Region of Bangladesh
 24 25 April 214, Asian University for Women, Bangladesh Analysis of Historical Pattern of Rainfall in the Western Region of Bangladesh Md. Tanvir Alam 1*, Tanni Sarker 2 1,2 Department of Civil Engineering,
Review of medium to long term coastal risks associated with British Energy sites: Climate Change Effects - Final Report
 Review of medium to long term coastal risks associated with British Energy sites: Climate Change Effects - Final Report Prepared for British Energy Generation Ltd Authors: Reviewed by: Authorised for issue
Use of Ocean Observations to Develop Forecasts in Support of Fisheries Management
 Use of Ocean Observations to Develop Forecasts in Support of Fisheries Management Phillip R. Mundy Alaska Fisheries Science Center Juneau, Alaska Danielle F. Evenson Alaska Department of Fish and Game
Thermal and ph tolerance of farmed, wild and first generation farmed-wild hybrid salmon (Salmo salar)
") Thermal and ph tolerance of farmed, wild and first generation farmed-wild hybrid salmon (Salmo salar) D. Hamoutene, L. Lush, I. Costa, K. Burt, J. Perez-Casanova, J. Caines Fisheries and Oceans Canada,
Thermal and ph tolerance of farmed, wild and first generation farmed-wild hybrid salmon (Salmo salar) D. Hamoutene, L. Lush, I. Costa, K. Burt, J. Perez-Casanova, J. Caines Fisheries and Oceans Canada,
Christopher ISU
 Christopher Anderson @ ISU Excessive spring rain will be more frequent (except this year). Will it be more manageable? Christopher J. Anderson, PhD 89th Annual Soil Management and Land Valuation Conference
CHAPTER. Linear patterns and relationships
 Linear patterns and relationships CHAPTER NCEA Level material included in this chapter is one section of Achievement Standard 902 (Mathematics and Statistics.) Investigate relationships between tables,
Rainwater Harvesting in Austin, TX Sarah Keithley University of Texas at Austin
 Rainwater Harvesting in Austin, TX Sarah Keithley University of Texas at Austin 1 Abstract Rainwater harvesting, the collection of rainwater from a roof catchment, is an alternative water resource and
Exxon Valdez Oil Spill Restoration Project Annual Report
 Exxon Valdez Oil Spill Restoration Project Annual Report Ecology and Demographics of Pacific Sand Lance, Ammodytes hexapterus Pallas, in Lower Cook Inlet, Alaska Restoration Project 99306 Final Report