Statistical Quality Control IE 3255 Spring 2005 Solution HomeWork #2
|
|
|
- Marjorie Shields
- 6 years ago
- Views:
Transcription
1 Statistical Quality Control IE 3255 Spring 25 Solution HomeWork #2. (a)stem-and-leaf, No of samples, N = 8 Leaf Unit =. Stem Leaf Frequency (5) (b) Frequency distribution of chemical yield class Yield Midpoint Frequency Cumulative Relative Cum. Rel. % Frequency Frequency Frequency 2. x < x < x < x < x < x < x < x < x < x < Total 8 8 Histogram of Batch Viscosity 25 2 Frequency 5 5 Viscosity
2 The shape of the histogram is not symmetric, and there appear to be one location of central tendency. The distribution does resemble normal probability distribution. (c)stem-and-leaf, No of samples, N = 8 Leaf Unit =. Stem Leaf Frequency (5) Median observation rank is (.5)(N) +.5 = (.5)(8) +.5 = 4.5 X.5 = ( )/2 = 4.9 Q observation rank is (.25)(N) +.5 = (.25)(8) +.5 = 2.5 Q = ( )/2 = 4.3 Q3 observation rank is (.75)(N) +.5 = (.75)(8) +.5 =.5 Q3 = ( )/2 = 5.55 (d) th percentile observation rank = (.)(N) +.5 = (.)(8) +.5 = 8.5 X. = ( )/2 = th percentile observation rank = (.9)(N) +.5 = (.9)(8) +.5 = 72.5 X.9 = (.4 +.)/2 =.25 (e) Box plot for the chemical process

3 2. Consider the viscosity data in Exercise. Construct a normal probability plot, a lognormal probability plot, and a Weibull probability plot for these data. Based on the plots, which distribution seems to be the best model for the viscosity data? 3
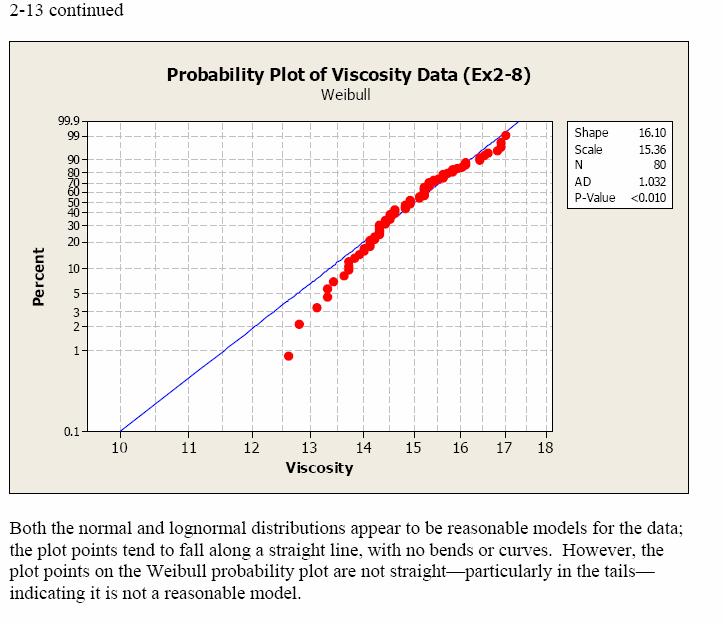
4 4
5 3. A mechatronic assembly is subjected to a final functional test. Suppose that defects occur at random in these assemblies, and that defects occur according to a Poisson distribution with parameter λ =.2. (a) What is the probability that an assembly will have exactly one defect? (b) What is the probability that an assembly will have one or more defects? (c) Suppose that you improve the process so that the occurrence rate of defects is cut in half to λ =.. What effect does this have on the probability that an assembly will have one or more defects? Solution This is a Poisson distribution with parameter λ =.2, x ~ POI(.2). (a).2 e (.2) Pr{ x = } = p() = =.9! (b).2 e (.2) Pr{ x } = Pr{ x = } = p() =! = =.98 (c) Poisson distribution with parameter λ =., x ~ POI(.).. e (.) Pr{ x } = Pr{ x = } = p() =! = -.99 =. Cutting the rate at which defects occur reduces the probability of one or more defects approximately half, from.98 to.. 5
6 4. A production process operates with 2% nonconforming output. Every hour a sample of 5 units of product is taken, and the number of nonconforming units counted. If one or more nonconforming units are found, the process is stopped and the quality control technician must search for the cause of nonconforming production. Evaluate the performance of this decision rule. Solution This is a binomial distribution with parameter p =.2 and n = 5. The process is stopped if x. 5 5 Pr{ x } = Pr{ x < } = Pr{ x = } = (.2) (.2) =.34 =.3 The decision rule means that 3.% of the samples will have one or more nonconforming units, and the process will be stopped to look for a cause. This is a somewhat difficult operating situation. It will cost the company a lot on down time.
7 5. An inspector is looking for nonconforming welds in the gasoline pipeline between Phoenix and Tucson. The probability that any particular weld will be defective is.. The inspector is determined to keep working until finding three defective welds. If the welds are located ft apart, what is the probability that the inspector will have to walk 5 ft? What is the probability that the inspector will have to walk more than 5 ft?. A population has a mean µ of 44.3 and a standard deviation σ of 2.. (a) Analyze the problem with a sketch of the normal curve. (b) What percentage of the measurements is larger than 4? (a) b. P{x > 4} = - P{x < 4} = - P{x < 4} = - P{z < } 2. = Φ(.895) =.793 =.2897 = 2.9% 7
8 7. An electronic component in an automobile has a useful life described by an exponential distribution with failure rate -5 /h. (a) What is the mean time to failure for this component? (b) What is the probability that this component would fail before its expected life. (c) If failure rate is -8 /h,compute the probability that the component would fail before its expected life. (d) Compare results from (b) and (c). Solution (a) This is exponential distribution with parameter λ = -5 Mean time failure rate = /λ = 5 =, hours (b) Probability that this component would fail before its expected life. / λ λt P x = λe dt = e =.32 λ (c) If failure rate, λ = -8, probability that this component would fail before its expected life becomes / λ λt P x = λe dt = e =.32 λ (d) Comparing b and c, one concludes that the probability that a value of an exponential random variable will be less than its mean is.322, regardless of the value of λ. 8
Chapter Learning Objectives. Probability Distributions and Probability Density Functions. Continuous Random Variables
 Chapter 4: Continuous Random Variables and Probability s 4-1 Continuous Random Variables 4-2 Probability s and Probability Density Functions 4-3 Cumulative Functions 4-4 Mean and Variance of a Continuous
(Ch 3.4.1, 3.4.2, 4.1, 4.2, 4.3)
") 3 Probability Distributions (Ch 3.4.1, 3.4.2, 4.1, 4.2, 4.3) Probability Distribution Functions Probability distribution function (pdf): Function for mapping random variables to real numbers. Discrete
3 Probability Distributions (Ch 3.4.1, 3.4.2, 4.1, 4.2, 4.3) Probability Distribution Functions Probability distribution function (pdf): Function for mapping random variables to real numbers. Discrete
System Simulation Part II: Mathematical and Statistical Models Chapter 5: Statistical Models
 System Simulation Part II: Mathematical and Statistical Models Chapter 5: Statistical Models Fatih Cavdur fatihcavdur@uludag.edu.tr March 20, 2012 Introduction Introduction The world of the model-builder
Engineering Risk Benefit Analysis
 Engineering Risk Benefit Analysis 1.155, 2.943, 3.577, 6.938, 10.816, 13.621, 16.862, 22.82, ESD.72, ESD.721 RPRA 3. Probability Distributions in RPRA George E. Apostolakis Massachusetts Institute of Technology
Probability Plots. Summary. Sample StatFolio: probplots.sgp
 STATGRAPHICS Rev. 9/6/3 Probability Plots Summary... Data Input... 2 Analysis Summary... 2 Analysis Options... 3 Uniform Plot... 3 Normal Plot... 4 Lognormal Plot... 4 Weibull Plot... Extreme Value Plot...
(Ch 3.4.1, 3.4.2, 4.1, 4.2, 4.3)
") 3 Probability Distributions (Ch 3.4.1, 3.4.2, 4.1, 4.2, 4.3) Probability Distribution Functions Probability distribution function (pdf): Function for mapping random variables to real numbers. Discrete
3 Probability Distributions (Ch 3.4.1, 3.4.2, 4.1, 4.2, 4.3) Probability Distribution Functions Probability distribution function (pdf): Function for mapping random variables to real numbers. Discrete
APPENDICES APPENDIX A. STATISTICAL TABLES AND CHARTS 651 APPENDIX B. BIBLIOGRAPHY 677 APPENDIX C. ANSWERS TO SELECTED EXERCISES 679
 APPENDICES APPENDIX A. STATISTICAL TABLES AND CHARTS 1 Table I Summary of Common Probability Distributions 2 Table II Cumulative Standard Normal Distribution Table III Percentage Points, 2 of the Chi-Squared
Closed book and notes. 60 minutes. Cover page and four pages of exam. No calculators.
 IE 230 Seat # Closed book and notes. 60 minutes. Cover page and four pages of exam. No calculators. Score Exam #3a, Spring 2002 Schmeiser Closed book and notes. 60 minutes. 1. True or false. (for each,
Fall 2014 October 1, 2014 MATH-333 (Common Exam. #1)
") Fall 2014 October 1, 2014 MATH-333 (Common Exam. #1) NJIT Q. # 1 #2 #3 #4 #5 Total 20 20 20 20 20 100 Name (PRINT) Section # Last First xxx Instructors: Egbert Ammicht, George Mytalas, Padma Natarajan,
Fall 2014 October 1, 2014 MATH-333 (Common Exam. #1) NJIT Q. # 1 #2 #3 #4 #5 Total 20 20 20 20 20 100 Name (PRINT) Section # Last First xxx Instructors: Egbert Ammicht, George Mytalas, Padma Natarajan,
SMAM Exam 1 Name
 SMAM 314-04 Exam 1 Name 1. A chemical reaction was run several times using a catalyst to control the yield of an undesireable side product. Results in units of percentage yield are given for 24 runs. 4.4
Probability Distribution
 Economic Risk and Decision Analysis for Oil and Gas Industry CE81.98 School of Engineering and Technology Asian Institute of Technology January Semester Presented by Dr. Thitisak Boonpramote Department
Recall Discrete Distribution. 5.2 Continuous Random Variable. A probability histogram. Density Function 3/27/2012
 3/7/ Recall Discrete Distribution 5. Continuous Random Variable For a discrete distribution, for eample Binomial distribution with n=5, and p=.4, the probabilit distribution is f().7776.59.3456.34.768.4.3
System Simulation Part II: Mathematical and Statistical Models Chapter 5: Statistical Models
 System Simulation Part II: Mathematical and Statistical Models Chapter 5: Statistical Models Fatih Cavdur fatihcavdur@uludag.edu.tr March 29, 2014 Introduction Introduction The world of the model-builder
) )
 )") Graded Homework Continued #4 Due 3/31 1. Daily sales records for a computer-manufacturing firm show that it will sell 0, 1 or mainframe computer systems manufactured at an eastern plant with probabilities
Graded Homework Continued #4 Due 3/31 1. Daily sales records for a computer-manufacturing firm show that it will sell 0, 1 or mainframe computer systems manufactured at an eastern plant with probabilities
STAT 509 Section 3.4: Continuous Distributions. Probability distributions are used a bit differently for continuous r.v. s than for discrete r.v. s.
 STAT 509 Section 3.4: Continuous Distributions Probability distributions are used a bit differently for continuous r.v. s than for discrete r.v. s. A continuous random variable is one for which the outcome
Basic Statistics Made Easy
 Basic Statistics Made Easy Victor R. Prybutok, Ph.D., CQE, CQA, CMQ/OE, PSTAT Regents Professor of Decision Sciences, UNT Dean and Vice Provost, Toulouse Graduate School, UNT 13 October 2017 Agenda Statistics
Basic Statistics. Resources. Statistical Tables Murdoch & Barnes. Scientific Calculator. Minitab 17.
 Basic Statistics Resources 1160 Statistical Tables Murdoch & Barnes Scientific Calculator Minitab 17 http://www.mathsisfun.com/data/ 1 Statistics 1161 The science of collection, analysis, interpretation
Special Discrete RV s. Then X = the number of successes is a binomial RV. X ~ Bin(n,p).
.") Sect 3.4: Binomial RV Special Discrete RV s 1. Assumptions and definition i. Experiment consists of n repeated trials ii. iii. iv. There are only two possible outcomes on each trial: success (S) or failure
Sect 3.4: Binomial RV Special Discrete RV s 1. Assumptions and definition i. Experiment consists of n repeated trials ii. iii. iv. There are only two possible outcomes on each trial: success (S) or failure
Probability Distributions for Continuous Variables. Probability Distributions for Continuous Variables
 Probability Distributions for Continuous Variables Probability Distributions for Continuous Variables Let X = lake depth at a randomly chosen point on lake surface If we draw the histogram so that the
Ching-Han Hsu, BMES, National Tsing Hua University c 2015 by Ching-Han Hsu, Ph.D., BMIR Lab. = a + b 2. b a. x a b a = 12
 Lecture 5 Continuous Random Variables BMIR Lecture Series in Probability and Statistics Ching-Han Hsu, BMES, National Tsing Hua University c 215 by Ching-Han Hsu, Ph.D., BMIR Lab 5.1 1 Uniform Distribution
Math 151. Rumbos Fall Solutions to Review Problems for Final Exam
 Math 5. Rumbos Fall 7 Solutions to Review Problems for Final Exam. Three cards are in a bag. One card is red on both sides. Another card is white on both sides. The third card is red on one side and white
Dr. Maddah ENMG 617 EM Statistics 10/15/12. Nonparametric Statistics (2) (Goodness of fit tests)
 (Goodness of fit tests)") Dr. Maddah ENMG 617 EM Statistics 10/15/12 Nonparametric Statistics (2) (Goodness of fit tests) Introduction Probability models used in decision making (Operations Research) and other fields require fitting
Dr. Maddah ENMG 617 EM Statistics 10/15/12 Nonparametric Statistics (2) (Goodness of fit tests) Introduction Probability models used in decision making (Operations Research) and other fields require fitting
Slides 8: Statistical Models in Simulation
 Slides 8: Statistical Models in Simulation Purpose and Overview The world the model-builder sees is probabilistic rather than deterministic: Some statistical model might well describe the variations. An
Math 151. Rumbos Fall Solutions to Review Problems for Final Exam
 Math 5. Rumbos Fall 23 Solutions to Review Problems for Final Exam. Three cards are in a bag. One card is red on both sides. Another card is white on both sides. The third card in red on one side and white
Solutions. Some of the problems that might be encountered in collecting data on check-in times are:
 Solutions Chapter 7 E7.1 Some of the problems that might be encountered in collecting data on check-in times are: Need to collect separate data for each airline (time and cost). Need to collect data for
Time-varying failure rate for system reliability analysis in large-scale railway risk assessment simulation
 Time-varying failure rate for system reliability analysis in large-scale railway risk assessment simulation H. Zhang, E. Cutright & T. Giras Center of Rail Safety-Critical Excellence, University of Virginia,
Continuous Random Variables. and Probability Distributions. Continuous Random Variables and Probability Distributions ( ) ( ) Chapter 4 4.
 ( ) Chapter 4 4.") UCLA STAT 11 A Applied Probability & Statistics for Engineers Instructor: Ivo Dinov, Asst. Prof. In Statistics and Neurology Teaching Assistant: Christopher Barr University of California, Los Angeles,
UCLA STAT 11 A Applied Probability & Statistics for Engineers Instructor: Ivo Dinov, Asst. Prof. In Statistics and Neurology Teaching Assistant: Christopher Barr University of California, Los Angeles,
Exercise Quality Management WS 2009/2010
 Exercise Quality Management WS 2009/2010 5 Quality management in field data evaluation Prof. Dr.-Ing. Robert Schmitt Quality management in field data evaluation L5 Seite 0 Content Weibull-analysis Median-Rank-technique
Objective Experiments Glossary of Statistical Terms
 Objective Experiments Glossary of Statistical Terms This glossary is intended to provide friendly definitions for terms used commonly in engineering and science. It is not intended to be absolutely precise.
HW7 Solutions. f(x) = 0 otherwise. 0 otherwise. The density function looks like this: = 20 if x [10, 90) if x [90, 100]
![HW7 Solutions. f(x) = 0 otherwise. 0 otherwise. The density function looks like this: = 20 if x [10, 90) if x [90, 100]](/thumbs/76/73074579.jpg "HW7 Solutions. f(x) = 0 otherwise. 0 otherwise. The density function looks like this: = 20 if x [10, 90) if x [90, 100]") HW7 Solutions. 5 pts.) James Bond James Bond, my favorite hero, has again jumped off a plane. The plane is traveling from from base A to base B, distance km apart. Now suppose the plane takes off from
HW7 Solutions. 5 pts.) James Bond James Bond, my favorite hero, has again jumped off a plane. The plane is traveling from from base A to base B, distance km apart. Now suppose the plane takes off from
Dover- Sherborn High School Mathematics Curriculum Probability and Statistics
 Mathematics Curriculum A. DESCRIPTION This is a full year courses designed to introduce students to the basic elements of statistics and probability. Emphasis is placed on understanding terminology and
EE/CpE 345. Modeling and Simulation. Fall Class 5 September 30, 2002
 EE/CpE 345 Modeling and Simulation Class 5 September 30, 2002 Statistical Models in Simulation Real World phenomena of interest Sample phenomena select distribution Probabilistic, not deterministic Model
An-Najah National University Faculty of Engineering Industrial Engineering Department. Course : Quantitative Methods (65211)
") An-Najah National University Faculty of Engineering Industrial Engineering Department Course : Quantitative Methods (65211) Instructor: Eng. Tamer Haddad 2 nd Semester 2009/2010 Chapter 3 Discrete Random
An-Najah National University Faculty of Engineering Industrial Engineering Department Course : Quantitative Methods (65211) Instructor: Eng. Tamer Haddad 2 nd Semester 2009/2010 Chapter 3 Discrete Random
REVIEW: Midterm Exam. Spring 2012
 REVIEW: Midterm Exam Spring 2012 Introduction Important Definitions: - Data - Statistics - A Population - A census - A sample Types of Data Parameter (Describing a characteristic of the Population) Statistic
Chapter 5. Statistical Models in Simulations 5.1. Prof. Dr. Mesut Güneş Ch. 5 Statistical Models in Simulations
 Chapter 5 Statistical Models in Simulations 5.1 Contents Basic Probability Theory Concepts Discrete Distributions Continuous Distributions Poisson Process Empirical Distributions Useful Statistical Models
Continuous Random Variables
 MATH 38 Continuous Random Variables Dr. Neal, WKU Throughout, let Ω be a sample space with a defined probability measure P. Definition. A continuous random variable is a real-valued function X defined
Introduction to Statistical Data Analysis Lecture 3: Probability Distributions
 Introduction to Statistical Data Analysis Lecture 3: Probability Distributions James V. Lambers Department of Mathematics The University of Southern Mississippi James V. Lambers Statistical Data Analysis
2. Prove that x must be always lie between the smallest and largest data values.
 Homework 11 12.5 1. A laterally insulated bar of length 10cm and constant cross-sectional area 1cm 2, of density 10.6gm/cm 3, thermal conductivity 1.04cal/(cm sec C), and specific heat 0.056 cal/(gm C)(this
A Probability Primer. A random walk down a probabilistic path leading to some stochastic thoughts on chance events and uncertain outcomes.
 A Probability Primer A random walk down a probabilistic path leading to some stochastic thoughts on chance events and uncertain outcomes. Are you holding all the cards?? Random Events A random event, E,
b. ( ) ( ) ( ) ( ) ( ) 5. Independence: Two events (A & B) are independent if one of the conditions listed below is satisfied; ( ) ( ) ( )
 ( ) ( ) ( ) ( ) 5. Independence: Two events (A & B) are independent if one of the conditions listed below is satisfied; ( ) ( ) ( )") 1. Set a. b. 2. Definitions a. Random Experiment: An experiment that can result in different outcomes, even though it is performed under the same conditions and in the same manner. b. Sample Space: This
1. Set a. b. 2. Definitions a. Random Experiment: An experiment that can result in different outcomes, even though it is performed under the same conditions and in the same manner. b. Sample Space: This
Continuous Random Variables. and Probability Distributions. Continuous Random Variables and Probability Distributions ( ) ( )
 ( )") UCLA STAT 35 Applied Computational and Interactive Probability Instructor: Ivo Dinov, Asst. Prof. In Statistics and Neurology Teaching Assistant: Chris Barr Continuous Random Variables and Probability
UCLA STAT 35 Applied Computational and Interactive Probability Instructor: Ivo Dinov, Asst. Prof. In Statistics and Neurology Teaching Assistant: Chris Barr Continuous Random Variables and Probability
Descriptive Statistics Example
 Descriptive tatistics Example A manufacturer is investigating the operating life of laptop computer batteries. The following data are available. Life (min.) Life (min.) Life (min.) Life (min.) 130 145
Chapter 3. Data Description
 Chapter 3. Data Description Graphical Methods Pie chart It is used to display the percentage of the total number of measurements falling into each of the categories of the variable by partition a circle.
STAT 200 Chapter 1 Looking at Data - Distributions
 STAT 200 Chapter 1 Looking at Data - Distributions What is Statistics? Statistics is a science that involves the design of studies, data collection, summarizing and analyzing the data, interpreting the
Continuous random variables
 Continuous random variables A continuous random variable X takes all values in an interval of numbers. The probability distribution of X is described by a density curve. The total area under a density
Known probability distributions
 Known probability distributions Engineers frequently wor with data that can be modeled as one of several nown probability distributions. Being able to model the data allows us to: model real systems design
21 ST CENTURY LEARNING CURRICULUM FRAMEWORK PERFORMANCE RUBRICS FOR MATHEMATICS PRE-CALCULUS
 21 ST CENTURY LEARNING CURRICULUM FRAMEWORK PERFORMANCE RUBRICS FOR MATHEMATICS PRE-CALCULUS Table of Contents Functions... 2 Polynomials and Rational Functions... 3 Exponential Functions... 4 Logarithmic
Statistics for Engineers Lecture 2 Discrete Distributions
 Statistics for Engineers Lecture 2 Discrete Distributions Chong Ma Department of Statistics University of South Carolina chongm@email.sc.edu January 18, 2017 Chong Ma (Statistics, USC) STAT 509 Spring
The exponential distribution and the Poisson process
 The exponential distribution and the Poisson process 1-1 Exponential Distribution: Basic Facts PDF f(t) = { λe λt, t 0 0, t < 0 CDF Pr{T t) = 0 t λe λu du = 1 e λt (t 0) Mean E[T] = 1 λ Variance Var[T]
Simulating events: the Poisson process
 Simulating events: te Poisson process p. 1/15 Simulating events: te Poisson process Micel Bierlaire micel.bierlaire@epfl.c Transport and Mobility Laboratory Simulating events: te Poisson process p. 2/15
BMIR Lecture Series on Probability and Statistics Fall, 2015 Uniform Distribution
 Lecture #5 BMIR Lecture Series on Probability and Statistics Fall, 2015 Department of Biomedical Engineering and Environmental Sciences National Tsing Hua University s 5.1 Definition ( ) A continuous random
Unit 4 Probability. Dr Mahmoud Alhussami
 Unit 4 Probability Dr Mahmoud Alhussami Probability Probability theory developed from the study of games of chance like dice and cards. A process like flipping a coin, rolling a die or drawing a card from
TABLE OF CONTENTS CHAPTER 1 COMBINATORIAL PROBABILITY 1
 TABLE OF CONTENTS CHAPTER 1 COMBINATORIAL PROBABILITY 1 1.1 The Probability Model...1 1.2 Finite Discrete Models with Equally Likely Outcomes...5 1.2.1 Tree Diagrams...6 1.2.2 The Multiplication Principle...8
Closed book and notes. 120 minutes. Cover page, five pages of exam. No calculators.
 IE 230 Seat # Closed book and notes. 120 minutes. Cover page, five pages of exam. No calculators. Score Final Exam, Spring 2005 (May 2) Schmeiser Closed book and notes. 120 minutes. Consider an experiment
ECE 510 Lecture 6 Confidence Limits. Scott Johnson Glenn Shirley
 ECE 510 Lecture 6 Confidence Limits Scott Johnson Glenn Shirley Concepts 28 Jan 2013 S.C.Johnson, C.G.Shirley 2 Statistical Inference Population True ( population ) value = parameter Sample Sample value
Estimation of reliability parameters from Experimental data (Parte 2) Prof. Enrico Zio
 Prof. Enrico Zio") Estimation of reliability parameters from Experimental data (Parte 2) This lecture Life test (t 1,t 2,...,t n ) Estimate θ of f T t θ For example: λ of f T (t)= λe - λt Classical approach (frequentist
Estimation of reliability parameters from Experimental data (Parte 2) This lecture Life test (t 1,t 2,...,t n ) Estimate θ of f T t θ For example: λ of f T (t)= λe - λt Classical approach (frequentist
S n = x + X 1 + X X n.
 0 Lecture 0 0. Gambler Ruin Problem Let X be a payoff if a coin toss game such that P(X = ) = P(X = ) = /2. Suppose you start with x dollars and play the game n times. Let X,X 2,...,X n be payoffs in each
Reliability and Quality Mathematics
 Reliability and Quality Mathematics. Introduction Since mathematics has played a pivotal role in the development of quality and reliability fields, it is essential to have a clear understanding of the
Plotting data is one method for selecting a probability distribution. The following
 Advanced Analytical Models: Over 800 Models and 300 Applications from the Basel II Accord to Wall Street and Beyond By Johnathan Mun Copyright 008 by Johnathan Mun APPENDIX C Understanding and Choosing
JUST THE MATHS UNIT NUMBER PROBABILITY 7 (The Poisson distribution) A.J.Hobson
 A.J.Hobson") JUST THE MATHS UNIT NUMBER 19.7 PROBABILITY 7 (The Poisson distribution) by A.J.Hobson 19.7.1 The theory 19.7.2 Exercises 19.7.3 Answers to exercises UNIT 19.7 - PROBABILITY 7 THE POISSON DISTRIBUTION
JUST THE MATHS UNIT NUMBER 19.7 PROBABILITY 7 (The Poisson distribution) by A.J.Hobson 19.7.1 The theory 19.7.2 Exercises 19.7.3 Answers to exercises UNIT 19.7 - PROBABILITY 7 THE POISSON DISTRIBUTION
CHAPTER 10 RELIABILITY
 CHAPTER 10 RELIABILITY Failure rates Reliability Constant failure rate and exponential distribution System Reliability Components in series Components in parallel Combination system 1 Failure Rate Curve
Describing distributions with numbers
 Describing distributions with numbers A large number or numerical methods are available for describing quantitative data sets. Most of these methods measure one of two data characteristics: The central
Describing distributions with numbers
 Describing distributions with numbers A large number or numerical methods are available for describing quantitative data sets. Most of these methods measure one of two data characteristics: The central
Stat 512 Homework key 2
 Stat 51 Homework key October 4, 015 REGULAR PROBLEMS 1 Suppose continuous random variable X belongs to the family of all distributions having a linear probability density function (pdf) over the interval
INFORMATION ABOUT SMAM
 INFORMATION ABOUT SMAM 351 Course Title: Probability and Statistics Textbook: PROBABILITY AND STATISTICS FOR ENGINEERING AND THE SCIENCES Sixth Edition by Jay L. Devore Duxbury Press Course Content: An
3 Continuous Random Variables
 Jinguo Lian Math437 Notes January 15, 016 3 Continuous Random Variables Remember that discrete random variables can take only a countable number of possible values. On the other hand, a continuous random
Statistical quality control (SQC)
") Statistical quality control (SQC) The application of statistical techniques to measure and evaluate the quality of a product, service, or process. Two basic categories: I. Statistical process control (SPC):
Statistical quality control (SQC) The application of statistical techniques to measure and evaluate the quality of a product, service, or process. Two basic categories: I. Statistical process control (SPC):
Computer Simulation of Repairable Processes
 SEMATECH 1996 Applied Reliability Tools Workshop (ARTWORK IX) Santa Fe Computer Simulation of Repairable Processes Dave Trindade, Ph.D. Senior AMD Fellow Applied Statistics Introduction Computer simulation!
Foundations of Probability and Statistics
 Foundations of Probability and Statistics William C. Rinaman Le Moyne College Syracuse, New York Saunders College Publishing Harcourt Brace College Publishers Fort Worth Philadelphia San Diego New York
Review for Exam #1. Chapter 1. The Nature of Data. Definitions. Population. Sample. Quantitative data. Qualitative (attribute) data
 data") Review for Exam #1 1 Chapter 1 Population the complete collection of elements (scores, people, measurements, etc.) to be studied Sample a subcollection of elements drawn from a population 11 The Nature
Review for Exam #1 1 Chapter 1 Population the complete collection of elements (scores, people, measurements, etc.) to be studied Sample a subcollection of elements drawn from a population 11 The Nature
1 Probability Distributions
 1 Probability Distributions A probability distribution describes how the values of a random variable are distributed. For example, the collection of all possible outcomes of a sequence of coin tossing
Lecture 10: The Normal Distribution. So far all the random variables have been discrete.
 Lecture 10: The Normal Distribution 1. Continuous Random Variables So far all the random variables have been discrete. We need a different type of model (called a probability density function) for continuous
Chapter 2. 1 From Equation 2.10: P(A 1 F) ˆ P(A 1)P(F A 1 ) S i P(F A i )P(A i ) The denominator is
 ˆ P(A 1)P(F A 1 ) S i P(F A i )P(A i ) The denominator is") Chapter 2 1 From Equation 2.10: P(A 1 F) ˆ P(A 1)P(F A 1 ) S i P(F A i )P(A i ) The denominator is 0:3 0:0001 0:01 0:005 0:001 0:002 0:0002 0:04 ˆ 0:00009 P(A 1 F) ˆ 0:0001 0:3 ˆ 0:133: 0:00009 Similarly
Chapter 2 1 From Equation 2.10: P(A 1 F) ˆ P(A 1)P(F A 1 ) S i P(F A i )P(A i ) The denominator is 0:3 0:0001 0:01 0:005 0:001 0:002 0:0002 0:04 ˆ 0:00009 P(A 1 F) ˆ 0:0001 0:3 ˆ 0:133: 0:00009 Similarly
Discrete Distributions
 Chapter 2 Discrete Distributions 2.1 Random Variables of the Discrete Type An outcome space S is difficult to study if the elements of S are not numbers. However, we can associate each element/outcome
Computer Science, Informatik 4 Communication and Distributed Systems. Simulation. Discrete-Event System Simulation. Dr.
 Simulation Discrete-Event System Simulation Chapter 4 Statistical Models in Simulation Purpose & Overview The world the model-builder sees is probabilistic rather than deterministic. Some statistical model
Continuous Distributions
 Chapter 3 Continuous Distributions 3.1 Continuous-Type Data In Chapter 2, we discuss random variables whose space S contains a countable number of outcomes (i.e. of discrete type). In Chapter 3, we study
Ø Set of mutually exclusive categories. Ø Classify or categorize subject. Ø No meaningful order to categorization.
 Statistical Tools in Evaluation HPS 41 Dr. Joe G. Schmalfeldt Types of Scores Continuous Scores scores with a potentially infinite number of values. Discrete Scores scores limited to a specific number
1.0 Continuous Distributions. 5.0 Shapes of Distributions. 6.0 The Normal Curve. 7.0 Discrete Distributions. 8.0 Tolerances. 11.
 Chapter 4 Statistics 45 CHAPTER 4 BASIC QUALITY CONCEPTS 1.0 Continuous Distributions.0 Measures of Central Tendency 3.0 Measures of Spread or Dispersion 4.0 Histograms and Frequency Distributions 5.0
CIVL 7012/8012. Continuous Distributions
 CIVL 7012/8012 Continuous Distributions Probability Density Function P(a X b) = b ò a f (x)dx Probability Density Function Definition: and, f (x) ³ 0 ò - f (x) =1 Cumulative Distribution Function F(x)
MATH : EXAM 2 INFO/LOGISTICS/ADVICE
 MATH 3342-004: EXAM 2 INFO/LOGISTICS/ADVICE INFO: WHEN: Friday (03/11) at 10:00am DURATION: 50 mins PROBLEM COUNT: Appropriate for a 50-min exam BONUS COUNT: At least one TOPICS CANDIDATE FOR THE EXAM:
CS 1538: Introduction to Simulation Homework 1
 CS 1538: Introduction to Simulation Homework 1 1. A fair six-sided die is rolled three times. Let X be a random variable that represents the number of unique outcomes in the three tosses. For example,
Continuous Probability Distributions. Uniform Distribution
 Continuous Probability Distributions Uniform Distribution Important Terms & Concepts Learned Probability Mass Function (PMF) Cumulative Distribution Function (CDF) Complementary Cumulative Distribution
Learning Objectives for Stat 225
 Learning Objectives for Stat 225 08/20/12 Introduction to Probability: Get some general ideas about probability, and learn how to use sample space to compute the probability of a specific event. Set Theory:
Chapter 5 Reliability of Systems
 Chapter 5 Reliability of Systems Hey! Can you tell us how to analyze complex systems? Serial Configuration Parallel Configuration Combined Series-Parallel C. Ebeling, Intro to Reliability & Maintainability
There are two basic kinds of random variables continuous and discrete.
 Summary of Lectures 5 and 6 Random Variables The random variable is usually represented by an upper case letter, say X. A measured value of the random variable is denoted by the corresponding lower case
Special distributions
 Special distributions August 22, 2017 STAT 101 Class 4 Slide 1 Outline of Topics 1 Motivation 2 Bernoulli and binomial 3 Poisson 4 Uniform 5 Exponential 6 Normal STAT 101 Class 4 Slide 2 What distributions
Common ontinuous random variables
 Common ontinuous random variables CE 311S Earlier, we saw a number of distribution families Binomial Negative binomial Hypergeometric Poisson These were useful because they represented common situations:
Chapter 8: Continuous Probability Distributions
 Chapter 8: Continuous Probability Distributions 8.1 Introduction This chapter continued our discussion of probability distributions. It began by describing continuous probability distributions in general,
Poisson Processes. Particles arriving over time at a particle detector. Several ways to describe most common model.
 Poisson Processes Particles arriving over time at a particle detector. Several ways to describe most common model. Approach 1: a) numbers of particles arriving in an interval has Poisson distribution,
Optimization and Simulation
 Optimization and Simulation Simulating events: the Michel Bierlaire Transport and Mobility Laboratory School of Architecture, Civil and Environmental Engineering Ecole Polytechnique Fédérale de Lausanne
Z score indicates how far a raw score deviates from the sample mean in SD units. score Mean % Lower Bound
 1 EDUR 8131 Chat 3 Notes 2 Normal Distribution and Standard Scores Questions Standard Scores: Z score Z = (X M) / SD Z = deviation score divided by standard deviation Z score indicates how far a raw score
3. Poisson Processes (12/09/12, see Adult and Baby Ross)
") 3. Poisson Processes (12/09/12, see Adult and Baby Ross) Exponential Distribution Poisson Processes Poisson and Exponential Relationship Generalizations 1 Exponential Distribution Definition: The continuous
3. Poisson Processes (12/09/12, see Adult and Baby Ross) Exponential Distribution Poisson Processes Poisson and Exponential Relationship Generalizations 1 Exponential Distribution Definition: The continuous
Quantitative Methods Chapter 0: Review of Basic Concepts 0.1 Business Applications (II) 0.2 Business Applications (III)
 0.2 Business Applications (III)") Quantitative Methods Chapter 0: Review of Basic Concepts 0.1 Business Applications (II) 0.1.1 Simple Interest 0.2 Business Applications (III) 0.2.1 Expenses Involved in Buying a Car 0.2.2 Expenses Involved
Quantitative Methods Chapter 0: Review of Basic Concepts 0.1 Business Applications (II) 0.1.1 Simple Interest 0.2 Business Applications (III) 0.2.1 Expenses Involved in Buying a Car 0.2.2 Expenses Involved
Introduction and Descriptive Statistics p. 1 Introduction to Statistics p. 3 Statistics, Science, and Observations p. 5 Populations and Samples p.
 Preface p. xi Introduction and Descriptive Statistics p. 1 Introduction to Statistics p. 3 Statistics, Science, and Observations p. 5 Populations and Samples p. 6 The Scientific Method and the Design of
CS 5014: Research Methods in Computer Science. Bernoulli Distribution. Binomial Distribution. Poisson Distribution. Clifford A. Shaffer.
 Department of Computer Science Virginia Tech Blacksburg, Virginia Copyright c 2015 by Clifford A. Shaffer Computer Science Title page Computer Science Clifford A. Shaffer Fall 2015 Clifford A. Shaffer
Math 1040 Sample Final Examination. Problem Points Score Total 200
 Name: Math 1040 Sample Final Examination Relax and good luck! Problem Points Score 1 25 2 25 3 25 4 25 5 25 6 25 7 25 8 25 Total 200 1. (25 points) The systolic blood pressures of 20 elderly patients in
Summarizing Measured Data
 Summarizing Measured Data 12-1 Overview Basic Probability and Statistics Concepts: CDF, PDF, PMF, Mean, Variance, CoV, Normal Distribution Summarizing Data by a Single Number: Mean, Median, and Mode, Arithmetic,
Probability and Probability Distributions. Dr. Mohammed Alahmed
 Probability and Probability Distributions 1 Probability and Probability Distributions Usually we want to do more with data than just describing them! We might want to test certain specific inferences about
Continuous case Discrete case General case. Hazard functions. Patrick Breheny. August 27. Patrick Breheny Survival Data Analysis (BIOS 7210) 1/21
 1/21") Hazard functions Patrick Breheny August 27 Patrick Breheny Survival Data Analysis (BIOS 7210) 1/21 Introduction Continuous case Let T be a nonnegative random variable representing the time to an event
Hazard functions Patrick Breheny August 27 Patrick Breheny Survival Data Analysis (BIOS 7210) 1/21 Introduction Continuous case Let T be a nonnegative random variable representing the time to an event
Probability Distributions Columns (a) through (d)
 through (d)") Discrete Probability Distributions Columns (a) through (d) Probability Mass Distribution Description Notes Notation or Density Function --------------------(PMF or PDF)-------------------- (a) (b) (c)
Discrete Probability Distributions Columns (a) through (d) Probability Mass Distribution Description Notes Notation or Density Function --------------------(PMF or PDF)-------------------- (a) (b) (c)