Chapter 6. Estimates and Sample Sizes
|
|
|
- Erick Garrett
- 6 years ago
- Views:
Transcription
1 Chapter 6 Estimates and Sample Sizes
2 Lesson 6-1/6-, Part 1 Estimating a Population Proportion
3 This chapter begins the beginning of inferential statistics. There are two major applications of inferential statistics involve the use of sample data to: 1. Estimate the value of a population parameter (proportions, means and variances).. Test some claim (or hypothesis) about a population.
4 Overview Introduce methods for estimating values of these important population parameters: proportions, means, and variances. Present methods for determining samples sizes necessary to estimate those parameters.
5 Assumptions Randomization condition Were the data sampled at random or generated from a properly randomization experiment? 10% Condition (N 10n) Samples are almost always drawn without replacement. If the sample exceeds 10% of the population, the probability of a success changes so much during the sampling that our Normal model may no longer be appropriate.
6 Assumptions Normal Approximation The model that we use for inference is based on the Central Limit Theorem. The sample must be large enough to make the sampling model for the sample proportions approximately Normal. npˆ 5 nqˆ 5 and.
7 Notations for Proportions p population proportion p x n sample proportion (p hat) of x successes in a sample size of n q 1 p sample proportion of failures in a sample of size n
8 Point Estimate A point estimate is a single value (or point) used to approximate a population parameter. ˆp The sample proportion is the best point estimate of the population proportion. p
9 Confidence Interval or Interval Estimate A confidence interval (or interval estimate) is a range (or an interval) of values used to estimate the true value of a population parameter. A confidence interval is sometimes abbreviated as CI.
10 Confidence Interval A confidence level is the probability 1 α (often expressed as the equivalent percentage value) that is the proportion of times that confidence interval actually does contain the population parameter, assuming that the estimate process is repeated a large number of times. This is usually 90% (α = 10%), 95% (α = 5%) or 99% (α = 1%) The confidence level is also called the degree of confidence, or the confidence coefficient.
11 Interpreting the Confidence Level The statement 95% confident means in repeated sampling, 95 percent of the intervals produced using this method will contain the proportion of adult Minnesotans who would respond no to the question photo cop legislation. If 1000 samples of size 89 were taken about 1000(0.95) = 950 of the intervals would contain the parameter p and about 50 would not.
12 What can we really say about p? 51 % of all Minnesotans are opposed to photo-cop legislations. It would be nice to be able to make absolute statements about population values with certainty, but we just don t have enough information do that. There s no way to be sure that the population proportion is the same as the sample proportion; in fact, it almost certainly isn t. Observations vary. Another sample would yield a different sample proportion.
13 What can we really say about p? It is probably true that 51 % of all Minnesotans are opposed to photo-cop legislations. No. In fact we can be pretty sure that whatever the true proportion is, it s not exactly 51%. So the statement is not true.
14 What can we really say about p? We don t know exactly what proportion of Minnesotans are opposed to photo-cop legislations but we know that it s between the interval from 48% and 54%. This it getting closer, but we still can t certain. We can t know for sure that the true proportion is in this range or any particular range.
15 What can we really say about p? We don t know exactly what proportion of Minnesotans are opposed to photo-cop legislations but interval from 48% and 54% probably contains the true value. We ve now fudge twice first by giving an interval and second by admitting that we only think the interval probably contains the true value. This statement is true.
16 What can we really say about p? The last statement may be true, but it s a bit wishy-washy. We can tighten it up bit quantifying what we meant by probably. We are 95% confident that between 48% and 54% of Minnesotans opposed photo-cop legislation.
17 Critical Value A critical value is the number on the borderline separating sample proportions that are likely to occur from those that are unlikely to occur. α Confidence Level α z 0 z α
18 Example Page 31, # Find the critical value that corresponds to the given confidence level of 90% % z z z invnorm(1 0.05,0,1) z
19 The most common critical values are: Confidence Level Critical Values, z α 90% % %
20 Margin of Error When data from a simple random sample are used to estimate a population proportion p, the margin of error, denoted by E, is the maximum likely (with probability 1 α) difference between the observed proportion ˆp and the true value of the population proportion p.
21 Margin of Error E z pq ˆˆ n
22 Page 31, #14 Assume that a sample is used to estimate the population proportion p. Find the margin of error E that corresponds to n = 100, x = % confidence z z0.01 z invnorm( ,0,1) = ˆ x p 0.33 n 100 E pq ˆˆ (0.33)(0.67) z n
23 Confidence Interval for the Population Proportion pˆ E p pˆ E pˆ E, pˆ E pˆ E
24 Find the Point Estimate and Margin of Error From a Confidence Interval Point Estimate: pˆ ( ) ( ) UCL LCL Margin of Error: E UCL LCL UCL Upper Confidence Limit LCL Lower Confidence Limit
25 Example Page 31, #6 Express the confidence interval < p <0.496 in the form pˆ E. UCL LCL pˆ E UCL LCL p
26 Example Page 31, #10 Interpreting Confidence Interval Limits: Use the given confidence interval limits to find the point estimate ˆp and the margin of error E p UCL LCL pˆ UCL LCL E 0.030
27 Example Page 31, #0 Use the sample data and confidence level to construct the confidence level estimate of the population proportion p. n = 001, x = 1776, 90% confidence Check assumptions. npˆ 5 nqˆ 5 x 1776 pˆ n 001
28 Example Page 31, # z CI 90% α pˆ n 001 z invnorm(1 0.05,0,1)
29 Example Page 31, #0 pˆ z α pq ˆˆ n (0.114) [0.876,0.899] CI 90% α pˆ n 001 z p 0.899

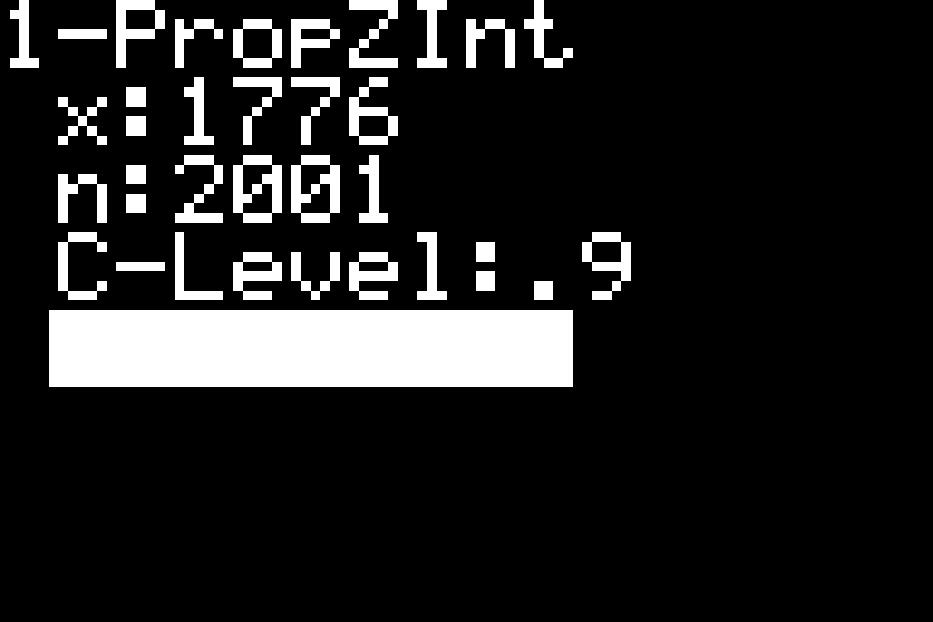
30 Example Page 31, #0 Using the TI Stat/Tests/A:1-PropZint
31 Example Page 31, # p pˆ
32 Lesson 6-1/6-, Part Estimating a Population Proportion
33 Sample Size for Estimating Proportion p ˆp is known: n z E pq ˆˆ ˆp is unknown: n z E 0.5
34 Example Page 31, # Use the given data to find the minimum sample size required to estimate a population proportion or percentage. Margin of error: 0.038; confidence level: 95%; unknown z z z (1 0.05,0,1) ˆp and ˆq n z 0.5 (1.96) E (0.038)
35 Example Page 313, #6 In 190 only 35% of U.S. Households had telephones, but that rate is now much higher. A recent survey of 476 randomly selected households showed that 4019 of them had telephones (based on the data from U.S. Census Bureau). Using those survey results and 99% confidence level, the TI-83 Plus calculator displays is as shown. A. Write a statement that interprets the confidence level. We are 99% certain that the interval from % to 94.96% contains the true percentage of U.S. households having telephones.
36 Example Page 313, #6 B. Based on the preceding results, should pollsters be concerned about results from surveys conducted by phone. Yes. Based on the results from part (a), about 5% to 7% of the population does not have telephone, so those people are missed.
37 Procedure for Constructing a Confidence Interval for p Identify the population of interest and the parameter you want to draw conclusions about. Choose the appropriate inference procedure. Verify the conditions for using the selected procedure. If the conditions are met, carry out the inference. Interpret your results in the context of the problem.
38 Example Page 313, #8 Death Penalty Survey: In a Gallup Poll, 491 randomly selected adults were asked whether they are in favor of the death penalty for a person convicted of murder, and 65% of them said that they were in favor. A. Find the point estimate of the percentage of adults who are in favor of this death penalty. 65% is the point estimate
39 Example Page 313, #8 B. Find a 95% confidence interval estimate of the percentage of adults who are in favor of this death penalty. Step 1 Identify the population of interest and parameter you want to draw conclusion about. p = proportion of adults who are in favor of the death penalty for a person convicted of murder
40 Example Page 313, #8 Step Choose the appropriate inference procedure. Verify conditions for using selected procedure. Use a one proportion z-interval Random sample stated in the question. Population is at least 10(491) = 4910 adults Sampling distribution is approximately normal npˆ (491)(0.65) 30 5 nqˆ (491)(0.35) 17 5
41 Example Page 313, #8 Step 3 Carry out the inference procedure z pˆ z α pq ˆˆ n (0.35) 491
42 Example Page 313, #8 Step 4 Interpret you results in the context of the problem. We 95% confident that the proportion of adults who are in favor of the death penalty for a person convicted of murder is between 61% and 69%.

43 Example Page 313, #8 Using the TI pˆ 0.65 x x n x p % p 69%
44 Example Page 313, #8 C. Can we safely conclude that the majority of adults are in favor of this death penalty? Explain Yes, since the interval in which we have 95% confidence is entirely above 50%
45 Example Page 314, #34 Sample size for Left-Handed Golfers. As a manufacturer of golf equipment, the Spalding Corporation wants to estimate the proportion of golfers who are left handed. (The company can use this information in planning for the number of right-handed and left-handed sets golf clubs to make.) How many golfers must be surveyed if we want 99% confidence that the sample proportion has a margin of error of ˆ p 0.50 A) Assume that there is no available information that could used as estimate of. ˆp n z 0.5 E ˆ q Z
46 Example Page 314, #34 B) Assume that we have an estimate of ˆp found from the previous study that suggests that 15% of golfers are left handed (based on a USA Today report). n z ˆˆ pq E.575 (0.15)(0.85) ˆ p 0.15 ˆ q Z
47 Example Page 314, #34 C) Assume that instead of using randomly selected golfers, the sample data are obtained by asking TV viewers of the golfing channel to call an 800 phone number to report whether they are left-handed or right-handed. How are the results affected? Self selected samples are not valid. It is not appropriate to assume that those who respond will be representative of the general population.
48 Lesson 6-3 Estimating a Population Mean: σ Known
49 Assumptions Sample is a simple random sample Values of the population standard deviation σ is known The population is normally distributed or n >30.
50 Example Page 37, #6 Verify the assumptions. Determine whether the given conditions justify using the margin of error when finding a confidence interval estimate of the population mean μ The sample size is n = 5 and σ not known. No, n is not greater than 30 and standard deviation is not known.
51 Example Page 37, #8 Verify the assumptions. Determine whether the given conditions justify using the margin of error when finding a confidence interval estimate of the population mean μ The sample size is n = 9, σ not known and the original population is normally distributed. No, because σ not known.
52 Definitions Estimator is a formula or process for using sample data to estimate a population parameter. Estimate is a specific value or range of values used to approximate a population parameter. Point Estimate is a single value (or point) used to approximate a population parameter. x The sample mean is the best point estimate of the population mean μ.
53 Confidence Interval As we saw in Section 6-, a confidence interval is a range (or an interval) of values used to estimate the true value of the population parameter. The confidence level gives us the success rate of the procedure used to construct the confidence interval.
54 Level of Confidence As describe in Section 6-, The confidence level is often expressed as the probability 1 α, where α is the complement of the confidence level. For a 0.95 (95%) confidence level, α = 0.05 For a 0.99 (99%) confidence level, α = 0.01
55 Margin of Error Margin of Error is the maximum likely difference observed between the sample mean x and population mean μ, and is denoted by E. E z n
56 Confidence Interval Estimate of the Population Mean μ x E x E x E, x E x E
57 Distribution of Sample Means with Known σ α E E α μ 0 z α
58 Example Page 38, #10 Use the given confidence level and sample data to find the margin of error and confidence interval for estimating the population mean μ. Ages of drivers occupying the passing lane while driving 5 mi/h with the left signal flashing: 99% confidence; n = 50, x 80.5 years, and σ is known to be 4.6 years n 50 x
59 Example Page 38, # n 50 x Z 0.01 Z invnorm(0.005,0,1).575 Find the margin of error E Z n years 50
60 Example Page 38, # n 50 x E Find the confidence interval x E x E yr 8.yr


61 Example Page 38, #10 Find the confidence interval using the TI STAT/TESTS/7:ZInterval n 50 x E 1.675
62 Sample Size for Estimating Mean μ n Z E When finding the sample size n, if the use of the formula does not result in a whole number, always increase the value of n to the next larger whole number.
63 Example Page 38, #16 Use the given margin of error, confidence level, and population standard deviation σ find the minimum sample size required to estimate an unknown population mean μ Margin of Error: $500, confidence level: 94%, σ = $ Z.06 Z invnorm(.03,0,1) n Z E
64 Procedure for Constructing a Confidence Interval for μ, when σ is known Identify the population of interest and the parameter you want to draw conclusion about. Choose the appropriate inference procedure. Verify the conditions for using the selected procedure. Carry out the inference. Interpret your results in the context of the problem.
65 Example Page 38, # The health of the bear population in Yellowstone National Park is monitored by periodic measurements taken from anesthetized bears. A sample of 54 bears has a mean weight of 18.9 lb. Assuming that σ is known to be 11.8 lb, find a 99% confidence interval estimate of the mean of the population of all such bear weights. What aspect of this problem is not realistic? It is unrealistic to know σ Step 1 Identify the population of interest and the parameter you want to draw conclusion about. µ = mean weight of bears in the Yellowstone National Park. n x CI.99
66 Example Page 38, # Step Choose the appropriate inference procedure. Verify conditions for using the selected procedure. We will use a one-sample z-interval We are assuming that the sample was random The standard deviation of the population is known σ = 11.8 Large sample n 30 the CLT tells us that the sampling distribution is approximately normal since n = 54
67 Example Page 38, # Step 3 Carry out the inference procedure x z α σ n n 54 x CI lbs < μ < 5.6 lbs z 0.575
68 Example Page 38, # Step 4 Interpret you results in the context problem. We are 99% confident that the mean weight of bears in Yellowstone National Park is between 140. lbs and 5.6 lbs.
69 Lesson 6-4, Part 1 Estimating a Population mean: σ Not Known
70 Assumptions Sample is a simple random sample Values of the population standard deviation σ is unknown The population is normally distributed or n > 30.
71 Student t Distribution If the distribution of a population is essentially normal, then the distribution of t x s μ n is essentially a student t distribution for all samples size n, and is used to find critical value values denoted by t α/
72 z Student t Distribution t-statistic is the same as the z-score Represents the number of standard errors x is from the population mean, μ. The shape of the t-distribution depends on the sample size, n x n Normally Distributed z x s n Not Normally Distributed t x s n Normally Distributed
73 Student t distribution for n = 3 and n = 1 t distribution is different for different samples sizes.
74 Important Properties of the Student t Distribution The Student t distribution has the same general symmetric bell shape as the normal distribution, but it reflects the greater variability (with wider distributions) that is expected with small samples. The Student t distribution has a mean of t = 0 (just as the standard normal distribution has a mean of z = 0). The standard deviation of the Student t distribution varies with the sample size and is greater than 1 (unlike the standard normal distribution, which has a σ = 1). As the sample size n gets larger, the Student t distribution gets closer to the normal distribution.
75 Degree of Freedom (df) Degrees of Freedom (df) corresponds to the number of samples values that can vary after certain restrictions have been imposed on all data values. df n 1
76 Margin of Error E for Estimate of μ Based on an unknown σ and a small simple random sample from a normally distributed population. s E t n where t α/ has n 1 degrees of freedom.
77 Confidence Interval Estimate of the Population Mean μ withσ unknown x E x E x E, x E x E
78 Example Page 343, # A) Find the critical value z. (B) Find the critical value t (C) State the neither the normal nor the t-distribution applies. 95%; n = 10; σ is unknown; population appears to be normally distributed df n t t t , Use table A

79 Example Page 343, # Using TI nd Vars

80 Example Page 343, #8 A) Find the critical value z. (B) Find the critical value t (C) State the neither the normal nor the t-distribution applies. 98%; n = 37; σ is unknown; population appears to be normally distributed df n t t t , Use table A
81 Example Page 343, #10 Use the given confidence level and sample data to find a) the margin of error and b) the confidence interval for the population mean μ. Assume that the population has a normal distribution. Elbow to fingertip length of mean: 99% confidence level, n 3, x 14.50, s t.01 31,0.005 E t t s n x E x E


82 Example Page 343, #10 Find the confidence interval using the TI STAT/TESTS/8:TInterval CL.99 n 3 x s 0.70
83 Lesson 6-4, Part Estimating a Population mean: σ Not Known
84 Procedure for Constructing a Confidence Interval for μ, when σ is Unknown Identify the population of interest and the parameter you want to draw conclusion about. Choose the appropriate inference procedure. Verify the conditions for using the selected procedure. Carry out the inference. Interpret your results in the context of the problem.
85 Example Page 344, #14 A study was conducted to estimate hospital costs for accident victims who wore seats belts. Twenty randomly selected cases have a distribution that appears to be bell-shape with a mean of $9004 and a standard deviation of $569. A) Construction the 99% confidence interval for the mean of all such costs. Step 1 Identify the population of interest and the parameter you want to draw conclusion about. µ = mean costs of accident victims who wore seat belts.
86 Example Page 344, #14 Step Choose the appropriate inference procedure. Verify conditions for using the selected procedure. We will use a one-sample t-interval for the mean Random Sample Stated in the question Value of σ is unknown Question stated that the distribution appears to be approximately normal
87 Example Page 344, #14 Step 3 Carry out the inference procedure n 0, df 19, x 9004, s 569, t α.861 x t α s n $5403, $1,
88 Example Page 344, #14 Step 4 Interpret your results in the context of the problem. We are 99% confident that the mean costs of all accidents victims who wear seat belts is between $5403 and $1605
89 Example Page 344, #14 B). If you are a manager for an insurance company that provides lower rates for drivers who wear seat belts, and you want a conservative estimate for a worst scenario, what amount should you use as the possible hospital cost for an accident victim who wears seat belts? $1,605 is the high end estimate for the long-run average hospital cost of such accident victims.
90 Example Page 344, #18 Listed below are measured amounts of lead (in micrograms per cubic meter) in the air. The Environmental Protection Agency has established an air quality standard for lead: 1.5 μg/m³. The measurements shown below were recorded at Building 5 of the World Trade Center site on different days immediately following the destruction caused by the terrorist attacks of September 11, 001. After the collapse of the two World Trade Center Buildings, there was considerable concern about the quality of the air. Use the given values to construct a 95% confidence interval estimate of the mean amount of lead in the air. Is there anything about this data set suggesting that the confidence interval might not be very good? Explain
91 Example Page 344, #18 Step 1 Identify the population of interest and the parameter you want to draw conclusions about. µ = mean amount of lead in the air at the world Trade Center
92 Example Page 344, #18 Choose the appropriate inference procedure. Verify conditions for using the selected procedure. Use a one sample t-interval Measurements were not randomly selected, but its representative sample. The value of σ is unknown The sampling distribution does not appear to be approximately normal since the box plot is skewed right with an outlier (see graph).
93 Example Page 344, #18 Collection 1 Box Plot Mean_Amt_of_Lead_at_the_World_Trade_Center
94 Example Page 344, #18 Carry out the inference procedure. n 6, df 5, x 1.538, s 1.914, t α.571 x s t α n < µ < (micrograms/cubic meter)
95 Example Page 344, #18 Step 4 Interpret your results in the context of the problem. We are 95% confident that the mean lead amount of all air at the World Trade Center is between and (micrograms/cubic meter). Yes, 4 of the 5 samples are below x raises a question about whether the data meets the requirements that underlying population distribution is normal.
96 Lesson 6-5 Estimating the Population Variance σ²
97 What is variance? Is the difference between each observation and the mean. Since the mean represents the center of gravity, the sum of all deviation about the mean must equal zero.
98 Population Variance Population variance (σ²) of a variable is the sum of the squared deviations about the population mean divided by the number of observation in the population (N) i x N Population Standard Deviation
99 Assumptions The sample is simple random sample The population must have normally distributed values (even if the sample is large).
100 Chi-Square Distribution χ ( n1) s σ n = sample size s = sample variance σ = population variance

101 Properties of the Distribution of the Chi-Square Statistics The chi-square distribution is not symmetric, unlike the normal and Student t distribution. As the number of degrees of freedom increases, the distribution becomes more symmetric.
102 Properties of the Distribution of the Chi-Square Statistics The values of chi-square can be zero or positive, but they cannot be negative. The chi-square distribution is different for each number of degrees of freedom, which is df = n 1 in this section. As the number increases, the chi-square distribution approaches a normal distribution. In table A-4, each critical value of χ corresponds to an area given in the top row of the table, and that area represents the total region located to the right of the critical value.
103 Chi-Square Distribution with Critical values Use Table A-4 Left 1 Right
104 0.05 Example Page 355, # Find the critical values that correspond to the given confidence level and sample size %; n The Area to the Right The Area to the Left Area
105 Estimators of σ The sample variance s² is the best point estimate of the population variance σ²
106 Confidence Interval for the Population Variance σ² n s n s 1 1 n s n s 1
107 Example Page 355, #6 Find the confidence interval. Use the given confidence level and sample data to find a confidence interval for the population standard deviation. In each case assume that a simple random sample has been selected from population that has a normal distribution. Ages of drivers occupying the passing lane while driving 5 mi/h with the left signal flashing: 99% confidence; n = 7, x = 80.5 years, s = 4.6 years n s n s 1
108 Example Page 355, # n s n s years 7.0years
109 Procedure for Constructing a Confidence Interval for σ Identify the population of interest and the parameter you want to draw conclusion about. Choose the appropriate inference procedure. Verify the conditions for using the selected procedure. Carry out the inference. Interpret your results in the context of the problem.
110 Example Page 356, #14 A container of car antifreeze is supposed to hold 3785 ml of the liquid. Realizing that fluctuations are inevitable, the quality-control manager wants to be quite sure that the standard deviation is less than 30 ml. Otherwise, some containers would overflow while others would not have enough of the coolant. She selects a simple random sample, with the results given here. Use these sample results to construct the 99% confidence interval for the true value of σ. Does this confidence interval suggest that the fluctuations are at an acceptable level? n 18 x s 55.4
111 Example Page 356, #14 Step 1 Identify the population of interest and the parameter you want to draw conclusions about. σ = standard deviation of car antifreeze. Step Choose the appropriate inference procedure. Verify conditions for using selected procedure. Use a chi-square interval Conditions Question stated SRS Since the histogram is approximately normal.
112 Example Page 356, #14
113 Example Page 356, #14 Step 3 Carry out the inference procedure n 18 x s CL % n s n s mL 95.7mL
114 Example Page 356, #14 Step 4 Interpret your results in the context of the problem. We are 99% confident that the standard deviation of car antifreeze is between 38. ml and 95.7 ml. No, the interval indicates 99% confidence that σ > 30 ml (the fluctuations appears to be too high).
Lecture Slides. Elementary Statistics Tenth Edition. by Mario F. Triola. and the Triola Statistics Series
 Lecture Slides Elementary Statistics Tenth Edition and the Triola Statistics Series by Mario F. Triola Slide 1 Chapter 7 Estimates and Sample Sizes 7-1 Overview 7-2 Estimating a Population Proportion 7-3
Sections 7.1 and 7.2. This chapter presents the beginning of inferential statistics. The two major applications of inferential statistics
 Sections 7.1 and 7.2 This chapter presents the beginning of inferential statistics. The two major applications of inferential statistics Estimate the value of a population parameter Test some claim (or
Chapter 6 Estimation and Sample Sizes
 Chapter 6 Estimation and Sample Sizes This chapter presents the beginning of inferential statistics.! The two major applications of inferential statistics! Estimate the value of a population parameter!
p = q ˆ = 1 -ˆp = sample proportion of failures in a sample size of n x n Chapter 7 Estimates and Sample Sizes
 Chapter 7 Estimates and Sample Sizes 7-1 Overview 7-2 Estimating a Population Proportion 7-3 Estimating a Population Mean: σ Known 7-4 Estimating a Population Mean: σ Not Known 7-5 Estimating a Population
Lecture Slides. Elementary Statistics. Tenth Edition. by Mario F. Triola. and the Triola Statistics Series
 Lecture Slides Elementary Statistics Tenth Edition and the Triola Statistics Series by Mario F. Triola Slide 1 Chapter 7 Estimates and Sample Sizes 7-1 Overview 7-2 Estimating a Population Proportion 7-3
Sampling Distribution Models. Chapter 17
 Sampling Distribution Models Chapter 17 Objectives: 1. Sampling Distribution Model 2. Sampling Variability (sampling error) 3. Sampling Distribution Model for a Proportion 4. Central Limit Theorem 5. Sampling
Chapter 9 Inferences from Two Samples
 Chapter 9 Inferences from Two Samples 9-1 Review and Preview 9-2 Two Proportions 9-3 Two Means: Independent Samples 9-4 Two Dependent Samples (Matched Pairs) 9-5 Two Variances or Standard Deviations Review
Lecture Slides. Elementary Statistics Eleventh Edition. by Mario F. Triola. and the Triola Statistics Series 9.1-1
 Lecture Slides Elementary Statistics Eleventh Edition and the Triola Statistics Series by Mario F. Triola Copyright 2010, 2007, 2004 Pearson Education, Inc. All Rights Reserved. 9.1-1 Chapter 9 Inferences
Chapter 12: Inference about One Population
 Chapter 1: Inference about One Population 1.1 Introduction In this chapter, we presented the statistical inference methods used when the problem objective is to describe a single population. Sections 1.
Chapter 15 Sampling Distribution Models
 Chapter 15 Sampling Distribution Models 1 15.1 Sampling Distribution of a Proportion 2 Sampling About Evolution According to a Gallup poll, 43% believe in evolution. Assume this is true of all Americans.
Topic 6 - Confidence intervals based on a single sample
 Topic 6 - Confidence intervals based on a single sample Sampling distribution of the sample mean Sampling distribution of the sample variance Confidence interval for a population mean Confidence interval
Chapter 18. Sampling Distribution Models /51
 Chapter 18 Sampling Distribution Models 1 /51 Homework p432 2, 4, 6, 8, 10, 16, 17, 20, 30, 36, 41 2 /51 3 /51 Objective Students calculate values of central 4 /51 The Central Limit Theorem for Sample
1 MA421 Introduction. Ashis Gangopadhyay. Department of Mathematics and Statistics. Boston University. c Ashis Gangopadhyay
 1 MA421 Introduction Ashis Gangopadhyay Department of Mathematics and Statistics Boston University c Ashis Gangopadhyay 1.1 Introduction 1.1.1 Some key statistical concepts 1. Statistics: Art of data analysis,
7.1: What is a Sampling Distribution?!?!
 7.1: What is a Sampling Distribution?!?! Section 7.1 What Is a Sampling Distribution? After this section, you should be able to DISTINGUISH between a parameter and a statistic DEFINE sampling distribution
Unit 22: Sampling Distributions
 Unit 22: Sampling Distributions Summary of Video If we know an entire population, then we can compute population parameters such as the population mean or standard deviation. However, we generally don
i=1 X i/n i=1 (X i X) 2 /(n 1). Find the constant c so that the statistic c(x X n+1 )/S has a t-distribution. If n = 8, determine k such that
 2 /(n 1). Find the constant c so that the statistic c(x X n+1 )/S has a t-distribution. If n = 8, determine k such that") Math 47 Homework Assignment 4 Problem 411 Let X 1, X,, X n, X n+1 be a random sample of size n + 1, n > 1, from a distribution that is N(µ, σ ) Let X = n i=1 X i/n and S = n i=1 (X i X) /(n 1) Find the
Math 47 Homework Assignment 4 Problem 411 Let X 1, X,, X n, X n+1 be a random sample of size n + 1, n > 1, from a distribution that is N(µ, σ ) Let X = n i=1 X i/n and S = n i=1 (X i X) /(n 1) Find the
Ch. 7: Estimates and Sample Sizes
 Ch. 7: Estimates and Sample Sizes Section Title Notes Pages Introduction to the Chapter 2 2 Estimating p in the Binomial Distribution 2 5 3 Estimating a Population Mean: Sigma Known 6 9 4 Estimating a
Chapter 8: Confidence Intervals
 Chapter 8: Confidence Intervals Introduction Suppose you are trying to determine the mean rent of a two-bedroom apartment in your town. You might look in the classified section of the newspaper, write
Chapter 9. Correlation and Regression
 Chapter 9 Correlation and Regression Lesson 9-1/9-2, Part 1 Correlation Registered Florida Pleasure Crafts and Watercraft Related Manatee Deaths 100 80 60 40 20 0 1991 1993 1995 1997 1999 Year Boats in
Introduction to Survey Analysis!
 Introduction to Survey Analysis! Professor Ron Fricker! Naval Postgraduate School! Monterey, California! Reading Assignment:! 2/22/13 None! 1 Goals for this Lecture! Introduction to analysis for surveys!
Section 7.1 How Likely are the Possible Values of a Statistic? The Sampling Distribution of the Proportion
 Section 7.1 How Likely are the Possible Values of a Statistic? The Sampling Distribution of the Proportion CNN / USA Today / Gallup Poll September 22-24, 2008 www.poll.gallup.com 12% of Americans describe
EXAM 3 Math 1342 Elementary Statistics 6-7
 EXAM 3 Math 1342 Elementary Statistics 6-7 Name Date ********************************************************************************************************************************************** MULTIPLE
Introduction to Estimation. Martina Litschmannová K210
 Introduction to Estimation Martina Litschmannová martina.litschmannova@vsb.cz K210 Populations vs. Sample A population includes each element from the set of observations that can be made. A sample consists
Chapter 8: Sampling Distributions. A survey conducted by the U.S. Census Bureau on a continual basis. Sample
 Chapter 8: Sampling Distributions Section 8.1 Distribution of the Sample Mean Frequently, samples are taken from a large population. Example: American Community Survey (ACS) A survey conducted by the U.S.
QUIZ 4 (CHAPTER 7) - SOLUTIONS MATH 119 SPRING 2013 KUNIYUKI 105 POINTS TOTAL, BUT 100 POINTS = 100%
 - SOLUTIONS MATH 119 SPRING 2013 KUNIYUKI 105 POINTS TOTAL, BUT 100 POINTS = 100%") QUIZ 4 (CHAPTER 7) - SOLUTIONS MATH 119 SPRING 013 KUNIYUKI 105 POINTS TOTAL, BUT 100 POINTS = 100% 1) We want to conduct a study to estimate the mean I.Q. of a pop singer s fans. We want to have 96% confidence
QUIZ 4 (CHAPTER 7) - SOLUTIONS MATH 119 SPRING 013 KUNIYUKI 105 POINTS TOTAL, BUT 100 POINTS = 100% 1) We want to conduct a study to estimate the mean I.Q. of a pop singer s fans. We want to have 96% confidence
What Is a Sampling Distribution? DISTINGUISH between a parameter and a statistic
 Section 8.1A What Is a Sampling Distribution? Learning Objectives After this section, you should be able to DISTINGUISH between a parameter and a statistic DEFINE sampling distribution DISTINGUISH between
Last few slides from last time
 Last few slides from last time Example 3: What is the probability that p will fall in a certain range, given p? Flip a coin 50 times. If the coin is fair (p=0.5), what is the probability of getting an
Statistics for Business and Economics
 Statistics for Business and Economics Chapter 6 Sampling and Sampling Distributions Ch. 6-1 6.1 Tools of Business Statistics n Descriptive statistics n Collecting, presenting, and describing data n Inferential
hypotheses. P-value Test for a 2 Sample z-test (Large Independent Samples) n > 30 P-value Test for a 2 Sample t-test (Small Samples) n < 30 Identify α
 n > 30 P-value Test for a 2 Sample t-test (Small Samples) n < 30 Identify α") Chapter 8 Notes Section 8-1 Independent and Dependent Samples Independent samples have no relation to each other. An example would be comparing the costs of vacationing in Florida to the cost of vacationing
Chapter 8 Notes Section 8-1 Independent and Dependent Samples Independent samples have no relation to each other. An example would be comparing the costs of vacationing in Florida to the cost of vacationing
Chapter 23. Inferences About Means. Monday, May 6, 13. Copyright 2009 Pearson Education, Inc.
 Chapter 23 Inferences About Means Sampling Distributions of Means Now that we know how to create confidence intervals and test hypotheses about proportions, we do the same for means. Just as we did before,
Chapter. Hypothesis Testing with Two Samples. Copyright 2015, 2012, and 2009 Pearson Education, Inc. 1
 Chapter 8 Hypothesis Testing with Two Samples Copyright 2015, 2012, and 2009 Pearson Education, Inc 1 Two Sample Hypothesis Test Compares two parameters from two populations Sampling methods: Independent
Business Statistics: Lecture 8: Introduction to Estimation & Hypothesis Testing
 Business Statistics: Lecture 8: Introduction to Estimation & Hypothesis Testing Agenda Introduction to Estimation Point estimation Interval estimation Introduction to Hypothesis Testing Concepts en terminology
Chapter 23. Inference About Means
 Chapter 23 Inference About Means 1 /57 Homework p554 2, 4, 9, 10, 13, 15, 17, 33, 34 2 /57 Objective Students test null and alternate hypotheses about a population mean. 3 /57 Here We Go Again Now that
Harvard University. Rigorous Research in Engineering Education
 Statistical Inference Kari Lock Harvard University Department of Statistics Rigorous Research in Engineering Education 12/3/09 Statistical Inference You have a sample and want to use the data collected
Statistics for Business and Economics: Confidence Intervals for Proportions
 Statistics for Business and Economics: Confidence Intervals for Proportions STT 315: Section 107 Acknowledgement: I d like to thank Dr. Ashoke Sinha for allowing me to use and edit the slides. Statistical
Practice Questions: Statistics W1111, Fall Solutions
 Practice Questions: Statistics W, Fall 9 Solutions Question.. The standard deviation of Z is 89... P(=6) =..3. is definitely inside of a 95% confidence interval for..4. (a) YES (b) YES (c) NO (d) NO Questions
Chapter 7 Sampling Distributions
 Statistical inference looks at how often would this method give a correct answer if it was used many many times. Statistical inference works best when we produce data by random sampling or randomized comparative
10.4 Hypothesis Testing: Two Independent Samples Proportion
 10.4 Hypothesis Testing: Two Independent Samples Proportion Example 3: Smoking cigarettes has been known to cause cancer and other ailments. One politician believes that a higher tax should be imposed
LECTURE 12 CONFIDENCE INTERVAL AND HYPOTHESIS TESTING
 LECTURE 1 CONFIDENCE INTERVAL AND HYPOTHESIS TESTING INTERVAL ESTIMATION Point estimation of : The inference is a guess of a single value as the value of. No accuracy associated with it. Interval estimation
Single Sample Means. SOCY601 Alan Neustadtl
 Single Sample Means SOCY601 Alan Neustadtl The Central Limit Theorem If we have a population measured by a variable with a mean µ and a standard deviation σ, and if all possible random samples of size
Statistical Inference for Means
 Statistical Inference for Means Jamie Monogan University of Georgia February 18, 2011 Jamie Monogan (UGA) Statistical Inference for Means February 18, 2011 1 / 19 Objectives By the end of this meeting,
Ch. 7 Statistical Intervals Based on a Single Sample
 Ch. 7 Statistical Intervals Based on a Single Sample Before discussing the topics in Ch. 7, we need to cover one important concept from Ch. 6. Standard error The standard error is the standard deviation
Chapter 18. Sampling Distribution Models. Copyright 2010, 2007, 2004 Pearson Education, Inc.
 Chapter 18 Sampling Distribution Models Copyright 2010, 2007, 2004 Pearson Education, Inc. Normal Model When we talk about one data value and the Normal model we used the notation: N(μ, σ) Copyright 2010,
Lecture 11 - Tests of Proportions
 Lecture 11 - Tests of Proportions Statistics 102 Colin Rundel February 27, 2013 Research Project Research Project Proposal - Due Friday March 29th at 5 pm Introduction, Data Plan Data Project - Due Friday,
Business Statistics. Lecture 5: Confidence Intervals
 Business Statistics Lecture 5: Confidence Intervals Goals for this Lecture Confidence intervals The t distribution 2 Welcome to Interval Estimation! Moments Mean 815.0340 Std Dev 0.8923 Std Error Mean
AP Statistics Cumulative AP Exam Study Guide
 AP Statistics Cumulative AP Eam Study Guide Chapters & 3 - Graphs Statistics the science of collecting, analyzing, and drawing conclusions from data. Descriptive methods of organizing and summarizing statistics
AP Statistics Ch 12 Inference for Proportions
 Ch 12.1 Inference for a Population Proportion Conditions for Inference The statistic that estimates the parameter p (population proportion) is the sample proportion p ˆ. p ˆ = Count of successes in the
What is a parameter? What is a statistic? How is one related to the other?
 Chapter Seven: SAMPLING DISTRIBUTIONS 7.1 Sampling Distributions Read 424 425 What is a parameter? What is a statistic? How is one related to the other? Example: Identify the population, the parameter,
Chapter 26: Comparing Counts (Chi Square)
") Chapter 6: Comparing Counts (Chi Square) We ve seen that you can turn a qualitative variable into a quantitative one (by counting the number of successes and failures), but that s a compromise it forces
Chapter 6: Comparing Counts (Chi Square) We ve seen that you can turn a qualitative variable into a quantitative one (by counting the number of successes and failures), but that s a compromise it forces
Lecture 26: Chapter 10, Section 2 Inference for Quantitative Variable Confidence Interval with t
 Lecture 26: Chapter 10, Section 2 Inference for Quantitative Variable Confidence Interval with t t Confidence Interval for Population Mean Comparing z and t Confidence Intervals When neither z nor t Applies
Econ 325: Introduction to Empirical Economics
 Econ 325: Introduction to Empirical Economics Lecture 6 Sampling and Sampling Distributions Ch. 6-1 Populations and Samples A Population is the set of all items or individuals of interest Examples: All
SHORT ANSWER. Write the word or phrase that best completes each statement or answers the question.
 Chapter 7 Exam A Name 1) How do you determine whether to use the z or t distribution in computing the margin of error, E = z α/2 σn or E = t α/2 s n? 1) Use the given degree of confidence and sample data
Interpret Standard Deviation. Outlier Rule. Describe the Distribution OR Compare the Distributions. Linear Transformations SOCS. Interpret a z score
 Interpret Standard Deviation Outlier Rule Linear Transformations Describe the Distribution OR Compare the Distributions SOCS Using Normalcdf and Invnorm (Calculator Tips) Interpret a z score What is an
Chapter 23: Inferences About Means
 Chapter 3: Inferences About Means Sample of Means: number of observations in one sample the population mean (theoretical mean) sample mean (observed mean) is the theoretical standard deviation of the population
Ch18 links / ch18 pdf links Ch18 image t-dist table
 Ch18 links / ch18 pdf links Ch18 image t-dist table ch18 (inference about population mean) exercises: 18.3, 18.5, 18.7, 18.9, 18.15, 18.17, 18.19, 18.27 CHAPTER 18: Inference about a Population Mean The
Data Analysis and Statistical Methods Statistics 651
 Data Analysis and Statistical Methods Statistics 65 http://www.stat.tamu.edu/~suhasini/teaching.html Suhasini Subba Rao Review In the previous lecture we considered the following tests: The independent
STAT Chapter 9: Two-Sample Problems. Paired Differences (Section 9.3)
") STAT 515 -- Chapter 9: Two-Sample Problems Paired Differences (Section 9.3) Examples of Paired Differences studies: Similar subjects are paired off and one of two treatments is given to each subject in
STAT 515 -- Chapter 9: Two-Sample Problems Paired Differences (Section 9.3) Examples of Paired Differences studies: Similar subjects are paired off and one of two treatments is given to each subject in
AP Statistics Review Ch. 7
 AP Statistics Review Ch. 7 Name 1. Which of the following best describes what is meant by the term sampling variability? A. There are many different methods for selecting a sample. B. Two different samples
Exam 2 (KEY) July 20, 2009
 July 20, 2009") STAT 2300 Business Statistics/Summer 2009, Section 002 Exam 2 (KEY) July 20, 2009 Name: USU A#: Score: /225 Directions: This exam consists of six (6) questions, assessing material learned within Modules
STAT 2300 Business Statistics/Summer 2009, Section 002 Exam 2 (KEY) July 20, 2009 Name: USU A#: Score: /225 Directions: This exam consists of six (6) questions, assessing material learned within Modules
One-sample categorical data: approximate inference
 One-sample categorical data: approximate inference Patrick Breheny October 6 Patrick Breheny Biostatistical Methods I (BIOS 5710) 1/25 Introduction It is relatively easy to think about the distribution
Contingency Tables. Safety equipment in use Fatal Non-fatal Total. None 1, , ,128 Seat belt , ,878
 Contingency Tables I. Definition & Examples. A) Contingency tables are tables where we are looking at two (or more - but we won t cover three or more way tables, it s way too complicated) factors, each
MAT 2379, Introduction to Biostatistics, Sample Calculator Questions 1. MAT 2379, Introduction to Biostatistics
 MAT 2379, Introduction to Biostatistics, Sample Calculator Questions 1 MAT 2379, Introduction to Biostatistics Sample Calculator Problems for the Final Exam Note: The exam will also contain some problems
Sampling Distribution Models. Central Limit Theorem
 Sampling Distribution Models Central Limit Theorem Thought Questions 1. 40% of large population disagree with new law. In parts a and b, think about role of sample size. a. If randomly sample 10 people,
Section 5.4. Ken Ueda
 Section 5.4 Ken Ueda Students seem to think that being graded on a curve is a positive thing. I took lasers 101 at Cornell and got a 92 on the exam. The average was a 93. I ended up with a C on the test.
*Karle Laska s Sections: There is no class tomorrow and Friday! Have a good weekend! Scores will be posted in Compass early Friday morning
 STATISTICS 100 EXAM 3 Spring 2016 PRINT NAME (Last name) (First name) *NETID CIRCLE SECTION: Laska MWF L1 Laska Tues/Thurs L2 Robin Tu Write answers in appropriate blanks. When no blanks are provided CIRCLE
Mathematical Notation Math Introduction to Applied Statistics
 Mathematical Notation Math 113 - Introduction to Applied Statistics Name : Use Word or WordPerfect to recreate the following documents. Each article is worth 10 points and should be emailed to the instructor
Statistical Intervals (One sample) (Chs )
 (Chs )") 7 Statistical Intervals (One sample) (Chs 8.1-8.3) Confidence Intervals The CLT tells us that as the sample size n increases, the sample mean X is close to normally distributed with expected value µ and
7 Statistical Intervals (One sample) (Chs 8.1-8.3) Confidence Intervals The CLT tells us that as the sample size n increases, the sample mean X is close to normally distributed with expected value µ and
Salt Lake Community College MATH 1040 Final Exam Fall Semester 2011 Form E
 Salt Lake Community College MATH 1040 Final Exam Fall Semester 011 Form E Name Instructor Time Limit: 10 minutes Any hand-held calculator may be used. Computers, cell phones, or other communication devices
Problems Pages 1-4 Answers Page 5 Solutions Pages 6-11
 Part III Practice Problems Problems Pages 1-4 Answers Page 5 Solutions Pages 6-11 1. In estimating population mean or proportion what is the width of an interval? 2. If 25 college students out of 80 graduate
ACMS Statistics for Life Sciences. Chapter 13: Sampling Distributions
 ACMS 20340 Statistics for Life Sciences Chapter 13: Sampling Distributions Sampling We use information from a sample to infer something about a population. When using random samples and randomized experiments,
SMAM 314 Exam 3d Name
 SMAM 314 Exam 3d Name 1. Mark the following statements True T or False F. (6 points -2 each) T A. A process is out of control if at a particular point in time the reading is more than 3 standard deviations
Two-Sample Inferential Statistics
 The t Test for Two Independent Samples 1 Two-Sample Inferential Statistics In an experiment there are two or more conditions One condition is often called the control condition in which the treatment is
y = a + bx 12.1: Inference for Linear Regression Review: General Form of Linear Regression Equation Review: Interpreting Computer Regression Output
 12.1: Inference for Linear Regression Review: General Form of Linear Regression Equation y = a + bx y = dependent variable a = intercept b = slope x = independent variable Section 12.1 Inference for Linear
Unit 9: Inferences for Proportions and Count Data
 Unit 9: Inferences for Proportions and Count Data Statistics 571: Statistical Methods Ramón V. León 12/15/2008 Unit 9 - Stat 571 - Ramón V. León 1 Large Sample Confidence Interval for Proportion ( pˆ p)
Statistics Boot Camp. Dr. Stephanie Lane Institute for Defense Analyses DATAWorks 2018
 Statistics Boot Camp Dr. Stephanie Lane Institute for Defense Analyses DATAWorks 2018 March 21, 2018 Outline of boot camp Summarizing and simplifying data Point and interval estimation Foundations of statistical
Occupy movement - Duke edition. Lecture 14: Large sample inference for proportions. Exploratory analysis. Another poll on the movement
 Occupy movement - Duke edition Lecture 14: Large sample inference for proportions Statistics 101 Mine Çetinkaya-Rundel October 20, 2011 On Tuesday we asked you about how closely you re following the news
Hypothesis Testing. Mean (SDM)
") Confidence Intervals and Hypothesis Testing Readings: Howell, Ch. 4, 7 The Sampling Distribution of the Mean (SDM) Derivation - See Thorne & Giesen (T&G), pp. 169-171 or online Chapter Overview for Ch.
Confidence Intervals and Hypothesis Testing Readings: Howell, Ch. 4, 7 The Sampling Distribution of the Mean (SDM) Derivation - See Thorne & Giesen (T&G), pp. 169-171 or online Chapter Overview for Ch.
their contents. If the sample mean is 15.2 oz. and the sample standard deviation is 0.50 oz., find the 95% confidence interval of the true mean.
 Math 1342 Exam 3-Review Chapters 7-9 HCCS **************************************************************************************** Name Date **********************************************************************************************
Ch. 7. One sample hypothesis tests for µ and σ
 Ch. 7. One sample hypothesis tests for µ and σ Prof. Tesler Math 18 Winter 2019 Prof. Tesler Ch. 7: One sample hypoth. tests for µ, σ Math 18 / Winter 2019 1 / 23 Introduction Data Consider the SAT math
STA Why Sampling? Module 6 The Sampling Distributions. Module Objectives
 STA 2023 Module 6 The Sampling Distributions Module Objectives In this module, we will learn the following: 1. Define sampling error and explain the need for sampling distributions. 2. Recognize that sampling
Inference for Proportions, Variance and Standard Deviation
 Inference for Proportions, Variance and Standard Deviation Sections 7.10 & 7.6 Cathy Poliak, Ph.D. cathy@math.uh.edu Office Fleming 11c Department of Mathematics University of Houston Lecture 12 Cathy
Econ 325: Introduction to Empirical Economics
 Econ 325: Introduction to Empirical Economics Chapter 9 Hypothesis Testing: Single Population Ch. 9-1 9.1 What is a Hypothesis? A hypothesis is a claim (assumption) about a population parameter: population
Using Dice to Introduce Sampling Distributions Written by: Mary Richardson Grand Valley State University
 Using Dice to Introduce Sampling Distributions Written by: Mary Richardson Grand Valley State University richamar@gvsu.edu Overview of Lesson In this activity students explore the properties of the distribution
Statistic: a that can be from a sample without making use of any unknown. In practice we will use to establish unknown parameters.
 Chapter 9: Sampling Distributions 9.1: Sampling Distributions IDEA: How often would a given method of sampling give a correct answer if it was repeated many times? That is, if you took repeated samples
STA Module 10 Comparing Two Proportions
 STA 2023 Module 10 Comparing Two Proportions Learning Objectives Upon completing this module, you should be able to: 1. Perform large-sample inferences (hypothesis test and confidence intervals) to compare
Statistical inference provides methods for drawing conclusions about a population from sample data.
 Introduction to inference Confidence Intervals Statistical inference provides methods for drawing conclusions about a population from sample data. 10.1 Estimating with confidence SAT σ = 100 n = 500 µ
Sampling Distributions: Central Limit Theorem
 Review for Exam 2 Sampling Distributions: Central Limit Theorem Conceptually, we can break up the theorem into three parts: 1. The mean (µ M ) of a population of sample means (M) is equal to the mean (µ)
KDF2C QUANTITATIVE TECHNIQUES FOR BUSINESSDECISION. Unit : I - V
 KDF2C QUANTITATIVE TECHNIQUES FOR BUSINESSDECISION Unit : I - V Unit I: Syllabus Probability and its types Theorems on Probability Law Decision Theory Decision Environment Decision Process Decision tree
Confidence intervals CE 311S
 CE 311S PREVIEW OF STATISTICS The first part of the class was about probability. P(H) = 0.5 P(T) = 0.5 HTTHHTTTTHHTHTHH If we know how a random process works, what will we see in the field? Preview of
Chapter 9. Inferences from Two Samples. Objective. Notation. Section 9.2. Definition. Notation. q = 1 p. Inferences About Two Proportions
 Chapter 9 Inferences from Two Samples 9. Inferences About Two Proportions 9.3 Inferences About Two s (Independent) 9.4 Inferences About Two s (Matched Pairs) 9.5 Comparing Variation in Two Samples Objective
20 Hypothesis Testing, Part I
 20 Hypothesis Testing, Part I Bob has told Alice that the average hourly rate for a lawyer in Virginia is $200 with a standard deviation of $50, but Alice wants to test this claim. If Bob is right, she
Contingency Tables. Contingency tables are used when we want to looking at two (or more) factors. Each factor might have two more or levels.
 factors. Each factor might have two more or levels.") Contingency Tables Definition & Examples. Contingency tables are used when we want to looking at two (or more) factors. Each factor might have two more or levels. (Using more than two factors gets complicated,
Contingency Tables Definition & Examples. Contingency tables are used when we want to looking at two (or more) factors. Each factor might have two more or levels. (Using more than two factors gets complicated,
The variable θ is called the parameter of the model, and the set Ω is called the parameter space.
 Lecture 8 What is a statistical model? A statistical model for some data is a set of distributions, one of which corresponds to the true unknown distribution that produced the data. The variable θ is called
Questions 3.83, 6.11, 6.12, 6.17, 6.25, 6.29, 6.33, 6.35, 6.50, 6.51, 6.53, 6.55, 6.59, 6.60, 6.65, 6.69, 6.70, 6.77, 6.79, 6.89, 6.
 Chapter 7 Reading 7.1, 7.2 Questions 3.83, 6.11, 6.12, 6.17, 6.25, 6.29, 6.33, 6.35, 6.50, 6.51, 6.53, 6.55, 6.59, 6.60, 6.65, 6.69, 6.70, 6.77, 6.79, 6.89, 6.112 Introduction In Chapter 5 and 6, we emphasized
Sections 6.1 and 6.2: The Normal Distribution and its Applications
 Sections 6.1 and 6.2: The Normal Distribution and its Applications Definition: A normal distribution is a continuous, symmetric, bell-shaped distribution of a variable. The equation for the normal distribution
ANOVA - analysis of variance - used to compare the means of several populations.
 12.1 One-Way Analysis of Variance ANOVA - analysis of variance - used to compare the means of several populations. Assumptions for One-Way ANOVA: 1. Independent samples are taken using a randomized design.
Section 9.4. Notation. Requirements. Definition. Inferences About Two Means (Matched Pairs) Examples
 Examples") Objective Section 9.4 Inferences About Two Means (Matched Pairs) Compare of two matched-paired means using two samples from each population. Hypothesis Tests and Confidence Intervals of two dependent means
Objective Section 9.4 Inferences About Two Means (Matched Pairs) Compare of two matched-paired means using two samples from each population. Hypothesis Tests and Confidence Intervals of two dependent means
Purposes of Data Analysis. Variables and Samples. Parameters and Statistics. Part 1: Probability Distributions
 Part 1: Probability Distributions Purposes of Data Analysis True Distributions or Relationships in the Earths System Probability Distribution Normal Distribution Student-t Distribution Chi Square Distribution
Notice that these facts about the mean and standard deviation of X are true no matter what shape the population distribution has
 7.3.1 The Sampling Distribution of x- bar: Mean and Standard Deviation The figure above suggests that when we choose many SRSs from a population, the sampling distribution of the sample mean is centered
The Chi-Square Distributions
 MATH 183 The Chi-Square Distributions Dr. Neal, WKU The chi-square distributions can be used in statistics to analyze the standard deviation σ of a normally distributed measurement and to test the goodness