Effects of geometric and material parameters on failure modes of SC elements
|
|
|
- Abigail Whitehead
- 6 years ago
- Views:
Transcription
1 Aalto University School of Engineering Department of Mechanical Engineering Vishesh Lohani Effects of geometric and material parameters on failure modes of SC elements Thesis submitted in partial fulfilment of the requirements for the degree of Master of Science in Technology Master's Thesis Espoo, Finland May 30th, 2016 Supervisor: Advisors: Prof., Dr. Jukka Tuhkuri, Aalto University Dr. Ludovic Fülöp, VTT Technical Research Centre of Finland Ltd Dr. Jouni Freund, Aalto University
2 Aalto University, P.O. BOX 11000, AALTO Abstract of master's thesis Author: Vishesh Lohani Title of thesis: Effects of geometric and material parameters on failure modes of SC elements Degree Programme: Mechanical Engineering Major: Mechanical Engineering Code: IA3027 Thesis supervisor: Jukka Tuhkuri Thesis advisors: Ludovic Fülöp and Jouni Freund Date: Number of pages: Language: English Abstract A steel-concrete-steel composite (SC) element resembles double skin sandwich composite structure in which the concrete core is in-filled between steel skins. Mechanical shear connectors connect the skins and they are embedded in concrete. These connectors transfer shear forces and have an important role in performance of composite element. SC element is prone to different failure modes such as flexural failure, de-bonding between steel plate and concrete, and shear failure. There are 3 aims of the thesis to study the effects of geometric and material parameters on the failure modes of SC elements via finite element (FE) method. Six SC beam specimens are used to examine failure modes in this research. The first two specimens are configured to a four-point bending test with the intention of obtaining flexural failure. The remaining specimens are configured to a three-point bending test with the intention to obtain a shear failure. Based on characteristics of the specimens, models are created and analysed with the aid of commercial Abaqus/Explicit FE software. A quasi-static analysis is accomplished to replicate the experimental behaviour of the specimens. The results of experiments and simulations are compared to validate the models. Failure modes in experiments and simulations are similar. Specimen may fail due to yielding of the tensile steel plate followed by buckling of the compression steel plate or due to vertical shear cracks in the concrete followed by yielding of the shear connectors. According to the parametric study, the failure of SC beam in bending is affected by thickness of tensile steel plate as well as stud geometry. Failure of SC beam in shear is affected by stud geometric parameters. With increasing tensile plate thickness in bending, the beam fails only because of yielding of tensile steel plate. Geometric parameters and position of studs significantly affect the end slip between concrete and steel plate in both bending and shear failures. Although magnitude of ultimate load is different, the failure modes of SC beams considered in this study are not affected by material properties of steel plates in bending and material properties of tie bars in shear. Keywords: Failure mode, Finite element method, Parametric study, SC beam, Validation ii
3 Acknowledgements First and foremost, it is a great pleasure to acknowledge my deepest thanks and gratitude to my advisor, Dr. Ludovic Fülöp from VTT Technical Research Centre of Finland for his continuous support, encouragement, and immense knowledge. My gratitude is also owed to my supervisor, prof., Dr. Jukka Tuhkuri and advisor Dr. Jouni Freund from Aalto University for their kind supervision and valuable feedbacks. Furthermore I would like to thank Dr. Petr Hradil, Vilho Jussila, and Kim Calonius for their assistance and guidance in material modelling, finite element analysis, and documentation during my master thesis work. A special thank goes to Infrastructure Health team as well as other colleague from VTT for their expertise, valuable suggestions and accessibility. I am also thankful to RFCS-SCIENCE project, Radiation and Nuclear Safety Authority (STUK), and Peikko Group for supporting this project. Last but not the least; my deepest gratitude goes to my parents for all the support throughout my life and to my wife for her patience and understanding. Thank you! Vishesh Lohani Espoo, Finland May, 2016 iii
4 Table of Contents Abstract... ii Acknowledgements... iii Table of Contents... iv Notation... vi Abbreviations and Acronyms... vii List of Figures... viii List of Tables... x 1 Introduction Scope and structure Structure and design of SC element Design methodology Strength of SC beam Moment resistance of SC beam Shear resistance strength of SC beam Rigidity of SC beam De-bonding resistance strength of SC beam Failure modes of SC element Flexural failure Shear failure De-bonding failure SC beam model Material models Isotropic elasto-plasticity with hardening Ramberg-Osgood model Damage plasticity model Interaction models of the structural parts Loading and boundary conditions SC beam specimens Abaqus Implementation iv
5 5.1 Geometry Material properties Assembly and meshing Step, loading, constraint, and boundary condition Post processing Results of the experiment Validation of SC model Model S Model S Model S Model S Model S Model S Summary of the results Effects of parameters Effect of plate material on failure in 4-point bending Effect of beam height on failure in 4-point bending Effect of stud length on failure in 4-point bending Effect of studs on failure in 3-point bending Effect of tie-stud arrangement on failure in 3-point bending Effect of beam height on failure in 3-point bending Effect of tie bar on failure in 3-point bending Conclusions Recommendations for future studies References Appendixes Appendix I: Drawing of SC beam Appendix II: Strength and deformation characteristics for concrete Appendix III: NELSON stud catalogue Appendix IV: Additional Formulae v
6 Notation A s d c/t d stud d tie E E cm f ck f cm f ctm f u f y G f h stud H I eq L M pl,rd n N cu.rd P RD R p0.2 s tie s stud t c V RD W α γ δ ε θ Cross-section area of the steel plate Damage variables Diameter of stud Diameter of tie bar Modulus of elasticity Elastic modulus of the concrete Characteristic compressive cylinder strength of concrete Mean value of concrete cylinder compressive strength Mean value of axial tensile strength of concrete Ultimate stress Yield stress Fracture Energy Overall nominal height of stud Height of the SC beam Equivalent second moment of area about the neutral axis Length of the SC structure Design plastic bending moment resistance strength Ramberg-Osgood constant Expected compressive strength of concrete at crushing Design shear resistance strength of a headed stud Proof strength at 0.2% strain Spacing between two tie bars Spacing between two studs Compression plate thickness Transverse shear resistance strength of SC beam Width of the SC structure Imperfection factor Safety factor Deflection of the beam Strain Shear crack angle vi
7 ϱ σ τ υ χ Density Stress Shear stress Poisson s ratio Buckling reduction factor Abbreviations and Acronyms ACI CDP CPU C3D8R DOFs FE FEA FEM GUI NPP R3D4 RC SC S4R VTT American Concrete Institute Concrete damage plasticity Central processing unit Continuum, 3-Dimensional, 8-nodes, Reduced integration Degree of freedoms Finite Element Finite Element Analysis Finite Element Method Graphical User Interface Nuclear Power Plant Rigid, 3-Dimensional, 4-nodes Reinforced Concrete Steel-Concrete-Steel Composite Shell, 4-nodes, Reduced integration VTT Technical Research Centre of Finland Ltd vii
8 List of Figures Figure 1: Structure of SC beam... 1 Figure 2: Comparison of construction time of SC and RC structures... 2 Figure 3: (a) Containment module of AP1000 reactor (b) decking system of offshore platforms... 2 Figure 4: Schematic representation of (a) Double skin SC (b) Bi-steel SC, and (c) SC with J- hook connectors... 3 Figure 5: (a) Steel frame and (b) after concreting of SC beam... 8 Figure 6: Typical failure mechanisms of SC element Figure 7: (a) Stress components in SC beam and (b) Concrete cracks during loading Figure 8: (a) Vertical shear failure (b) diagonal compression failure mechanisms (c) diagonal tension failure mechanisms Figure 9: (a) Plate-end de-bonding (b) Intermediate crack induced de-bonding Figure 10: Front, side (section) and top projections of a SC beam Figure 11: Isotropic hardening Figure 12: Yield surface in (a) deviatoric plane (b) three dimensions Figure 13: Stress-strain curve of concrete for uniaxial load in (a) compression (b) tension Figure 14: Uniaxial tension behaviour of concrete (a) pre-cracking stress-strain relationship (b) post-cracking stress-crack displacement relationship Figure 15: Contact pressure-clearance relationship Figure 16: Coulomb friction model Figure 17: Load and support arrangement of a 4-point bending test Figure 18: Load and support arrangement of a 3-point bending test Figure 19: Drawing of specimens S1 and S Figure 20: Drawing of specimens S3, S4 and S Figure 21: Drawing of specimen S Figure 22: A finite element representation of SC beam Figure 23: User interface of SC beam Plug-In (geometry) Figure 24: A quarter size model of SC beam Figure 25: A half size model of SC beam Figure 26: User interface of SC beam Plug-In (material properties) Figure 27: Characteristic stress strain relation for isotropic hardening material viii
9 Figure 28: Characteristic stress strain relation for the austenitic grade Figure 29: Stress-stain curve of concrete in uniaxial compression Figure 30: Stress-cracking displacement relationship of concrete in uniaxial tension Figure 31: Tension cracks in concrete according to (a) Wang and Hsu model (b) Fracture energy criterion Figure 32: Mesh of FE model (for 4-point bending test) Figure 33: Mesh of FE model (for 3-point bending test) Figure 34: Schematic representation of force versus deflection curve with (a) force-control (b) displacement-control methods Figure 35: Bending test specimen illustrating applied loads (downward arrows), reaction forces (upward arrows), and measurement region (yellow rectangle) Figure 36: Buckled specimen S1 (a) full specimen (c) close-up view of buckling Figure 37: Shear test specimen illustrating applied load (downward arrow), reaction forces (upward arrows), and measurement region (yellow rectangle) Figure 38: Vertical shear cracks developed in specimen S Figure 39: Failure mechanisms of model S1 (a) buckling (b) cracks in the outer face (mirror view) (c) bottom plate yielding (d) close-up view of buckling Figure 40: Results for model S1 (a) force versus displacement (b) comparison of force versus displacement (c) comparison of end slips (d) comparison of bottom plate strain Figure 41: Failure mechanisms of model S2 (a) buckling (b) cracks in the outer face (mirror view) (c) bottom plate yielding (d) close-up view of buckling Figure 42: Results for model S2 (a) force versus displacement (b) comparison of force versus displacement (c) comparison of end slips (d) comparison of bottom plate strain Figure 43: Failure mechanisms of model S3 (a) shear cracks (b) initiation of bending cracks (c) tie bar yielding at the ultimate force (d) shear cracks at the ultimate load in outer face (mirror view) Figure 44: Results for model S3 (a) force versus displacement (b) comparison of force versus displacement (c) comparison of end slips (d) comparison of shear bar strain Figure 45: Failure mechanisms of model S4 (a) shear cracks (b) initiation of bending cracks (c) tie bar yielding at the ultimate force (d) shear cracks at the ultimate load in outer face (mirror view) Figure 46: Results for model S4 (a) force versus displacement (b) comparison of force versus displacement (c) comparison of end slips (d) comparison of shear bar strain ix
10 Figure 47: Failure mechanisms of model S5 (a) shear cracks (b) initiation of bending cracks (c) tie bar yielding at the ultimate force (d) shear cracks at the ultimate load in outer face (mirror view) Figure 48: Results for model S5 (a) force versus displacement (b) comparison of force versus displacement (c) comparison of end slips (d) comparison of shear bar strain Figure 49: Failure mechanisms of model S6 (a) shear cracks (b) initiation of bending cracks (c) tie bar yielding at the ultimate force (d) shear cracks at the ultimate load in outer face (mirror view) Figure 50: Results for model S6 (a) force versus displacement (b) comparison of force versus displacement (c) comparison of end slips (d) comparison of shear bar strain Figure 51: Plastic strain in steel frame of specimen (a) height 500 mm (b) height 800 mm (c) height 1200 mm Figure 52: Effect of stud length on failure mechanisms Figure 53: Failure mechanisms without stud Figure 54: Failure mechanisms (stud diameter 19 mm and length 125 mm) Figure 55: Failure mechanisms (stud diameter 16 mm and length 100 mm) Figure 56: Failure mechanisms (stud diameter 16 mm and length 50 mm) Figure 57: Failure mechanisms (beam height 1200 mm, long stud) Figure 58: Failure mechanisms (beam height 1200 mm, short stud) Figure 59: Failure mechanisms (beam height 500 mm, long stud) List of Tables Table 1: Dimensions of SC beams Table 2: Parameters of structural parts of SC beam Table 3: Position of supports and load during test Table 4: Material properties of structural parts of SC beam Table 5: Plasticity parameters used in concrete damage plasticity model Table 6: Ultimate load and failure modes obtained from experiments Table 7: Comparison of load bearing capacity and failure modes Table 8: Parameters considered for the analysis x
11 1 Introduction A steel-concrete-steel composite (SC) element (SC beam) illustrated in Figure 1 resembles double skin sandwich composite structure in which the concrete is in-filled between outer steel skins which act as permanent formwork [1]. The thin steel plates are connected to concrete by shear connectors (Stud and Tie bar). Studs are welded on the inner surface of the steel plates while tie bars are connecting the steel plates and both are embedded in the concrete [2]. The load transfer between these structural elements is significantly influenced by the interactions of material interfaces in SC beams. The connectors transfer shear forces in vertical as well as in horizontal directions, resist longitudinal slips, and have, therefore, an important role in the performance of composite elements. The structural performance of SC beams shows superiority over reinforced concrete structures in applications required high strength, high ductility, structural integrity, and ability to prevent impact, leakage and explosion [3]. Figure 1: Structure of SC beam [4]. The advantages of SC structures include the elimination of formwork, the elimination of reinforcing bars, the ability to support equipment anywhere on the steel plate without any anchor attachments, and shift of considerable amount of work from construction sites to fabrication shops. SC construction significantly reduces the on-site installation person-hours (illustrated in Figure 2). Additionally, the quantity of steel needed for SC structure is 25% lesser than in a traditional steel-concrete structure. [5] Because of quicker, efficient, and 1

![Figure 2: Comparison of construction time of SC and RC structures [5] Figure 3: (a) Containment module of AP1000 reactor [5] (b)](/docs-images/72/67717070/images/12-1.jpg "decking system of offshore platforms [6] Some representative examples of SC structures include foundation of off-shore wind towers,")
12 economic construction processes of SC structure, it can replace reinforced concrete (RC) structures in demanding industrial applications or in difficult construction circumstances. Figure 2: Comparison of construction time of SC and RC structures [5] Figure 3: (a) Containment module of AP1000 reactor [5] (b) decking system of offshore platforms [6] Some representative examples of SC structures include foundation of off-shore wind towers, transfer beams in high-rise buildings, beams in industrial structures supporting concentrated 2
13 loads, and composite beams in bridges. In addition, SC structures provide blast resistance capability regarding to terrorist attack.[7] Containment module of AP1000 reactor (Westinghouse) and ice-resisting wall of oil production platform (Northstar Island, Alaskan Beaufort Sea) shown in Figure 3(a) and (b) respectively were made from SC structures. The concept development of SC structure began during 1970s when Solomon et al. proposed an alternative solution of girder and deck for bridge/highway construction. SC beam was designed without mechanical shear connectors. The steel plates were attached to concrete core by means of epoxy resin adhesive in this construction. The adhesive acted as a shear transfer medium between steel plate and concrete core. This beam behaved in the same manner as RC beams [8] without shear reinforcements, exhibited satisfactory bending moment capacity but lack of enough shear strength.[9] To improve structural integrity and performance, different types of mechanical shear connectors were used since 1980s. Double-skin SC construction with headed stud, Bi-steel SC construction with shear bar, and SC construction with J-hook connectors, as illustrated in Figure 4(a), (b) and (c) respectively, represent the state-of-the-art of SC beam construction [10]. Figure 4: Schematic representation of (a) Double skin SC (b) Bi-steel SC, and (c) SC with J- hook connectors [10] In Double skin SC structure, headed studs are welded to the inner side of steel plate and terminate within the concrete core. These studs not only develop a tie between the core and 3
14 the skin but also prevent local buckling of the skin. The first research on the fundamental aspects of double-skin SC structure illustrated in Figure 4(a) was carried out by Oduyemi and Wright in [3] Corus Construction & Industrial Ltd initially developed the concepts of Bi-steel SC structure in Bi-steel SC (illustrated in Figure 4(b)) is another type of SC structure which consists of shear bar connectors. In this SC construction, the strength and composite action of the structure is improved because of the shear bar connectors embedded in concrete core which connect the top and bottom steel plates. The design guidelines for this structure ensure that the tensile plate yields before any other type of failure.[11] Liew et al. [12] proposed a SC structure with J-hook connectors (illustrated in Figure 4(c)) in A pair of J-hook is welded to the inner surface of steel plates, interlocked each other and embedded in the concrete core. These connectors provide relatively high tensile capacity due to confinement by the concrete core and transfer shear force between core and skin. The interlocking mechanism of J-hook connectors prevent local buckling phenomena of top steel plate, provide cross sectional shear resistance, and retain the structural integrity.[12] Apart from SC constructions described above, there is also undergoing research on connectors, e.g., angle connector, C channel connector, corrugated strip connector. Most of the SC studies have been concentrated on the load bearing capacity of SC structure under static and dynamic loading. Although design methodologies and design standards of SC structures with headed stud and Bi-steel are available in literature, they are usually tightly calibrated for a certain failure mode or a few modes and are not endorsed yet in Eurocode perspective. This lack of established design and construction guides has led to uncertainty in the structural design of SC structures. Research on the SC structure via finite element method has been carried out since 30 years. Shukry (1986), Kumar (2000), and Sohel (2008) did research on SC structure using commercial FE software. FE analysis of a SC structure without shear connectors was carried out by Shukry (1986). In this research, the FE results indicated a stiffer beam than the test results. [13] A series of double skin SC plates were analysed by Kumar (2000). The ultimate strength of SC plates obtained from FE analysis was in good agreements with the test results but was not able to describe interaction between stud and concrete core. [14] Sohel (2008) 4
15 carried out FE analysis of a SC structure with J-hook connectors subjected to impact loading. The FE model predicted ultimate strength and failure modes similar to the experiments but the results were limited to impact tests. [15] 1.1 Scope and structure VTT Technical Research Centre of Finland is actively participating in research activities on SC structures. In the first phase, detailed design of SC beams at ambient temperature was accomplished based on available literature of SC structure and Eurocodes. Based on the design report, experimental analysis of 12 full scale SC beam specimens and push-out test were carried out in the second phase. The interpretation of experiment results and parametric study of SC beams with the aid of FEM are the aims of the third phase.[4][16][17] The objectives of this research are as follow: a) To formulate and implement a SC beam model b) To validate the FE results against experiment results c) To study the effects of geometric and material parameters on failure modes of SC beam A finite element (FE) software package; Abaqus/Explicit is applied for numerical calculations and data analysis. The implementation of SC beam model is based on the Plug-in technique proposed by Donnadieu and Fülöp [16] which executes in Abaqus by using Python script and Abaqus GUI toolkit. The outcomes of six experiments by Koukkari and Fülöp [17] are used to validate the model. The model is also used to find the main geometric and material parameters affecting the failure modes of SC beam. Chapter 2 presents the structure and current design rules for a SC beam applied in VTT. The key concepts and fundamental theory behind SC structures presented in this chapter are based on the beam theory. In chapter 3, the failure modes of SC structures are discussed. Geometric parts, geometric parameters, and material models of the SC beam model are presented in chapter 4. Contact modelling, loading, and boundary conditions are also discussed in this chapter. Implementation of SC beam model in the commercial Abaqus/Explicit FE software is 5
16 addressed in chapter 5. The experiment results are summarised in chapter 6. The outcomes of FE analysis are compared to experiment results in chapter 7. The effects of geometric and materials parameters are discussed in chapter 8. In chapter 9, a set of conclusions is derived from the parametric study and recommendations are given for the future work in the same area. 6
17 2 Structure and design of SC element In this chapter, structure and design principles of the SC element used in VTT are discussed. Loading is described by shear force and bending moment acting on a cross section of SC beam. It is assumed that the top steel plate and concrete core above the neutral axis are under compression while the bottom steel plate and concrete core below the neutral axis are under tension due to the positive bending moment. Longitudinal shear stress between the interface of steel plate and concrete core and vertical shear stress are also developed due to the shear force. 2.1 Design methodology The design methodology of a SC beam in VTT is based on the available design specifications in Eurocode and on the beam model. The design method involves ultimate limit state design of the SC beams and beam columns. The following design standards and design documents are primarily used: [4] a) EN 1990: Eurocode: Basis of structural design b) EN : Design of Concrete Structures, General rules and rules for buildings c) EN : Design of Steel Structures, General rules and rules for buildings d) EN : Design of Composite Steel and Concrete Structures, General rules and rules for buildings e) The Design Guide for Steel-Concrete-Steel Sandwich Construction "Volume 1: General Principles and Rules for Basic Elements" - The Steel Construction Institute VTT analysed the different SC beam constructions on the basis of the design standards and documents listed above. The design of SC beam at VTT was proposed (shown in Figure 5) to make use of a top and a bottom steel plate, NELSON headed stud (Appendix III ) and a shear bar embedded in concrete core. [4] 7
![Figure 5: (a) Steel frame and (b) after concreting of SC beam [17] 2.](/docs-images/72/67717070/images/18-0.jpg "2 Strength of SC beam In the strength analyses of SC beam, the cross-section is simultaneously subject to bending moment and shear force.")
18 Figure 5: (a) Steel frame and (b) after concreting of SC beam [17] 2.2 Strength of SC beam In the strength analyses of SC beam, the cross-section is simultaneously subject to bending moment and shear force. For structural integrity, the beam should satisfy the condition [18] ( V 2 sd ) + ( M 2 sd ) 1, (2.1) V pl,rd M pl,rd where V sd is the design shear force, M sd is the design bending moment, V pl,rd is the design plastic shear resistance in the absence of moment, and M pl,rd is the design plastic moment resistance in the absence of shear Moment resistance of SC beam The moment resistance of SC beam is calculated on the basis of plastic approach because it has fewer assumptions than the elastic approach. [19] The design plastic moment resistance M pl,rd of SC beam is calculated by taking moments about the centre of the compression steel plate and is given by [18] 8
19 M pl,rd = N c,rd ( h c + t c ) + N 2 cu,rd ( h c 2 λ 2 x) + N t,rd ( h c + t t ), (2.2) 2 where N c,rd is the compression force in steel plate, N cu,rd is the nominal compressive force in concrete, N t,rd is the tension force in steel plate, t t is the thickness of the tension steel plate, t c is the thickness of the compression steel plate, h c is the depth of concrete core, λ is a coefficient, and x is the plastic neutral axis position. The plastic neutral axis position x can be calculated by equating nominal compressive force in concrete N cu,rd, compression force in steel plate N c,rd, and tension force in steel plate N t,rd. The equations for the different forces and plastic neutral axis position are given by [18][20] N cu,rd = ηf ck bλ x γ C, (2.3) N c,rd = bt cf ysc γ α, (2.4) N t,rd = bt tf ysc γ α, x = γ C 1 f ysc (t t t c ), γ α ηλ f ck (2.5) (2.6) where f ck is the characteristics cylinder compressive strength of the concrete, f ysc is the yield stress of the compression/ tension steel plate, b is the width of the SC section, η is a factor, γ α is a safety factor (γ α = 1 in all cases), and γ C is also a safety factor (γ C = 1) Shear resistance strength of SC beam The shear force causes longitudinal and transverse shear stress components in SC beam. Shear stress can lead to the failure of shear connectors during the transfer of longitudinal forces from steel plate to concrete and yielding of shear connectors due to a transverse shear failure. [21] The transverse shear resistance capacity of SC beam consists of two parts: shear resistance provided by concrete acting with steel plates, and shear resistance provided by shear connectors. The design plastic shear resistance strength V pl,rd is expressed as [18] 9
20 V pl,rd = V Rd,c + V s, (2.7) where V Rd,c is the shear resistance provided by concrete, and V s is the shear resistance provided by shear connectors. According to Eurocode 2, the design shear resistance of a concrete without shear reinforcement is given by [18] V Rd,c = [C Rd,c k(100ρf ck ) 1/3 + k 1 σ cp ]b w h c, (2.8) where C Rd,c = 0.18/γ c for normal weight concrete, γ c is the partial safety factor, k = /h c 2 with h c in mm, h c is the depth of concrete core, ρ = A sl /b w h c, A sl is the cross section area of tensile reinforcement, b w is the smallest width of the cross section, f ck is the characteristics cylinder compressive strength of the concrete, k 1 = 0.15, and σ cp is the shear strength of concrete. The shear contribution by mechanical shear connectors is given by [18] V s = n 0F t h c S s, (2.9) where n 0 is the number of shear connectors either in top plate or in bottom plate across the width of the section, F t is the tensile strength of the connectors, h c is the depth of concrete core, and S s is the spacing of the connectors. 2.3 Rigidity of SC beam The deflection of SC beam caused by bending moments and shear force may be restricted for various reasons. If the height of the beam is not small compared to the length, shear force may give a significant contribution to deflection. Bond strength between steel plates and concrete core significantly influences the bending stiffness of SC beam. The total deflection of the beam δ T consists of bending, shear and slip components i.e [22] δ T = δ m + δ v + δ SL, (2.10) 10
21 where δ m is bending deflection, δ v is shear deflection, and δ SL is slip deflection defined according to Wright and Oduyemi s model [23] assuming zero slip at the top plate. The detailed formulae to calculate the slip deflection is given in Appendix IV. The bending deflection δ m for a SC beam due to a point load F at a mid-span is [22][24] δ m = FL3 [ 3a 3 6EI eq 4L (a L ) ], (2.11) where L is the length of the beam, EI eq is the bending rigidity, a is the distance of point load from the beam end. The shear deflection δ v for a SC beam due to point load F at a mid-span is [22][25] δ v = Fa 2S, (2.12) where S is the shear stiffness of the beam (Appendix IV) and a is the distance of point load from the end of the beam. 2.4 De-bonding resistance strength of SC beam De-bonding is possible due to insufficient number of shear connectors. Hence, the total debonding resistance strength of the shear connectors is calculated on the basis of the number of studs and tie-bars between plates and concrete. The resistance of the connectors P c,rd to the shear forces transferred by the steel plates is limited to 0.8 times the design shear resistance of the welded stud connectors P Rd (when attached to compression plate) and 0.6 times the design shear resistance of the welded stud connectors P Rd (when attached to tension plate). According to Eurocode 4, the equations to determine the design shear resistance of welded stud connectors is [26] P Rd = min ( 0.8 f uπ d 2 4 γ v, 0.29 α d2 ( f ck E cm ) γ v ), (2.13) 11
22 where f u is the ultimate stress of the stud, d is the diameter of the shank of the studs, α is a factor (coefficient), f ck is the characteristic compressive cylinder strength of concrete, E cm is the elastic modulus of concrete, and γ v is a safety factor (γ v = 1). The coefficient α can be chosen as α = { 0.2 (h sc d + 1) for 3 h stud/d stud 4, 1 for h stud /d stud > 4, (2.14) where d stud is the diameter of the studs and h stud is the overall nominal height of the stud. 12
23 3 Failure modes of SC element According to Oduyemi et al. [3], SC elements can fail under static loading due to at least one of the failure modes listed below. a) Flexural failure b) Shear failure c) Horizontal slip failure These failure modes observed experimentally are outcome of various local failure mechanisms. In flexural failure, yielding of steel plates and flexural cracks (smeared vertical hair cracks) in concrete core are the common failure mechanisms. Shear failure is characterised by diagonal shear cracks developed in concrete core from the bottom steel plate to the vicinity of applied load. Apart from these failure modes, end slip/ de-bonding between steel plates and concrete core may occur due to failure of shear connectors. The buckling of compression steel plate may also occur due to combined effects of normal stress and shear stress. Figure 6 illustrates schematically different failure mechanisms of the SC beam. Figure 6: Typical failure mechanisms of SC element [3] 13
24 3.1 Flexural failure Flexural failure is common failure mode in a 4-point bending test. Failure in SC beam is initiated by tension yielding of the steel plate followed the crushing of concrete in compression. For these failure mechanisms, the maximum compression strain in concrete needs to be smaller than the failure strain of steel plate (i.e. yield strain of steel). Positive bending moment produces compression stress above the neutral axis and tensile stress below the neutral axis (Figure 7(a)). As the steel plate at the top surface is subjected to high compression stress, buckling of compression steel plate may occur after yielding of tension steel plate.[3][9] Figure 7: (a) Stress components in SC beam and (b) Concrete cracks during loading Concrete is assumed not to take any tension but it is good at resisting compression. Therefore, smeared vertical hair cracks are developed in the concrete due to tension in the beginning of the deformation. When the deformation increases, the cracks gradually tend to incline and become flexural-shear cracks (Figure 7(b)). 3.2 Shear failure Shear failure in SC beam occurs near a support where shear stress components are high. Although shear connectors play an important role to resist a sudden occurrence of shear failure, there is no fully convincing method for predicting the horizontal shear failure. Vertical shear failure has two principal failure mechanisms i.e. diagonal tension and diagonal compression. In the diagonal tension failure, an inclined shear crack is developed which split the beam into two pieces. Crushing of concrete occurs due to diagonal compression. [27] The 14
 Vertical shear failure (b) diagonal compression failure mechanisms (c) diagonal tension failure mechanisms Vertical shear cracks shown in Figure 8(a) can be either web-shear cracks or")
25 schematic representation of diagonal compression and diagonal tension vertical failure mode are shown in Figure 8 (b) and (c) respectively. Figure 8: (a) Vertical shear failure (b) diagonal compression failure mechanisms (c) diagonal tension failure mechanisms Vertical shear cracks shown in Figure 8(a) can be either web-shear cracks or flexural-shear cracks. Web shear cracks occur from an interior point of concrete core when the principle tensile stress components exceed the tensile strength of the concrete. Flexural-shear cracks occur after the inclination of flexural cracks. These cracks develop when the combined shear and tensile stress exceeds the tensile strength of the concrete. [27] After the failure of concrete core, a tie bar may yield due to stress concentrating in shear connectors. 3.3 De-bonding failure De-bonding failure between steel parts and concrete of SC beam occurs in the high stress concentration regions, which are often associated with material discontinuities and presence of cracks. Propagation path of de-bonding depends on the elastic properties, strength of the 15
26 bond, substrate materials, and their interface fracture properties. De-bonding failure can occur due to flexure-shear crack, flexural crack, plate end shear failure, and shear failure. It has either plate-end de-bonding mode or intermediate crack induced de-bonding mode. A plateend de-bonding initiates at the ends of the beam and propagates in the direction of increasing moment illustrated in Figure 9(a). An intermediate crack induced de-bonding initiates at flexural-shear crack region within the shear span and propagates towards the plate end in the direction of decreasing moment shown in Figure 9(b). De-bonding failure weakens the bonding strength between steel plate and concrete core and may produce an end slip. [3][28] Figure 9: (a) Plate-end de-bonding (b) Intermediate crack induced de-bonding 16
27 4 SC beam model This chapter describes the SC beam model, structural parts and their parameters, material models, and the contact model as well as the loading and boundary conditions. The geometrical parameters of rectangular SC beam shown in Figure 10 are length (L), width (W), height (H), shear tie distance (S tie ) in longitudinal direction, stud spacing in longitudinal direction (S stud_long ), and stud/ tie bar spacing in transversal direction (S stud_trans ). Figure 10: Front, side (section) and top projections of a SC beam The structural parts of SC beam are core, top and bottom plate, tie bar, and stud (Figure 10). The core is made from concrete and it has length (same as beam s length), width (same as beam s width), and height (h c ) equals height of the beam minus total thickness of top and bottom steel plate as the geometric parameters. The geometric parameters of steel plate are length (same as beam s length), width (same as beam s width) and thickness (t sp ). The geometric parameters of a tie bar are diameter (d tie ) and length (L tie ) (same as the height of concrete core). Stud is the fourth structural part having diameter (d stud ) and length (L stud ) as the geometric parameters. 17
28 4.1 Material models Bottom steel plate is made from structural steel S355 while top plate is made from either S355 steel or stainless steel. The quality of stainless steel is austenitic grade Shear bar is manufactured from either S355 steel or from Gr 8.8 steel. Studs are made from structural steel S235-J2G3+C450, a special grade used for NELSON stud. The concrete has nominal C30/37 grade. [17] All these materials are considered as isotropic. The stress strain relationship is given by [29] σ = D el : ε el, (4.1) where D el is the elasticity tensor which depends on Young s modulus E and Poisson s ratio υ and ε el denotes the elastic part of the strain which is assumed to be small. The material models of steel and concrete are described as follows Isotropic elasto-plasticity with hardening Figure 11: Isotropic hardening Structural steel S355 exhibits an ideal stress-strain curve in which a plastic plateau is developed after yielding. The material behaves initially elastic (according to Eq. 4.1) followed by strain softening and then changes into plastic. The yield criterion of steel is based on von Mises stress measure whose yield surface is illustrated in Figure 11. The relation between stress σ and elastic strain ε el by Hooke s law is [29] 18
29 σ = D el : ε el = D el : (ε ε pl ), (4.2) where ε is the total strain and ε pl is the plastic strain. The yield function for isotropic hardening material is [29] F(σ) = σ 0 (ε pl ), (4.3) where σ 0 is the equivalent stress which is given by σ 0 ε pl = σ: ε pl. (4.4) The plastic strain increment dε pl according to the flow rule is given by [29] dε pl = dλ dg dσ, (4.5) where λ is non-negative plastic multiplier, and g is the plastic potential Ramberg-Osgood model The stress-strain behaviour of stainless steel is different from that of S355. Strain hardening of stainless steel takes place at significantly higher ranges than low carbon steel without clear demarcation of the yielding point. The grade of stainless steel affects the degree of roundness of the stress strain curve, and austenitic grade exhibits the maximum non-linearity and strain hardening. Ramberg-Osgood model with Hill s modification illustrates the stress-strain relationship of stainless steel with minimum number of required parameters. According to this model, the offset yield stress of stainless steel is assumed to be 0.2% proof stress. Strain hardening behaviour of the steel depends on Ramberg-Osgood constant (n). When stress level is higher than 0.2% proof stress, plastic strain gradually becomes greater than the elastic strain. [30] In multiaxial case, the Ramberg-Osgood model is [29] Eε = (1 + υ)s (1 2υ)pI α ( q n 1 ) s, (4.6) σ 0 19
30 where ε is strain tensor, E is Young s modulus, υ is Poisson s ratio, s is the stress deviator, p is the equivalent hydrostatic stress, I is the identity tensor, α is the yield offset, q is the Mises equivalent stress, and n is the hardening constant Damage plasticity model Concrete contains a large number of micro cracks which are developed due to segregation, thermal expansion, shrinkage, or loading. Micro cracks affect considerably the mechanical behaviour during loading and contribute to generate the quasi-brittle behaviour of concrete. The nonlinear (quasi-brittle) behaviour of concrete can be analysed by smeared cracking approach or by damage plasticity approach [29]. The crack initiation process at any location occurs in smeared crack concrete approach when stress reaches one of the failure regions either in the biaxial tension region or in a combined tension-compression region. This approach is proposed for a relatively monotonic loading and for a material which exhibits either compressive crushing or tensile cracking. Cracking is assumed to be the most important aspect of this approach and the representation of cracking and post-cracking anisotropic behaviour dominates the analysis. Plastic straining in compression is controlled by a compression yield surface. [29] Concrete damage plasticity approach is a modification of the Drucker Prager strength hypothesis developed by Lubliner et al., 1989 and elaborated by Lee & Fenves, 1998 [29]. It describes the complex nonlinear behaviour of concrete. This model provides general capability for an analysis of concrete structure under different loading condition which is characterised by a yield criterion, flow rule, and a hardening/softening function [31][32]. Initially, stiffness degradation of concrete is isotropic and it is defined by damage variables. Strain rate decomposition is given by [29] ε = ε el + ε pl, (4.7) where ε is the total strain rate, ε el is the elastic strain rate, and ε pl is the plastic strain rate. The stress strain relationship is [29][32] σ = (1 d)d 0 el : (ε ε pl ) = D el : (ε ε pl ), (4.8) 20
31 el where D 0 is the initial (undamaged) elastic stiffness of the material, D el el = (1 d)d 0 is the degraded elastic stiffness, and d is the scalar stiffness degradation variable having the range from zero (undamaged material) to 1 (fully damaged material). The effective stress tensor σ is defined as [29][32] σ D 0 el : (ε ε pl ). (4.9) Cauchy stress tensor σ, effective stress tensor σ, and the degradation variable d are related by [29][32] σ = (1 d)σ. (4.10) Figure 12: Yield surface in (a) deviatoric plane (b) three dimensions [33] A yield surface is a surface in the stress space enclosing the volume of the elastic region. This means that the state of stress inside the surface is elastic, while stress states on the surface have reached the yield point. The yield criterion described by Lubliner et al. (1989) and modified by Lee and Fenves (1998) to account for different evolution of strength under tension and compression is given by [29][32] F = 1 1 α (q 3αp + β σ max γ σ max ) σ c 0, (4.11) 21
32 where p is the effective hydrostatic pressure, q is the von Mises stress measure, σ max is the maximum eigenvalue of effective stress, ε pl is the plastic strain, ε pl c is the plastic strain in compression, σ c is the principal effective stress in compression, and α and γ are dimensionless material constants. A function β is given by β = σ c σ t (1 α) (1 + α), (4.12) where σ c is the effective compressive cohesive stress and σ t is the effective tensile cohesive stress. These material constants mainly depend upon ratio of the strength in the biaxial state to the strength in the uniaxial state (f b0 / f c0 ) and ratio of the distances between the hydrostatic axis and respectively the compression meridian and the tension meridian in the deviatoric cross section (K c ). The flow rule for damage-plasticity model is given by [29] ε pl = λ dg(σ ) dσ, (4.13) where λ is non-negative plastic multiplier, and G is the flow potential. The flow potential is the Drucker-Prager hyperbolic function and it is given by [29][32] G = (εσ t0 tan ψ) 2 + q 2 p tan ψ, (4.14) where ψ is the dilatation angle, σ t0 is the uniaxial tensile stress at failure, ε is the eccentricity that defines the rate at which the function approaches the asymptote. Dilation angle is defined as the angle of inclination of the failure surface towards the hydrostatic axis. It is also described as concrete internal friction angle. The value of dilation angle is ranges from 36 0 to 40 0 for normal concrete C30/37. Eccentricity improves the hyperbolic form of plastic potential surface. It is calculated as the ratio of tensile strength to compressive strength. [32][33] The nature of stress-strain curve for uniaxial compression of concrete is illustrated in Figure 13(a). 22
33 Figure 13: Stress-strain curve of concrete for uniaxial load in (a) compression (b) tension [29] Uniaxial compression stress σ c and the effective stress tensor σ c are related by [29] σ c = (1 d c )σ c = (1 d c )E 0 (ε c ε c pl ), (4.15) where d c is the degradation variable in compression, E 0 is the initial modulus of elasticity of concrete, ε c is the total compressive strain, ε c pl is the compressive plastic strain, ε c el is the compressive elastic strain, and σ cu is the uniaxial ultimate compression stress. The stress-strain relationship for uniaxial tension behaviour of concrete is illustrated in Figure 13(b). It is seldom determined through a direct tension test because of the difficulties involved in its execution and the large scatter of the results. Tension behaviour of concrete can be described on the basis of different ways. Wang and Hsu [34] defines tension stiffness behaviour of concrete on the basis of stress σ t versus cracking strain ε t ck. According to them, tension behaviour of concrete is given by E 0 ε tot σ t = { ck ε t f ctm ( ) ε tot 0.4 if ε tot ε t ck if ε tot > ε t ck, (4.16) 23
34 where σ t is the tensile stress applied in concrete, E 0 is the modulus of elasticity of concrete, ε tot is the total tensile strain of concrete, ε t ck is the cracking strain of concrete, and f ctm is the mean concrete tensile strength. Figure 14: Uniaxial tension behaviour of concrete (a) pre-cracking stress-strain relationship (b) post-cracking stress-crack displacement relationship [35] Tension stiffness can also be expressed in terms of fracture energy (G f ) cracking criterion based on Hillerborg s (1976) fracture energy proposal [29]. Tension behaviour of concrete based on this proposal is illustrated in Figure 14(a) and (b). The equation for the tensile stresscrack opening relationship of concrete is [35] f ctm ( w ) for w w w 1 σ ct = { 1 f ctm ( w ) for w w 1 < w w c, 1 (4.17) where σ ct is the uniaxial tensile stress in concrete, f ctm is the mean value of axial tensile strength of concrete in MPa, w is the crack opening in mm, w 1 = G F /f ctm in mm when σ ct = 0.20 f ctm, w c = 5 G F /f ctm in mm when σ ct = 0, and G F is the fracture energy in N/mm. Concrete degradation variable d defines the damage of concrete in SC beam ranging from zero (undamaged material) to one (fully damage material). Damage associated with the failure modes of the concrete (cracking and crushing) results in a reduction in the elastic stiffness. The stiffness degradation is isotropic in nature. The degradation variables are computed by using the following expression as [29] 24
35 d = 1 σ tk σ tk.max, (4.18) where d is the damage variable, σ tk is the true compression or tension stress, and σ tk.max is the maximum true compression or tension stress. 4.2 Interaction models of the structural parts The composite action of concrete and steel in SC beam relies on the bond between these two materials. Part surfaces are not perfectly smooth and even highly polished surfaces possess some degree of roughness. Surface roughness has a significant effect on how loads are transmitted at the contact interfaces.[4] Structural parts of SC beam interact at their geometrical boundaries, referred to as mating faces. To model the behaviour of contact surfaces, it is important to model both the structural parts and their interactions with each other and their surroundings properly. Contact interactions of structural parts are defined by specifying surface pairings and self-contact surfaces. Contact interface mechanics of SC beam consists of two components: normal interaction and tangential interaction.[16] Figure 15: Contact pressure-clearance relationship In normal interaction, contact pressure is acting perpendicular to the contacting surfaces. The relationship of contact pressure p and clearance h between two surfaces at a point illustrated 25
36 in Figure 15 can be described as p = 0 for h < 0 (open) and h = 0 for p > 0 (closed). The contact constraint can be enforced with a Lagrange multiplier representing the contact pressure in a mixed formulation. The change in contact pressure that occurs when a contact condition changes from open (a positive clearance) to closed (clearance equal to zero) is sudden. This model is known as Hard contact normal interaction model.[29] Figure 16: Coulomb friction model Tangential behaviour of contact interface is associated with surface friction between contact parts. Coulomb friction model shown in Figure 16 can describe the interaction of contacting surfaces, which is based on classic laws of friction. The model is used for non-lubricated contacts as well as boundary- and mixed-lubricated contacts. Interacting surfaces allow separating but not permitting to penetrate each other. The tangential motion is zero until the surface traction reaches a critical shear stress value which depends on the normal contact pressure is given by [29] τ crit = μp, (4.19) where μ is the friction coefficient and p is the normal contact pressure between the two surfaces. If the idle friction model does not model the slip conditions accurately, an allowable elastic slip shown by dotted line in Figure 16 may be introduced [29]. The elastic slip is the small amount of relative motion between the surfaces that occurs when the surfaces are sticking. 26
37 4.3 Loading and boundary conditions The 4-point bending test is performed with the intention of obtaining flexural failure. In this test, there are 2 loading points and 2 supports. The 3-point bending test is carried out with the intention to obtain a shear failure. For this test, there is one loading point and 2 supports. The schematic representation of 4-point bending test and 3-point bending test are shown in Figure 17 and Figure 18 respectively. The parameters of load and support conditions are loading distance from left end (L L), support distance from the end (L s ), and distance between the two loading points (L M). Figure 17: Load and support arrangement of a 4-point bending test Figure 18: Load and support arrangement of a 3-point bending test 4.4 SC beam specimens Six differently configured SC beams are used to study failure modes. The varied geometric parameters among the beam specimens include thickness of steel plates, tie bar diameters, shear reinforcement ratios, and overall dimensions. Table 1 shows the dimensions of SC beam specimens. 27
![Specimens Length (L), m Height (H), mm Table 1: Dimensions of SC beams [17] Width (W), mm Shear tie distance (S tie ) mm Stud spacing in longitudinal (S stud_long ) and transversal (S stud_trans )](/docs-images/72/67717070/images/38-0.jpg "directions (mm/mm) Top Bottom S1 9.54 800 640 600 300/240 200/240 S2 9.54 800 640 600 300/240 200/240 S3 8.34 800 800 600 200/160 200/160 S4 8.34 800 800 600 200/160 200/160 S5 8.")
38 Specimens Length (L), m Height (H), mm Table 1: Dimensions of SC beams [17] Width (W), mm Shear tie distance (S tie ) mm Stud spacing in longitudinal (S stud_long ) and transversal (S stud_trans ) directions (mm/mm) Top Bottom S / /240 S / /240 S / /160 S / /160 S / /160 S / /160 The front view and side view of specimens S1 and S2 with dimensions are shown in Figure 19(a) and (b) respectively. The ratio of distances between stud and thickness of compression steel plate is high i.e. S stud /t c equals 30 in these specimens. S1 and S2 are identical in geometrical parameters. Detail drawing with dimensions and section views of these specimens are given in Appendix I. ( a ) ( b ) Figure 19: Drawing of specimens S1 and S2 [4] In Figure 20(a) and (b), the front view and side view of S3, S4 and S6 with dimensions are shown respectively. Shear reinforcements are conservatively spaced i.e. distances between tie bars equals to 600mm. The ratio of distances between tie bars and height of the SC beam is This ratio satisfies the shear reinforcement distribution limit (maximum 0.75 times height of SC beams) according to EN : Eurocode 2 (Clause and Clause 9.2.2). 28

 ( b ) Figure 20: Drawing of specimens S3, S4 and S6 [4] Figure 21(a) and (b) illustrate the front view and side view of specimen S5.")
39 S3 and S4 have identical geometric parameters except the diameter of shear bar. S3 has tie bars while specimen S4 has threaded bars. There are differences of arrangement of tie bars and stud along transverse direction of S6 with respect to S3 and S4. Detail drawing with dimensions and section views of these specimens are also given in Appendix I. ( a ) ( b ) Figure 20: Drawing of specimens S3, S4 and S6 [4] Figure 21(a) and (b) illustrate the front view and side view of specimen S5. In this specimen, shear reinforcements are very rarely spaced i.e. distance between tie bars is 1000 mm. S5 has 0.064% minimum shear reinforcing ratio. Both shear reinforcement distribution limit (maximum 0.75 times height of SC beams) and the minimum shear reinforcing ratio (minimum 0.11%) according to EN : Eurocode 2 (Clause and Clause 9.2.2) are violated in this specimen. Detail drawing with dimensions and section views of this specimen are also given in Appendix I. ( a ) ( b ) Figure 21: Drawing of specimen S5 [4] The major structural parts parameters of SC beam are thickness of steel plates, diameter of shear bar, stud length and stud diameter. These parameters are tabulated in Table 2. 29
40 Specimens Table 2: Parameters of structural parts of SC beam [17] Steel plate Thickness Tie bar Stud Stud (t sp ) mm diameter diameter length Top Bottom (d tie ) mm (d stud ) mm (L stud ) mm S S S S M S S The first two specimens (S1 and S2) are configured to a 4-point bending test and the remaining specimens (S3 S6) are configured to a 3-point bending test. In Table 3, the dimension of supports and loading arrangement designed for the tests are listed. The rotation is restrained in the y and z direction and the translation in z direction. The distance of the supports from the end is 270mm in all specimens. Hydraulic actuators are used to apply the load incrementally during the test in vertical downward direction. The load cells are used to measure the applied load. Initially, the loading process starts with slow loading, complete unloading, and then the test is subjected to loading until up to the maximum displacement of the actuator. The distance of loading point from the end is 3870 mm in 4-point bending test and 3270 mm in 3-point bending tests. Specimens Table 3: Position of supports and load during test [17] Total Bending points Support Loading distance No. of No. of distance from from left end (LL), Supports loading end (Ls), mm mm Distance between two loads (LM), mm S1 and S S3, S4, S5, and S
41 5 Abaqus Implementation Finite element method (FEM) is a robust numerical technique to obtain approximate solutions of mathematical models. The domain is discretised into subdomains called elements, and the solution is sought in terms of discrete values of field variables. The advantages of discretising whole domain into subdomains include accurate representation of complex geometry and capture of local effects. The application areas of FEM ranges from stress analysis of solids to fluid dynamic problems, and from thermal problems to the analysis of electromagnetic phenomena. [16] Figure 22: A finite element representation of SC beam SC beams are characterised by quasi-brittle behaviour of material, multiple failure modes, and numerous surface to surface contacts. Consequently, structural analysis of SC beam requires non-linear analysis [16]. Commercial FE software Abaqus/Explicit is used for the non-linear quasi-static analysis. In Figure 22, a finite element model of SC beam created in Abaqus/CAE is illustrated. A Plug-In named SC Beam developed by Donnadieu [16] and further improved in this thesis is used to generate the FE model. It executes Python scripts as well as GUI toolkit, and provides general user interface to create a customized FE model [29]. As a benefit, the modelling cost and time is reduced significantly. All the data needed for the plug-in are input in SI units. [29] The geometry, material properties, loads and support arrangement, as well as 31
42 mesh and job properties can input through the Plug-In s user interface. The remaining properties of the model are constant therefore they are defined in python scripts. 5.1 Geometry The geometry of the specimens listed in Table 1 and Table 2 are input in the user interface of the Plug-in illustrated in Figure 23. Figure 23: User interface of SC beam Plug-In (geometry) Mirror symmetry technique is opted to reduce the number of elements and degree of freedoms and thereby the computational works. This technique defines the symmetry about a particular plane or multiple planes in which geometry, loading conditions, supports, and material 32

43 properties are identical among sections. Single plane symmetry reduces a model into a half while double planes reduce a model into a quarter of the original size. [29] Specimen S1 and S2 are symmetric in both longitudinal and transverse planes. In addition, support and loading conditions are also symmetric with respect to these planes. Hence, the model of theses specimens is quarter of the original size. A quarter size model is illustrated in Figure 24. Figure 24: A quarter size model of SC beam Geometries and supports of specimen S3, S4, S5, and S6 are symmetric with respect to the longitudinal and transverse planes. However, the loading condition is only symmetric with respect to the longitudinal plane. Therefore, the model of these specimens is half of the original size. In Figure 25, a half size model is shown. Figure 25: A half size model of SC beam The structural parts of SC beam are modelled by using pre-defined element in library of Abaqus/Explicit FE software. Each element is characterized by attributes such as family, number of nodes, integration method, formulation, and degree of freedoms (DOFs). Concrete, 33
44 Specimens Yield stress (MPa) Ultimate stress (MPa) Ultimate strain (%) Yield stress (MPa) Ultimate stress (MPa) Ultimate strain (%) Yield stress (MPa) Ultimate stress (MPa) Yield stress (MPa) Ultimate stress (MPa) stud, and tie bar are modelled using continuum solid element C3D8R. Steel plate is modelled by using shell element S4R. Supports as well as load are modelled by using rigid element R3D4.[29] 5.2 Material properties The mechanical properties of steel include modulus of elasticity (E s ) 200 GPa, Poisson s ratio (υ) 0.3, and density (ϱ) 7850 kg/m 3. In addition, the ultimate elongation of steel is taken to be at least 15%. Similarly, the mechanical properties of concrete include modulus of elasticity (E cm ) 33 GPa, Poisson s ratio (υ) 0.2, density (ϱ) 2400 kg/m 3, and strain at peak compression stress (ε c1 ) 2.2. Material properties of structural parts of SC beam are tabulated in Table 4. The mean value of five samples for each specimen tested in the VTT lab is presented in the table. Mean value of concrete cylinder compressive strength (f cm ) and mean value of axial tensile strength of concrete (f ctm ) are estimated based on characteristic compressive cube strength of concrete (f ck,cube ) determined from the experiment. Table 4: Material properties of structural parts of SC beam Bottom Plate Top Plate Tie Bar Stud Concrete fck,cube (MPa) fcm (MPa) fctm (MPa) S S S S S S These material properties are input in the user interface of the Plug-in illustrated in Figure
45 Figure 26: User interface of SC beam Plug-In (material properties) Structural steel S355 is modelled as elasto-plastic material with isotropic hardening behaviour. The characteristic stress strain relation (uniaxial) for structural steel S355 is illustrated in Figure 27. There are some variations in material properties of NELSON studs (manufactured from S235-J2G3+C450 steel) and tie bars (manufactured from S355 steel or Gr 8.8 steel) compared to steel plates. However, material properties of these structural parts of SC beam are also modelled according to isotropic elasto-plastic strain hardening model. 35
46 Sress [MPa] Stress (MPa) TRUE Engineering Strain Figure 27: Characteristic stress strain relation for isotropic hardening material Although stainless steel is also modelled as elasto-plastic material with isotropic hardening model, the stress-strain behaviour of stainless steel is different from that of structural steel S355. Therefore, the material behaviour of stainless steel is based on Ramberg-Osgood model modified by Hill. The stress strain relation (uniaxial) of stainless steel obtained according to Ramberg-Osgood model is shown in Figure TRUE Engineering Strain Figure 28: Characteristic stress strain relation for the austenitic grade
47 Compression Stress [ MPa] In concrete damage plasticity (CDP) model, dilation angle, eccentricity, ratio of the biaxial stress f b0 to the uniaxial stress f c0, deviatoric factor K c, and viscosity coefficient are collectively known as plasticity parameters which are listed in Table 5. These parameters are based on Abaqus manual [29], Jankowiak et al. (2005) [32], and Kmiecik et al. (2011) [33]. The magnitude of degradation variables of concrete is input ranging from zero (undamaged material) to one (fully damage material). Table 5: Plasticity parameters used in concrete damage plasticity model Dilation Angle Eccentricity f b0 /f c0 K c Viscosity coefficient Eurocode 2 is opted to replicate the uniaxial compression behaviour of concrete illustrated in Figure 29 because it requires fewer parameters than other approaches. According to EN : Eurocode 2 clause 3.1.4, elastic modulus of concrete at the origin (E c ) can be approximated as 1.05 times E cm. This approximation does not create precisely the curve between elastic and plastic region. Hence, the elastic nature of concrete is used only between origin and the first increment corresponding to a very small compressive strain ε c value Strain Figure 29: Stress-stain curve of concrete in uniaxial compression The rest of the values of the compression curve are evaluated according to following equations. [18] 37
48 σ c = f cm kη η (k 2)η for 0 < ε c < ε cu1, (5.1) η = ε c ε c1, k = 1.05 E cm ε c1 f cm, (5.2) (5.3) where σ c is the uniaxial compressive stress in the concrete, f cm is the mean value of concrete cylinder compressive strength, η is the ratio between compressive strain ε c and compressive strain at peak strain ε c1, ε cu1 is the crushing strain, and E cm is the modulus of elasticity of concrete. The uniaxial tension behaviour of concrete is based on fracture energy cracking criterion according to Hillerborg's (1976) fracture energy proposal [29]. Fracture energy (G f ) is defined as the energy required to propagate a tensile crack of concrete of unit area. It depends primarily on the water-cement ratio, the maximum aggregate size and the age of concrete for normal concrete C30/37. Fracture energy is determined according to International Federation of Structural Concrete (fib- Fédération internationale du béton) model code for concrete structures 2010 [35] and expressed as follow in equation (24). G f = 73 f cm 0.18 (5.4) where G f is fracture energy in N/m and f cm is mean value of concrete cylinder compressive strength in MPa. According to above mentioned equation, the total fracture energy for normal concrete C30/37 with 38 MPa mean value of concrete cylinder compressive strength is N/m. Based on this fracture energy, crack opening displacements at 20% and 1% of concrete tensile strength (σ ct ) are calculated. The crack opening displacement w 1 = G F /f ctm when σ ct = 0.20 f ctm and crack opening displacement w c = 5 G F /f ctm when σ ct = 0.01 f ctm where f ctm is mean value of concrete cylinder tensile strength. The uniaxial concrete tension curve according to fracture energy cracking criterion is illustrated in Figure 30. The crack opening displacement in x-axis versus concrete tensile stress in y-axis is plotted in this curve. 38
![Tensile Stress [MPa] 3 2.5 2 1.5 1 0.5 0 0.00 0.05 0.10 0.15 0.20 0.](/docs-images/72/67717070/images/49-0.jpg "25 Cracking displacement [mm] Figure 30: Stress-cracking displacement relationship of concrete in uniaxial tension Initially, uniaxial tension behaviour of concrete was modelled according to Wang and")
49 Tensile Stress [MPa] Cracking displacement [mm] Figure 30: Stress-cracking displacement relationship of concrete in uniaxial tension Initially, uniaxial tension behaviour of concrete was modelled according to Wang and Hsu approach [34]. The experimental tension cracks of concrete were not correctly replicated by this model (shown in Figure 31(a)). In the final model, the tension behaviour of concrete is modelled according to fracture energy cracking criterion [35]. This criterion was found to replicate the experimental behaviour better. The tension cracks obtained from finite element analysis according to fracture energy cracking criterion are shown in Figure 31(b). Figure 31: Tension cracks in concrete according to (a) Wang and Hsu model (b) Fracture energy criterion 5.3 Assembly and meshing FE model of SC beam is generated by assembling different parts. The part instances of the model are steel plate, concrete, tie bar, stud, load, and support. The assembled model consists 39
 Different seed size of mesh is selected for part instances in order to balance the computing accuracy and efficiency.")
50 of dependent part instances and has global co-ordinate system. Each instance is placed within the assembly by translation and/or rotation with respect to global origin. Figure 32: Mesh of FE model (for 4-point bending test) Different seed size of mesh is selected for part instances in order to balance the computing accuracy and efficiency. The mesh of FE model designed for a flexural failure (first two specimens) including closed-up view of mesh of part instances is illustrated in Figure 32. For these models, plates and concrete instances have global seed size of mesh at least 2 times of the diameter of stud. Seed size of mesh in load and support instances is equivalent to diameter of stud while seed size of mesh in stud and tie bar is half of the diameter of stud. The mesh of FE model designed for a shear failure (remaining specimens) is illustrated in Figure 33. The global seed size of mesh in the plate instance is approximately 2 times the diameter of tie bar. The seed size in other part instances such as concrete, supports, and loading plate (rigid plate where load is applied) is approximately 1.5 times the diameter of tie bar. The seed size of mesh in part instances tie and stud is half of the diameter of tie bar. The mesh size of the curved elements is controlled by deviation factor set to 0.1. The deviation factor is a measure of how much the element edges deviate from the target geometry. The minimum size control of the mesh is the global seed size divided by

51 Figure 33: Mesh of FE model (for 3-point bending test) 5.4 Step, loading, constraint, and boundary condition The step module includes defining the analysis steps, specifying output requests, and specifying analysis controls. The Initial step is created by default and a dynamic/explicit step named Applied load is created for the quasi-static analysis. Time period valued 10s, automatic time incrementation, and mass scaling for whole model with target time increment are the properties of Applied Load step. Supports are applied in the Initial step with restrained rotation in the y and z direction and restrained translation in z direction which define the boundary conditions of the model. Based on the symmetry technique described in the beginning of this chapter, symmetries are created in the model. Both x and y symmetries are defined in the model of first two specimens while only x symmetry is defined the model of remaining specimens. Spatially distributed quantities such as stress, strain, displacement, reaction forces, and damage fracture properties are defined in field output request. Quantities that characterize the whole model or a region of the 41
52 model such as elastic strain energy, energy dissipated plastically etc. are defined in history output requests. Figure 34: Schematic representation of force versus deflection curve with (a) force-control (b) displacement-control methods Load can be applied by different methods such as force-control and displacement control. The schematic representation of force versus deflection curves based on force-control and displacement control methods are shown in Figure 34(a) and (b) respectively. As also the post-failure behaviour of SC beams is of interest, displacement-control method is selected to apply the load in FE analysis. In this method, an imposed displacement is defined in boundary conditions (BCs) type displacement/rotation. The displacement is applied in the negative z- direction with magnitude ranges from m to 0.01 m depending on the type of bending test. A smooth amplitude step is created to apply the displacement load during displacement controlled loading. The interaction at the interface between concrete and steel plate, loading cell and top steel face plate, bottom steel face plate and supports, as well as shear connectors and concrete core is simulated by the general contact with hard formulation in the normal direction and penalty friction formulation in the tangential direction. The hard formulation means that the contact pressure is transferred once two interaction surfaces are contacted whilst no contact pressure is transferred when they are separated. The penalty friction formulation permits relative slip between two interacting surfaces and the friction force between the surfaces is 42
53 proportional to the defined friction coefficient. This formulation allows separating interacting surfaces but not permits penetrating each other. Friction coefficient is set to 0.2 because it provides similar end slip of FE model compared to experiment. According to push-out tests, the shear stress limit is taken as MPa and elastic slip stiffness is taken as 1222 N/m 3. It is also assumed that there is no tensile contact force between steel plate and concrete core. Tie constraint is created between inner surface of loading plate and outer surface of top steel plate, end surface of stud and inner surface of top / bottom steel plate, end surface of shear bars and inner surface of steel plates, headed surface of stud and adjacent concrete section, and inner surface of support plates and outer surface of bottom plate. A self-weight of SC beams is input with gravity load 9.81 m/s 2 in vertical downward (-z) direction in the model. 5.5 Post processing After completing the pre-processing phase, the job is created and submitted for analysis. The results of the analysis are obtained in.odb file. The different model shapes such as undeformed, deformed, contours etc. and results information are obtained from output database using the visualization module. The quality of analysis results and the sources of convergence problems are obtained by using visual diagnostics tool. The field output requests or history outputs requests can be achieved in nodal point, in elements or in whole model based upon the specific output request. All of these requests can be plotted in Abaqus viewport using plotting tools, and data exported to Microsoft Excel using Excel utility option. 43

54 6 Results of the experiment The results obtained from the 4-point bending test and the 3-point bending test of SC beam are summarised in this chapter. The results of the experiment for each SC specimen in terms of failure modes and the ultimate force are presented. SC beam of 4-point bending test is shown in Figure 35. Arrows indicate the direction of applied loads and reaction forces. Yellow rectangle indicates the measurement region of expected bending failure under a constant bending moment. The top surface of the SC beam is under compression and bottom surface is under tension. Figure 35: Bending test specimen illustrating applied loads (downward arrows), reaction forces (upward arrows), and measurement region (yellow rectangle) [17] Specimens (S1 and S2) fail due to yielding of the tensile plate closely followed by buckling of the compression plate. The buckling failure of SC beam seems to be driven by the collapse of the compression zone of the beam followed by concrete crushing. In Figure 36, the buckled steel plate marked by red circle of specimen S1 is illustrated [17]. 44
![Figure 36: Buckled specimen S1 (a) full specimen (c) close-up view of buckling [17] Shear failure seems more dangerous than a flexural failure and, therefore shear reinforcement is designed](/docs-images/72/67717070/images/55-0.jpg "conservatively in specimens (S3 - S6). SC beam of a 3-point bending test is shown in Figure 37. Arrows indicate the direction of applied load and reaction forces.")
, reaction forces (upward arrows), and measurement region (yellow rectangle) [17] Concrete is stronger in compression than in")
55 Figure 36: Buckled specimen S1 (a) full specimen (c) close-up view of buckling [17] Shear failure seems more dangerous than a flexural failure and, therefore shear reinforcement is designed conservatively in specimens (S3 - S6). SC beam of a 3-point bending test is shown in Figure 37. Arrows indicate the direction of applied load and reaction forces. Yellow rectangle indicates the measurement region of expected shear failure. Figure 37: Shear test specimen illustrating applied load (downward arrow), reaction forces (upward arrows), and measurement region (yellow rectangle) [17] Concrete is stronger in compression than in tension. Therefore, the tendency of cracking development due to tension is faster than the crushing development due to compression. [8] Figure 38 shows the vertical shear cracks developed in specimen S3 during the test. 45
56 Figure 38: Vertical shear cracks developed in specimen S3 [17] Table 6 summarizes the ultimate loads and failure modes of SC beams obtained from experiment. Specimen S1 and S2 fail due to yielding of the tensile plate closely followed by buckling of the compression plate while the other specimens fail due to vertical shear failure of concrete. Table 6: Ultimate load and failure modes obtained from experiments [17] Specimens Ultimate load (kn) Failure modes S Yielding of the tensile plate closely followed by buckling of the compression plate S Yielding of the tensile plate closely followed by buckling of the compression plate S Vertical shear failure S Vertical shear failure S5 860 Vertical shear failure S Vertical shear failure 46

57 7 Validation of SC model In this section, FE results are validated against experimental results. Models of S1 S6 are the replications of SC beam specimens S1 S6 respectively. The results obtained from FE analysis are presented for each model. The results include failure modes, ultimate force, mid-point deflection, end slips, and strains. 7.1 Model S1 Figure 39: Failure mechanisms of model S1 (a) buckling (b) cracks in the outer face (mirror view) (c) bottom plate yielding (d) close-up view of buckling Model S1 are in good agreement with the failure modes of specimen S1 observed during experiment. The tension (bottom) steel plate starts to yield (marked by red circle in Figure 39(c)) at force 1460 kn and 33 mm mid-point deflection. Simultaneously, the flexural cracks expand and shear cracks start to develop. The plasticity in the tension steel plate rapidly 47
58 increases beyond the ultimate force 1639 kn (57 mm deflection of model S1). At force 1610 kn and 84 mm deflection of the model, the buckling occurs at compression (upper) steel plate. After the bucking, the force bearing capacity of the model is reduces. The failure mechanisms of the model and specimen are yielding of the tensile plate closely followed by buckling of the compression plate at the ultimate force. Force, kn 1800 S1: Deflections Force, kn 1800 S1: Force Comparison Yielding Buckling FEM Experiment FEM Deflection, mm Deflection, mm ( a ) ( b ) S1: End slips Force, kn 1800 Force, kn S1: Bottom plate strain Exp: Bottom end FEM: Bottom end Experiment Exp: Top end 600 FEM 400 FEM: Top end Slip, mm Strain, ( c ) ( d ) Figure 40: Results for model S1 (a) force versus displacement (b) comparison of force versus displacement (c) comparison of end slips (d) comparison of bottom plate strain 48
59 In Figure 40(a), the FE result of load versus deflection of model S1 is graphically represented. Force-displacement relationship is linear until force of 1500 kn and deflection 35 mm. Just before this force level (marked by blue dot in Figure 40(a)), yielding at the tension (bottom) steel plate occurs. The ultimate force of model S1 is 1639 kn at 57 mm deflection. Buckling at compression (top) plate occurs at 1610 kn with 84 mm deflection marked by green dot in this figure. Deflection of the model between yielding of the bottom plate and buckling at top plate is increased rapidly from 35 mm to 84 mm. While deflection of model S1 doubles, the magnitude of force is increased by around 100 kn (i.e. 9%) between these failure modes. The force-displacement plot obtained by model and experiment are compared in Figure 40(b). The experiment data contains loading, unloading and reloading phases, and therefore there are discontinuities in the beginning of the graph. Compared to experiment, the result of model S1 appears to be little stiff. Force-displacement relationship is linear until the bottom plate yielding in model as well as in experiment. The rapid growth of deflection is observed between the yielding of tension steel plate and buckling of compression steel plate in both methods. The graph also reveals that the force level after buckling of compression steel plate is dramatically decreased in experiment as well as in model. In experiment, the ultimate force is 1528 kn while in model 1639 kn which is around 7% higher than the value of experiment. Figure 40(c) compares slips between steel plate and concrete at the beam end. The bonding between bottom plate and concrete seems to be stronger in model than in experiment. While bonding between top plate and concrete seems to be just opposite. The maximum slip in the bottom end is 0.22 mm and in top end it is 0.06 mm in the model. In experiment, maximum bottom end slip is 0.3 mm and top end slip is 0.04 mm. Figure 40(d) illustrates strain in the bottom plate. Until 1400 kn, the tensile strain is linear. After that, strain grows rapidly until buckling of the compression steel plate in experiment as well as in model. There is 21 bottom strain in experiment and 27 bottom strain in model at the moment of buckling. 7.2 Model S2 The results obtained from FE analysis of model S2 are in agreement with the failure modes of specimen S2 observed during experiment. The tension (bottom) steel plate starts to yield at 49

60 force level 1460 kn with 33 mm deflection of the model (marked by red circle in Figure 41(c)). Instantaneously, the bending cracks expand and shear cracks start to develop in the model. The model carries ultimate force 1684 kn at 95 mm deflection of the mid-point. Beyond ultimate force, the top plate buckling occurs at force level 1520 kn and 106 mm midpoint deflection. After buckling, the load bearing capacity of the SC beam is deteriorated. The failure mechanisms of the model and specimen are yielding of the tensile plate closely followed by buckling of the compression plate at the ultimate force. Figure 41: Failure mechanisms of model S2 (a) buckling (b) cracks in the outer face (mirror view) (c) bottom plate yielding (d) close-up view of buckling 50
61 Force, kn 1800 S2: Deflections Force, kn 1800 S2: Force Comparison Yielding Buckling FEM Experiment FEM Deflection, mm Deflection, mm ( a ) ( b ) Force, kn 1800 S2: End slips Force, kn 1800 S2: Bottom plate strain Exp: Bottom end 600 FEM: Bottom end 400 Exp: Top end 200 FEM: Top end Slip, mm Experiment FEM Strain, ( c ) ( d ) Figure 42: Results for model S2 (a) force versus displacement (b) comparison of force versus displacement (c) comparison of end slips (d) comparison of bottom plate strain Figure 42(a) shows the force-displacement curve of model S2. Force-displacement relationship is linear until the force 1460 kn and deflection 33 mm. At this force level (marked by blue dot in Figure 42(a)), yielding at the tension (bottom) steel plate occurs. The ultimate force is 1684 kn at 95 mm deflection of the model. Buckling of compression (top) 51
62 steel plate occurs at force 1520 kn with 106 mm deflection illustrated in the Figure 42(a) by green dot. Also in this model, the deflection increases rapidly from 33 mm to 106 mm between failure modes i.e. yielding of the tension plate and buckling of the top plate. Although the magnitude of deflection increases more than three times between these failure modes, magnitude of force increases only about 200 kn (i.e. 14%). Figure 42(b) compares force-displacement relationship. Likewise specimen S1, plot of specimen S2 has discontinuities because of loading, unloading and reloading phases of the experiment data. Model S2 also seems to be stiffer than the specimen. The curve is linear until tensile plate yielding. Compared to model S1, the top plate buckling occurs quite late in model and also in the experiment. The graph reveals that the force level after buckling of the top plate decreases dramatically in experiment as well as in FE analysis. The ultimate force obtained from the FE analysis is almost equal to the ultimate force obtained from the experiment i.e kn in FE analysis and 1690 kn in experiment. The comparison of slips between steel plate and concrete at the beam end is shown in Figure 42(c). The connection of bottom end between steel plate and concrete seems to be stronger in model S2 than in the experiment. In contrast, more slip occurs at the top end in FE analysis than in experiment. The maximum slip of the model at the bottom end is 0.23 mm and at the top end is 0.06 mm. While in experiment, there is 0.29 mm slip at the bottom end and 0.04 mm slip at the top end. In Figure 42(d), force-bottom plate strain relationship is compared. Tensile strain growth is linear until 1460 kn. After that, the growth of the strain occurs rapidly until buckling of top steel plate in experiment as well as in FE analysis. There is more than 16 bottom plate strain in experiment and about 15 bottom plate strain in FE analysis when the top plate buckles. 7.3 Model S3 The failure modes of model S3 obtained from FE analysis are shown in Figure 43. The model fails due to vertical shear failure which also occurred in specimen S3 during the experiment. Flexural cracks (in Figure 43(b)) are developed in the beginning of FE analysis in the model and they are expanded into shear cracks after the force 1265 kn and 11 mm deflection of the 52
63 model. Vertical shear cracks generated in the mid-face and in the outer face in the model are illustrated in the Figure 43(a) and (d) respectively. The tie bar (second from the loading point and marked in red rectangle in the Figure 43(c)) starts to yield at the ultimate force level 2039 kn and 34 mm beam deflection. After that, the force bearing capacity of the model is weakened. The model and specimen fail due to vertical failure. The failure mechanisms are vertical shear cracks followed by yielding of tie bar. The patterns of vertical shear cracks in FE analysis and those in experiment are similar. Figure 43: Failure mechanisms of model S3 (a) shear cracks (b) initiation of bending cracks (c) tie bar yielding at the ultimate force (d) shear cracks at the ultimate load in outer face (mirror view) 53
64 Force, kn S3: Deflections Shear cracking 800 Ultimate Load 600 FEM Deflection, mm Force, kn S3: Force Comparison Experiment 600 FEM Deflection, mm ( a ) ( b ) Force, kn S3: End slips Exp: Bottom end 1000 FEM: Bottom end 800 Exp: Top end 600 FEM: Top end Slip, mm Force, kn S3: Shear bar strain Experiment 800 FEM Strain, ( c ) ( d ) Figure 44: Results for model S3 (a) force versus displacement (b) comparison of force versus displacement (c) comparison of end slips (d) comparison of shear bar strain In Figure 44, the results for model S3 are compared with those for specimen for S3. Figure 44(a) shows the force-displacement relationship of the model. Initiation of shear cracks occurs in the model at force 1265 kn with 11 mm deflection of the beam indicated by a blue dot. The ultimate force 2039 kn of model S3 is marked by green dot in Figure 44(a). The 54
65 comparison of force versus displacement curve between experiment and model is illustrated in Figure 44(b). The graphs are quite linear until force around 1200 kn and 10 mm beam deflection. After that, deflection of the beam grows rapidly and reaches 34 mm in model and 41 mm in experiment at the ultimate force. Model S3 also seems stiffer (Figure 44(b)) than the specimen. The ultimate force of model S3 is 2039 kn which is about 6% higher than the ultimate force obtained experimentally. Figure 44(c) shows comparison of end slips between steel plate and concrete. Slips remain negligible (less than 0.1 mm) up to the force 1400 kn. After that, the slip at the bottom end is increases significantly in model S3. At the ultimate force, the bottom end slip is 0.8 mm in model and 1.38 mm in experiment. Similarly at the top end, the end slip is 0.03 mm in model and 0.01 mm in experiment at the ultimate force. The results verify that the magnitudes of end slips obtained from FE analysis are comparable with the slips recorded during the experiment. The comparison of strain in tie bar is shown in Figure 44(d). Strain increases linearly until force level 1400 kn and then, it becomes non-linear. At the ultimate force, the tie bar strain of the model is 12 while 13 in the specimen during experiment. The growth patterns of tie bar strain are quite similar. 7.4 Model S4 Figure 45 illustrates failure modes of model S4. Flexural crack initiation is due to normal stress in the model. After force 1000 kn, the flexural cracks expand and transform into shear cracks shown in Figure 45(b). The shear cracks in the mid-face and in the outer face, illustrated in Figure 45(a) and (d) respectively, occur at the ultimate force 1785 kn. At the ultimate force, the tie bar (first from the loading point) marked by red rectangle in Figure 45(c) yields and the load bearing capacity of the model is deteriorated rapidly. Model S4 fails due to vertical shear cracks followed by yielding of shear reinforcements. Vertical failure is the failure mode for model and specimen. The failure mechanisms are vertical shear cracks followed by yielding of tie bar. Cracks in the model are similar with specimen S4 observed in experiment. 55
66 Figure 45: Failure mechanisms of model S4 (a) shear cracks (b) initiation of bending cracks (c) tie bar yielding at the ultimate force (d) shear cracks at the ultimate load in outer face (mirror view) The results of model S4 and specimen S4 are compared in Figure 46. The force level at which shear cracks start to develop (i.e kn) and ultimate force (i.e kn) are marked by blue and green dots respectively in Figure 46(a). The force-displacement relationship is linear up to 1000 kn with less than 10 mm deflection of the model. After that, the deflection of model S4 increases rapidly and reaches 35 mm at the ultimate force. Experiment data of specimen S4 contains loading, unloading and reloading phases and, therefore there are discontinuities at the beginning of the curve shown Figure 46(b). Model S4 seems to be stiffer than specimen S4. The ultimate force is 1785 kn at 35 mm deflection for model S4 which is 3% higher than the ultimate force for specimen S4. 56
67 Force, kn 1800 S4: Deflections Force, kn 1800 S4: Force comparison Shear cracking Ultimate Load FEM Experiment FEM Deflection, mm Deflection, mm ( a ) ( b ) Force, kn S4: End slips Exp: Bottom end FEM: Bottom end Exp: Top end FEM: Top end Slip, mm Force, kn S4: Shear bar strain Experiment 600 FEM Strain, ( c ) ( d ) Figure 46: Results for model S4 (a) force versus displacement (b) comparison of force versus displacement (c) comparison of end slips (d) comparison of shear bar strain Comparison of slips between steel plate and concrete at the end are illustrated in Figure 46(c). In bottom, the end slip is 2.1 mm in model S4 and 0.85 mm in specimen S4. In top, the end slip is 0.04 mm in the model and 0.01 mm in the specimen. Shear bar strains of the model and specimen are compared in Figure 46(d). At the ultimate force 1785 kn, the maximum strain at 57

68 shear bar in the model is 6 and 4.5 in the specimen. The growth patterns of tie bar strain are quite similar. 7.5 Model S5 The failures mechanisms of model S5 are illustrated in Figure 47. The model fails due to shear cracking followed by yielding of shear bars which also occurred in specimen S5 during experiment. Flexural cracks (illustrated in Figure 47(b)) initiate the failure in the model and specimen. At force 890 kn and 11 mm beam deflection, flexural cracks transform into shear cracks. Vertical shear cracks occurred in the mid-face and in the outer face are illustrated in Figure 47(a) and (d), respectively. The shear bar (first from the loading point) marked by red rectangle in Figure 47(c) yields at the ultimate force 1475 kn. After that, load bearing capacity of the model is declined significantly deteriorated. The failure mechanisms of the model and specimen are vertical shear cracks followed by yielding of shear bar. Figure 47: Failure mechanisms of model S5 (a) shear cracks (b) initiation of bending cracks (c) tie bar yielding at the ultimate force (d) shear cracks at the ultimate load in outer face (mirror view) 58
69 Force, kn 1600 S5: Deflections Force, kn 1600 S5: Force comparison Shear cracking Ultimate Load FEM Experiment FEM Deflection, mm Deflection, mm ( a ) ( b ) Force, kn 1600 S5: End slips Force, kn 1600 S5: Shear bar strain Exp: Bottom end FEM: Bottom end Exp: Top end FEM: Top end Experiment FEM Slip, mm Strain, ( c ) ( d ) Figure 48: Results for model S5 (a) force versus displacement (b) comparison of force versus displacement (c) comparison of end slips (d) comparison of shear bar strain The results for model S5 and specimen S5 are compared in Figure 48. Figure 48(a) illustrates the force-displacement relationship of the model. The mid-span deflection increases linearly until force level 890 kn and 9 mm deflection of the beam. After that, deflection of the beam 59
70 increases rapidly and model S5 deflects 29 mm at ultimate force of 1475 kn. Shear cracks initiation load and the ultimate load are marked with blue and green dots in Figure 48(a). The force-displacement of the model and specimen are compared in Figure 48(b). This model seems to be much stiffer than the specimen. The reasons behind the stiffness of the model are not recognized yet. The ultimate force for the model is more than 70% higher than the ultimate force for specimen S5. The comparison of result for the end slip between steel plate and concrete in Figure 48(c) shows that the end slips at bottom in FE analysis is too large for the model. At the ultimate force, the bottom end slip is 3.0 mm in the model S5 but only 0.05 mm in the specimen. Similarly in the top end, the end slip is 0.04 mm in the model and 0.01 mm in the specimen. Figure 48(d) compares shear bar strain for the model and specimen. The strain in the shear bar is linearly increasing until the force level 600 kn. At the ultimate force, the strain at the shear bar in model S5 is 8 while the strain at the shear bar in specimen is Model S6 The failure mechanisms of model S6 are shown in Figure 49. In the model, failure initiates from flexural cracks. When load level reaches 869 kn with 9.5 mm mid-span deflection, the flexural cracks (illustrated in Figure 49(b)) start to change into shear cracks. The model deflects 28 mm at the ultimate force 1575 kn. Figure 49(a) and (d) illustrate shear cracks developed in the mid-face and in the outer face, respectively. Although model S6 is designed to study both vertical and horizontal shear cracks, it fails by vertical cracking followed by yielding in tie bars (first from the loading point and marked with a red rectangle in Figure 49(c)). The failure mechanisms of the model and specimen are vertical shear cracks followed by yielding of shear bar. The vertical shear crack patterns obtained from FE analysis and experiment are similar. 60
71 Figure 49: Failure mechanisms of model S6 (a) shear cracks (b) initiation of bending cracks (c) tie bar yielding at the ultimate force (d) shear cracks at the ultimate load in outer face (mirror view) The results of model S6 and specimen S6 are compared in Figure 50. Force-displacement relationship of the model is illustrated in Figure 50(a). Blue and green dots represent the load levels where shear cracks start to develop and the ultimate force, respectively. The forcedisplacement relationship is linear until the load level 600 kn with 6 mm deflection of the model. After that, deflection increases rapidly and has the value 28 mm at the ultimate force. Force-displacement relationship of the model and specimen S6 are similar. Also here, experimental data contains the loading, unloading and reloading phases and there are discontinuities in the displacement-load relationship in Figure 50(b). Model S6 seems to be somewhat stiffer than the specimen. The ultimate force for model S6 is 1575 kn which is 18% higher than the ultimate force for specimen S6. 61
72 Force, kn 1600 S6: Deflections Force, kn 1600 S6: Force comparison Shear cracking Ultimate Load FEM Experiment FEM Deflection, mm Deflection, mm ( a ) ( b ) Force, kn 1600 S6: End slips Force, kn 1600 S6: Shear bar strain Exp: Bottom end 600 FEM: Bottom end Exp: Top end 400 FEM: Top end Slip, mm Experiment FEM Strain, ( c ) ( d ) Figure 50: Results for model S6 (a) force versus displacement (b) comparison of force versus displacement (c) comparison of end slips (d) comparison of shear bar strain Figure 50(c) compares the end slips between steel plate and concrete at the beam end. Slips remain negligible (less than 0.1 mm) up to the force level 1000 kn in model S6. After that, the slip increases significantly at the bottom end. At the ultimate force, the bottom end slip is 2.3 mm in the model and 0.15 mm in the specimen. Similarly in the top end, the end slip is 62
73 Specimen 0.02 mm in the model and 0.01 mm in the speceimen. Figure 50(d) compares the strain in the shear bar. Strain grows linearly until force level reaches 1200 kn. At the ultimate load, the strain at tie bar is 4 in model S6 and 5 in the specimen. 7.7 Summary of the results Table 7 summarizes the results (load bearing capacity and failure modes) for SC beams obtained from finite element analysis and experiment. All models fail due to similar failure modes observed in experiment. Model S1 and S2 failed due to yielding of tension (bottom) steel plate followed by buckling in compression (top) steel plate. Model S3, S4, S5 and S6 failed due to vertical shear cracks followed by yielding of shear reinforcements. All models seem to be stiffer than the specimen. In summary, models S1-S4 reproduce the outcomes (failure modes, ultimate load, end slips, and plates or tie bar strain) of the experiments within reasonable accuracy. Although failure modes of model S5 and S6 correspond to experiment results, the load bearing capacities are not predicted correctly. Table 7: Comparison of load bearing capacity and failure modes Experiment Model Difference Ultimate Ultimate Experiment vs. Force (kn) Force (kn) Model (%) Failure Modes S S S S S S Flexural failure -1 Flexural failure 6 Vertical shear failure 3 Vertical shear failure 71 Vertical shear failure 18 Vertical shear failure The ultimate force of model (model S1- S4) is fairly equal. The error of the ultimate force between the model and experiments is ranging from -1% to 7%. Specimen S5 has maximum varying results i.e. FEM has more than 71% higher ultimate force than experiment. Model S5 63
74 failed due to vertical shear cracks followed by yielding of tie bars despite the huge error in load bearing capacity. The reasons behind for this are not identified yet. The ultimate force of model S6 is 18% higher than load bearing capacity obtained experimentally. The results verified that model can predict failure mechanisms and load bearing capacity of SC beam, except for severely unreinforced specimen. 64
75 8 Effects of parameters A parametric study with some values of the geometric and material parameters was performed to get a picture about the most important parameters affecting failure mechanisms of a SC beam. The load bearing capacity in flexural failure is directly influenced by parameters of steel. Therefore, the most important parameters for this mode include steel plate thickness, stud arrangement, height of SC beam, and material parameters of the steel plates. Shear reinforcement spacing and tie bar diameter are the most important parameters in shear failure. Shear failure is also influenced by material parameters of tie bar and the height of SC beam. The parameters considered in this study are given in Table 8 and their effects on failure modes of SC beams are described in the following subheadings. Table 8: Parameters considered for the analysis Parameter Values Height of beam (in mm) 500, 800, and 1200 [mm] Steel plate thickness 10, 12, and 15 [mm] Stud diameter (in mm) 16 and 19 [mm] Stud length (in mm) 50, 100, and 125 [mm] Shear connectors Stud and Tie bar, Only Tie bar Plate material Carbon-steel, Stainless steel Tie bar material Carbon-steel, Gr 8.8 steel 8.1 Effect of plate material on failure in 4-point bending This is interpreted based on the results obtained from model S1 and S2. Compression plate of model S1 is made from structural steel S355 while compression plate in model S2 is made of stainless steel. Both models have same failure modes with a only difference of magnitude of ultimate load and mid-point deflection. Yielding of tension (bottom) steel plate occurred first and was followed by buckling of compression (top) steel plate. Buckling of the steel plate occurred at 1639 kn load with 84 mm mid-point deflection of the model 1 while compression plate of the model 2 buckled at 1684 kn load and 106 mm mid-point deflection of beam. The results indicate that there are not any significant effects of material parameters of steel plate 65

76 on failure modes of SC beams. This may mean that the arrangement and mechanical properties of shear connectors overshadow the material properties of steel plate. 8.2 Effect of beam height on failure in 4-point bending The effect of beam height in 4-point bending is studied with varying steel plate thickness, height of SC beam, and stud arrangement. The thickness of compression (top) steel plate is 12 mm and the tensile (bottom) steel plate is 12 mm. 500 mm, 800 mm, and 1200 mm beam height are taken into account for analysis purpose. Studs are placed in every 200 mm distance in longitudinal direction in top and bottom surfaces and the other geometric and material parameters are same as in model S1. Figure 51: Plastic strain in steel frame of specimen (a) height 500 mm (b) height 800 mm (c) height 1200 mm The results with different beam heights are illustrated in Figure 51(a), (b), and (c). All three specimens failed due to yielding of tension (bottom) steel plate. There is maximum 1.3% plastic strain at the ultimate force 918 kn for model with height of 500 mm, maximum 2.1% plastic strain at the ultimate force 1526 kn for model with height of 800 mm, and maximum 66
 that there is a linear dependence of load bearing capacity and yielding of tension steel plate with respect to beam height. 8.")
77 2.5% plastic strain at the ultimate force 2348 kn for model with height of 1200 mm. It is concluded (based on these models and model S1) that there is a linear dependence of load bearing capacity and yielding of tension steel plate with respect to beam height. 8.3 Effect of stud length on failure in 4-point bending Stud length is also playing a role in failure of SC beam. To analyse the effects of stud length on failure modes in bending, SC beam model was used with decreasing the stud length from 125 mm to 50 mm. Other geometric and material parameters were being the same as with model S1. Figure 52: Effect of stud length on failure mechanisms The effects of stud length on failure modes in bending are illustrated in Figure 52. The FE analysis shows that there is a significant increase of end slip in decrease of stud length. The most vulnerable slippage zone is marked by red rectangle in Figure 52(a) and magnified views are shown in Figure 52(b), (c), and (d). At the ultimate force 1748 kn, there is 2 mm bottom end slip between concrete and steel plate in this model while model S1 has less than 0.3 mm bottom end slip. 67

78 8.4 Effect of studs on failure in 3-point bending To study the effect of studs on failure in three point bending, studs were omitted (stud length zero) and all the parameters were being the same as in model S3. The results obtained from FE analysis of the model is shown in Figure 53. The flexural cracks are initially developed in the model. As the growth of flexural cracks continues, there is also significant increase in end slip between concrete and steel plates. At the ultimate force 885 kn, the model fails due to combined effects of flexural cracks and end slips. Figure 53: Failure mechanisms without stud The flexural cracking zone is marked by yellow rectangle and most affected slippage zone is marked by red rectangle in Figure 53(a). At the ultimate force, the maximal damage of concrete due to tension is 95%. Slip between tie bar and concrete as well as the end slip between concrete and steel plate are illustrated in Figure 53(b) and (c), respectively. The slip between concrete and the bottom steel plate is 13 mm at the ultimate force. 68

79 8.5 Effect of tie-stud arrangement on failure in 3-point bending To study the effects of tie-stud arrangement in 3-point bending, spacing of tie bars along longitudinal direction, stud diameter, and stud length were varied geometric parameters of SC beam. The remaining geometric and material parameters were same as in model S3. Tie bars were placed in 400 mm distance along the longitudinal direction in contrast to the 600 mm distance in model S3. Therefore, studs remain in 200 mm interval and there is only one stud between the tie bars in the longitudinal direction. In the first specimen, the diameter of stud is 19 mm and length is 125 mm. Results for this model are illustrated in Figure 54. Tensile concrete cracks are shown in Figure 54(a) and yielded tie bar marked by red rectangle is shown in Figure 54(b). At the ultimate load 1978 kn, the model fails due to shear cracking of concrete and yielding of tie bars. There is 0.35 mm of end slip between concrete and bottom steel plate (Figure 54(c)) at the ultimate force. Figure 54: Failure mechanisms (stud diameter 19 mm and length 125 mm) The second specimen has 16 mm stud s diameter and 100 mm stud s length. The results for this model are illustrated in Figure 55. Concrete tensile cracks, yielded tie bar marked by red rectangle, and end slip between concrete and bottom steel plate marked by dashed orange line 69

 Figure 56: Failure")
80 are shown in Figure 55(a), (b), and (c), respectively. The model failed at the ultimate force 1784 kn by combined vertical shear cracks and yielding of tie bars. At the ultimate force, end slip between concrete and the bottom steel plate is 3.5 mm. Figure 55: Failure mechanisms (stud diameter 16 mm and length 100 mm) Figure 56: Failure mechanisms (stud diameter 16 mm and length 50 mm) 70
81 The third specimen to study effects of stud has 16 mm stud diameter and 50 mm stud length. The failure modes of this model are illustrated in Figure 56. At the ultimate force 1788 kn, the failure mechanisms are vertical shear cracks in the concrete, yielding of tie bars, and end slip between concrete and the bottom steel plate. Yielded tie bar is shown in Figure 56(b) by red rectangle and the end slip of the beam is shown in Figure 56(c) by dashed orange line. There is a 4 mm end slip between concrete and the bottom plate at the ultimate load. The specimens illustrated in figure fails at the ultimate force due to shear cracking of concrete followed by yielding of tie bars. Narrowly spaced tie bars neither significantly affects the failure modes nor the magnitude of the ultimate force of shear specimens. The stud diameter and length significantly influence end slip between concrete and the bottom steel plate. With decreasing diameter and length of stud, there is a significant increase in the end slip. Based on the results, it is concluded that the geometric parameters of studs directly influence the failure modes of SC beams such as shear crack on concrete, yielding of shear reinforcements, and slip between concrete and steel plate at the beam end. 8.6 Effect of beam height on failure in 3-point bending The beam height of SC beams is varied from 500 mm to 1200 mm. The diameter of tie bars is 20 mm. In this SC model, there are two kinds of stud parameters (19 mm diameter and 125 mm length or 16 mm diameter and 50 mm length). The remaining geometric and material parameters are same as the parameters of model S3. The first specimen has beam height 1200 mm, stud diameter of 19 mm and stud length of 125 mm. The results are shown in Figure 57. Flexural cracks initiating the failure gradually expand into shear cracks. The model fails at the ultimate force 2550 kn because of shear cracking in concrete followed by yielding of tie bar. Vertical shear cracks and yielded tie bar (marked by red rectangle) at the ultimate force are illustrated in Figure 57(a) and (b) respectively. End slip between concrete and the bottom steel plate is 0.6 mm which is shown in Figure 57(c). 71
 The second specimen also")

82 Figure 57: Failure mechanisms (beam height 1200 mm, long stud) Figure 58: Failure mechanisms (beam height 1200 mm, short stud) The second specimen also has beam height 1200 mm while stud diameter is 16 mm and stud length is 50 mm. Failure modes are shown in Figure 58. Failure is due to the combined effects 72
 at the ultimate force 2279 kn are illustrated in Figure 58(a) and (b) respectively.")
83 of shear cracks, yielding of tie bars, and end slip between concrete and the bottom plate. Shear cracks and yielded tie bar (marked by red rectangle) at the ultimate force 2279 kn are illustrated in Figure 58(a) and (b) respectively. The end slips between concrete and the bottom steel plate (illustrated in Figure 58(c)) is 0.5 mm at the ultimate force. The third specimen is 500 mm high. Stud diameter is 19 mm and length is 125 mm. The results are shown in Figure 59. Failure mechanisms at the ultimate force 1191 kn are similar with the previous models described in this section. Failure at the ultimate force is due to shear cracks in concrete and yielding of tie bars. Vertical shear cracks and yielded tie bar (marked by red rectangle) at the ultimate force are illustrated in Figure 59(a) and (b) respectively. The end slip between concrete and the bottom steel plate (illustrated in Figure 59(c)) is 1.5 mm at the ultimate force. Figure 59: Failure mechanisms (beam height 500 mm, long stud) Failure modes are similar, although the beam height of SC beams is varied from 500 mm to 1200 mm. It seems that SC beams fail because of shear cracks in concrete and tie bar yielding irrespective of beam height in three point bending. 73
84 8.7 Effect of tie bar on failure in 3-point bending The effects of tie bar parameters on failure in three point bending was assessed by comparing the results for model S3, model S4 and parametric studies of shear specimens. In specimen S3, shear bars were made from S355 steel and welded to the inner surfaces of steel plates and embedded in concrete. In Specimen S4, threaded Gr 8.8 steel bars were fastened between steel plates and embedded in concrete. Although the magnitudes of ultimate force are different between these two specimens, failure mechanisms in both cases are same. It seems that the failure mechanisms are identical with different material parameters of tie bars although the magnitudes of ultimate force may be different. 74
85 9 Conclusions In this thesis, SC beam model was formulated and implemented in Abaqus/Explicit, FE results were validated against experiment results and the effects of geometric and material parameters on failure modes were studied. Commercial FE software Abaqus/Explicit was used to analyse the failure modes of SC beams. To reduce computational works, mirror symmetric technique was applied to create a quarter and a half model of the original size of the beam. The modelling cost and time in this research was reduced significantly by using Plug-In. According to simulation and experiment results, the most common failure modes of SC elements were flexural failure, shear failure, and de-bonding between concrete and steel plate. Material models played a crucial role in achieving convincing results. Structural steel S355, steel S235-J2G3+C450, and grade 8.8 steel were modelled according to isotropic elastoplastic with strain hardening approach. Ramberg-Osgood model with Hill s modification described the material properties of stainless steel. The non-linear behaviour of concrete was analysed according to damage plasticity approach. Behaviour of concrete is significantly different in tensile and compression regimes. Therefore, the material property of concrete in compression was modelled according to EN : Eurocode 2 clause 3.1.4, and in tension according to fracture energy cracking criterion. A quasi-static method was used in the FE analysis. Load was applied by displacement control method. General contact interactions between surfaces were created in the FE analysis. Surfaces of part instances in the model were connected together by tie constraints. Supports were created in the Initial step with specific degree of freedoms (rotation was restrained in the y and z direction and the translation in z direction) while load was created in the Applied load step. The models were validated against experiment results by considering somewhat different geometries and loading conditions. The results by models and experiment were similar. Specimen S1 and S2 failed due to yielding of tensile (bottom) steel plate followed by buckling of compression (top) steel plate. The remaining specimen S3-S6 failed due to shear cracking in concrete followed by yielding of shear bars. With specimen S1 and S2, the 75
86 ultimate force for the model and experiment agreed fairly well. The difference is ranging from -1% to 7%. The ultimate force predicted by the model was 6% and 3% higher than the experiment one in specimen S3 and S4, respectively. The ultimate force predicted by the model was more than 70% higher than that of the experiment in specimen S5. The ultimate force predicted by the model was more than 18% higher than experiment in specimen S6. The exact reasons behind the significant difference in the ultimate force have not been identified yet. The predicted end slips at the top of all models were higher than in experiments. Predicted end slips at the bottom in model S1, S2, and S3 were lower and those of S4, S5, and S6 were higher than given by experiment. Although magnitude of strain (both steel plate and tie bar) was higher in model than in the experiment, strain curves were similar. The results in model and experiments are in good agreement in both failure mechanisms and magnitudes of outcomes except severely unreinforced cases of 3-point bending. Parametric study indicates that thickness of the tensile steel plate and stud geometry have effect on the failure mechanisms in 4-point bending. Shear specimens were affected by stud geometry and stud position. With equal thickness of the tensile and compression steel plates, yielding of tensile steel plate was the failure mechanism in 4-point bending. Furthermore, stud geometric parameters significantly influenced the end slip between concrete and steel plate. In the range of parametric study, failure modes were neither affected by material parameters of steel plate in 4-point bending nor by material parameters of tie bar in 3-point bending. However, the ultimate force was affected. 76
87 9.1 Recommendations for future studies After the completion of the thesis work, there are still issues remained for the future works. The foremost issue is the improvement of model. The material model of shear reinforcement could be improved to obtain better results for specimens in shear. Mesh size and proper meshing technique can also improve the results of FE analysis. The model seemed stiffer and the ultimate force is higher compared to the experiments. These errors can be reduced by developing improved contact models for the surfaces of SC beams. Although CDP model is the best approach to replicate the behaviour of concrete, it can also only provide general capability of analysis. There were limited cases of SC configurations in the parametric study. The effects of geometric and material parameters on failure mechanisms of SC beams could be studied in wider ranges. In addition to geometric and material parameters, the effects of axial loading on specimen in bending could be studied. Parametric study of specimen in a 3-point bending with sparsely distributed shear reinforcements is limited due to large error of the ultimate force of specimen S5 between experiment and model. Therefore, parametric study of this kind of SC configuration would also be essential to recognize failure modes in the 3-point bending. 77
88 10 References [1] Kim, C. H. Lee, H. W. Lee, J. B. and Noh, S. H. (2007) A study of fabrications of Steel Plate Concrete (SC) modular systems for nuclear power plants. Korean Nuclear Society. [2] Nelson Stud Welding, Inc. (2011), Shear Connector/ Concrete anchor Catalogue [3] Oduyemi, T. O. S. and Wright, H. D. (1989) An experimental investigation into the behaviour of double-skin sandwich beams. Journal of Constructional Steel Research, vol. 14, no. 3, pp [4] Fülöp, L. A. Guyot, N. and Petite, J. (2014) Analytical design of the ambient temperature SC element tests. VTT Technical Research Centre of Finland, Espoo, Technical Report RFSR CT [5] IAEA (2004) Construction and commissioning experience of evolutionary water cooled nuclear power plants International atomic energy agency, Austria [6] Marshall, P.W. Palmer, A.C. Liew, J.Y.R. Wang, T.Y. and Thein, M.K.W. (2010) Bond Enhancement for Sandwich Shell Ice Wall. International Conference and Exhibition on Performance of Ships and Structures in Ice, September, Alaska, USA. [7] Kaneuji, A. Okuda, Y. Hara, K. and Masumoto, H. (1989) Feasibility study of concrete filled steel (SC) structure for reactor building. International conference on Structural Mechanics in Reactor Technology (SMiRT). [8] Nawy, E.G. (2009) Reinforced Concrete: A Fundamental Approach (6 th Edition). Upper Saddle River, N.J.: Pearson Prentice Hall [9] Solomon, S.K., Smith, D.W., and Cusens, A.R. (1976) Flexural tests of steel-concretesteel sandwiches. Magazine of Concrete Research; 28(94): [10] Burgan, B. A. and Naji, F. J. (1998) Steel-concrete-steel Sandwich Construction. Journal of Constructional Steel Research, vol. 46, no. l-3: [11] Pryer, J.W. and Bowerman, H.G. (1998) The development and use of British steel Bi- Steel. Journal of Constructional Steel Research; 46(1-3):15. [12] Liew, J.Y. Wang, T.Y. and Sohel, K.M.A. (2008) Separation Prevention Shear Connectors for Sandwich Composite Structures. US Provisional Patent Application No. 61/047, 130. [13] Shukry, M.E.S. (1986) Composite shells subjected to expternal pressure and to point loads. University of Manchester, UK. PhD thesis. 78
89 [14] Kumar, G. (2000) Double skin composite construction. National University of Singapore, Singapore, Master thesis. [15] Sohel, K.M.A. (2008) Impact behaviour of Steel-Composite sandwich beams. National University of Singapore, Singapore, PhD. thesis. [16] Donnadieu, M. and Fülöp, L. A. (2015) Non-Linear Finite Element Modelling of Steel Concrete-Steel Members in Bending and Shear. Nordic Steel Construction Conference 2015, Tampere, Finland. [17] Koukkari, H. and Fülöp, L. A. (2015) Material properties, loading and the measured responses for the ambient temperature tests. VTT Technical Research Centre of Finland, Espoo, Technical Report. [18] EN :2004 Eurocode 2: Design of concrete structures - Part 1-1:General rules and rules for buildings [19] Sohel, K.M.A. Liew, J.Y. and Zhang, M.H. (2011) Analysis and design of steelconcrete composite sandwich systems subjected to extreme loads Frontiers of Architecture and Civil Enginering in China [20] EN :2005 Eurocode 3: Design of steel structures - Part 1-1: General rules and rules for buildings [21] Varma, A. H. Sener, K. C. Zhang, K. Coogler, K. and Malushte, S. R.( 2011) Out-of plane shear behaviour of SC composite structures International conference on Structural Mechanics in Reactor Technology (SMiRT). [22] Xie, M. Foundoukos, N. and Chapman, J.C. (2007) Static tests on Steel Concrete Steel sandwich beams. Journal of Constructional steel research; 63(6): [23] Wright, H.D. and Oduyemi, T.O.S. (1991) Partial interaction analysis of double skin composite beams. Journal of Constructional Steel Research, Vol.19, pages [24] Hearn, E.J. (1997) Mechanics of Materials, Volume 1 - An Introduction to the Mechanics of Elastic and Plastic Deformation of Solids and Structural Materials (3 rd Edition). Oxford: Butterworth Heinemann. [25] Hibbeler, R.C. (2013) Mechanics of Materials (9 th Edition). London: Prentice Hall International. [26] EN :2004 Eurocode 4: Design of composite steel and concrete structures-part 1-1: General rules and rules for buildings [27] ACI-ASCE COMMITTEE 326 (1962) Shear and diagonal tension. Journal of the American Concrete Institute; 59(1):1-30, 59(2): , 59(3):
90 [28] Teng, J.G. and Chen, J.F. (2007) Debonding failures of RC beams strengthened with externally bonded FRP reinforcement: behaviour and modelling Asia-Pacific Conference on FRP in Structures (APFIS 2007) [29] Dassault Systèmes (2013) Abaqus Theory Manual, version 6.13 [30] Hradil, P. Talja, A. Real, E. and Mirambell, E. (2014) Structural Application of Ferritic Stainless Steel: Structural performance of steel members. VTT Technical Research Centre of Finland, Espoo, Technical Report [31] Rodríguez, J. Martínez, F. and Martí, J. (2013) Concrete Constitutive Model, Calibration and Applications SIMULIA Community Conference [32] Jankowiak, T. and Lodygowski, T. (2005) Identification of parameters of concrete damage plasticity constitutive model. Foundation of civil and environmental engineering. No.6, pp [33] Kmiecik, P. Kaminski, M. (2011) Modelling of reinforced concrete structures and composite structures with concrete strength degradation taken into consideration Archives of civil and mechanical engineering, Vol. XI No. 3 [34] Wang, T. and Hsu, T.T.C. (2001) Nonlinear finite element analysis of concrete structures using new constitutive models. Computers and Structures, vol. 79. [35] International Federation for Structural Concrete. (2013) FIB Model Code for Concrete Structures 2010, Berlin: Wilhelm Ernst & Sohn. 80
91 Appendixes Appendix I: Drawing of SC beam Specimen S1 81
92 Specimen S2 82
93 Specimen S3 83
94 Specimen S4 84
95 Specimen S5 85
96 Specimen S6 86

97 Appendix II: Strength and deformation characteristics for concrete 87

98 Appendix III: NELSON stud catalogue 88
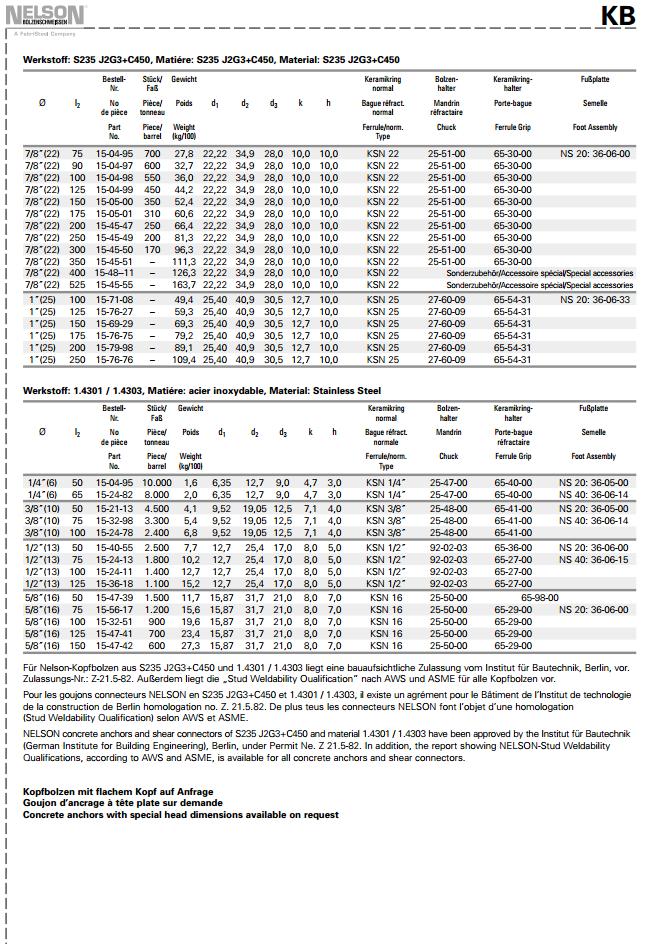
99 89
NUMERICAL SIMULATIONS OF CORNERS IN RC FRAMES USING STRUT-AND-TIE METHOD AND CDP MODEL
 Numerical simulations of corners in RC frames using Strut-and-Tie Method and CDP model XIII International Conference on Computational Plasticity. Fundamentals and Applications COMPLAS XIII E. Oñate, D.R.J.
Influence of residual stresses in the structural behavior of. tubular columns and arches. Nuno Rocha Cima Gomes
 October 2014 Influence of residual stresses in the structural behavior of Abstract tubular columns and arches Nuno Rocha Cima Gomes Instituto Superior Técnico, Universidade de Lisboa, Portugal Contact:
University of Sheffield The development of finite elements for 3D structural analysis in fire
 The development of finite elements for 3D structural analysis in fire Chaoming Yu, I. W. Burgess, Z. Huang, R. J. Plank Department of Civil and Structural Engineering StiFF 05/09/2006 3D composite structures
CHAPTER 6: ULTIMATE LIMIT STATE
 CHAPTER 6: ULTIMATE LIMIT STATE 6.1 GENERAL It shall be in accordance with JSCE Standard Specification (Design), 6.1. The collapse mechanism in statically indeterminate structures shall not be considered.
Dynamic Analysis of a Reinforced Concrete Structure Using Plasticity and Interface Damage Models
 Dynamic Analysis of a Reinforced Concrete Structure Using Plasticity and Interface Damage Models I. Rhee, K.J. Willam, B.P. Shing, University of Colorado at Boulder ABSTRACT: This paper examines the global
NORMAL STRESS. The simplest form of stress is normal stress/direct stress, which is the stress perpendicular to the surface on which it acts.
 NORMAL STRESS The simplest form of stress is normal stress/direct stress, which is the stress perpendicular to the surface on which it acts. σ = force/area = P/A where σ = the normal stress P = the centric
Discrete Element Modelling of a Reinforced Concrete Structure
 Discrete Element Modelling of a Reinforced Concrete Structure S. Hentz, L. Daudeville, F.-V. Donzé Laboratoire Sols, Solides, Structures, Domaine Universitaire, BP 38041 Grenoble Cedex 9 France sebastian.hentz@inpg.fr
3D Finite Element analysis of stud anchors with large head and embedment depth
 3D Finite Element analysis of stud anchors with large head and embedment depth G. Periškić, J. Ožbolt & R. Eligehausen Institute for Construction Materials, University of Stuttgart, Stuttgart, Germany
THE BEHAVIOUR OF REINFORCED CONCRETE AS DEPICTED IN FINITE ELEMENT ANALYSIS.
 THE BEHAVIOUR OF REINFORCED CONCRETE AS DEPICTED IN FINITE ELEMENT ANALYSIS. THE CASE OF A TERRACE UNIT. John N Karadelis 1. INTRODUCTION. Aim to replicate the behaviour of reinforced concrete in a multi-scale
FINITE ELEMENT ANALYSIS OF TAPERED COMPOSITE PLATE GIRDER WITH A NON-LINEAR VARYING WEB DEPTH
 Journal of Engineering Science and Technology Vol. 12, No. 11 (2017) 2839-2854 School of Engineering, Taylor s University FINITE ELEMENT ANALYSIS OF TAPERED COMPOSITE PLATE GIRDER WITH A NON-LINEAR VARYING
5 ADVANCED FRACTURE MODELS
 Essentially, all models are wrong, but some are useful George E.P. Box, (Box and Draper, 1987) 5 ADVANCED FRACTURE MODELS In the previous chapter it was shown that the MOR parameter cannot be relied upon
Flexure: Behavior and Nominal Strength of Beam Sections
 4 5000 4000 (increased d ) (increased f (increased A s or f y ) c or b) Flexure: Behavior and Nominal Strength of Beam Sections Moment (kip-in.) 3000 2000 1000 0 0 (basic) (A s 0.5A s ) 0.0005 0.001 0.0015
Civil Engineering Design (1) Design of Reinforced Concrete Columns 2006/7
 Design of Reinforced Concrete Columns 2006/7") Civil Engineering Design (1) Design of Reinforced Concrete Columns 2006/7 Dr. Colin Caprani, Chartered Engineer 1 Contents 1. Introduction... 3 1.1 Background... 3 1.2 Failure Modes... 5 1.3 Design Aspects...
Civil Engineering Design (1) Design of Reinforced Concrete Columns 2006/7 Dr. Colin Caprani, Chartered Engineer 1 Contents 1. Introduction... 3 1.1 Background... 3 1.2 Failure Modes... 5 1.3 Design Aspects...
Prediction of static response of Laced Steel-Concrete Composite beam using effective moment of inertia approach
 Prediction of static response of Laced Steel-Concrete Composite beam using effective moment of inertia approach Thirumalaiselvi A 1, 2, Anandavalli N 1,2, Rajasankar J 1,2, Nagesh R. Iyer 2 1 Academy of
An Increase in Elastic Buckling Strength of Plate Girder by the Influence of Transverse Stiffeners
 GRD Journals- Global Research and Development Journal for Engineering Volume 2 Issue 6 May 2017 ISSN: 2455-5703 An Increase in Elastic Buckling Strength of Plate Girder by the Influence of Transverse Stiffeners
Stresses Analysis of Petroleum Pipe Finite Element under Internal Pressure
 ISSN : 48-96, Vol. 6, Issue 8, ( Part -4 August 06, pp.3-38 RESEARCH ARTICLE Stresses Analysis of Petroleum Pipe Finite Element under Internal Pressure Dr.Ragbe.M.Abdusslam Eng. Khaled.S.Bagar ABSTRACT
A METHOD OF LOAD INCREMENTS FOR THE DETERMINATION OF SECOND-ORDER LIMIT LOAD AND COLLAPSE SAFETY OF REINFORCED CONCRETE FRAMED STRUCTURES
 A METHOD OF LOAD INCREMENTS FOR THE DETERMINATION OF SECOND-ORDER LIMIT LOAD AND COLLAPSE SAFETY OF REINFORCED CONCRETE FRAMED STRUCTURES Konuralp Girgin (Ph.D. Thesis, Institute of Science and Technology,
CHAPTER 3 EXPERIMENTAL STUDY
 Experimental Study 42 CHAPTER 3 EXPERIMENTAL STUDY 3.1. INTRODUCTION The experimental study that has been carried out in this thesis has two main objectives: 1. Characterise the concrete behaviour in mode
EFFECT OF SHEAR REINFORCEMENT ON FAILURE MODE OF RC BRIDGE PIERS SUBJECTED TO STRONG EARTHQUAKE MOTIONS
 EFFECT OF SHEAR REINFORCEMENT ON FAILURE MODE OF RC BRIDGE PIERS SUBJECTED TO STRONG EARTHQUAKE MOTIONS Atsuhiko MACHIDA And Khairy H ABDELKAREEM SUMMARY Nonlinear D FEM was utilized to carry out inelastic
Seismic Pushover Analysis Using AASHTO Guide Specifications for LRFD Seismic Bridge Design
 Seismic Pushover Analysis Using AASHTO Guide Specifications for LRFD Seismic Bridge Design Elmer E. Marx, Alaska Department of Transportation and Public Facilities Michael Keever, California Department
INFLUENCE OF FLANGE STIFFNESS ON DUCTILITY BEHAVIOUR OF PLATE GIRDER
 International Journal of Civil Structural 6 Environmental And Infrastructure Engineering Research Vol.1, Issue.1 (2011) 1-15 TJPRC Pvt. Ltd.,. INFLUENCE OF FLANGE STIFFNESS ON DUCTILITY BEHAVIOUR OF PLATE
Finite Element Analysis of FRP Debonding Failure at the Tip of Flexural/Shear Crack in Concrete Beam
 Marquette University e-publications@marquette Civil and Environmental Engineering Faculty Research and Publications Civil and Environmental Engineering, Department of 12-1-2013 Finite Element Analysis
Aim of the study Experimental determination of mechanical parameters Local buckling (wrinkling) Failure maps Optimization of sandwich panels
 Failure maps Optimization of sandwich panels") METNET Workshop October 11-12, 2009, Poznań, Poland Experimental and numerical analysis of sandwich metal panels Zbigniew Pozorski, Monika Chuda-Kowalska, Robert Studziński, Andrzej Garstecki Poznan University
METNET Workshop October 11-12, 2009, Poznań, Poland Experimental and numerical analysis of sandwich metal panels Zbigniew Pozorski, Monika Chuda-Kowalska, Robert Studziński, Andrzej Garstecki Poznan University
Fracture Test & Fracture Parameters of Self Compacting Concrete using ANSYS. Zeel Vashi 1,Megha Thomas 2 I. INTRODUCTION
 International Journal of Technical Innovation in Modern Engineering & Science (IJTIMES) Impact Factor: 3.45 (SJIF-2015), e-issn: 2455-2584 Volume 3, Issue 05, May-2017 Fracture Test & Fracture Parameters
Using the Abaqus CDP Model in Impact Simulations
 SAFIR project (http://safir2018.vtt.fi/) The Finnish Research Programme on Nuclear Power Plant Safety 2015-2018 Using the Abaqus CDP Model in Impact Simulations Alexis Fedoroff Technical reseach centre
DESIGN OF DOWELS FOR SHEAR TRANSFER AT THE INTERFACE BETWEEN CONCRETE CAST AT DIFFERENT TIMES: A CASE STUDY
 DESIGN OF DOWELS FOR SHEAR TRANSFER AT THE INTERFACE BETWEEN CONCRETE CAST AT DIFFERENT TIMES: A CASE STUDY Samayamanthree Mudiyanselage Premasiri Karunarathna 118614J Degree of Master of Engineering in
Introduction to Engineering Materials ENGR2000. Dr. Coates
 Introduction to Engineering Materials ENGR2 Chapter 6: Mechanical Properties of Metals Dr. Coates 6.2 Concepts of Stress and Strain tension compression shear torsion Tension Tests The specimen is deformed
Finite Element Modelling with Plastic Hinges
 01/02/2016 Marco Donà Finite Element Modelling with Plastic Hinges 1 Plastic hinge approach A plastic hinge represents a concentrated post-yield behaviour in one or more degrees of freedom. Hinges only
Stability of Simply Supported Square Plate with Concentric Cutout
 International OPEN ACCESS Journal Of Modern Engineering Research (IJMER) Stability of Simply Supported Square Plate with Concentric Cutout Jayashankarbabu B. S. 1, Dr. Karisiddappa 1 (Civil Engineering
ALGORITHM FOR NON-PROPORTIONAL LOADING IN SEQUENTIALLY LINEAR ANALYSIS
 9th International Conference on Fracture Mechanics of Concrete and Concrete Structures FraMCoS-9 Chenjie Yu, P.C.J. Hoogenboom and J.G. Rots DOI 10.21012/FC9.288 ALGORITHM FOR NON-PROPORTIONAL LOADING
Experimental Study and Numerical Simulation on Steel Plate Girders With Deep Section
 6 th International Conference on Advances in Experimental Structural Engineering 11 th International Workshop on Advanced Smart Materials and Smart Structures Technology August 1-2, 2015, University of
Nonlinear FE Analysis of Reinforced Concrete Structures Using a Tresca-Type Yield Surface
 Transaction A: Civil Engineering Vol. 16, No. 6, pp. 512{519 c Sharif University of Technology, December 2009 Research Note Nonlinear FE Analysis of Reinforced Concrete Structures Using a Tresca-Type Yield
PLATE GIRDERS II. Load. Web plate Welds A Longitudinal elevation. Fig. 1 A typical Plate Girder
 16 PLATE GIRDERS II 1.0 INTRODUCTION This chapter describes the current practice for the design of plate girders adopting meaningful simplifications of the equations derived in the chapter on Plate Girders
DYNAMIC ANALYSIS OF PILES IN SAND BASED ON SOIL-PILE INTERACTION
 October 1-17,, Beijing, China DYNAMIC ANALYSIS OF PILES IN SAND BASED ON SOIL-PILE INTERACTION Mohammad M. Ahmadi 1 and Mahdi Ehsani 1 Assistant Professor, Dept. of Civil Engineering, Geotechnical Group,
Structural Steelwork Eurocodes Development of A Trans-national Approach
 Structural Steelwork Eurocodes Development of A Trans-national Approach Course: Eurocode Module 7 : Worked Examples Lecture 0 : Simple braced frame Contents: 1. Simple Braced Frame 1.1 Characteristic Loads
POST-PEAK BEHAVIOR OF FRP-JACKETED REINFORCED CONCRETE COLUMNS
 POST-PEAK BEHAVIOR OF FRP-JACKETED REINFORCED CONCRETE COLUMNS - Technical Paper - Tidarut JIRAWATTANASOMKUL *1, Dawei ZHANG *2 and Tamon UEDA *3 ABSTRACT The objective of this study is to propose a new
Modeling of Interfacial Debonding Induced by IC Crack for Concrete Beam-bonded with CFRP
 Proceedings of the World Congress on Engineering 21 Vol II WCE 21, June 2 - July 1, 21, London, U.K. Modeling of Interfacial Debonding Induced by IC Crack for Concrete Beam-bonded with CFRP Lihua Huang,
ME 243. Mechanics of Solids
 ME 243 Mechanics of Solids Lecture 2: Stress and Strain Ahmad Shahedi Shakil Lecturer, Dept. of Mechanical Engg, BUET E-mail: sshakil@me.buet.ac.bd, shakil6791@gmail.com Website: teacher.buet.ac.bd/sshakil
Appendix G Analytical Studies of Columns
 Appendix G Analytical Studies of Columns G.1 Introduction Analytical parametric studies were performed to evaluate a number of issues related to the use of ASTM A103 steel as longitudinal and transverse
EUROCODE EN SEISMIC DESIGN OF BRIDGES
 Brussels, 18-20 February 2008 Dissemination of information workshop 1 EUROCODE EN1998-2 SEISMIC DESIGN OF BRIDGES Basil Kolias Basic Requirements Brussels, 18-20 February 2008 Dissemination of information
my!wind Ltd 5 kw wind turbine Static Stability Specification
 my!wind Ltd 5 kw wind turbine Static Stability Specification 1 P a g e 0 3 / 0 4 / 2 0 1 4 Contents Contents... 2 List of Changes... 2 Appendixes... 2 General remarks... 3 1. Introduction... 4 2. Geometry...
Sabah Shawkat Cabinet of Structural Engineering Walls carrying vertical loads should be designed as columns. Basically walls are designed in
 Sabah Shawkat Cabinet of Structural Engineering 17 3.6 Shear walls Walls carrying vertical loads should be designed as columns. Basically walls are designed in the same manner as columns, but there are
Influence of the Plastic Hinges Non-Linear Behavior on Bridges Seismic Response
 Influence of the Plastic Hinges Non-Linear Behavior on Bridges Seismic Response Miguel Arriaga e Cunha, Luís Guerreiro & Francisco Virtuoso Instituto Superior Técnico, Universidade Técnica de Lisboa, Lisboa
Redistribution of force concentrations in reinforced concrete cantilever slab using 3D non-linear FE analyses
 y x m y m y Linear elastic isotropic Linear elastic orthotropic Plastic Redistribution of force concentrations in reinforced concrete cantilever slab using 3D non-linear FE analyses x Master of Science
EMA 3702 Mechanics & Materials Science (Mechanics of Materials) Chapter 2 Stress & Strain - Axial Loading
 Chapter 2 Stress & Strain - Axial Loading") MA 3702 Mechanics & Materials Science (Mechanics of Materials) Chapter 2 Stress & Strain - Axial Loading MA 3702 Mechanics & Materials Science Zhe Cheng (2018) 2 Stress & Strain - Axial Loading Statics
MA 3702 Mechanics & Materials Science (Mechanics of Materials) Chapter 2 Stress & Strain - Axial Loading MA 3702 Mechanics & Materials Science Zhe Cheng (2018) 2 Stress & Strain - Axial Loading Statics
Finite Element Modeling of the Load Transfer Mechanism in Adjacent Prestressed. Concrete Box-Beams. a thesis presented to.
 Finite Element Modeling of the Load Transfer Mechanism in Adjacent Prestressed Concrete Box-Beams a thesis presented to the faculty of the Russ College of Engineering and Technology of Ohio University
SHEAR CAPACITY OF REINFORCED CONCRETE COLUMNS RETROFITTED WITH VERY FLEXIBLE FIBER REINFORCED POLYMER WITH VERY LOW YOUNG S MODULUS
 SHEAR CAPACITY OF REINFORCED CONCRETE COLUMNS RETROFITTED WITH VERY FLEXILE FIER REINFORCED POLYMER WITH VERY LOW YOUNG S MODULUS Hu Shaoqing Supervisor: Susumu KONO ** MEE8165 ASTRACT FRP with low Young
Design of reinforced concrete sections according to EN and EN
 Design of reinforced concrete sections according to EN 1992-1-1 and EN 1992-2 Validation Examples Brno, 21.10.2010 IDEA RS s.r.o. South Moravian Innovation Centre, U Vodarny 2a, 616 00 BRNO tel.: +420-511
Classical fracture and failure hypotheses
 : Chapter 2 Classical fracture and failure hypotheses In this chapter, a brief outline on classical fracture and failure hypotheses for materials under static loading will be given. The word classical
Design of Beams (Unit - 8)
") Design of Beams (Unit - 8) Contents Introduction Beam types Lateral stability of beams Factors affecting lateral stability Behaviour of simple and built - up beams in bending (Without vertical stiffeners)
Design of Beams (Unit - 8) Contents Introduction Beam types Lateral stability of beams Factors affecting lateral stability Behaviour of simple and built - up beams in bending (Without vertical stiffeners)
Fatigue Resistance of Angle Shape Shear Connector used in Steel-Concrete Composite Slab
 Fatigue Resistance of Angle Shape Shear Connector used in Steel-Concrete Composite Slab A dissertation submitted to the Graduate School of Engineering of Nagoya University in partial fulfillment of the
VORONOI APPLIED ELEMENT METHOD FOR STRUCTURAL ANALYSIS: THEORY AND APPLICATION FOR LINEAR AND NON-LINEAR MATERIALS
 The 4 th World Conference on Earthquake Engineering October -7, 008, Beijing, China VORONOI APPLIED ELEMENT METHOD FOR STRUCTURAL ANALYSIS: THEORY AND APPLICATION FOR LINEAR AND NON-LINEAR MATERIALS K.
Ultimate shear strength of FPSO stiffened panels after supply vessel collision
 Ultimate shear strength of FPSO stiffened panels after supply vessel collision Nicolau Antonio dos Santos Rizzo PETROBRAS Rio de Janeiro Brazil Marcelo Caire SINTEF do Brasil Rio de Janeiro Brazil Carlos
Chapter 7. Highlights:
 Chapter 7 Highlights: 1. Understand the basic concepts of engineering stress and strain, yield strength, tensile strength, Young's(elastic) modulus, ductility, toughness, resilience, true stress and true
Powerful Modelling Techniques in Abaqus to Simulate
 Powerful Modelling Techniques in Abaqus to Simulate Necking and Delamination of Laminated Composites D. F. Zhang, K.M. Mao, Md. S. Islam, E. Andreasson, Nasir Mehmood, S. Kao-Walter Email: sharon.kao-walter@bth.se
INCREASING RUPTURE PREDICTABILITY FOR ALUMINUM
 1 INCREASING RUPTURE PREDICTABILITY FOR ALUMINUM Influence of anisotropy Daniel Riemensperger, Adam Opel AG Paul Du Bois, PDB 2 www.opel.com CONTENT Introduction/motivation Isotropic & anisotropic material
Design of AAC wall panel according to EN 12602
 Design of wall panel according to EN 160 Example 3: Wall panel with wind load 1.1 Issue Design of a wall panel at an industrial building Materials with a compressive strength 3,5, density class 500, welded
EQUIVALENT FRACTURE ENERGY CONCEPT FOR DYNAMIC RESPONSE ANALYSIS OF PROTOTYPE RC GIRDERS
 EQUIVALENT FRACTURE ENERGY CONCEPT FOR DYNAMIC RESPONSE ANALYSIS OF PROTOTYPE RC GIRDERS Abdul Qadir Bhatti 1, Norimitsu Kishi 2 and Khaliq U Rehman Shad 3 1 Assistant Professor, Dept. of Structural Engineering,
The design of a formula student front impact attenuator
 The design of a formula student front impact attenuator J.M.J. Schormans MT 10.06 Supervisors: dr. ir. Varvara Kouznetsova Eindhoven University of Technology Department of Mechanical Engineering Computational
FRACTURE IN HIGH PERFORMANCE FIBRE REINFORCED CONCRETE PAVEMENT MATERIALS
 FRACTURE IN HIGH PERFORMANCE FIBRE REINFORCED CONCRETE PAVEMENT MATERIALS ERIK DENNEMAN A thesis submitted in partial fulfilment of the requirements for the degree of PHILOSOPHIAE DOCTOR (ENGINEERING)
FE analysis of steel-concrete composite structure with partial interactions
 FE analysis of steel-concrete composite structure with partial interactions WonHo Lee 1), SeoJun Ju 2) and Hyo-Gyoung Kwa 3) 1), 2) 3) Department of Civil Engineering, KAIST, Daejeon 34141, Korea 1) wonho.lee@aist.ac.r
Constitutive model for quasi-static deformation of metallic sandwich cores
 INTERNATIONAL JOURNAL FOR NUMERICAL METHODS IN ENGINEERING Int. J. Numer. Meth. Engng 2004; 61:2205 2238 Published online 18 October 2004 in Wiley InterScience (www.interscience.wiley.com). DOI: 10.1002/nme.1142
FEA A Guide to Good Practice. What to expect when you re expecting FEA A guide to good practice
 FEA A Guide to Good Practice What to expect when you re expecting FEA A guide to good practice 1. Background Finite Element Analysis (FEA) has transformed design procedures for engineers. Allowing more
A PAPER ON DESIGN AND ANALYSIS OF PRESSURE VESSEL
 A PAPER ON DESIGN AND ANALYSIS OF PRESSURE VESSEL P.Palanivelu 1, R.Siva Prasad 2, 1 PG Scholar, Department of Mechanical Engineering, Gojan School of Business and Technology, Redhills, Chennai, India.
PERIYAR CENTENARY POLYTECHNIC COLLEGE PERIYAR NAGAR - VALLAM THANJAVUR. DEPARTMENT OF MECHANICAL ENGINEERING QUESTION BANK
 PERIYAR CENTENARY POLYTECHNIC COLLEGE PERIYAR NAGAR - VALLAM - 613 403 - THANJAVUR. DEPARTMENT OF MECHANICAL ENGINEERING QUESTION BANK Sub : Strength of Materials Year / Sem: II / III Sub Code : MEB 310
Bending Load & Calibration Module
 Bending Load & Calibration Module Objectives After completing this module, students shall be able to: 1) Conduct laboratory work to validate beam bending stress equations. 2) Develop an understanding of
Module 5: Theories of Failure
 Module 5: Theories of Failure Objectives: The objectives/outcomes of this lecture on Theories of Failure is to enable students for 1. Recognize loading on Structural Members/Machine elements and allowable
Chapter 4. Test results and discussion. 4.1 Introduction to Experimental Results
 Chapter 4 Test results and discussion This chapter presents a discussion of the results obtained from eighteen beam specimens tested at the Structural Technology Laboratory of the Technical University
ULTIMATE STRENGTH OF SQUARE PLATE WITH RECTANGULAR OPENING UNDER AXIAL COMPRESSION
 Journal of Naval Architecture and Marine Engineering June, 2007 http://jname.8m.net ULTIMATE STRENGTH OF SQUARE PLATE WITH RECTANGULAR OPENING UNDER AXIAL COMPRESSION M. Suneel Kumar 1*, P. Alagusundaramoorthy
Mechanical Properties of Materials
 Mechanical Properties of Materials Strains Material Model Stresses Learning objectives Understand the qualitative and quantitative description of mechanical properties of materials. Learn the logic of
Structural Steelwork Eurocodes Development of A Trans-national Approach
 Structural Steelwork Eurocodes Development of A Trans-national Approach Course: Eurocode 3 Module 7 : Worked Examples Lecture 20 : Simple braced frame Contents: 1. Simple Braced Frame 1.1 Characteristic
Use Hooke s Law (as it applies in the uniaxial direction),
,") 0.6 STRSS-STRAIN RLATIONSHIP Use the principle of superposition Use Poisson s ratio, v lateral longitudinal Use Hooke s Law (as it applies in the uniaxial direction), x x v y z, y y vx z, z z vx y Copyright
0.6 STRSS-STRAIN RLATIONSHIP Use the principle of superposition Use Poisson s ratio, v lateral longitudinal Use Hooke s Law (as it applies in the uniaxial direction), x x v y z, y y vx z, z z vx y Copyright
6. NON-LINEAR PSEUDO-STATIC ANALYSIS OF ADOBE WALLS
 6. NON-LINEAR PSEUDO-STATIC ANALYSIS OF ADOBE WALLS Blondet et al. [25] carried out a cyclic test on an adobe wall to reproduce its seismic response and damage pattern under in-plane loads. The displacement
Numerical Modeling of Interface Between Soil and Pile to Account for Loss of Contact during Seismic Excitation
 Numerical Modeling of Interface Between Soil and Pile to Account for Loss of Contact during Seismic Excitation P. Sushma Ph D Scholar, Earthquake Engineering Research Center, IIIT Hyderabad, Gachbowli,
COURSE TITLE : APPLIED MECHANICS & STRENGTH OF MATERIALS COURSE CODE : 4017 COURSE CATEGORY : A PERIODS/WEEK : 6 PERIODS/ SEMESTER : 108 CREDITS : 5
 COURSE TITLE : APPLIED MECHANICS & STRENGTH OF MATERIALS COURSE CODE : 4017 COURSE CATEGORY : A PERIODS/WEEK : 6 PERIODS/ SEMESTER : 108 CREDITS : 5 TIME SCHEDULE MODULE TOPICS PERIODS 1 Simple stresses
EDEM DISCRETIZATION (Phase II) Normal Direction Structure Idealization Tangential Direction Pore spring Contact spring SPRING TYPES Inner edge Inner d
 Normal Direction Structure Idealization Tangential Direction Pore spring Contact spring SPRING TYPES Inner edge Inner d") Institute of Industrial Science, University of Tokyo Bulletin of ERS, No. 48 (5) A TWO-PHASE SIMPLIFIED COLLAPSE ANALYSIS OF RC BUILDINGS PHASE : SPRING NETWORK PHASE Shanthanu RAJASEKHARAN, Muneyoshi
Institute of Industrial Science, University of Tokyo Bulletin of ERS, No. 48 (5) A TWO-PHASE SIMPLIFIED COLLAPSE ANALYSIS OF RC BUILDINGS PHASE : SPRING NETWORK PHASE Shanthanu RAJASEKHARAN, Muneyoshi
Parametric analysis and torsion design charts for axially restrained RC beams
 Structural Engineering and Mechanics, Vol. 55, No. 1 (2015) 1-27 DOI: http://dx.doi.org/10.12989/sem.2015.55.1.001 1 Parametric analysis and torsion design charts for axially restrained RC beams Luís F.A.
Compact energy absorbing cellular structure
 Structures Under Shock and Impact IX 413 Compact energy absorbing cellular structure M. Ali 1, A. Qamhiyah 2, D. Flugrad 1 & M. Shakoor 1 1 Department of Mechanical Engineering, Iowa State University,
ME Final Exam. PROBLEM NO. 4 Part A (2 points max.) M (x) y. z (neutral axis) beam cross-sec+on. 20 kip ft. 0.2 ft. 10 ft. 0.1 ft.
 M (x) y. z (neutral axis) beam cross-sec+on. 20 kip ft. 0.2 ft. 10 ft. 0.1 ft.") ME 323 - Final Exam Name December 15, 2015 Instructor (circle) PROEM NO. 4 Part A (2 points max.) Krousgrill 11:30AM-12:20PM Ghosh 2:30-3:20PM Gonzalez 12:30-1:20PM Zhao 4:30-5:20PM M (x) y 20 kip ft 0.2
ME 323 - Final Exam Name December 15, 2015 Instructor (circle) PROEM NO. 4 Part A (2 points max.) Krousgrill 11:30AM-12:20PM Ghosh 2:30-3:20PM Gonzalez 12:30-1:20PM Zhao 4:30-5:20PM M (x) y 20 kip ft 0.2
Mechanics of Materials Primer
 Mechanics of Materials rimer Notation: A = area (net = with holes, bearing = in contact, etc...) b = total width of material at a horizontal section d = diameter of a hole D = symbol for diameter E = modulus
Practice Final Examination. Please initial the statement below to show that you have read it
 EN175: Advanced Mechanics of Solids Practice Final Examination School of Engineering Brown University NAME: General Instructions No collaboration of any kind is permitted on this examination. You may use
Brittle Deformation. Earth Structure (2 nd Edition), 2004 W.W. Norton & Co, New York Slide show by Ben van der Pluijm
, 2004 W.W. Norton & Co, New York Slide show by Ben van der Pluijm") Lecture 6 Brittle Deformation Earth Structure (2 nd Edition), 2004 W.W. Norton & Co, New York Slide show by Ben van der Pluijm WW Norton, unless noted otherwise Brittle deformation EarthStructure (2 nd
Lecture 6 Brittle Deformation Earth Structure (2 nd Edition), 2004 W.W. Norton & Co, New York Slide show by Ben van der Pluijm WW Norton, unless noted otherwise Brittle deformation EarthStructure (2 nd
: APPLIED MECHANICS & STRENGTH OF MATERIALS COURSE CODE : 4021 COURSE CATEGORY : A PERIODS/ WEEK : 5 PERIODS/ SEMESTER : 75 CREDIT : 5 TIME SCHEDULE
 COURSE TITLE : APPLIED MECHANICS & STRENGTH OF MATERIALS COURSE CODE : 4021 COURSE CATEGORY : A PERIODS/ WEEK : 5 PERIODS/ SEMESTER : 75 CREDIT : 5 TIME SCHEDULE MODULE TOPIC PERIODS 1 Simple stresses
DESIGN AND DETAILING OF COUNTERFORT RETAINING WALL
 DESIGN AND DETAILING OF COUNTERFORT RETAINING WALL When the height of the retaining wall exceeds about 6 m, the thickness of the stem and heel slab works out to be sufficiently large and the design becomes
Role of Force Resultant Interaction on Ultra-High Performance Concrete
 First International Interactive Symposium on UHPC 216 Role of Force Resultant Interaction on Ultra-High Performance Concrete Author(s) & Affiliation: Titchenda Chan (1), Kevin R. Mackie (1), and Jun Xia
STRAIN ASSESSMENT USFOS
 1 STRAIN ASSESSMENT IN USFOS 2 CONTENTS: 1 Introduction...3 2 Revised strain calculation model...3 3 Strain predictions for various characteristic cases...4 3.1 Beam with concentrated load at mid span...
EARTHQUAKE SIMULATION TESTS OF BRIDGE COLUMN MODELS DAMAGED DURING 1995 KOBE EARTHQUAKE
 EARTHQUAKE SIMULATION TESTS OF BRIDGE COLUMN MODELS DAMAGED DURING 1995 KOBE EARTHQUAKE J. Sakai 1, S. Unjoh 2 and H. Ukon 3 1 Senior Researcher, Center for Advanced Engineering Structural Assessment and
TABLE OF CONTENTS CHAPTER TITLE PAGE DECLARATION DEDICATION ACKNOWLEDGEMENT ABSTRACT ABSTRAK
 vii TABLE OF CONTENTS CHAPTER TITLE PAGE DECLARATION DEDICATION ACKNOWLEDGEMENT ABSTRACT ABSTRAK TABLE OF CONTENTS LIST OF TABLES LIST OF FIGURES LIST OF ABBREVIATIONS LIST OF SYMBOLS ii iii iv v vi vii
Size Effects In the Crushing of Honeycomb Structures
 45th AIAA/ASME/ASCE/AHS/ASC Structures, Structural Dynamics & Materials Conference 19-22 April 2004, Palm Springs, California AIAA 2004-1640 Size Effects In the Crushing of Honeycomb Structures Erik C.
CE5510 Advanced Structural Concrete Design - Design & Detailing of Openings in RC Flexural Members-
 CE5510 Advanced Structural Concrete Design - Design & Detailing Openings in RC Flexural Members- Assoc Pr Tan Kiang Hwee Department Civil Engineering National In this lecture DEPARTMENT OF CIVIL ENGINEERING
Fundamentals of Structural Design Part of Steel Structures
 Fundamentals of Structural Design Part of Steel Structures Civil Engineering for Bachelors 133FSTD Teacher: Zdeněk Sokol Office number: B619 1 Syllabus of lectures 1. Introduction, history of steel structures,
Structural Steelwork Eurocodes Development of A Trans-national Approach
 Structural Steelwork Eurocodes Development of A Trans-national Approach Course: Eurocode Module 7 : Worked Examples Lecture 22 : Design of an unbraced sway frame with rigid joints Summary: NOTE This example
Numerical Modelling of Blockwork Prisms Tested in Compression Using Finite Element Method with Interface Behaviour
 13 th International Brick and Block Masonry Conference Amsterdam, July 4-7, 2004 Numerical Modelling of Blockwork Prisms Tested in Compression Using Finite Element Method with Interface Behaviour H. R.
FLEXURAL MODELLING OF STRAIN SOFTENING AND STRAIN HARDENING FIBER REINFORCED CONCRETE
 Proceedings, Pro. 53, S.A.R.L., Cachan, France, pp.55-6, 7. FLEXURAL MODELLING OF STRAIN SOFTENING AND STRAIN HARDENING FIBER REINFORCED CONCRETE Chote Soranakom and Barzin Mobasher Department of Civil
Analysis of grouted connections using the finite element method
 RECOMMENDED PRACTICE DNVGL-RP-0419 Edition September 2016 Analysis of grouted connections using the finite element method The electronic pdf version of this document found through http://www.dnvgl.com
Nonlinear Analysis of Reinforced Concrete Shells Subjected to Impact Loads
 Transactions of the 7 th International Conference on Structural Mechanics in Reactor Technology (SMiRT 7) Prague, Czech Republic, August 7, 00 Paper # J0- Nonlinear Analysis of Reinforced Concrete Shells
Lecture-08 Gravity Load Analysis of RC Structures
 Lecture-08 Gravity Load Analysis of RC Structures By: Prof Dr. Qaisar Ali Civil Engineering Department UET Peshawar www.drqaisarali.com 1 Contents Analysis Approaches Point of Inflection Method Equivalent
Research Collection. Numerical analysis on the fire behaviour of steel plate girders. Conference Paper. ETH Library
 Research Collection Conference Paper Numerical analysis on the fire behaviour of steel plate girders Author(s): Scandella, Claudio; Knobloch, Markus; Fontana, Mario Publication Date: 14 Permanent Link:
DEFORMATION CAPACITY OF OLDER RC SHEAR WALLS: EXPERIMENTAL ASSESSMENT AND COMPARISON WITH EUROCODE 8 - PART 3 PROVISIONS
 DEFORMATION CAPACITY OF OLDER RC SHEAR WALLS: EXPERIMENTAL ASSESSMENT AND COMPARISON WITH EUROCODE 8 - PART 3 PROVISIONS Konstantinos CHRISTIDIS 1, Emmanouil VOUGIOUKAS 2 and Konstantinos TREZOS 3 ABSTRACT
2012 MECHANICS OF SOLIDS
 R10 SET - 1 II B.Tech II Semester, Regular Examinations, April 2012 MECHANICS OF SOLIDS (Com. to ME, AME, MM) Time: 3 hours Max. Marks: 75 Answer any FIVE Questions All Questions carry Equal Marks ~~~~~~~~~~~~~~~~~~~~~~