Unit 9: Inferences for Proportions and Count Data
|
|
|
- Polly Mosley
- 6 years ago
- Views:
Transcription
1 Unit 9: Inferences for Proportions and Count Data Statistics 571: Statistical Methods Ramón V. León 12/15/2008 Unit 9 - Stat Ramón V. León 1
2 Large Sample Confidence Interval for Proportion ( pˆ p) ( pˆ p) Note that N(0,1) and N(0,1) if n is large pq / n pq ˆˆ/ n ( q = 1- p, npˆ 10 and nqˆ 10) It follows that: Confidence interval for p: ( pˆ p) P z z 1 pq ˆˆ n α 2 α 2 α pq ˆˆ pˆ z p pˆ + z n α 2 α 2 pq ˆˆ n 12/15/2008 Unit 9 - Stat Ramón V. León 2
3 A Better Confidence Interval for Proportion Use this probability statement ( pˆ p) P z z 1 pq n α 2 α 2 α Solve for p using quadratic equation CI for p: 12/15/2008 Unit 9 - Stat Ramón V. León 3
4 12/15/2008 Unit 9 - Stat Ramón V. León 4


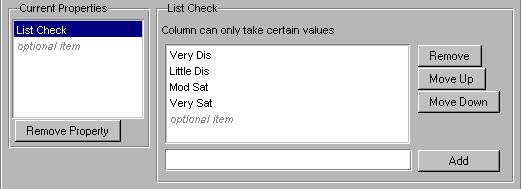
5 CI for Proportion in JMP Arbitrary choice of names = 0.45 x 800 = 0.55 x 800 Value column has two categories. Can you imagine a situation where one would have more categories in this column? 12/15/2008 Unit 9 - Stat Ramón V. León 5


6 CI for Proportion in JMP 12/15/2008 Unit 9 - Stat Ramón V. León 6
7 Sample Size Determination for a Confidence Interval for Proportion Want (1-α)-level two-sided CI: pq ˆˆ pˆ ± E where E is the margin of error. Then E = zα 2. n zα 2 Solving for n gives n= pq ˆˆ (Formula 9.4) E Largest value of pq = = so conservative sample size is: zα 2 n = E (Formula 9.5) 12/15/2008 Unit 9 - Stat Ramón V. León 7
8 Example 9.2: Presidential Poll n = = = 9604 Threefold increase in precision requires ninefold increase in sample size 12/15/2008 Unit 9 - Stat Ramón V. León 8
9 Largest Sample Hypothesis Test on Proportion H : p = p vs. H : p p Best test statistics: z = ˆp pq 0 0 p 0 n Dual relationship between CI and test of hypothesis holds if the better confidence interval is used. There is an exact test that can be used when the sample size is small (given in Section 9.1.3). We do not cover it. 12/15/2008 Unit 9 - Stat Ramón V. León 9
10 Basketball Problem: z-test /15/2008 Unit 9 - Stat Ramón V. León 10


11 Test for Proportion in JMP: Baseball Problem Value has two categories. 12/15/2008 Unit 9 - Stat Ramón V. León 11

12 Test for Proportion in JMP: Basketball Problem 12/15/2008 Unit 9 - Stat Ramón V. León 12
13 Sample Size for Z-Test of Proportion 1 0 H : p p vs. H : p > p o α Suppose that the power for rejecting H must be at least 1- β when the true proportion is p= p > p. Let δ = p p. Then zα p0q0 + z pq β 1 1 n = ˆp p0 δ z = pq 0 0 n Replace z by z for two-sided test sample size. α Test based on: 12/15/2008 Unit 9 - Stat Ramón V. León 13
14 Example 9.4: Pizza Testing H H 0 1 : Can't tell two pizzas Apart, : Can tell pizzas apart α =.10, We wants β =.25 when p = 0.5 ± 0.1 n zα 2 p0q0 + zβ pq 1 1 = δ ( )( ) + ( )( ) = = /15/2008 Unit 9 - Stat Ramón V. León 14
15 Multinomial Test of Proportions 12/15/2008 Unit 9 - Stat Ramón V. León 15


16 Multinomial Test in JMP Note that one could have gotten confidence intervals Observed count does not exhibit significant deviation from the uniform model. 12/15/2008 Unit 9 - Stat Ramón V. León 16
17 Comparing Two Proportion: Independent Sample Design If np, nq, np, nq 10, then Z Confidence Interval: pˆ pˆ ( p p ) = pq ˆˆ n + pq ˆˆ n N(0,1) pq ˆˆ pq ˆˆ pq ˆˆ pq ˆˆ pˆ pˆ z + p p pˆ pˆ + z α α 2 n1 n2 n1 n2 12/15/2008 Unit 9 - Stat Ramón V. León 17
18 Test for Equality of Proportions (Large n) Independent Sample Design H : p = p vs. H : p p pˆ1 pˆ2 Test statitics: z = 1 1 pq ˆˆ + n n npˆ ˆ 1 1+ np 2 2 x+ y where pˆ = = n + n n + n There is small sample test called Fisher s exact test. See JMP output latter. See Example 9.5 for application to the Salk Polio Vaccine Trial There a test for Matched Pair Design in Section Please read Example 9.9 to see its application for testing the effectiveness of presidential debates. Do voters change their minds about candidates because of debates? 12/15/2008 Unit 9 - Stat Ramón V. León 18
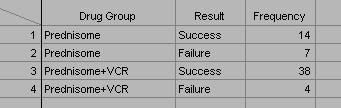
19 Example 9.6 Comparing Two Leukemia Therapies 12/15/2008 Unit 9 - Stat Ramón V. León 19


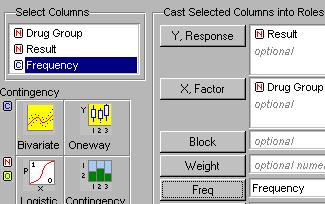
20 Test for Equality of Proportions in JMP: Example /15/2008 Unit 9 - Stat Ramón V. León 20
21 Example 9.6 JMP Output Result 0.50 Success Prednisone Prednisone + VCR Failure Drug Group 12/15/2008 Unit 9 - Stat Ramón V. León 21
22 Test for Equality of Proportions in JMP Tests Source Model Error C. Total N DF LogLike RSquare (U) Recall that the P- value of the twosided z-test was calculated to be Test Likelihood Ratio Pearson Fisher's Exact Test Left Right 2-Tail ChiSquare Prob Prob>ChiSq z 2 = (-2.347) 2 Less significant result 12/15/2008 Unit 9 - Stat Ramón V. León 22
23 Inferences for Two-Way Count Data Sampling Model 1: Multinomial Model (Total Sample Size Fixed) Sample of 901 from a single population that is then cross-classified The null hypothesis is that X and Y are independent: H : p = P( X = i, Y = j) = P( X = i) P( Y = j) = p p for all i, j 0 ij i.. j 12/15/2008 Unit 9 - Stat Ramón V. León 23
24 Sampling Model 1 (Total Sample Size Fixed) Estimated Expected Frequency = 901 = = (Cell 1,1) = np p /15/2008 Unit 9 - Stat Ramón V. León 24
25 Chi-Square Statistics χ 2 c = i= 1 ( n e) i e i i 2 12/15/2008 Unit 9 - Stat Ramón V. León 25
26 Chi-Square Test Critical Value 2 The d.f. for this χ statistics is (4-1)(4-1) = 9. Since χ = the calculated χ 2 9,.05 = is not sufficiently large to reject the hypothesis of independence at α =.05 level In general df = (r-1)(c-1) where c is the number of columns and r is the number of rows. 12/15/2008 Unit 9 - Stat Ramón V. León 26

27 JMP Analysis 12/15/2008 Unit 9 - Stat Ramón V. León 27


28 JMP Analysis Shows no significance 12/15/2008 Unit 9 - Stat Ramón V. León 28

29 JMP Analysis Note that most of the contribution to the chi-square statistics comes from the corner cells. Lack of significance in the chi-square statistics is the result of the low contribution to the chisquare statistic coming from the center cells. 12/15/2008 Unit 9 - Stat Ramón V. León 29


30 JMP Analysis Restricting our chi-square analysis to the corner cells shows a strong relationship between income and level of satisfaction. 12/15/2008 Unit 9 - Stat Ramón V. León 30
31 Product Multinomial Model: Row Totals Fixed Notice that it does not make any sense to say that for the population 21 out of 80 returned wallets came from Big Cities. Homework Problem /15/2008 Unit 9 - Stat Ramón V. León 31
32 Product Multinomial Model: Row Totals Fixed Sampling Model 2: Product Multinomial Total number of patients in each drug group is fixed. The null hypothesis is that the probability of column response (success or failure) is the same, regardless of the row population: H0 : P ( Y = j X = i ) = pj 12/15/2008 Unit 9 - Stat Ramón V. León 32

33 Chi-Square Statistics χ 2 c = i= 1 ( n e) i e i i 2 12/15/2008 Unit 9 - Stat Ramón V. León 33

34 JMP Analysis 12/15/2008 Unit 9 - Stat Ramón V. León 34
 2 2 z = = 2.347 5.")

35 JMP Analysis Recall Slide 19: ( ) 2 2 z = = /15/2008 Unit 9 - Stat Ramón V. León 35
36 Remarks About Chi-Square Test The distribution of the chi-square statistics under the null hypothesis is approximately chi-square only when the sample sizes are large The rule of thumb is that all expected cell counts should be greater than 1 and No more than 1/5 th of the expected cell counts should be less than 5. Combine sparse cell (having small expected cell counts) with adjacent cells. Unfortunately, this has the drawback of losing some information. 12/15/2008 Unit 9 - Stat Ramón V. León 36
37 Odds Ratio as a Measure of Association for a 2x2 Table Sampling Model I: Multinomial ψ = p p p p The numerator is the odds of the column 1 outcome vs. the column 2 outcome for row 1, and the denominator is the same odds for row 2, hence the name odds ratio 12/15/2008 Unit 9 - Stat Ramón V. León 37
38 Odds Ratio as a Measure of Association for a 2x2 Table Sampling Model II: Product Multinomial ψ = p p 1 1 p p ( ) 1 1 ( ) 2 2 The two column outcomes are labeled as success and failure, then ψ is the odds of success for the row 1 population vs. the odds of success for the row 2 population 12/15/2008 Unit 9 - Stat Ramón V. León 38

39 Odds Ratio as a Measure of Association for a 2x2 Table n 11 n n11 + n12 n21 + n ψˆ = = = n n 22 n n 12 n21 n n11 n12 n11n ψˆ = = = = n n n n Confidence Inteval: [0.053, 0.831] 12/15/2008 Unit 9 - Stat Ramón V. León 39

40 Case-Control Studies: The Odds Ratio Approximates the Relative Risk if the Disease is Rare 12/15/2008 Unit 9 - Stat Ramón V. León 40

41 JMP Output for Case-Control Study 12/15/2008 Unit 9 - Stat Ramón V. León 41


42 How to Do It in JMP 12/15/2008 Unit 9 - Stat Ramón V. León 42

43 12/15/2008 Unit 9 - Stat Ramón V. León 43

44 12/15/2008 Unit 9 - Stat Ramón V. León 44


45 12/15/2008 Unit 9 - Stat Ramón V. León 45
46 Do You Need to Know More? 578 Categorical Data Analysis (3) Log-linear analysis of multidimensional contingency tables. Logistic regression. Theory, applications, and use of statistical software. Prereq: 1 yr graduate-level statistics, regression analysis and analysis of variance, or consent of instructor. Sp Reference: An Introduction to Categorical Data Analysis by Alan Agresti. Wiley. 12/15/2008 Unit 9 - Stat Ramón V. León 46
Unit 9: Inferences for Proportions and Count Data
 Unit 9: Inferences for Proportions and Count Data Statistics 571: Statistical Methods Ramón V. León 1/15/008 Unit 9 - Stat 571 - Ramón V. León 1 Large Sample Confidence Interval for Proportion ( pˆ p)
Inferences for Proportions and Count Data
 Inferences for Proportions and Count Data Corresponds to Chapter 9 of Tamhane and Dunlop Slides prepared by Elizabeth Newton (MIT), with some slides by Ramón V. León (University of Tennessee) 1 Inference
STAT Chapter 13: Categorical Data. Recall we have studied binomial data, in which each trial falls into one of 2 categories (success/failure).
.") STAT 515 -- Chapter 13: Categorical Data Recall we have studied binomial data, in which each trial falls into one of 2 categories (success/failure). Many studies allow for more than 2 categories. Example
STAT 515 -- Chapter 13: Categorical Data Recall we have studied binomial data, in which each trial falls into one of 2 categories (success/failure). Many studies allow for more than 2 categories. Example
MATH 240. Chapter 8 Outlines of Hypothesis Tests
 MATH 4 Chapter 8 Outlines of Hypothesis Tests Test for Population Proportion p Specify the null and alternative hypotheses, ie, choose one of the three, where p is some specified number: () H : p H : p
13.1 Categorical Data and the Multinomial Experiment
 Chapter 13 Categorical Data Analysis 13.1 Categorical Data and the Multinomial Experiment Recall Variable: (numerical) variable (i.e. # of students, temperature, height,). (non-numerical, categorical)
Statistics 3858 : Contingency Tables
 Statistics 3858 : Contingency Tables 1 Introduction Before proceeding with this topic the student should review generalized likelihood ratios ΛX) for multinomial distributions, its relation to Pearson
Module 10: Analysis of Categorical Data Statistics (OA3102)
") Module 10: Analysis of Categorical Data Statistics (OA3102) Professor Ron Fricker Naval Postgraduate School Monterey, California Reading assignment: WM&S chapter 14.1-14.7 Revision: 3-12 1 Goals for this
Module 10: Analysis of Categorical Data Statistics (OA3102) Professor Ron Fricker Naval Postgraduate School Monterey, California Reading assignment: WM&S chapter 14.1-14.7 Revision: 3-12 1 Goals for this
Hypothesis Testing, Power, Sample Size and Confidence Intervals (Part 2)
") Hypothesis Testing, Power, Sample Size and Confidence Intervals (Part 2) B.H. Robbins Scholars Series June 23, 2010 1 / 29 Outline Z-test χ 2 -test Confidence Interval Sample size and power Relative effect
Hypothesis Testing, Power, Sample Size and Confidence Intervals (Part 2) B.H. Robbins Scholars Series June 23, 2010 1 / 29 Outline Z-test χ 2 -test Confidence Interval Sample size and power Relative effect
Ling 289 Contingency Table Statistics
 Ling 289 Contingency Table Statistics Roger Levy and Christopher Manning This is a summary of the material that we ve covered on contingency tables. Contingency tables: introduction Odds ratios Counting,
Sections 7.1 and 7.2. This chapter presents the beginning of inferential statistics. The two major applications of inferential statistics
 Sections 7.1 and 7.2 This chapter presents the beginning of inferential statistics. The two major applications of inferential statistics Estimate the value of a population parameter Test some claim (or
Testing Independence
 Testing Independence Dipankar Bandyopadhyay Department of Biostatistics, Virginia Commonwealth University BIOS 625: Categorical Data & GLM 1/50 Testing Independence Previously, we looked at RR = OR = 1
Chapter 9 Inferences from Two Samples
 Chapter 9 Inferences from Two Samples 9-1 Review and Preview 9-2 Two Proportions 9-3 Two Means: Independent Samples 9-4 Two Dependent Samples (Matched Pairs) 9-5 Two Variances or Standard Deviations Review
Chapter 10. Chapter 10. Multinomial Experiments and. Multinomial Experiments and Contingency Tables. Contingency Tables.
 Chapter 10 Multinomial Experiments and Contingency Tables 1 Chapter 10 Multinomial Experiments and Contingency Tables 10-1 1 Overview 10-2 2 Multinomial Experiments: of-fitfit 10-3 3 Contingency Tables:
Discrete Multivariate Statistics
 Discrete Multivariate Statistics Univariate Discrete Random variables Let X be a discrete random variable which, in this module, will be assumed to take a finite number of t different values which are
Poisson regression: Further topics
 Poisson regression: Further topics April 21 Overdispersion One of the defining characteristics of Poisson regression is its lack of a scale parameter: E(Y ) = Var(Y ), and no parameter is available to
Econ 325: Introduction to Empirical Economics
 Econ 325: Introduction to Empirical Economics Chapter 9 Hypothesis Testing: Single Population Ch. 9-1 9.1 What is a Hypothesis? A hypothesis is a claim (assumption) about a population parameter: population
ST3241 Categorical Data Analysis I Two-way Contingency Tables. 2 2 Tables, Relative Risks and Odds Ratios
 ST3241 Categorical Data Analysis I Two-way Contingency Tables 2 2 Tables, Relative Risks and Odds Ratios 1 What Is A Contingency Table (p.16) Suppose X and Y are two categorical variables X has I categories
PubH 5450 Biostatistics I Prof. Carlin. Lecture 13
 PubH 5450 Biostatistics I Prof. Carlin Lecture 13 Outline Outline Sample Size Counts, Rates and Proportions Part I Sample Size Type I Error and Power Type I error rate: probability of rejecting the null
Unit 11: Multiple Linear Regression
 Unit 11: Multiple Linear Regression Statistics 571: Statistical Methods Ramón V. León 7/13/2004 Unit 11 - Stat 571 - Ramón V. León 1 Main Application of Multiple Regression Isolating the effect of a variable
The Multinomial Model
 The Multinomial Model STA 312: Fall 2012 Contents 1 Multinomial Coefficients 1 2 Multinomial Distribution 2 3 Estimation 4 4 Hypothesis tests 8 5 Power 17 1 Multinomial Coefficients Multinomial coefficient
Categorical Data Analysis Chapter 3
 Categorical Data Analysis Chapter 3 The actual coverage probability is usually a bit higher than the nominal level. Confidence intervals for association parameteres Consider the odds ratio in the 2x2 table,
BIOS 625 Fall 2015 Homework Set 3 Solutions
 BIOS 65 Fall 015 Homework Set 3 Solutions 1. Agresti.0 Table.1 is from an early study on the death penalty in Florida. Analyze these data and show that Simpson s Paradox occurs. Death Penalty Victim's
Unit 14: Nonparametric Statistical Methods
 Unit 14: Nonparametric Statistical Methods Statistics 571: Statistical Methods Ramón V. León 8/8/2003 Unit 14 - Stat 571 - Ramón V. León 1 Introductory Remarks Most methods studied so far have been based
11-2 Multinomial Experiment
 Chapter 11 Multinomial Experiments and Contingency Tables 1 Chapter 11 Multinomial Experiments and Contingency Tables 11-11 Overview 11-2 Multinomial Experiments: Goodness-of-fitfit 11-3 Contingency Tables:
n y π y (1 π) n y +ylogπ +(n y)log(1 π).
 n y +ylogπ +(n y)log(1 π).") Tests for a binomial probability π Let Y bin(n,π). The likelihood is L(π) = n y π y (1 π) n y and the log-likelihood is L(π) = log n y +ylogπ +(n y)log(1 π). So L (π) = y π n y 1 π. 1 Solving for π gives
Tests for a binomial probability π Let Y bin(n,π). The likelihood is L(π) = n y π y (1 π) n y and the log-likelihood is L(π) = log n y +ylogπ +(n y)log(1 π). So L (π) = y π n y 1 π. 1 Solving for π gives
Mathematical Notation Math Introduction to Applied Statistics
 Mathematical Notation Math 113 - Introduction to Applied Statistics Name : Use Word or WordPerfect to recreate the following documents. Each article is worth 10 points and should be emailed to the instructor
Two Correlated Proportions Non- Inferiority, Superiority, and Equivalence Tests
 Chapter 59 Two Correlated Proportions on- Inferiority, Superiority, and Equivalence Tests Introduction This chapter documents three closely related procedures: non-inferiority tests, superiority (by a
HYPOTHESIS TESTING: THE CHI-SQUARE STATISTIC
 1 HYPOTHESIS TESTING: THE CHI-SQUARE STATISTIC 7 steps of Hypothesis Testing 1. State the hypotheses 2. Identify level of significant 3. Identify the critical values 4. Calculate test statistics 5. Compare
LISA Short Course Series Generalized Linear Models (GLMs) & Categorical Data Analysis (CDA) in R. Liang (Sally) Shan Nov. 4, 2014
 & Categorical Data Analysis (CDA) in R. Liang (Sally) Shan Nov. 4, 2014") LISA Short Course Series Generalized Linear Models (GLMs) & Categorical Data Analysis (CDA) in R Liang (Sally) Shan Nov. 4, 2014 L Laboratory for Interdisciplinary Statistical Analysis LISA helps VT researchers
LISA Short Course Series Generalized Linear Models (GLMs) & Categorical Data Analysis (CDA) in R Liang (Sally) Shan Nov. 4, 2014 L Laboratory for Interdisciplinary Statistical Analysis LISA helps VT researchers
Formulas and Tables. for Elementary Statistics, Tenth Edition, by Mario F. Triola Copyright 2006 Pearson Education, Inc. ˆp E p ˆp E Proportion
 Formulas and Tables for Elementary Statistics, Tenth Edition, by Mario F. Triola Copyright 2006 Pearson Education, Inc. Ch. 3: Descriptive Statistics x Sf. x x Sf Mean S(x 2 x) 2 s Å n 2 1 n(sx 2 ) 2 (Sx)
An introduction to biostatistics: part 1
 An introduction to biostatistics: part 1 Cavan Reilly September 6, 2017 Table of contents Introduction to data analysis Uncertainty Probability Conditional probability Random variables Discrete random
Review of Statistics 101
 Review of Statistics 101 We review some important themes from the course 1. Introduction Statistics- Set of methods for collecting/analyzing data (the art and science of learning from data). Provides methods
Sociology 6Z03 Review II
 Sociology 6Z03 Review II John Fox McMaster University Fall 2016 John Fox (McMaster University) Sociology 6Z03 Review II Fall 2016 1 / 35 Outline: Review II Probability Part I Sampling Distributions Probability
Confidence Intervals, Testing and ANOVA Summary
 Confidence Intervals, Testing and ANOVA Summary 1 One Sample Tests 1.1 One Sample z test: Mean (σ known) Let X 1,, X n a r.s. from N(µ, σ) or n > 30. Let The test statistic is H 0 : µ = µ 0. z = x µ 0
Introduction to Survey Analysis!
 Introduction to Survey Analysis! Professor Ron Fricker! Naval Postgraduate School! Monterey, California! Reading Assignment:! 2/22/13 None! 1 Goals for this Lecture! Introduction to analysis for surveys!
STAT 705: Analysis of Contingency Tables
 STAT 705: Analysis of Contingency Tables Timothy Hanson Department of Statistics, University of South Carolina Stat 705: Analysis of Contingency Tables 1 / 45 Outline of Part I: models and parameters Basic
Statistics in medicine
 Statistics in medicine Lecture 3: Bivariate association : Categorical variables Proportion in one group One group is measured one time: z test Use the z distribution as an approximation to the binomial
TA: Sheng Zhgang (Th 1:20) / 342 (W 1:20) / 343 (W 2:25) / 344 (W 12:05) Haoyang Fan (W 1:20) / 346 (Th 12:05) FINAL EXAM
 / 342 (W 1:20) / 343 (W 2:25) / 344 (W 12:05) Haoyang Fan (W 1:20) / 346 (Th 12:05) FINAL EXAM") STAT 301, Fall 2011 Name Lec 4: Ismor Fischer Discussion Section: Please circle one! TA: Sheng Zhgang... 341 (Th 1:20) / 342 (W 1:20) / 343 (W 2:25) / 344 (W 12:05) Haoyang Fan... 345 (W 1:20) / 346 (Th
STAT 301, Fall 2011 Name Lec 4: Ismor Fischer Discussion Section: Please circle one! TA: Sheng Zhgang... 341 (Th 1:20) / 342 (W 1:20) / 343 (W 2:25) / 344 (W 12:05) Haoyang Fan... 345 (W 1:20) / 346 (Th
Harvard University. Rigorous Research in Engineering Education
 Statistical Inference Kari Lock Harvard University Department of Statistics Rigorous Research in Engineering Education 12/3/09 Statistical Inference You have a sample and want to use the data collected
Chapter 6 Estimation and Sample Sizes
 Chapter 6 Estimation and Sample Sizes This chapter presents the beginning of inferential statistics.! The two major applications of inferential statistics! Estimate the value of a population parameter!
We know from STAT.1030 that the relevant test statistic for equality of proportions is:
 2. Chi 2 -tests for equality of proportions Introduction: Two Samples Consider comparing the sample proportions p 1 and p 2 in independent random samples of size n 1 and n 2 out of two populations which
Mathematical Notation Math Introduction to Applied Statistics
 Mathematical Notation Math 113 - Introduction to Applied Statistics Name : Use Word or WordPerfect to recreate the following documents. Each article is worth 10 points and can be printed and given to the
Normal distribution We have a random sample from N(m, υ). The sample mean is Ȳ and the corrected sum of squares is S yy. After some simplification,
. The sample mean is Ȳ and the corrected sum of squares is S yy. After some simplification,") Likelihood Let P (D H) be the probability an experiment produces data D, given hypothesis H. Usually H is regarded as fixed and D variable. Before the experiment, the data D are unknown, and the probability
Likelihood Let P (D H) be the probability an experiment produces data D, given hypothesis H. Usually H is regarded as fixed and D variable. Before the experiment, the data D are unknown, and the probability
Summary of Chapters 7-9
 Summary of Chapters 7-9 Chapter 7. Interval Estimation 7.2. Confidence Intervals for Difference of Two Means Let X 1,, X n and Y 1, Y 2,, Y m be two independent random samples of sizes n and m from two
Lecture 14: Introduction to Poisson Regression
 Lecture 14: Introduction to Poisson Regression Ani Manichaikul amanicha@jhsph.edu 8 May 2007 1 / 52 Overview Modelling counts Contingency tables Poisson regression models 2 / 52 Modelling counts I Why
Modelling counts. Lecture 14: Introduction to Poisson Regression. Overview
 Modelling counts I Lecture 14: Introduction to Poisson Regression Ani Manichaikul amanicha@jhsph.edu Why count data? Number of traffic accidents per day Mortality counts in a given neighborhood, per week
Inference for Binomial Parameters
 Inference for Binomial Parameters Dipankar Bandyopadhyay, Ph.D. Department of Biostatistics, Virginia Commonwealth University D. Bandyopadhyay (VCU) BIOS 625: Categorical Data & GLM 1 / 58 Inference for
QUEEN S UNIVERSITY FINAL EXAMINATION FACULTY OF ARTS AND SCIENCE DEPARTMENT OF ECONOMICS APRIL 2018
 Page 1 of 4 QUEEN S UNIVERSITY FINAL EXAMINATION FACULTY OF ARTS AND SCIENCE DEPARTMENT OF ECONOMICS APRIL 2018 ECONOMICS 250 Introduction to Statistics Instructor: Gregor Smith Instructions: The exam
Statistics Handbook. All statistical tables were computed by the author.
 Statistics Handbook Contents Page Wilcoxon rank-sum test (Mann-Whitney equivalent) Wilcoxon matched-pairs test 3 Normal Distribution 4 Z-test Related samples t-test 5 Unrelated samples t-test 6 Variance
10: Crosstabs & Independent Proportions
 10: Crosstabs & Independent Proportions p. 10.1 P Background < Two independent groups < Binary outcome < Compare binomial proportions P Illustrative example ( oswege.sav ) < Food poisoning following church
Contingency Tables Part One 1
 Contingency Tables Part One 1 STA 312: Fall 2012 1 See last slide for copyright information. 1 / 32 Suggested Reading: Chapter 2 Read Sections 2.1-2.4 You are not responsible for Section 2.5 2 / 32 Overview
Difference Between Pair Differences v. 2 Samples
 1 Sectio1.1 Comparing Two Proportions Learning Objectives After this section, you should be able to DETERMINE whether the conditions for performing inference are met. CONSTRUCT and INTERPRET a confidence
Two-sample Categorical data: Testing
 Two-sample Categorical data: Testing Patrick Breheny April 1 Patrick Breheny Introduction to Biostatistics (171:161) 1/28 Separate vs. paired samples Despite the fact that paired samples usually offer
Review of One-way Tables and SAS
 Stat 504, Lecture 7 1 Review of One-way Tables and SAS In-class exercises: Ex1, Ex2, and Ex3 from http://v8doc.sas.com/sashtml/proc/z0146708.htm To calculate p-value for a X 2 or G 2 in SAS: http://v8doc.sas.com/sashtml/lgref/z0245929.htmz0845409
Hypothesis Testing hypothesis testing approach
 Hypothesis Testing In this case, we d be trying to form an inference about that neighborhood: Do people there shop more often those people who are members of the larger population To ascertain this, we
Chapter 10 Nonlinear Models
 Chapter 10 Nonlinear Models Nonlinear models can be classified into two categories. In the first category are models that are nonlinear in the variables, but still linear in terms of the unknown parameters.
Chapter 10. Discrete Data Analysis
 Chapter 1. Discrete Data Analysis 1.1 Inferences on a Population Proportion 1. Comparing Two Population Proportions 1.3 Goodness of Fit Tests for One-Way Contingency Tables 1.4 Testing for Independence
ij i j m ij n ij m ij n i j Suppose we denote the row variable by X and the column variable by Y ; We can then re-write the above expression as
 page1 Loglinear Models Loglinear models are a way to describe association and interaction patterns among categorical variables. They are commonly used to model cell counts in contingency tables. These
Quantitative Introduction ro Risk and Uncertainty in Business Module 5: Hypothesis Testing
 Quantitative Introduction ro Risk and Uncertainty in Business Module 5: Hypothesis Testing M. Vidyasagar Cecil & Ida Green Chair The University of Texas at Dallas Email: M.Vidyasagar@utdallas.edu October
STAT 135 Lab 6 Duality of Hypothesis Testing and Confidence Intervals, GLRT, Pearson χ 2 Tests and Q-Q plots. March 8, 2015
 STAT 135 Lab 6 Duality of Hypothesis Testing and Confidence Intervals, GLRT, Pearson χ 2 Tests and Q-Q plots March 8, 2015 The duality between CI and hypothesis testing The duality between CI and hypothesis
Statistics: revision
 NST 1B Experimental Psychology Statistics practical 5 Statistics: revision Rudolf Cardinal & Mike Aitken 29 / 30 April 2004 Department of Experimental Psychology University of Cambridge Handouts: Answers
Session 3 The proportional odds model and the Mann-Whitney test
 Session 3 The proportional odds model and the Mann-Whitney test 3.1 A unified approach to inference 3.2 Analysis via dichotomisation 3.3 Proportional odds 3.4 Relationship with the Mann-Whitney test Session
10.1. Comparing Two Proportions. Section 10.1
 /6/04 0. Comparing Two Proportions Sectio0. Comparing Two Proportions After this section, you should be able to DETERMINE whether the conditions for performing inference are met. CONSTRUCT and INTERPRET
STA Module 10 Comparing Two Proportions
 STA 2023 Module 10 Comparing Two Proportions Learning Objectives Upon completing this module, you should be able to: 1. Perform large-sample inferences (hypothesis test and confidence intervals) to compare
BIOS 6222: Biostatistics II. Outline. Course Presentation. Course Presentation. Review of Basic Concepts. Why Nonparametrics.
 BIOS 6222: Biostatistics II Instructors: Qingzhao Yu Don Mercante Cruz Velasco 1 Outline Course Presentation Review of Basic Concepts Why Nonparametrics The sign test 2 Course Presentation Contents Justification
Lecture Slides. Elementary Statistics Tenth Edition. by Mario F. Triola. and the Triola Statistics Series
 Lecture Slides Elementary Statistics Tenth Edition and the Triola Statistics Series by Mario F. Triola Slide 1 Chapter 7 Estimates and Sample Sizes 7-1 Overview 7-2 Estimating a Population Proportion 7-3
" M A #M B. Standard deviation of the population (Greek lowercase letter sigma) σ 2
 σ 2") Notation and Equations for Final Exam Symbol Definition X The variable we measure in a scientific study n The size of the sample N The size of the population M The mean of the sample µ The mean of the
Notation and Equations for Final Exam Symbol Definition X The variable we measure in a scientific study n The size of the sample N The size of the population M The mean of the sample µ The mean of the
Good Confidence Intervals for Categorical Data Analyses. Alan Agresti
 Good Confidence Intervals for Categorical Data Analyses Alan Agresti Department of Statistics, University of Florida visiting Statistics Department, Harvard University LSHTM, July 22, 2011 p. 1/36 Outline
Three-Way Contingency Tables
 Newsom PSY 50/60 Categorical Data Analysis, Fall 06 Three-Way Contingency Tables Three-way contingency tables involve three binary or categorical variables. I will stick mostly to the binary case to keep
CHAPTER 17 CHI-SQUARE AND OTHER NONPARAMETRIC TESTS FROM: PAGANO, R. R. (2007)
") FROM: PAGANO, R. R. (007) I. INTRODUCTION: DISTINCTION BETWEEN PARAMETRIC AND NON-PARAMETRIC TESTS Statistical inference tests are often classified as to whether they are parametric or nonparametric Parameter
FROM: PAGANO, R. R. (007) I. INTRODUCTION: DISTINCTION BETWEEN PARAMETRIC AND NON-PARAMETRIC TESTS Statistical inference tests are often classified as to whether they are parametric or nonparametric Parameter
15: CHI SQUARED TESTS
 15: CHI SQUARED ESS MULIPLE CHOICE QUESIONS In the following multiple choice questions, please circle the correct answer. 1. Which statistical technique is appropriate when we describe a single population
Introduction to Statistical Data Analysis Lecture 7: The Chi-Square Distribution
 Introduction to Statistical Data Analysis Lecture 7: The Chi-Square Distribution James V. Lambers Department of Mathematics The University of Southern Mississippi James V. Lambers Statistical Data Analysis
Epidemiology Wonders of Biostatistics Chapter 11 (continued) - probability in a single population. John Koval
 - probability in a single population. John Koval") Epidemiology 9509 Wonders of Biostatistics Chapter 11 (continued) - probability in a single population John Koval Department of Epidemiology and Biostatistics University of Western Ontario What is being
Epidemiology 9509 Wonders of Biostatistics Chapter 11 (continued) - probability in a single population John Koval Department of Epidemiology and Biostatistics University of Western Ontario What is being
Analysis of Categorical Data. Nick Jackson University of Southern California Department of Psychology 10/11/2013
 Analysis of Categorical Data Nick Jackson University of Southern California Department of Psychology 10/11/2013 1 Overview Data Types Contingency Tables Logit Models Binomial Ordinal Nominal 2 Things not
2.3 Analysis of Categorical Data
 90 CHAPTER 2. ESTIMATION AND HYPOTHESIS TESTING 2.3 Analysis of Categorical Data 2.3.1 The Multinomial Probability Distribution A mulinomial random variable is a generalization of the binomial rv. It results
Sections 3.4, 3.5. Timothy Hanson. Department of Statistics, University of South Carolina. Stat 770: Categorical Data Analysis
 Sections 3.4, 3.5 Timothy Hanson Department of Statistics, University of South Carolina Stat 770: Categorical Data Analysis 1 / 22 3.4 I J tables with ordinal outcomes Tests that take advantage of ordinal
Section 9.4. Notation. Requirements. Definition. Inferences About Two Means (Matched Pairs) Examples
 Examples") Objective Section 9.4 Inferences About Two Means (Matched Pairs) Compare of two matched-paired means using two samples from each population. Hypothesis Tests and Confidence Intervals of two dependent means
Objective Section 9.4 Inferences About Two Means (Matched Pairs) Compare of two matched-paired means using two samples from each population. Hypothesis Tests and Confidence Intervals of two dependent means
Cohen s s Kappa and Log-linear Models
 Cohen s s Kappa and Log-linear Models HRP 261 03/03/03 10-11 11 am 1. Cohen s Kappa Actual agreement = sum of the proportions found on the diagonals. π ii Cohen: Compare the actual agreement with the chance
STAT 135 Lab 11 Tests for Categorical Data (Fisher s Exact test, χ 2 tests for Homogeneity and Independence) and Linear Regression
 and Linear Regression") STAT 135 Lab 11 Tests for Categorical Data (Fisher s Exact test, χ 2 tests for Homogeneity and Independence) and Linear Regression Rebecca Barter April 20, 2015 Fisher s Exact Test Fisher s Exact Test
STAT 135 Lab 11 Tests for Categorical Data (Fisher s Exact test, χ 2 tests for Homogeneity and Independence) and Linear Regression Rebecca Barter April 20, 2015 Fisher s Exact Test Fisher s Exact Test
Practice Questions: Statistics W1111, Fall Solutions
 Practice Questions: Statistics W, Fall 9 Solutions Question.. The standard deviation of Z is 89... P(=6) =..3. is definitely inside of a 95% confidence interval for..4. (a) YES (b) YES (c) NO (d) NO Questions
STAT 536: Genetic Statistics
 STAT 536: Genetic Statistics Tests for Hardy Weinberg Equilibrium Karin S. Dorman Department of Statistics Iowa State University September 7, 2006 Statistical Hypothesis Testing Identify a hypothesis,
Medical statistics part I, autumn 2010: One sample test of hypothesis
 Medical statistics part I, autumn 2010: One sample test of hypothesis Eirik Skogvoll Consultant/ Professor Faculty of Medicine Dept. of Anaesthesiology and Emergency Medicine 1 What is a hypothesis test?
Institute of Actuaries of India
 Institute of Actuaries of India Subject CT3 Probability & Mathematical Statistics May 2011 Examinations INDICATIVE SOLUTION Introduction The indicative solution has been written by the Examiners with the
Multinomial Logistic Regression Models
 Stat 544, Lecture 19 1 Multinomial Logistic Regression Models Polytomous responses. Logistic regression can be extended to handle responses that are polytomous, i.e. taking r>2 categories. (Note: The word
Lecture 10: Introduction to Logistic Regression
 Lecture 10: Introduction to Logistic Regression Ani Manichaikul amanicha@jhsph.edu 2 May 2007 Logistic Regression Regression for a response variable that follows a binomial distribution Recall the binomial
ECLT 5810 Linear Regression and Logistic Regression for Classification. Prof. Wai Lam
 ECLT 5810 Linear Regression and Logistic Regression for Classification Prof. Wai Lam Linear Regression Models Least Squares Input vectors is an attribute / feature / predictor (independent variable) The
Stat 642, Lecture notes for 04/12/05 96
 Stat 642, Lecture notes for 04/12/05 96 Hosmer-Lemeshow Statistic The Hosmer-Lemeshow Statistic is another measure of lack of fit. Hosmer and Lemeshow recommend partitioning the observations into 10 equal
Binary response data
 Binary response data A Bernoulli trial is a random variable that has two points in its sample space. The two points may be denoted success/failure, heads/tails, yes/no, 0/1, etc. The probability distribution
Some comments on Partitioning
 Some comments on Partitioning Dipankar Bandyopadhyay Department of Biostatistics, Virginia Commonwealth University BIOS 625: Categorical Data & GLM 1/30 Partitioning Chi-Squares We have developed tests
Formulas and Tables by Mario F. Triola
 Copyright 010 Pearson Education, Inc. Ch. 3: Descriptive Statistics x f # x x f Mean 1x - x s - 1 n 1 x - 1 x s 1n - 1 s B variance s Ch. 4: Probability Mean (frequency table) Standard deviation P1A or
Central Limit Theorem ( 5.3)
") Central Limit Theorem ( 5.3) Let X 1, X 2,... be a sequence of independent random variables, each having n mean µ and variance σ 2. Then the distribution of the partial sum S n = X i i=1 becomes approximately
Central Limit Theorem ( 5.3) Let X 1, X 2,... be a sequence of independent random variables, each having n mean µ and variance σ 2. Then the distribution of the partial sum S n = X i i=1 becomes approximately
χ test statistics of 2.5? χ we see that: χ indicate agreement between the two sets of frequencies.
 I. T or F. (1 points each) 1. The χ -distribution is symmetric. F. The χ may be negative, zero, or positive F 3. The chi-square distribution is skewed to the right. T 4. The observed frequency of a cell
Inference for Categorical Data. Chi-Square Tests for Goodness of Fit and Independence
 Chi-Square Tests for Goodness of Fit and Independence Chi-Square Tests In this course, we use chi-square tests in two different ways The chi-square test for goodness-of-fit is used to determine whether
The t-distribution. Patrick Breheny. October 13. z tests The χ 2 -distribution The t-distribution Summary
 Patrick Breheny October 13 Patrick Breheny Biostatistical Methods I (BIOS 5710) 1/25 Introduction Introduction What s wrong with z-tests? So far we ve (thoroughly!) discussed how to carry out hypothesis
Lecture 01: Introduction
 Lecture 01: Introduction Dipankar Bandyopadhyay, Ph.D. BMTRY 711: Analysis of Categorical Data Spring 2011 Division of Biostatistics and Epidemiology Medical University of South Carolina Lecture 01: Introduction
Lecture 25. Ingo Ruczinski. November 24, Department of Biostatistics Johns Hopkins Bloomberg School of Public Health Johns Hopkins University
 Lecture 25 Department of Biostatistics Johns Hopkins Bloomberg School of Public Health Johns Hopkins University November 24, 2015 1 2 3 4 5 6 7 8 9 10 11 1 Hypothesis s of homgeneity 2 Estimating risk
Model Based Statistics in Biology. Part V. The Generalized Linear Model. Chapter 16 Introduction
 Model Based Statistics in Biology. Part V. The Generalized Linear Model. Chapter 16 Introduction ReCap. Parts I IV. The General Linear Model Part V. The Generalized Linear Model 16 Introduction 16.1 Analysis
7.2 One-Sample Correlation ( = a) Introduction. Correlation analysis measures the strength and direction of association between
 Introduction. Correlation analysis measures the strength and direction of association between") 7.2 One-Sample Correlation ( = a) Introduction Correlation analysis measures the strength and direction of association between variables. In this chapter we will test whether the population correlation
7.2 One-Sample Correlation ( = a) Introduction Correlation analysis measures the strength and direction of association between variables. In this chapter we will test whether the population correlation
Reports of the Institute of Biostatistics
 Reports of the Institute of Biostatistics No 02 / 2008 Leibniz University of Hannover Natural Sciences Faculty Title: Properties of confidence intervals for the comparison of small binomial proportions
Single Sample Means. SOCY601 Alan Neustadtl
 Single Sample Means SOCY601 Alan Neustadtl The Central Limit Theorem If we have a population measured by a variable with a mean µ and a standard deviation σ, and if all possible random samples of size