Bayesian Estimation of log N log S
|
|
|
- Laurence Morrison
- 6 years ago
- Views:
Transcription
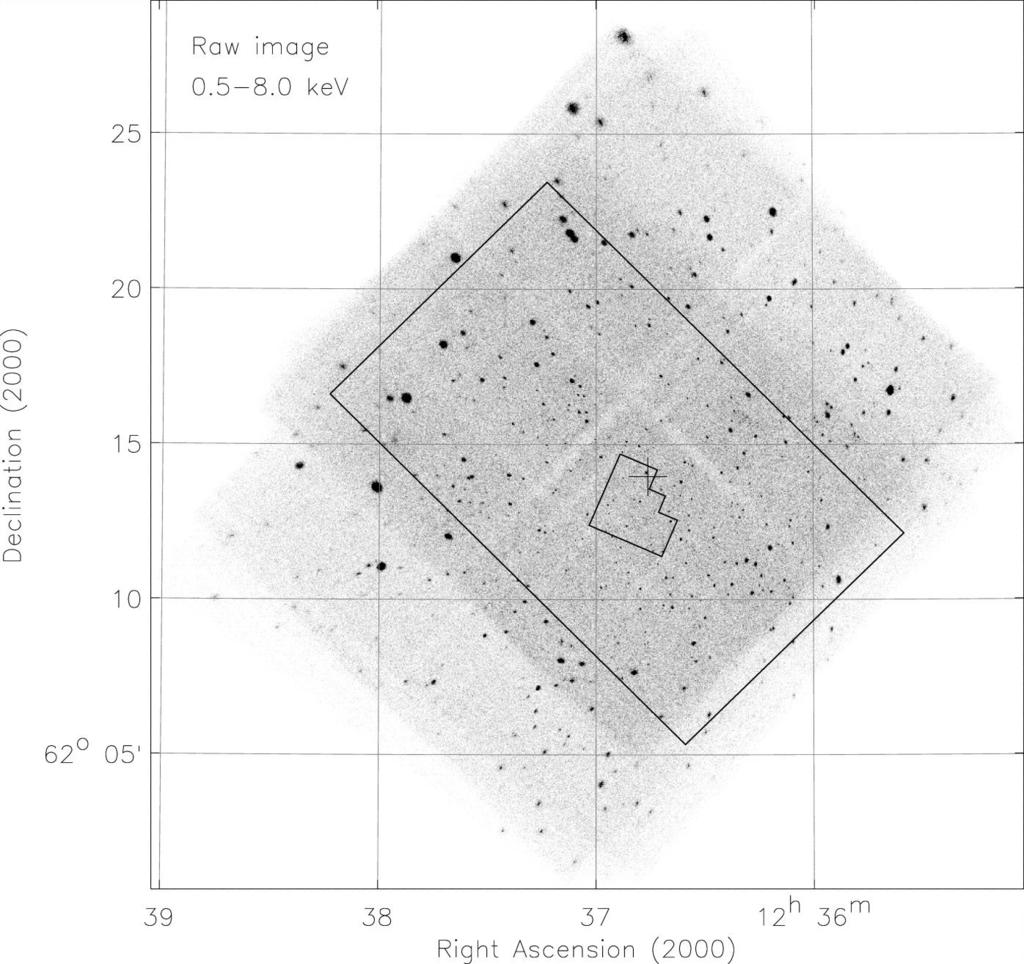
1 Bayesian Estimation of log N log S Paul Baines, Irina Udaltsova Department of Statistics University of California, Davis July 12th, 2011
2 Introduction What is log N log S? Cumulative number of sources detectable at a given sensitivity Defined as: N(> S) = i I {Si >S} i.e., the number of sources brighter than a threshold. Considering the distribution of sources, this is related to the survival function i.e., N(>S)=N (1-F(S)) log N log S refers to the relationship beween (or plot of) log 10 N(> S) and log 10 S. Why do we care? Constrains evolutionary models, dark matter distribution etc.
3
4
5 Inferential Process To infer the log N log S relationship there are a few steps: 1. Collect raw data images 2. Run a detection algorithm to extract sources 3. Produce a dataset describing the sources (and uncertainty about them) 4. Infer the log N log S distribution from this dataset Our analysis is focused on the final step accounting for some (but not all) of the detector-induced uncertainties...
6 Inferential Process To infer the log N log S relationship there are a few steps: 1. Collect raw data images 2. Run a detection algorithm to extract sources 3. Produce a dataset describing the sources (and uncertainty about them) 4. Infer the log N log S distribution from this dataset Our analysis is focused on the final step accounting for some (but not all) of the detector-induced uncertainties... Adding further layers to the analysis to start with raw images is possible but that is for a later time...
7 The Data The data is essentially just a list of photon counts with some extra information about the background and detector properties. Src_ID Count Src_area Bkg Off_axis Eff_area
8 Problems The photon counts do not directly correspond to the source fluxes: 1. Background contamination 2. Natural (Poisson) variability 3. Detector efficiencies (PSF etc.) Not all sources in the population will be detected: 1. Low intensity sources 2. Close to the limit: background, natural variability and detection probabilities are important.
9 Key Ideas Our goals: Provide a complete analysis, accounting for all detector effects (especially those leading to unobserved sources) Allow for the incorporation of prior information Investigate parametric forms (testing) for log N log S (e.g., broken power-laws) Investigate the data-prior inferential limit (e.g., for which Smin does the information come primarily from the model and not the data)
10 Missing Data Overview There are many potential causes of missing data in astronomical data: Background contamination (e.g., total=source+background) Low-count sources (below detection threshold) Detector schedules (source not within detector range) Foreground contamination (objects between the source and detector) etc. Some are more problematic than others...
11 Missing Data Mechanisms In the nicest possible case, if the particular data that is missing does not depend on any unobserved values then we can essentially ignore the missing data. In this context, whether a source is observed is a function of its source count (intensity) which is unobserved for unobserved sources. This missing data mechanism is non-ignorable, and needs to be carefully accounted for in the analysis.
12 The Model N NegBinom (α, β), S i S min, θ iid Pareto (θ, S min ), i = 1,..., N, θ Gamma(a, b), Y src i S i, L i, E i iid Pois (λ(si, L i, E i )), Y bkg i L i, E i iid Pois (k(li, E i )), I i Bernoulli (g (S i, L i, E i )).
13 The Model It turns out that in many contexts there is strong theory that expects the log N log S to obey a Power law: N(> S) = N I {Si >S} αs θ, S > S min i=1 Taking the logarithm gives the linear log(n) log(s) relationship. The power-law relationship defines the marginal survival function of the population, and the marginal distribution of flux can be seen to be a Pareto distribution: S i S min, θ iid Pareto (θ, S min ), i = 1,..., N. The analyst must specify S min, a threshold above which we seek to estimate θ.
14 The Model cont... The total number of sources (unobserved and observed), denoted by N, is modeled as: N NegBinom (α, β), We observe photon counts contaminated with background noise and other detector effects, Yi tot = Yi src + Y bkg i, Y src i S i, L i, E i iid Pois (λ(si, L i, E i )), Y bkg i L i, E i iid Pois (k(li, E i )). The functions λ and k represent the intensity of source and background, respectively, for a given flux S i, location L i and effective exposure time E i.
15 The Model cont... The probability of a source being detected, g (S i, L i, E i ), is determined by the detector sensitivity, background and detection method. The marginal detection probability as a function of θ is defined as: π(θ) = g(s i, L i, E i ) p(s i θ) p(l i, E i ) ds i de i dl i. The prior on θ is assumed to be: θ Gamma(a, b).
16 The Model cont... The posterior distribution, marginalizing over the unobserved fluxes, can be shown to be: p ( N, θ, S obs Yobs src ) tot n, Yobs p ( N, θ, S obs, S mis, Y src obs, Y src mis, Y tot p (N) p (θ) p (n N, θ) p (S obs n, θ) p ( Yobs tot n, S ) ( obs p Y src tot obs n, Yobs, S obs). mis n, Yobs tot ) dy src mis dy tot mis ds mis
17 The Model N NegBinom (α, β), S i S min, θ iid Pareto (θ, S min ), i = 1,..., N, θ Gamma(a, b), Y src i S i, L i, E i iid Pois (λ(si, L i, E i )), Y bkg i L i, E i iid Pois (k(li, E i )), I i Bernoulli (g (S i, L i, E i )).
18 Computational Details The Gibbs sampler consists of four steps: [ Y src obs n, Yobs tot ] [, S obs, Sobs n, Yobs tot, Yobs, src θ ], [θ n, N, S obs ], [N n, θ]. Sample the observed photon counts: Y src obs,i n, Y tot obs,i, S obs,i Binom for i = 1,..., n. ( Y tot obs,i, ) λ(s obs,i, L obs,i, E obs,i ), λ(s obs,i, L obs,i, E obs,i ) + k Sample the fluxes S obs,i, i = 1,..., n (MH using a t proposal). Sample the power-law slope θ (MH using a t proposal). Compute the posterior distribution for the total number of sources, N, using numerical integration: ( ) N Γ(N + α) 1 π(θ) p(n n, θ) I{N n} Γ(N n + 1) β + 1 Note: The (prior) marginal detection probability π(θ) is pre-computed via the numerical integration.
19 Computational Notes Some important things to note: Computation is fast (secs), and insensitive to the number of missing sources The fluxes of the missing sources are never imputed (only the number of missing sources) Most steps are not in closed form changing (some) assumptions has little computation impact Broken power law (or other forms) can be implemented by changing only one of the steps Fluxes of missing sources can (optionally) be imputed to produce posterior draws of a corrected log N log S
20 RED = Missing sources, BLACK = Observed sources.
21 Future Work We currently do not include: 1. False sources (allowing that observed sources might actually be background/artificial) 2. Spatially varying detection probabilities (straightforward, needs implementing)
22 Simulated Example Assume parameter setting: N NegBinom(α, β), where α = 200 = shape, β = 2 = scale θ Gamma(a, b), where a = 20 = shape, b = 1/20 = scale S i θ Pareto(θ, S min ), where S min = Yi src S i, L i, E i Pois(λ(S i, L i, E i )) Y bkg i S i, L i, E i Pois(k(L i, E i )) λ = S i E i γ, where effective area E i (1, 000, 100, 000), and the energy per photon γ = k i = z E i, where the rate of background photon count intensity per million seconds z = n iter = 21, 000, Burnin = 1000
23 Simulated Example cont... Detection probability: g(λ, k) = 1.0 a 0 (λ + k) a1 e a 2 (λ+k), where a 0 = 11.12, a 1 = 0.83, a 2 = 0.43 Marginal detection probability:
24 Empirical results of MCMC sampler The actual coverage of nominal percentiles for all parameters for simulated data, for M = 200 validation datasets: Coverage Percentile 50% 80% 90% 95% 98% 99% 99.9% N θ all S obs Mean squared error of different estimators for N and θ for simulated data. MSE N θ Level of Effective Area Median Mean Median Mean Low Medium High
25 MCMC Draws

26 Posterior Correlations Posterior estimates for the power-law slope and the total number of sources.
27 MCMC Draws
28 Simulated log N log S Uncertainties in source fluxes and a display of the power-law relationship. Posterior draws (gray), truth (blue).
29 The Data Src_ID Count Src_area Bkg Off_axis Eff_area
30 Posteriors of parameters N and θ Zezas et al. (2003) estimated a power-law slope of ˆθ = The posterior median from our analysis is θ = 0.38, with the 95% posterior interval consistent with competing estimators.
31 Note: This a posterior plot for the observed sources only (the corrected plot would be more useful... ) Evidence of a possible break in the power-law in the observed log N log S. Given the possible non-linearity of the log(n) log(s), more work is needed to allow for a broken power-law or more general parametric forms.
32 References A. Zezas et al. (2004) Chandra survey of the Bar region of the SMC Revista Mexicana de Astronoma y Astrofsica (Serie de Conferencias) Vol. 20. IAU Colloquium 194, pp R.J.A. Little, D.B. Rubin. (2002) Statistical analysis with missing data, Wiley.
Bayesian Estimation of log N log S
 Bayesian Estimation of log N log S Paul D. Baines Department of Statistics University of California, Davis May 10th, 2013 Introduction Project Goals Develop a comprehensive method to infer (properties
Bayesian Modeling of log N log S
 Bayesian Modeling of log N log S Irina S Udaltsova Vasileios Stampoulis Department of Statistics University of California, Davis July 26th, 2016 1 / 44 Introduction Scientific Objectives: Develop a comprehensive
Ages of stellar populations from color-magnitude diagrams. Paul Baines. September 30, 2008
 Ages of stellar populations from color-magnitude diagrams Paul Baines Department of Statistics Harvard University September 30, 2008 Context & Example Welcome! Today we will look at using hierarchical
Fitting Narrow Emission Lines in X-ray Spectra
 Outline Fitting Narrow Emission Lines in X-ray Spectra Taeyoung Park Department of Statistics, University of Pittsburgh October 11, 2007 Outline of Presentation Outline This talk has three components:
Luminosity Functions
 Department of Statistics, Harvard University May 15th, 2012 Introduction: What is a Luminosity Function? Figure: A galaxy cluster. Introduction: Project Goal The Luminosity Function specifies the relative
Accounting for Calibration Uncertainty in Spectral Analysis. David A. van Dyk
 Accounting for in Spectral Analysis David A van Dyk Statistics Section, Imperial College London Joint work with Vinay Kashyap, Jin Xu, Alanna Connors, and Aneta Siegminowska IACHEC March 2013 David A van
Bayesian Computation in Color-Magnitude Diagrams
 Bayesian Computation in Color-Magnitude Diagrams SA, AA, PT, EE, MCMC and ASIS in CMDs Paul Baines Department of Statistics Harvard University October 19, 2009 Overview Motivation and Introduction Modelling
Statistical Tools and Techniques for Solar Astronomers
 Statistical Tools and Techniques for Solar Astronomers Alexander W Blocker Nathan Stein SolarStat 2012 Outline Outline 1 Introduction & Objectives 2 Statistical issues with astronomical data 3 Example:
Two Statistical Problems in X-ray Astronomy
 Two Statistical Problems in X-ray Astronomy Alexander W Blocker October 21, 2008 Outline 1 Introduction 2 Replacing stacking Problem Current method Model Further development 3 Time symmetry Problem Model
Accounting for Calibration Uncertainty in Spectral Analysis. David A. van Dyk
 Bayesian Analysis of Accounting for in Spectral Analysis David A van Dyk Statistics Section, Imperial College London Joint work with Vinay Kashyap, Jin Xu, Alanna Connors, and Aneta Siegminowska ISIS May
Measurement Error and Linear Regression of Astronomical Data. Brandon Kelly Penn State Summer School in Astrostatistics, June 2007
 Measurement Error and Linear Regression of Astronomical Data Brandon Kelly Penn State Summer School in Astrostatistics, June 2007 Classical Regression Model Collect n data points, denote i th pair as (η
Parameter Estimation. William H. Jefferys University of Texas at Austin Parameter Estimation 7/26/05 1
 Parameter Estimation William H. Jefferys University of Texas at Austin bill@bayesrules.net Parameter Estimation 7/26/05 1 Elements of Inference Inference problems contain two indispensable elements: Data
Accounting for Calibration Uncertainty
 : High Energy Astrophysics and the PCG Sampler 1 Vinay Kashyap 2 Taeyoung Park 3 Jin Xu 4 Imperial-California-Harvard AstroStatistics Collaboration 1 Statistics Section, Imperial College London 2 Smithsonian
Markov Chain Monte Carlo methods
 Markov Chain Monte Carlo methods By Oleg Makhnin 1 Introduction a b c M = d e f g h i 0 f(x)dx 1.1 Motivation 1.1.1 Just here Supresses numbering 1.1.2 After this 1.2 Literature 2 Method 2.1 New math As
Overlapping Astronomical Sources: Utilizing Spectral Information
 Overlapping Astronomical Sources: Utilizing Spectral Information David Jones Advisor: Xiao-Li Meng Collaborators: Vinay Kashyap (CfA) and David van Dyk (Imperial College) CHASC Astrostatistics Group April
Statistical Practice
 Statistical Practice A Note on Bayesian Inference After Multiple Imputation Xiang ZHOU and Jerome P. REITER This article is aimed at practitioners who plan to use Bayesian inference on multiply-imputed
EM Algorithm II. September 11, 2018
 EM Algorithm II September 11, 2018 Review EM 1/27 (Y obs, Y mis ) f (y obs, y mis θ), we observe Y obs but not Y mis Complete-data log likelihood: l C (θ Y obs, Y mis ) = log { f (Y obs, Y mis θ) Observed-data
Parameter Estimation
 Parameter Estimation Chapters 13-15 Stat 477 - Loss Models Chapters 13-15 (Stat 477) Parameter Estimation Brian Hartman - BYU 1 / 23 Methods for parameter estimation Methods for parameter estimation Methods
New Results of Fully Bayesian
 UCI April 3, 2012 Calibration Samples Principle Component Analysis Model Building Three source parameter sampling schemes Simulation Quasar data sets Speed Up Pragmatic Bayesian Method Frequency Analysis
Fitting Narrow Emission Lines in X-ray Spectra
 Fitting Narrow Emission Lines in X-ray Spectra Taeyoung Park Department of Statistics, Harvard University October 25, 2005 X-ray Spectrum Data Description Statistical Model for the Spectrum Quasars are
Bayesian Statistical Methods. Jeff Gill. Department of Political Science, University of Florida
 Bayesian Statistical Methods Jeff Gill Department of Political Science, University of Florida 234 Anderson Hall, PO Box 117325, Gainesville, FL 32611-7325 Voice: 352-392-0262x272, Fax: 352-392-8127, Email:
Bayesian model selection for computer model validation via mixture model estimation
 Bayesian model selection for computer model validation via mixture model estimation Kaniav Kamary ATER, CNAM Joint work with É. Parent, P. Barbillon, M. Keller and N. Bousquet Outline Computer model validation
A Note on Bayesian Inference After Multiple Imputation
 A Note on Bayesian Inference After Multiple Imputation Xiang Zhou and Jerome P. Reiter Abstract This article is aimed at practitioners who plan to use Bayesian inference on multiplyimputed datasets in
Bayesian Methods for Machine Learning
 Bayesian Methods for Machine Learning CS 584: Big Data Analytics Material adapted from Radford Neal s tutorial (http://ftp.cs.utoronto.ca/pub/radford/bayes-tut.pdf), Zoubin Ghahramni (http://hunch.net/~coms-4771/zoubin_ghahramani_bayesian_learning.pdf),
Likelihood-based inference with missing data under missing-at-random
 Likelihood-based inference with missing data under missing-at-random Jae-kwang Kim Joint work with Shu Yang Department of Statistics, Iowa State University May 4, 014 Outline 1. Introduction. Parametric
Bayesian Inference in Astronomy & Astrophysics A Short Course
 Bayesian Inference in Astronomy & Astrophysics A Short Course Tom Loredo Dept. of Astronomy, Cornell University p.1/37 Five Lectures Overview of Bayesian Inference From Gaussians to Periodograms Learning
Bayesian nonparametric estimation of finite population quantities in absence of design information on nonsampled units
 Bayesian nonparametric estimation of finite population quantities in absence of design information on nonsampled units Sahar Z Zangeneh Robert W. Keener Roderick J.A. Little Abstract In Probability proportional
Part 8: GLMs and Hierarchical LMs and GLMs
 Part 8: GLMs and Hierarchical LMs and GLMs 1 Example: Song sparrow reproductive success Arcese et al., (1992) provide data on a sample from a population of 52 female song sparrows studied over the course
A Course in Applied Econometrics Lecture 18: Missing Data. Jeff Wooldridge IRP Lectures, UW Madison, August Linear model with IVs: y i x i u i,
 A Course in Applied Econometrics Lecture 18: Missing Data Jeff Wooldridge IRP Lectures, UW Madison, August 2008 1. When Can Missing Data be Ignored? 2. Inverse Probability Weighting 3. Imputation 4. Heckman-Type
Health utilities' affect you are reported alongside underestimates of uncertainty
 Dr. Kelvin Chan, Medical Oncologist, Associate Scientist, Odette Cancer Centre, Sunnybrook Health Sciences Centre and Dr. Eleanor Pullenayegum, Senior Scientist, Hospital for Sick Children Title: Underestimation
Basics of Modern Missing Data Analysis
 Basics of Modern Missing Data Analysis Kyle M. Lang Center for Research Methods and Data Analysis University of Kansas March 8, 2013 Topics to be Covered An introduction to the missing data problem Missing
Histograms, Central Tendency, and Variability
 The Economist, September 6, 214 1 Histograms, Central Tendency, and Variability Lecture 2 Reading: Sections 5 5.6 Includes ALL margin notes and boxes: For Example, Guided Example, Notation Alert, Just
Ridge regression. Patrick Breheny. February 8. Penalized regression Ridge regression Bayesian interpretation
 Patrick Breheny February 8 Patrick Breheny High-Dimensional Data Analysis (BIOS 7600) 1/27 Introduction Basic idea Standardization Large-scale testing is, of course, a big area and we could keep talking
Statistics for extreme & sparse data
 Statistics for extreme & sparse data University of Bath December 6, 2018 Plan 1 2 3 4 5 6 The Problem Climate Change = Bad! 4 key problems Volcanic eruptions/catastrophic event prediction. Windstorms
Spatial Statistics Chapter 4 Basics of Bayesian Inference and Computation
 Spatial Statistics Chapter 4 Basics of Bayesian Inference and Computation So far we have discussed types of spatial data, some basic modeling frameworks and exploratory techniques. We have not discussed
Learning the hyper-parameters. Luca Martino
 Learning the hyper-parameters Luca Martino 2017 2017 1 / 28 Parameters and hyper-parameters 1. All the described methods depend on some choice of hyper-parameters... 2. For instance, do you recall λ (bandwidth
Stat 542: Item Response Theory Modeling Using The Extended Rank Likelihood
 Stat 542: Item Response Theory Modeling Using The Extended Rank Likelihood Jonathan Gruhl March 18, 2010 1 Introduction Researchers commonly apply item response theory (IRT) models to binary and ordinal
Business Statistics. Lecture 10: Course Review
 Business Statistics Lecture 10: Course Review 1 Descriptive Statistics for Continuous Data Numerical Summaries Location: mean, median Spread or variability: variance, standard deviation, range, percentiles,
Fully Bayesian Analysis of Calibration Uncertainty In High Energy Spectral Analysis
 In High Energy Spectral Analysis Department of Statistics, UCI February 26, 2013 Model Building Principle Component Analysis Three Inferencial Models Simulation Quasar Analysis Doubly-intractable Distribution
New Bayesian methods for model comparison
 Back to the future New Bayesian methods for model comparison Murray Aitkin murray.aitkin@unimelb.edu.au Department of Mathematics and Statistics The University of Melbourne Australia Bayesian Model Comparison
Approximate Bayesian computation for spatial extremes via open-faced sandwich adjustment
 Approximate Bayesian computation for spatial extremes via open-faced sandwich adjustment Ben Shaby SAMSI August 3, 2010 Ben Shaby (SAMSI) OFS adjustment August 3, 2010 1 / 29 Outline 1 Introduction 2 Spatial
ICML Scalable Bayesian Inference on Point processes. with Gaussian Processes. Yves-Laurent Kom Samo & Stephen Roberts
 ICML 2015 Scalable Nonparametric Bayesian Inference on Point Processes with Gaussian Processes Machine Learning Research Group and Oxford-Man Institute University of Oxford July 8, 2015 Point Processes
Stats 579 Intermediate Bayesian Modeling. Assignment # 2 Solutions
 Stats 579 Intermediate Bayesian Modeling Assignment # 2 Solutions 1. Let w Gy) with y a vector having density fy θ) and G having a differentiable inverse function. Find the density of w in general and
Fractional Imputation in Survey Sampling: A Comparative Review
 Fractional Imputation in Survey Sampling: A Comparative Review Shu Yang Jae-Kwang Kim Iowa State University Joint Statistical Meetings, August 2015 Outline Introduction Fractional imputation Features Numerical
arxiv: v5 [stat.me] 13 Feb 2018
![arxiv: v5 [stat.me] 13 Feb 2018](/thumbs/77/75239018.jpg "arxiv: v5 [stat.me] 13 Feb 2018") arxiv: arxiv:1602.07933 BOOTSTRAP INFERENCE WHEN USING MULTIPLE IMPUTATION By Michael Schomaker and Christian Heumann University of Cape Town and Ludwig-Maximilians Universität München arxiv:1602.07933v5
arxiv: arxiv:1602.07933 BOOTSTRAP INFERENCE WHEN USING MULTIPLE IMPUTATION By Michael Schomaker and Christian Heumann University of Cape Town and Ludwig-Maximilians Universität München arxiv:1602.07933v5
DS-GA 1002 Lecture notes 11 Fall Bayesian statistics
 DS-GA 100 Lecture notes 11 Fall 016 Bayesian statistics In the frequentist paradigm we model the data as realizations from a distribution that depends on deterministic parameters. In contrast, in Bayesian
Inference for a Population Proportion
 Al Nosedal. University of Toronto. November 11, 2015 Statistical inference is drawing conclusions about an entire population based on data in a sample drawn from that population. From both frequentist
BAYESIAN METHODS FOR VARIABLE SELECTION WITH APPLICATIONS TO HIGH-DIMENSIONAL DATA
 BAYESIAN METHODS FOR VARIABLE SELECTION WITH APPLICATIONS TO HIGH-DIMENSIONAL DATA Intro: Course Outline and Brief Intro to Marina Vannucci Rice University, USA PASI-CIMAT 04/28-30/2010 Marina Vannucci
A note on multiple imputation for general purpose estimation
 A note on multiple imputation for general purpose estimation Shu Yang Jae Kwang Kim SSC meeting June 16, 2015 Shu Yang, Jae Kwang Kim Multiple Imputation June 16, 2015 1 / 32 Introduction Basic Setup Assume
Chapter 9: Interval Estimation and Confidence Sets Lecture 16: Confidence sets and credible sets
 Chapter 9: Interval Estimation and Confidence Sets Lecture 16: Confidence sets and credible sets Confidence sets We consider a sample X from a population indexed by θ Θ R k. We are interested in ϑ, a vector-valued
Special Topic: Bayesian Finite Population Survey Sampling
 Special Topic: Bayesian Finite Population Survey Sampling Sudipto Banerjee Division of Biostatistics School of Public Health University of Minnesota April 2, 2008 1 Special Topic Overview Scientific survey
Module 6: Introduction to Gibbs Sampling. Rebecca C. Steorts
 Module 6: Introduction to Gibbs Sampling Rebecca C. Steorts Agenda Gibbs sampling Exponential example Normal example Pareto example Gibbs sampler Suppose p(x, y) is a p.d.f. or p.m.f. that is difficult
Probabilistic Inference for Multiple Testing
 This is the title page! This is the title page! Probabilistic Inference for Multiple Testing Chuanhai Liu and Jun Xie Department of Statistics, Purdue University, West Lafayette, IN 47907. E-mail: chuanhai,
Estimating the Size of Hidden Populations using Respondent-Driven Sampling Data
 Estimating the Size of Hidden Populations using Respondent-Driven Sampling Data Mark S. Handcock Krista J. Gile Department of Statistics Department of Mathematics University of California University of
Quantile POD for Hit-Miss Data
 Quantile POD for Hit-Miss Data Yew-Meng Koh a and William Q. Meeker a a Center for Nondestructive Evaluation, Department of Statistics, Iowa State niversity, Ames, Iowa 50010 Abstract. Probability of detection
Embedding Astronomical Computer Models into Principled Statistical Analyses. David A. van Dyk
 Embedding Astronomical Computer Models into Principled Statistical Analyses Statistics Section, Imperial College London University of New South Wales, January 2012 Outline 1 2 Model for 3 Computer Models
Bayesian Inference for Discretely Sampled Diffusion Processes: A New MCMC Based Approach to Inference
 Bayesian Inference for Discretely Sampled Diffusion Processes: A New MCMC Based Approach to Inference Osnat Stramer 1 and Matthew Bognar 1 Department of Statistics and Actuarial Science, University of
Miscellanea A note on multiple imputation under complex sampling
 Biometrika (2017), 104, 1,pp. 221 228 doi: 10.1093/biomet/asw058 Printed in Great Britain Advance Access publication 3 January 2017 Miscellanea A note on multiple imputation under complex sampling BY J.
CTDL-Positive Stable Frailty Model
 CTDL-Positive Stable Frailty Model M. Blagojevic 1, G. MacKenzie 2 1 Department of Mathematics, Keele University, Staffordshire ST5 5BG,UK and 2 Centre of Biostatistics, University of Limerick, Ireland
(5) Multi-parameter models - Gibbs sampling. ST440/540: Applied Bayesian Analysis
 Multi-parameter models - Gibbs sampling. ST440/540: Applied Bayesian Analysis") Summarizing a posterior Given the data and prior the posterior is determined Summarizing the posterior gives parameter estimates, intervals, and hypothesis tests Most of these computations are integrals
Summarizing a posterior Given the data and prior the posterior is determined Summarizing the posterior gives parameter estimates, intervals, and hypothesis tests Most of these computations are integrals
Last lecture 1/35. General optimization problems Newton Raphson Fisher scoring Quasi Newton
 EM Algorithm Last lecture 1/35 General optimization problems Newton Raphson Fisher scoring Quasi Newton Nonlinear regression models Gauss-Newton Generalized linear models Iteratively reweighted least squares
Fully Bayesian Analysis of Low-Count Astronomical Images
 Fully Bayesian Analysis of Low-Count Astronomical Images 1 Alanna Connors 2 1 Department of Statistics University of California, Irvine 2 Eurika Scientific Thanks to James Chiang, Adam Roy, and The California
Bayesian Inference Technique for Data mining for Yield Enhancement in Semiconductor Manufacturing Data
 Bayesian Inference Technique for Data mining for Yield Enhancement in Semiconductor Manufacturing Data Presenter: M. Khakifirooz Co-authors: C-F Chien, Y-J Chen National Tsing Hua University ISMI 2015,
6 Pattern Mixture Models
 6 Pattern Mixture Models A common theme underlying the methods we have discussed so far is that interest focuses on making inference on parameters in a parametric or semiparametric model for the full data
A Bayesian Nonparametric Approach to Monotone Missing Data in Longitudinal Studies with Informative Missingness
 A Bayesian Nonparametric Approach to Monotone Missing Data in Longitudinal Studies with Informative Missingness A. Linero and M. Daniels UF, UT-Austin SRC 2014, Galveston, TX 1 Background 2 Working model
Learning Objectives for Stat 225
 Learning Objectives for Stat 225 08/20/12 Introduction to Probability: Get some general ideas about probability, and learn how to use sample space to compute the probability of a specific event. Set Theory:
27 : Distributed Monte Carlo Markov Chain. 1 Recap of MCMC and Naive Parallel Gibbs Sampling
 10-708: Probabilistic Graphical Models 10-708, Spring 2014 27 : Distributed Monte Carlo Markov Chain Lecturer: Eric P. Xing Scribes: Pengtao Xie, Khoa Luu In this scribe, we are going to review the Parallel
Bayesian inference for multivariate extreme value distributions
 Bayesian inference for multivariate extreme value distributions Sebastian Engelke Clément Dombry, Marco Oesting Toronto, Fields Institute, May 4th, 2016 Main motivation For a parametric model Z F θ of
Advanced Statistical Computing
 Advanced Statistical Computing Fall 206 Steve Qin Outline Collapsing, predictive updating Sequential Monte Carlo 2 Collapsing and grouping Want to sample from = Regular Gibbs sampler: Sample t+ from π
Fractional Hot Deck Imputation for Robust Inference Under Item Nonresponse in Survey Sampling
 Fractional Hot Deck Imputation for Robust Inference Under Item Nonresponse in Survey Sampling Jae-Kwang Kim 1 Iowa State University June 26, 2013 1 Joint work with Shu Yang Introduction 1 Introduction
Statistics & Data Sciences: First Year Prelim Exam May 2018
 Statistics & Data Sciences: First Year Prelim Exam May 2018 Instructions: 1. Do not turn this page until instructed to do so. 2. Start each new question on a new sheet of paper. 3. This is a closed book
Probability Distributions Columns (a) through (d)
 through (d)") Discrete Probability Distributions Columns (a) through (d) Probability Mass Distribution Description Notes Notation or Density Function --------------------(PMF or PDF)-------------------- (a) (b) (c)
Discrete Probability Distributions Columns (a) through (d) Probability Mass Distribution Description Notes Notation or Density Function --------------------(PMF or PDF)-------------------- (a) (b) (c)
Plausible Values for Latent Variables Using Mplus
 Plausible Values for Latent Variables Using Mplus Tihomir Asparouhov and Bengt Muthén August 21, 2010 1 1 Introduction Plausible values are imputed values for latent variables. All latent variables can
Simulating Random Variables
 Simulating Random Variables Timothy Hanson Department of Statistics, University of South Carolina Stat 740: Statistical Computing 1 / 23 R has many built-in random number generators... Beta, gamma (also
Sequential Monte Carlo Methods for Bayesian Model Selection in Positron Emission Tomography
 Methods for Bayesian Model Selection in Positron Emission Tomography Yan Zhou John A.D. Aston and Adam M. Johansen 6th January 2014 Y. Zhou J. A. D. Aston and A. M. Johansen Outline Positron emission tomography
X-ray Dark Sources Detection
 X-ray Dark Sources Detection Lazhi Wang Department of Statistics, Harvard University Nov. 5th, 2013 1 / 19 Data Y i, background contaminated photon counts in a source exposure over T = 48984.8 seconds
Machine learning: Hypothesis testing. Anders Hildeman
 Location of trees 0 Observed trees 50 100 150 200 250 300 350 400 450 500 0 100 200 300 400 500 600 700 800 900 1000 Figur: Observed points pattern of the tree specie Beilschmiedia pendula. Location of
Reconstruction of individual patient data for meta analysis via Bayesian approach
 Reconstruction of individual patient data for meta analysis via Bayesian approach Yusuke Yamaguchi, Wataru Sakamoto and Shingo Shirahata Graduate School of Engineering Science, Osaka University Masashi
Embedding Supernova Cosmology into a Bayesian Hierarchical Model
 1 / 41 Embedding Supernova Cosmology into a Bayesian Hierarchical Model Xiyun Jiao Statistic Section Department of Mathematics Imperial College London Joint work with David van Dyk, Roberto Trotta & Hikmatali
CSC321 Lecture 18: Learning Probabilistic Models
 CSC321 Lecture 18: Learning Probabilistic Models Roger Grosse Roger Grosse CSC321 Lecture 18: Learning Probabilistic Models 1 / 25 Overview So far in this course: mainly supervised learning Language modeling
Introduction to Bayesian Inference: Supplemental Topics
 Introduction to Bayesian Inference: Supplemental Topics Tom Loredo Dept. of Astronomy, Cornell University http://www.astro.cornell.edu/staff/loredo/bayes/ CASt Summer School 5 June 2014 1/42 Supplemental
Linear Regression. Data Model. β, σ 2. Process Model. ,V β. ,s 2. s 1. Parameter Model
 Regression: Part II Linear Regression y~n X, 2 X Y Data Model β, σ 2 Process Model Β 0,V β s 1,s 2 Parameter Model Assumptions of Linear Model Homoskedasticity No error in X variables Error in Y variables
Measurement error as missing data: the case of epidemiologic assays. Roderick J. Little
 Measurement error as missing data: the case of epidemiologic assays Roderick J. Little Outline Discuss two related calibration topics where classical methods are deficient (A) Limit of quantification methods
Embedding Astronomical Computer Models into Complex Statistical Models. David A. van Dyk
 Embedding Astronomical Computer Models into Comple Statistical Models Statistics Section, Imperial College London UCLA, February 2012 Comple Analyses with Computer Models in Astronomy Outline Computer
ntopic Organic Traffic Study
 ntopic Organic Traffic Study 1 Abstract The objective of this study is to determine whether content optimization solely driven by ntopic recommendations impacts organic search traffic from Google. The
PARAMETER ESTIMATION: BAYESIAN APPROACH. These notes summarize the lectures on Bayesian parameter estimation.
 PARAMETER ESTIMATION: BAYESIAN APPROACH. These notes summarize the lectures on Bayesian parameter estimation.. Beta Distribution We ll start by learning about the Beta distribution, since we end up using
Parametric fractional imputation for missing data analysis
 1 2 3 4 5 6 7 8 9 10 11 12 13 14 15 16 17 18 19 20 21 22 23 24 25 26 27 28 29 30 31 32 33 34 35 36 37 38 39 40 41 42 43 44 45 46 47 48 Biometrika (????),??,?, pp. 1 15 C???? Biometrika Trust Printed in
How to Win With Poisson Data: Imaging Gamma-Rays. A. Connors, Eureka Scientific, CHASC, SAMSI06 SaFDe
 How to Win With Poisson Data: Imaging Gamma-Rays A. Connors, Eureka Scientific, CHASC, SAMSI06 SaFDe 1 All-Sky Map > 1 GeV Photons 9 years of CGRO/EGRET 2 3 Model of Diffuse Emission along Galactic Plane:
Bayesian inference for factor scores
 Bayesian inference for factor scores Murray Aitkin and Irit Aitkin School of Mathematics and Statistics University of Newcastle UK October, 3 Abstract Bayesian inference for the parameters of the factor
Large Scale Bayesian Inference
 Large Scale Bayesian I in Cosmology Jens Jasche Garching, 11 September 2012 Introduction Cosmography 3D density and velocity fields Power-spectra, bi-spectra Dark Energy, Dark Matter, Gravity Cosmological
Bayes: All uncertainty is described using probability.
 Bayes: All uncertainty is described using probability. Let w be the data and θ be any unknown quantities. Likelihood. The probability model π(w θ) has θ fixed and w varying. The likelihood L(θ; w) is π(w
Lecture 5. G. Cowan Lectures on Statistical Data Analysis Lecture 5 page 1
 Lecture 5 1 Probability (90 min.) Definition, Bayes theorem, probability densities and their properties, catalogue of pdfs, Monte Carlo 2 Statistical tests (90 min.) general concepts, test statistics,
Lecture 16-17: Bayesian Nonparametrics I. STAT 6474 Instructor: Hongxiao Zhu
 Lecture 16-17: Bayesian Nonparametrics I STAT 6474 Instructor: Hongxiao Zhu Plan for today Why Bayesian Nonparametrics? Dirichlet Distribution and Dirichlet Processes. 2 Parameter and Patterns Reference:
Hierarchical Bayesian Modeling
 Hierarchical Bayesian Modeling Making scientific inferences about a population based on many individuals Angie Wolfgang NSF Postdoctoral Fellow, Penn State Astronomical Populations Once we discover an
Hierarchical Bayesian Modeling
 Hierarchical Bayesian Modeling Making scientific inferences about a population based on many individuals Angie Wolfgang NSF Postdoctoral Fellow, Penn State Astronomical Populations Once we discover an
MCMC algorithms for fitting Bayesian models
 MCMC algorithms for fitting Bayesian models p. 1/1 MCMC algorithms for fitting Bayesian models Sudipto Banerjee sudiptob@biostat.umn.edu University of Minnesota MCMC algorithms for fitting Bayesian models
Bootstrap and Parametric Inference: Successes and Challenges
 Bootstrap and Parametric Inference: Successes and Challenges G. Alastair Young Department of Mathematics Imperial College London Newton Institute, January 2008 Overview Overview Review key aspects of frequentist
Bayesian Inference on Joint Mixture Models for Survival-Longitudinal Data with Multiple Features. Yangxin Huang
 Bayesian Inference on Joint Mixture Models for Survival-Longitudinal Data with Multiple Features Yangxin Huang Department of Epidemiology and Biostatistics, COPH, USF, Tampa, FL yhuang@health.usf.edu January
Challenges and Methods for Massive Astronomical Data
 Challenges and Methods for Massive Astronomical Data mini-workshop on Computational AstroStatistics The workshop is sponsored by CHASC/C-BAS, NSF grants DMS 09-07185 (HU) and DMS 09-07522 (UCI), and the
Probabilistic Graphical Models
 School of Computer Science Probabilistic Graphical Models Infinite Feature Models: The Indian Buffet Process Eric Xing Lecture 21, April 2, 214 Acknowledgement: slides first drafted by Sinead Williamson