Green Building Criteria in Low-Income Housing Tax Credit Programs Analysis
|
|
|
- Suzan Patterson
- 6 years ago
- Views:
Transcription
1
2


3 Green Building Criteria in Low-Income Housing Tax Credit Programs 2010 Analysis September 2010
4 Green Building Criteria in State Low-Income Housing Tax Credit Programs 2 Introduction Qualified Allocation Plans (QAPs) are typically established by state housing finance agencies to guide the annual distribution of federal Low-Income Housing Tax Credits (LIHTC) marks the sixth year that Global Green USA has conducted an analysis and ranking of Qualified Allocation Plans (QAPs) for all 50 states. The analysis of the 2010 QAPs shows a continued increase in the incorporation of green building strategies, albeit at a slower rate than previous years. Nearly every state scored points in all four of the green building categories used in the analysis, demonstrating an increase in the degree of comprehensiveness with which green building is being addressed in the QAP documents. Analysis Methodology Each 2010 QAP, and any document that accompanies or that is referenced (appendices, checklists, building standards, etc.), was reviewed for the inclusion of green building strategies related to the following four categories Smart Growth, Energy Efficiency, Resource Conservation, and Health Protection. The methodology used for analyzing and rating the 2010 QAPs follows the same general approach established in Global Green s 2006 report, Making Affordable Housing Truly Affordable: Advancing Tax Credit Incentives for Green Building and Healthier Communities. Points are awarded when various green building issues are referenced in the QAPs and bonuses are provided to states that achieve points in multiple categories, (thus demonstrating a comprehensive approach to green building,) and to states that encourage projects to participate in a comprehensive third-party green building program, such as the US Green Building Council s Leadership in Energy and Environmental Design (LEED) rating system, Enterprise Community Partner s Green Communities Initiative, or Southface Energy Institute s EarthCraft green building program. A maximum of 55 points are available. After determining the raw scores, the basic grading tiers were established using standard deviation from the mean; one standard deviation above the mean demarcated the B-range from the C-range and one standard deviation below the mean demarcated the C-range from the D-range. These distinctions were then compared to breaks that occurred in the raw scores in order to assign letter grades. After the preliminary grading, each state was given an opportunity to review and comment on our findings. Individual state scorecards, the nationwide scoring table and information on our scoring criteria were sent to a list of contacts obtained from the National Council of State Housing Agencies (NCSHA). A two-week comment period was provided to identify any criteria that was insufficiently addressed and to clarify our methodology. Thirty-two responses were received from the relevant parties - the greatest number to date.
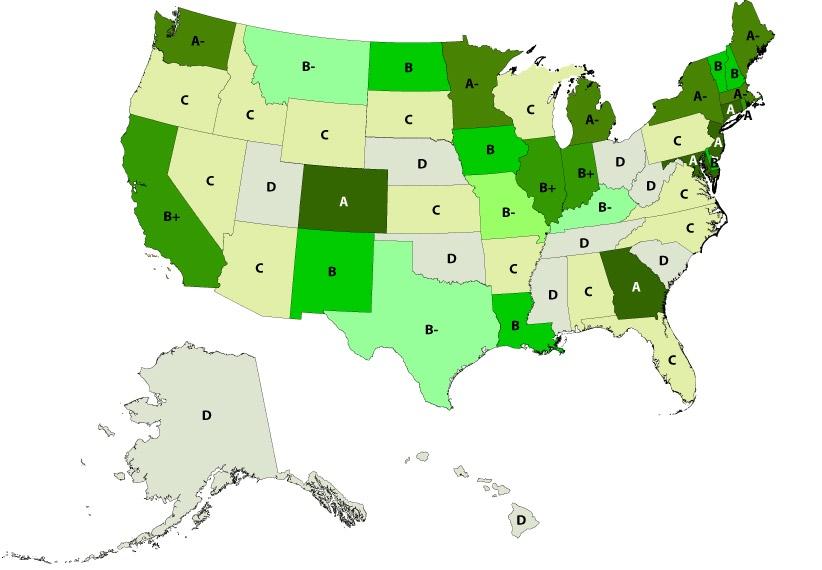
5 2010 Trends and Findings The 2010 QAP analysis shows the continuation of the trend established in previous years of a steady increase in both required and optional green building measures. The rate of increase is slightly slower, with 33 states improving their scores from 2009 to 2010, (as opposed to 34 states seeing an improvement from 2008 to 2009). The mean or average score rose to 33 from 30. The median or highest occurring score had a similar increase to 33.5 from 30. This slight reduction in the pace of improvement is likely the result of many states having already adopted the easiest-to-implement measures in previous years. The highest scores were given to Connecticut and Georgia, who tied for first for the second consecutive year by earning 50 points out of a possible 55. The next highest scoring state was Maryland, with a score of 48. Colorado was a new addition to the A group, gaining 30 points from the previous year due to the state s adoption of Enterprise Green Communities criteria as a mandatory component of their QAP. Washington and Massachusetts earned the same score but dropped from an A range to an A- as a result of the general upwards trend from 2009 to Oregon and Illinois also experienced substantial point increases from 2009 to Illinois 14-point increase is primarily attributed to its adoption of the mandatory portions of the Enterprise Green Communities requirements, which brought the state s grade up from a C to a B+. Oregon s 16-point increase is largely attributed to the more accurate consideration of Oregon s self-scored section of the QAP application. This section, which includes a number of green building items, was not reflected in Oregon s 2009 score. Including the self-scored items in analysis resulted in Oregon receiving giving a C in 2010, as opposed to a D in Top Ten States of 2010 Connecticut (50) Georgia (50) Maryland (48) New Jersey (46) Colorado (46) Washington (44) Rode Island (44) Massachussets (42) Minnesota (42) New York (42) Max. 55 Score Average Total Scores Year In addition to the overall improvement, the 2010 QAPs showed an increase in the percentage of possible points obtained in each of the four green building categories. As in 2009, the greatest proportion of possible points was earned in the Energy Efficiency category, with 72% of the possible points obtained. This figure represents a 6% increase from Notably, all 50 states received points in two of the Energy Efficiency categories: Specified Efficient products (subcategory SP) and Existing Housing Rehabilitation (subcategory XH), making it the first time in which all states earned a point in a single category since Global Green started this analysis six years ago. The next most represented category is Smart Growth, where states obtained 66% of all possible points, for an increase of 7%. Nineteen additional states earned points for the Adaptive Reuse (AR) category, increasing that number to 41 from 22. This significant jump stems, in part, from an adjustment made in scoring the Adaptive Reuse (AR ) category criteria so that points were granted for both adaptive reuse and historic preservation, as historic preservation also promotes the reuse of existing structures. Disparities remained within this category however, with only nine states addressing brownfield redevelopment (BR subcategory). 3
6 Overall, the two least mentioned subcategories lie in the Resource Conservation category, with only eight states mentioning the use of Reused Materials (UM) or Renewable Materials (NM). Health Protection was again the category for which the lowest amount of points was achieved. Forty-six percent of the total possible Health Protection points were awarded in 2010, an increase of 5% from In this category, the greatest number of states earned points in the Environmental Assessment subcategory (EA), with 39 states requiring a Phase 1 Environmental Assessment. 4 % Of Points Acheived in Category 100% 90% 80% 70% 60% 50% 40% 30% 20% 10% 0% Annual QAP Trends Year Scoring Third-Party Rating Systems Health Protection Smart Growth Energy Efficiency Resource Conservation Nearly every state earned the maximum amount of bonus points for taking a comprehensive approach to green building by addressing all four sub-categories (earning points in 3 categories warrants a 2 point bonus, earning points in 4 categories warrants a 5 point bonus). More states received bonus points for referencing recognized third-party green building standards in 2010 as well, with a total of 16 states earning the bonus, up from 14 in It is noteworthy that not only A-graded states, such as Georgia or Connecticut who already had a high level of detail in their QAPs, referenced these standards - but also lower-graded states such as Ohio and Wisconsin. This trend may demonstrate the appeal among some states to reference third-party standards in lieu of developing detailed prescriptive green building criteria for the QAP. In instances when the only reference to green building is by way of a third-party standard, it is not possible to determine which specific items will be addressed, and therefore difficult to assign points per the scoring methodology. Currently states are able to earn points by being more prescriptive in the documents themselves through explicit reference to green building criteria, rather than by referring to a third-party standard that include a combination of mandatory and voluntary items. Due to this approach, states such as Virginia, which allocates a significant number of points in the QAP to committing to build to the EarthCraft standard but does not feature many other prescriptive requirements, suffer disproportionately in our ranking. As more and more states refer to thirdparty standards as both requirements and optional point-scoring criteria, Global Green will consider changing how we weigh references to third-party standards in future iterations of this analysis.
7 2010 Findings & Scoring Grade State Smart Growth Category Total Category Total Energy Efficiency Resource Conservation Health Protection Category Total Category Total Bonus Score A A- BR UI AR PT PS XH RP HP FP WP 10 pts PV SP IS EP HV EC EB 12 pts EF RC MF WC NM UM CD SW 12 pts HZ EA HA QP QC QF QV 11 pts 10 pts Connecticut Georgia Maryland New Jersey Colorado Washington Rhode Island Massachussets Minnesota New York Michigan Illinois Indiana B+ California Maine Vermont Louisiana Iowa B Delaware North Dakota New Hampshire New Mexico Texas Missouri B- Kentucky Montana Pennsylvania Nevada Virginia Oregon North Carolina Wyoming Arkansas C Idaho Arizona Alabama Kansas Florida South Dakota Wisconsin Hawaii Ohio West Virginia Alaska South Carolina D Nebraska Mississippi Utah Oklahoma Tennessee # of states
8 Looking Forward The primary intention of this analysis and report is to provide a comparative snapshot of green building criteria in QAPs in order to identify which states may serve as models of best practices and also to encourage those that lag behind. However, in addition to showing the range of performance, this analysis begins to point toward a set of minimum green-building standards that are broadly accepted as beneficial and implemented nationally. The top 15 strategies used by states show that a significant majority of states already promote green building criteria. Top 15 Green Building Strategies 6 Number of States Revitalization Plan Existing Housing Specified Efficient Products Energy Star Appliances Water Conservation Insulation Standards HVAC Performance Proximity to Services Paint (Low/No-VOC) Adaptive Reuse Proximity to Transportation Environmental Assessment Ventilation Energy Codes Maintenance-Free Standard Health Protection Smart Growth Energy Efficiency As we see a continued increase in the incorporation of green-building criteria in a majority of states, we suggest that a new, higher standard in green affordable housing is emerging; one that should be codified and comprehensively promoted. The report released by the US Green Building Council (USGBC) in April of 2010, Using Executive Authority to Achieve Greener Buildings: A Guide for Policymarkers to Enhance Sustainabilty and Efficiency in Multifamily Housing and Commercial Buildings, suggests that the Treasury should provide guidance that would encourage states to include sustainability criteria as a part of the housing needs characteristics and project characteristics elements of their allocation plans. We are in agreement with USGBC that at this point in the evolution of green affordable housing, minimum standards should be considered for inclusion as a mandatory component of all affordable housing funded by the LIHTC process that is overseen through Section 42(n) of the Internal Revenue code. We also concur with the suggestion that the Treasury should put forward a model allocation plan that reflects best practices in green affordable housing. Similar to how the Housing and Economic Recovery Act of 2008 expanded the scope of Low-Income Housing Tax incentives to include energy efficiency, we hope that a comparable action can further broaden the scope of such incentives to include a model set of minimum standards for green affordable housing. Targeting the QAP as a place to include minimum green building standards would ensure that all projects financed through the LIHTC program will reap the benefits that green building brings to affordable housing tenants, owners, and the larger community: energy and water cost reductions, reduced exposure to environmental toxins, more durable construction, resource conservation, and overall climate change mitigation. Resource Conservation
9 Analysis Criteria: 55 Points Total Points Possible Smart Growth 10 BR Brownfields Redevelopment 1 UI Urban Infill 1 AR Adaptive Reuse / Historic Preservation 1 PT Proximity to Public Transit 1 PS Proximity to Services 1 XH Existing Housing Rehabilitation 1 RP Revitalization Plans 1 HP Habitat Preservation 1 FP Floodplain Preservation 1 WP Wetlands Preservation 1 Energy Efficiency 12 PV Photovoltaics 1 SP Specified Efficient Products 1 IS Insulation Standards 1 EP Energy Star Appliances 2 HV HVAC Performance 2 Heating / Ventilation 1 pt Cooling 1 pt EC Energy Codes 2 EB Energy Star Homes 3 Resource Conservation 12 EF Existing Flora Preservation 1 RC Recycled Content Materials 1 MF Maintenance Free / Durability 1 WC Water Conservation 5 Fixtures 3 pts Irrigation 1 pt Landscaping 1 pt NM Renewable Materials 1 UM Reused Materials 1 CD Construction & Demolition Recycling 1 SW Stormwater Protection 1 Points Possible Health Protection 11 HZ Hazard Proximity 1 EA Environmental Assessment 1 HA Hazard Abatement 5 Lead Based Paint 1 pt Asbestos Containing Materials 1 pt Radon 1 pt Groundwater 1 pt Soils 1 pt QP Paint (Low/No-VOC) 1 QC Carpet (Low-VOC) 1 QF Formaldehyde Free 1 QV Quality Ventilation 1 Bonus 10 Multiple Categories 5 3 Categories 2 pts 4 Categories 5 pts Third-Party Green Building Program 5 7 Research and analysis by Nikola Hlady and Walker Wells. Report prepared through funding from the Home Depot Foundation.
Jakarta International School 6 th Grade Formative Assessment Graphing and Statistics -Black
 Jakarta International School 6 th Grade Formative Assessment Graphing and Statistics -Black Name: Date: Score : 42 Data collection, presentation and application Frequency tables. (Answer question 1 on
New Educators Campaign Weekly Report
 Campaign Weekly Report Conversations and 9/24/2017 Leader Forms Emails Collected Text Opt-ins Digital Journey 14,661 5,289 4,458 7,124 317 13,699 1,871 2,124 Pro 13,924 5,175 4,345 6,726 294 13,086 1,767
Intercity Bus Stop Analysis
 by Karalyn Clouser, Research Associate and David Kack, Director of the Small Urban and Rural Livability Center Western Transportation Institute College of Engineering Montana State University Report prepared
Abortion Facilities Target College Students
 Target College Students By Kristan Hawkins Executive Director, Students for Life America Ashleigh Weaver Researcher Abstract In the Fall 2011, Life Dynamics released a study entitled, Racial Targeting
Challenge 1: Learning About the Physical Geography of Canada and the United States
 60ºN S T U D E N T H A N D O U T Challenge 1: Learning About the Physical Geography of Canada and the United States 170ºE 10ºW 180º 20ºW 60ºN 30ºW 1 40ºW 160ºW 50ºW 150ºW 60ºW 140ºW N W S E 0 500 1,000
Correction to Spatial and temporal distributions of U.S. winds and wind power at 80 m derived from measurements
 JOURNAL OF GEOPHYSICAL RESEARCH, VOL. 109,, doi:10.1029/2004jd005099, 2004 Correction to Spatial and temporal distributions of U.S. winds and wind power at 80 m derived from measurements Cristina L. Archer
Hourly Precipitation Data Documentation (text and csv version) February 2016
 February 2016") I. Description Hourly Precipitation Data Documentation (text and csv version) February 2016 Hourly Precipitation Data (labeled Precipitation Hourly in Climate Data Online system) is a database that gives
I. Description Hourly Precipitation Data Documentation (text and csv version) February 2016 Hourly Precipitation Data (labeled Precipitation Hourly in Climate Data Online system) is a database that gives
2005 Mortgage Broker Regulation Matrix
 2005 Mortgage Broker Regulation Matrix Notes on individual states follow the table REG EXEMPTIONS LIC-EDU LIC-EXP LIC-EXAM LIC-CONT-EDU NET WORTH BOND MAN-LIC MAN-EDU MAN-EXP MAN-EXAM Alabama 1 0 2 0 0
SUPPLEMENTAL NUTRITION ASSISTANCE PROGRAM QUALITY CONTROL ANNUAL REPORT FISCAL YEAR 2008
 SUPPLEMENTAL NUTRITION ASSISTANCE PROGRAM QUALITY CONTROL ANNUAL REPORT FISCAL YEAR 2008 U.S. DEPARTMENT OF AGRICULTURE FOOD AND NUTRITION SERVICE PROGRAM ACCOUNTABILITY AND ADMINISTRATION DIVISION QUALITY
Standard Indicator That s the Latitude! Students will use latitude and longitude to locate places in Indiana and other parts of the world.
 Standard Indicator 4.3.1 That s the Latitude! Purpose Students will use latitude and longitude to locate places in Indiana and other parts of the world. Materials For the teacher: graph paper, globe showing
A. Geography Students know the location of places, geographic features, and patterns of the environment.
 Learning Targets Elementary Social Studies Grade 5 2014-2015 A. Geography Students know the location of places, geographic features, and patterns of the environment. A.5.1. A.5.2. A.5.3. A.5.4. Label North
Club Convergence and Clustering of U.S. State-Level CO 2 Emissions
 Methodological Club Convergence and Clustering of U.S. State-Level CO 2 Emissions J. Wesley Burnett Division of Resource Management West Virginia University Wednesday, August 31, 2013 Outline Motivation
Cooperative Program Allocation Budget Receipts Southern Baptist Convention Executive Committee May 2018
 Cooperative Program Allocation Budget Receipts May 2018 Cooperative Program Allocation Budget Current Current $ Change % Change Month Month from from Contribution Sources 2017-2018 2016-2017 Prior Year
Cooperative Program Allocation Budget Receipts Southern Baptist Convention Executive Committee October 2017
 Cooperative Program Allocation Budget Receipts October 2017 Cooperative Program Allocation Budget Current Current $ Change % Change Month Month from from Contribution Sources 2017-2018 2016-2017 Prior
Cooperative Program Allocation Budget Receipts Southern Baptist Convention Executive Committee October 2018
 Cooperative Program Allocation Budget Receipts October 2018 Cooperative Program Allocation Budget Current Current $ Change % Change Month Month from from Contribution Sources 2018-2019 2017-2018 Prior
, District of Columbia
 State Capitals These are the State Seals of each state. Fill in the blank with the name of each states capital city. (Hint: You may find it helpful to do the word search first to refresh your memory.),
QF (Build 1010) Widget Publishing, Inc Page: 1 Batch: 98 Test Mode VAC Publisher's Statement 03/15/16, 10:20:02 Circulation by Issue
 Widget Publishing, Inc Page: 1 Batch: 98 Test Mode VAC Publisher's Statement 03/15/16, 10:20:02 Circulation by Issue") QF 1.100 (Build 1010) Widget Publishing, Inc Page: 1 Circulation by Issue Qualified Non-Paid Circulation Qualified Paid Circulation Individual Assoc. Total Assoc. Total Total Requester Group Qualified
QF 1.100 (Build 1010) Widget Publishing, Inc Page: 1 Circulation by Issue Qualified Non-Paid Circulation Qualified Paid Circulation Individual Assoc. Total Assoc. Total Total Requester Group Qualified
Preview: Making a Mental Map of the Region
 Preview: Making a Mental Map of the Region Draw an outline map of Canada and the United States on the next page or on a separate sheet of paper. Add a compass rose to your map, showing where north, south,
North American Geography. Lesson 2: My Country tis of Thee
 North American Geography Lesson 2: My Country tis of Thee Unit Overview: As students work through the activities in this unit they will be introduced to the United States in general, different regions
Additional VEX Worlds 2019 Spot Allocations
 Overview VEX Worlds 2019 Spot s Qualifying spots for the VEX Robotics World Championship are calculated twice per year. On the following table, the number in the column is based on the number of teams
JAN/FEB MAR/APR MAY/JUN
 QF 1.100 (Build 1010) Widget Publishing, Inc Page: 1 Circulation Breakdown by Issue Qualified Non-Paid Qualified Paid Previous This Previous This Total Total issue Removals Additions issue issue Removals
Multivariate Statistics
 Multivariate Statistics Chapter 3: Principal Component Analysis Pedro Galeano Departamento de Estadística Universidad Carlos III de Madrid pedro.galeano@uc3m.es Course 2017/2018 Master in Mathematical
Multivariate Statistics
 Multivariate Statistics Chapter 4: Factor analysis Pedro Galeano Departamento de Estadística Universidad Carlos III de Madrid pedro.galeano@uc3m.es Course 2017/2018 Master in Mathematical Engineering Pedro
Online Appendix: Can Easing Concealed Carry Deter Crime?
 Online Appendix: Can Easing Concealed Carry Deter Crime? David Fortunato University of California, Merced dfortunato@ucmerced.edu Regulations included in institutional context measure As noted in the main
Multivariate Statistics
 Multivariate Statistics Chapter 6: Cluster Analysis Pedro Galeano Departamento de Estadística Universidad Carlos III de Madrid pedro.galeano@uc3m.es Course 2017/2018 Master in Mathematical Engineering
BlackRock Core Bond Trust (BHK) BlackRock Enhanced International Dividend Trust (BGY) 2 BlackRock Defined Opportunity Credit Trust (BHL) 3
 BlackRock Enhanced International Dividend Trust (BGY) 2 BlackRock Defined Opportunity Credit Trust (BHL) 3") MUNICIPAL FUNDS Arizona (MZA) California Municipal Income Trust (BFZ) California Municipal 08 Term Trust (BJZ) California Quality (MCA) California Quality (MUC) California (MYC) Florida Municipal 00 Term
MUNICIPAL FUNDS Arizona (MZA) California Municipal Income Trust (BFZ) California Municipal 08 Term Trust (BJZ) California Quality (MCA) California Quality (MUC) California (MYC) Florida Municipal 00 Term
Printable Activity book
 Printable Activity book 16 Pages of Activities Printable Activity Book Print it Take it Keep them busy Print them out Laminate them or Put them in page protectors Put them in a binder Bring along a dry
Alpine Funds 2016 Tax Guide
 Alpine s 2016 Guide Alpine Dynamic Dividend ADVDX 01/28/2016 01/29/2016 01/29/2016 0.020000000 0.017621842 0.000000000 0.00000000 0.017621842 0.013359130 0.000000000 0.000000000 0.002378158 0.000000000
Crop Progress. Corn Mature Selected States [These 18 States planted 92% of the 2017 corn acreage]
![Crop Progress. Corn Mature Selected States [These 18 States planted 92% of the 2017 corn acreage]](/thumbs/89/98128758.jpg "Crop Progress. Corn Mature Selected States [These 18 States planted 92% of the 2017 corn acreage]") Crop Progress ISSN: 00 Released October, 0, by the National Agricultural Statistics Service (NASS), Agricultural Statistics Board, United s Department of Agriculture (USDA). Corn Mature Selected s [These
Crop Progress ISSN: 00 Released October, 0, by the National Agricultural Statistics Service (NASS), Agricultural Statistics Board, United s Department of Agriculture (USDA). Corn Mature Selected s [These
Summary of Natural Hazard Statistics for 2008 in the United States
 Summary of Natural Hazard Statistics for 2008 in the United States This National Weather Service (NWS) report summarizes fatalities, injuries and damages caused by severe weather in 2008. The NWS Office
Alpine Funds 2017 Tax Guide
 Alpine s 2017 Guide Alpine Dynamic Dividend ADVDX 1/30/17 1/31/17 1/31/17 0.020000000 0.019248130 0.000000000 0.00000000 0.019248130 0.013842273 0.000000000 0.000000000 0.000751870 0.000000000 0.00 0.00
Osteopathic Medical Colleges
 Osteopathic Medical Colleges Matriculants by U.S. States and Territories Entering Class 0 Prepared by the Research Department American Association of Colleges of Osteopathic Medicine Copyright 0, AAM All
What Lies Beneath: A Sub- National Look at Okun s Law for the United States.
 What Lies Beneath: A Sub- National Look at Okun s Law for the United States. Nathalie Gonzalez Prieto International Monetary Fund Global Labor Markets Workshop Paris, September 1-2, 2016 What the paper
Chapter. Organizing and Summarizing Data. Copyright 2013, 2010 and 2007 Pearson Education, Inc.
 Chapter 2 Organizing and Summarizing Data Section 2.1 Organizing Qualitative Data Objectives 1. Organize Qualitative Data in Tables 2. Construct Bar Graphs 3. Construct Pie Charts When data is collected
RELATIONSHIPS BETWEEN THE AMERICAN BROWN BEAR POPULATION AND THE BIGFOOT PHENOMENON
 RELATIONSHIPS BETWEEN THE AMERICAN BROWN BEAR POPULATION AND THE BIGFOOT PHENOMENON ETHAN A. BLIGHT Blight Investigations, Gainesville, FL ABSTRACT Misidentification of the American brown bear (Ursus arctos,
Office of Special Education Projects State Contacts List - Part B and Part C
 Office of Special Education Projects State Contacts List - Part B and Part C Source: http://www.ed.gov/policy/speced/guid/idea/monitor/state-contactlist.html Alabama Customer Specialist: Jill Harris 202-245-7372
Insurance Department Resources Report Volume 1
 2014 Insurance Department Resources Report Volume 1 201 Insurance Department Resources Report Volume One 201 The NAIC is the authoritative source for insurance industry information. Our expert solutions
LABORATORY REPORT. If you have any questions concerning this report, please do not hesitate to call us at (800) or (574)
 or (574)") LABORATORY REPORT If you have any questions concerning this report, please do not hesitate to call us at (800) 332-4345 or (574) 233-4777. This report may not be reproduced, except in full, without written
LABORATORY REPORT If you have any questions concerning this report, please do not hesitate to call us at (800) 332-4345 or (574) 233-4777. This report may not be reproduced, except in full, without written
National Organization of Life and Health Insurance Guaranty Associations
 National Organization of and Health Insurance Guaranty Associations November 21, 2005 Dear Chief Executive Officer: Consistent with prior years, NOLHGA is providing the enclosed data regarding insolvency
LABORATORY REPORT. If you have any questions concerning this report, please do not hesitate to call us at (800) or (574)
 or (574)") LABORATORY REPORT If you have any questions concerning this report, please do not hesitate to call us at (800) 332-4345 or (574) 233-4777. This report may not be reproduced, except in full, without written
LABORATORY REPORT If you have any questions concerning this report, please do not hesitate to call us at (800) 332-4345 or (574) 233-4777. This report may not be reproduced, except in full, without written
Multivariate Analysis
 Multivariate Analysis Chapter 5: Cluster analysis Pedro Galeano Departamento de Estadística Universidad Carlos III de Madrid pedro.galeano@uc3m.es Course 2015/2016 Master in Business Administration and
extreme weather, climate & preparedness in the american mind
 extreme weather, climate & preparedness in the american mind Extreme Weather, Climate & Preparedness In the American Mind Interview dates: March 12, 2012 March 30, 2012. Interviews: 1,008 Adults (18+)
Parametric Test. Multiple Linear Regression Spatial Application I: State Homicide Rates Equations taken from Zar, 1984.
 Multiple Linear Regression Spatial Application I: State Homicide Rates Equations taken from Zar, 984. y ˆ = a + b x + b 2 x 2K + b n x n where n is the number of variables Example: In an earlier bivariate
Meteorology 110. Lab 1. Geography and Map Skills
 Meteorology 110 Name Lab 1 Geography and Map Skills 1. Geography Weather involves maps. There s no getting around it. You must know where places are so when they are mentioned in the course it won t be
High School World History Cycle 2 Week 2 Lifework
 Name: Advisory: Period: High School World History Cycle 2 Week 2 Lifework This packet is due Monday, November 7 Complete and turn in on Friday for 10 points of EXTRA CREDIT! Lifework Assignment Complete
A Summary of State DOT GIS Activities
 A Summary of State DOT GIS Activities Prepared for the 2006 AASHTO GIS-T Symposium Columbus, OH Introduction This is the 11 th year that the GIS-T Symposium has conducted a survey of GIS activities at
Multivariate Classification Methods: The Prevalence of Sexually Transmitted Diseases
 Multivariate Classification Methods: The Prevalence of Sexually Transmitted Diseases Summer Undergraduate Mathematical Sciences Research Institute (SUMSRI) Lindsay Kellam, Queens College kellaml@queens.edu
JAN/FEB MAR/APR MAY/JUN
 QF 1.100 (Build 1010) Widget Publishing, Inc Page: 1 Circulation Breakdown by Issue Analyzed Nonpaid and Verified Paid Previous This Previous This Total Total issue Removals Additions issue issue Removals
Crop / Weather Update
 Crop / Weather Update Corn Crop Condition Percent of Acreage Rated Good or Excellent 85 80 75 70 65 60 55 50 45 As of September 9, USDA rates the crop at 68% good to excellent. The rating is up one point
Lecture 5: Ecological distance metrics; Principal Coordinates Analysis. Univariate testing vs. community analysis
 Lecture 5: Ecological distance metrics; Principal Coordinates Analysis Univariate testing vs. community analysis Univariate testing deals with hypotheses concerning individual taxa Is this taxon differentially
An Analysis of Regional Income Variation in the United States:
 Modern Economy, 2017, 8, 232-248 http://www.scirp.org/journal/me ISSN Online: 2152-7261 ISSN Print: 2152-7245 An Analysis of Regional Income Variation in the United States: 1969-2013 Orley M. Amos Jr.
Grand Total Baccalaureate Post-Baccalaureate Masters Doctorate Professional Post-Professional
 s by Location of Permanent Home Address and Degree Level Louisiana Acadia 19 13 0 3 0 3 0 0 0 Allen 5 5 0 0 0 0 0 0 0 Ascension 307 269 2 28 1 6 0 1 0 Assumption 14 12 0 1 0 1 0 0 0 Avoyelles 6 4 0 1 0
GIS use in Public Health 1
 Geographic Information Systems (GIS) use in Public Health Douglas Morales, MPH Epidemiologist/GIS Coordinator Office of Health Assessment and Epidemiology Epidemiology Unit Objectives Define GIS and justify
Lecture 5: Ecological distance metrics; Principal Coordinates Analysis. Univariate testing vs. community analysis
 Lecture 5: Ecological distance metrics; Principal Coordinates Analysis Univariate testing vs. community analysis Univariate testing deals with hypotheses concerning individual taxa Is this taxon differentially
Crop / Weather Update
 Crop / Weather Update Corn Crop Condition Percent of Acreage Rated Good or Excellent 85 80 75 70 65 60 55 50 45 The U.S. corn crop was rated 69% good-to-excellent on September 23, up 1% from week-ago,
Grand Total Baccalaureate Post-Baccalaureate Masters Doctorate Professional Post-Professional
 s by Location of Permanent Home Address and Degree Level Louisiana Acadia 26 19 0 6 1 0 0 0 0 Allen 7 7 0 0 0 0 0 0 0 Ascension 275 241 3 23 1 6 0 1 0 Assumption 13 12 0 1 0 0 0 0 0 Avoyelles 15 11 0 3
United States Geography Unit 1
 United States Geography Unit 1 I WANT YOU TO STUDY YOUR GEORGAPHY Name: Period: Due Date: Geography Key Terms Absolute Location: Relative Location: Demographic Map: Population Density: Sun-Belt: Archipelago:
Infant Mortality: Cross Section study of the United State, with Emphasis on Education
 Illinois State University ISU ReD: Research and edata Stevenson Center for Community and Economic Development Arts and Sciences Fall 12-15-2014 Infant Mortality: Cross Section study of the United State,
OUT-OF-STATE 965 SUBTOTAL OUT-OF-STATE U.S. TERRITORIES FOREIGN COUNTRIES UNKNOWN GRAND TOTAL
 Report ID: USSR8072-V3 Page No. 1 Jurisdiction: ON-CAMPUS IL Southern Illinois University - Carb 1 0 0 0 Black Hawk College Quad-Cities 0 0 1 0 John A Logan College 1 0 0 0 Rend Lake College 1 0 0 0 Aurora
Last time: PCA. Statistical Data Mining and Machine Learning Hilary Term Singular Value Decomposition (SVD) Eigendecomposition and PCA
 Eigendecomposition and PCA") Last time: PCA Statistical Data Mining and Machine Learning Hilary Term 2016 Dino Sejdinovic Department of Statistics Oxford Slides and other materials available at: http://www.stats.ox.ac.uk/~sejdinov/sdmml
Last time: PCA Statistical Data Mining and Machine Learning Hilary Term 2016 Dino Sejdinovic Department of Statistics Oxford Slides and other materials available at: http://www.stats.ox.ac.uk/~sejdinov/sdmml
MINERALS THROUGH GEOGRAPHY
 MINERALS THROUGH GEOGRAPHY INTRODUCTION Minerals are related to rock type, not political definition of place. So, the minerals are to be found in a variety of locations that doesn t depend on population
ANALYTICAL REPORT. Attn: Thomas W Hensel
 ANALYTICAL REPORT TestAmerica Laboratories, Inc. 0 Foster Creighton Drive Nashville, TN 0 Tel: ()-0 TestAmerica Job ID: 0-- Client Revision: For: AMEC Foster Wheeler E & I, Inc Cogdill Road Knoxville,
Pima Community College Students who Enrolled at Top 200 Ranked Universities
 Pima Community College Students who Enrolled at Top 200 Ranked Universities Institutional Research, Planning and Effectiveness Project #20170814-MH-60-CIR August 2017 Students who Attended Pima Community
FLOOD/FLASH FLOOD. Lightning. Tornado
 2004 Annual Summaries National Oceanic and Atmospheric Administration National Environmental Satellite Data Information Service National Climatic Data Center FLOOD/FLASH FLOOD Lightning Tornado Hurricane
Office of Budget & Planning 311 Thomas Boyd Hall Baton Rouge, LA Telephone 225/ Fax 225/
 Louisiana Acadia 20 17 3 0 0 0 Allen 2 2 0 0 0 0 Ascension 226 185 37 2 1 1 Assumption 16 15 1 0 0 0 Avoyelles 20 19 1 0 0 0 Beauregard 16 11 4 0 0 1 Bienville 2 2 0 0 0 0 Bossier 22 18 4 0 0 0 Caddo 91
Fungal conservation in the USA
 The following supplements accompany the article Fungal conservation in the USA Jessica L. Allen*, James C. Lendemer *Corresponding author: jlendemer@nybg.org Endangered Species Research 28: 33 42 (2015)
MINERALS THROUGH GEOGRAPHY. General Standard. Grade level K , resources, and environmen t
 Minerals through Geography 1 STANDARDS MINERALS THROUGH GEOGRAPHY See summary of National Science Education s. Original: http://books.nap.edu/readingroom/books/nses/ Concept General Specific General Specific
October 2016 v1 12/10/2015 Page 1 of 10
 State Section S s Effective October 1, 2016 Overview The tables list the Section S items that will be active on records with a target date on or after October 1, 2016. The active on each item subset code
Direct Selling Association 1
 Total Number of Firms 1,100 104 58 46 14 41 22 27 44 60 1 U.S. Sales Volume & Growth 1 Average Retail Sales per Firm ($thousands) 2015 $32,836 $210,572 $320,820 $69,556 $1,041 $11,788 $100,216 $721,897
Outline. Administrivia and Introduction Course Structure Syllabus Introduction to Data Mining
 Outline Administrivia and Introduction Course Structure Syllabus Introduction to Data Mining Dimensionality Reduction Introduction Principal Components Analysis Singular Value Decomposition Multidimensional
St. Luke s College Institutional Snapshot
 1. Student Headcount St. Luke s College Institutional Snapshot Enrollment # % # % # % Full Time 139 76% 165 65% 132 54% Part Time 45 24% 89 35% 112 46% Total 184 254 244 2. Average Age Average Age Average
If you have any questions concerning this report, please feel free to contact me. REPORT OF LABORATORY ANALYSIS
 #=CL# LI USE: FR - JILL LAVOIE LI OBJECT ID: August 22, 2014 Jill Lavoie Merrimack Village District - UCMR3 2 Greens Pond Road Merrimack, NH 03054 RE: Dear Jill Lavoie: Enclosed are the analytical results
A GUIDE TO THE CARTOGRAPHIC PRODUCTS OF
 A GUIDE TO THE CARTOGRAPHIC PRODUCTS OF THE FEDERAL DEPOSITORY LIBRARY PROGRAM (FDLP) This guide was designed for use as a collection development tool by map selectors of depository libraries that participate
Proposed Scope of Work Village of Farmingdale Downtown Farmingdale BOA Step 2 BOA Nomination Study / Draft Generic Environmental Impact Statement
 Proposed Scope of Work Village of Farmingdale Downtown Farmingdale BOA Step 2 BOA Nomination Study / Draft Generic Environmental Impact Statement The scope of work that follows incorporates and covers
Non-iterative, regression-based estimation of haplotype associations
 Non-iterative, regression-based estimation of haplotype associations Benjamin French, PhD Department of Biostatistics and Epidemiology University of Pennsylvania bcfrench@upenn.edu National Cancer Center
CCC-A Survey Summary Report: Number and Type of Responses
 CCC-A Survey Summary Report: Number and Type of Responses Suggested Citation: American Speech-Language-Hearing Association. (2011). 2011 Membership survey. CCC-A survey summary report: Number and type
Stem-and-Leaf Displays
 3.2 Displaying Numerical Data: Stem-and-Leaf Displays 107 casts in your area? (San Luis Obispo Tribune, June 15, 2005). The responses are summarized in the table below. Extremely 4% Very 27% Somewhat 53%
Earl E. ~rabhl/ This report is preliminary and has not been reviewed for conformity with U.S. Geological Survey editoral standards GEOLOGICAL SURVEY
 UNITED STATES DEPARTMENT OF THE INTERIOR GEOLOGICAL SURVEY Minimum landslide damage in the United States, 1973-1983 by Earl E. ~rabhl/ Open-File Report 84-486 This report is preliminary and has not been
If you have any questions concerning this report, please feel free to contact me. REPORT OF LABORATORY ANALYSIS
 #=CL# LIMS USE: FR - JILL LAVOIE LIMS OBJECT ID: July 16, 2015 Jill Lavoie Merrimack Village District - UCMR3 2 Greens Pond Road Merrimack, NH 03054 RE: Dear Jill Lavoie: Enclosed are the analytical results
DOWNLOAD OR READ : USA PLANNING MAP PDF EBOOK EPUB MOBI
 DOWNLOAD OR READ : USA PLANNING MAP PDF EBOOK EPUB MOBI Page 1 Page 2 usa planning map usa planning map pdf usa planning map Printable USA Blank Map, USA Blank Map PDF, Blank US State Map. Thursday, 19
National Wildland Significant Fire Potential Outlook
 National Wildland Significant Fire Potential Outlook National Interagency Fire Center Predictive Services Issued: April 1, 2008 Next Issue: May 1, 2008 Wildland Fire Outlook April 2008 through July 2008
30 Years - 20 State DOTs Trends in Pavement Management observed through real world Implementation at the State DOT Level.
 30 Years - 20 State DOTs Trends in Pavement Management observed through real world Implementation at the State DOT Level. Zavitski, Jeffrey L & Piane, Robert R, P. Eng. Deighton Associates Limited Agenda
Crop / Weather Update
 Crop / Weather Update Corn Crop Condition Percent of Acreage Rated Good or Excellent 85 80 75 70 65 60 55 50 45 In its weekly Crop Progress Report for September 16, the USDA stated the 18-state average
Rank University AMJ AMR ASQ JAP OBHDP OS PPSYCH SMJ SUM 1 University of Pennsylvania (T) Michigan State University
 Michigan State University") Rank University AMJ AMR ASQ JAP OBHDP OS PPSYCH SMJ SUM 1 University of Pennsylvania 4 1 2 0 2 4 0 9 22 2(T) Michigan State University 2 0 0 9 1 0 0 4 16 University of Michigan 3 0 2 5 2 0 0 4 16 4 Harvard
Rank University AMJ AMR ASQ JAP OBHDP OS PPSYCH SMJ SUM 1 University of Pennsylvania 4 1 2 0 2 4 0 9 22 2(T) Michigan State University 2 0 0 9 1 0 0 4 16 University of Michigan 3 0 2 5 2 0 0 4 16 4 Harvard
KS PUBL 4YR Kansas State University Pittsburg State University SUBTOTAL-KS
 Report ID: USSR8072-V3 Page No. 1 Jurisdiction: ON-CAMPUS IL PUBL TCH DeVry University Addison 1 0 0 0 Eastern Illinois University 1 0 0 0 Illinois State University 0 0 2 0 Northern Illinois University
Chapter 11 : State SAT scores for 1982 Data Listing
 EXST3201 Chapter 12a Geaghan Fall 2005: Page 1 Chapter 12 : Variable selection An example: State SAT scores In 1982 there was concern for scores of the Scholastic Aptitude Test (SAT) scores that varied
2011 NATIONAL SURVEY ON DRUG USE AND HEALTH
 2011 NATIONAL SURVEY ON DRUG USE AND HEALTH PERSON-LEVEL SAMPLING WEIGHT CALIBRATION Prepared for the 2011 Methodological Resource Book Contract No. HHSS283200800004C RTI Project No. 0211838.207.004 Phase
112th U.S. Senate ACEC Scorecard
 112th U.S. Senate ACEC Scorecard HR 658 FAA Funding Alaska Alabama Arkansas Arizona California Colorado Connecticut S1 Lisa Murkowski R 100% Y Y Y Y Y Y Y Y Y S2 Mark Begich D 89% Y Y Y Y N Y Y Y Y S1
Introducing North America
 Introducing North America I. Quick Stats Includes U.S. & Canada U.S consists of 50 States Federal Government Democracy 4 th in world w/ land area 3 rd in population Economic leader of free world II. Major
Lackawanna County Migration Patterns
 Lackawanna County Migration Patterns 1990 2008 1/1/2010 The Institute for Public Policy & Economic Development A partnership among Keystone College, King s College, Luzerne County Community College, Marywood
Crop / Weather Update
 Crop / Weather Update The next will be published November 13, 2018, due to the Veteran s Day holiday on Monday. Corn Harvesting Progress 100% 90% 80% 70% 60% 50% 40% 30% 20% 10% 0% 9/9 9/16 9/23 9/30 10/7
State Section S Items Effective October 1, 2017
 State Section S Items Effective October 1, 2017 Overview The tables list the Section S items that will be active on records with a target date on or after October 1, 2017. The active item on each item
14. Where in the World is Wheat?
 14. Where in the World is Wheat? Overview Every year thousands of acres of land are planted with wheat, which provides food for people and animals around the world. However, wheat cannot be grown in all
Crop / Weather Update
 Crop / Weather Update This is our last for the 2018 planting, growing and harvesting seasons. USDA will publish their Crop Progress Report again in April 2019, and we will continue our coverage sometime
PHYSICS BOWL - APRIL 22, 1998
 AAPT/Metrologic High School Physics Contest PHYSICS BOWL - APRIL 22, 1998 40 QUESTIONS 45 MINUTES This contest is sponsored by the American Association of Physics Teachers (AAPT) and Metrologic Instruments
Monthly Long Range Weather Commentary Issued: SEPTEMBER 19, 2016 Steven A. Root, CCM, Chief Analytics Officer, Sr. VP,
 Monthly Long Range Weather Commentary Issued: SEPTEMBER 19, 2016 Steven A. Root, CCM, Chief Analytics Officer, Sr. VP, sroot@weatherbank.com SEPTEMBER 2016 Climate Highlights The Month in Review The contiguous
William Battye * EC/R Incorporated, Chapel Hill, NC. William Warren-Hicks, Ph.D. EcoStat, Inc., Mebane, NC
 MODULATING EMISSIONS FROM ELECTRIC GENERATING UNITS AS A FUNCTION OF METEOROLOGICAL VARIABLES William Battye * EC/R Incorporated, Chapel Hill, NC William Warren-Hicks, Ph.D. EcoStat, Inc., Mebane, NC Steve
SEASONAL SMARTS DIGEST
 SEASONAL SMARTS DIGEST At home edition: Fall 2017 This digest uses the previous four years worth of actual Farmers Insurance claims data from homes around the country to highlight some of each season s
Physical Features of Canada and the United States
 I VIUAL Physical Features of Canada and the United tates 170 ARCTIC OCA Aleutian s 1 Bering ea ALAKA Yukon R. Mt. McKinley (20,320 ft. 6,194 m) Gulf of Alaska BROOK RAG RAG Queen Charlotte s R Vancouver
Crop / Weather Update
 Crop / Weather Update Corn Crop Condition Percent of Acreage Rated Good or Excellent 85 80 75 70 65 60 55 50 45 Corn condition this week is the same as the last two weeks in the good/excellent category,