Best Facade Best Practice for Double Skin Facades WP4: Simple Calculation Method
|
|
|
- Lydia Hardy
- 6 years ago
- Views:
Transcription

1 Best Facade Best Practice for Double Skin Facades WP4: Simple Calculation Method
2 Overview on WP4: Simple Calculation Method Background: assessment of the thermal behaviour and energy-efficiency of naturally or mechanically ventilated double skin facades only possible by using (complex) simulation tools Goal: development of an assessment method: - integratable into assessment methods of the EPBD / harmonized with CEN standards - sufficient accuracy of thermal behaviour and energy performance - usable for construction guides Main work to do regarding the assessment method: - approximation of the airflow in the facade interspace - adaptation of the utilisation factor of the solar gains to different facade systems - comparison to results from simulations in different climatic regions
3 Overview on WP4: Simple Calculation Method Deliverables: (paper version + interactive usable internet tool), month 24 - D7: simple calculation method (module for the integration in the extended ISO 13790/EN 832) - D8: energy design guide for the assessment of the influence parameters of DSF in the early planning phase Contributions: - coordination + presentation of results to CEN: FhG-IBP - assistance in approximation of airflow + temperatures in the facade interspace: IWT, ULUND, BBRI - validation tasks (existing monitoring results), functional trend scenarios dependent on the external influence parameters (temperature, solar radiation, wind) to be integrated as rules of thumb where required, documentation of application of method at selected test examples: MAB, NKUA, DIMGLASS, ENTPE, ULUND, WSP, Skanska - provision of monitoring data of built examples: industry partners


4 Literature review A literature review was done, only some general data is available

5 Development of an EP calculation method A monthly based calculation approach, based on the concepts for glazed buffers in ISO EN will be developed. Existing simplifications from literature review will be used
6
7 The CEN Model
8 The DIN approach
9 The WIS approach
10 WIS/ Platzer DIN V Φ qi,e Φ qe,w Φ u I s I s Φ s,tr Φ abs,p Φ s,sd Φ s,u Φ s,opak Φ abs,u Φ u = Φ abs,u +Φ abs,p +Φ qe,w +Φ qi,e Φ u = Φ s,u - Φ s,tr - Φ s,opak The formula for ϑ u versus Φ u is the same in both approaches but not the calculation of Φ u
11 Φ u Φ qi,e Φ qe,w I s I s Φ s,tr Φ abs,p Φ s,sd Φ s,u Φ s,opak Φ abs,u Φ Φ abs, u = τ e, e A j α I Φ abs, p = τ e, e Ap α e, p j s I s U P R qi, e = Aw I s qi, e = Aw I s ( g e τ e, e ip ) Φ s, u = Aue g eff, ue FF, ue I Φ s, tr = FF, iu Aiu g eff, iu FF, ue τ e, ue s I s Φ qe, w = τ = τ e, e e, e A A w w F F F, w F, w I I s s q e, w (1 g w ρ ) w Φ s, opak = 0 Φ u = (ΦΦ abs,u +Φ abs,p +Φ qe,w +Φ qi,e ) F S F Ce F Fe Φ u = Φ s,u - Φ s,tr
12 Balancing of a zone Φ u Φ qi,e Φ qe,w I s I s Φ s,tr Φ abs,p Φ s,sd Φ s,u Φ s,opak Φ si Φ T,u Φ abs,u WIS/ Platzer DIN V Φ = (1 F ) F si u s in Φ u F Ce F Fe Φ u ΦT u = HT ui ( ϑu ϑ ),, i Φ sd = I v + τ F e, e Cp F α Fe e, p F Ce A p F s U ( F p Cw R pu g ) w F Fw A w Φ s, tr = I s τ e, ue FF, ue g eff, iu FF, iu Φ s, opak = 0 g a g A tot eff = FW FV min FS g iu + (1 a) g
13 Glazing outside: Glazing inside: Brüstung: A = 27,39 m³ A = 18,26 m³ A = 9,13 m³ g _I_ = 0,76 g _I_ = 0,54 α = 0,6 t e,e = 0,73 ρ e = 0,074 F Fe =F ue =0,95 g eff,sommer = 0,30; g eff,winter = 0,41 F Fw = F ui =0,81 g eff,sommer = 0,21 g eff,winter = 0,29 obstructions, shading, framing, dust is missing U P = 0,6W/m²K R Pu = 0,13 W/m²K Building elements in the gap: A = 27,39 m³, α = 0,4 Ansatz Dr. Platzer DIN V Φ abs,u Φ abs,p Φ qe,w Φ qi,e Φ u [W] Φ u [W] Φ s,tr Φ s,u Jan 479,87 18,72 248,98 49,30 517,97 463,69 178,72 642,41 Feb 543,86 21,21 282,18 55,88 587,03 525,52 202,55 728,07 Mrz 799,79 31,19 414,97 82,17 863,28 772,82 297, ,69 Apr 999,74 38,99 518,71 102, ,10 699,80 269,73 969,52 Mai 1.015,73 39,61 527,01 104, ,36 710,99 274,04 985,04 Jun 1.103,71 43,04 572,66 113, ,32 772,58 297, ,35 Jul 935,75 36,49 485,51 96, ,03 655,01 252,46 907,47 Aug 783,79 30,57 406,67 80,53 846,01 548,64 211,47 760,11 Sep 783,79 30,57 406,67 80,53 846,01 548,64 211,47 760,11 Okt 655,83 25,58 340,27 67,38 707,89 633,71 244,26 877,97 Nov 319,92 12,48 165,99 32,87 345,31 309,13 119,15 428,28 Dez 271,93 10,61 141,09 27,94 293,51 262,76 101,28 364,04
14 ϑ U = Φ U + ϑ ( H e H T, ue T, ue + V, ue ) + ϑi ( T, iu ) + H H V, ue + H T, iu H Dr. Platzer: H v,ue = 2 0,34 n V n Sommer = 2 h -1 n Winter = 30 h -1 DIN V 18599: H v,ue = 0,34 n ue V u n ue = 10 h -1 Temperatur Platzer DIN V DIN V ϑ i ϑ e Φ u ϑ U Φ s,u ϑ U Φ s,u ϑ U [ C] [ C] [W] [ C] [W] [ C] [W] [ C] Jan 19,5-1,3 517,97 1,2 463,69 5,3 517,97 5,6 Feb 19,7 0,6 587,03 3,1 525,52 7,2 587,03 7,6 Mrz 19,9 4,1 863,28 6,9 772,82 11,4 863,28 11,9 Apr 20,4 9, ,10 19,6 699,80 15, ,10 17,5 Mai 20,5 12, ,36 22,3 710,99 18, ,36 20,3 Jun 20,7 15, ,32 25,1 772,58 20, ,32 23,1 Jul 20,8 18, ,03 25,6 655,01 22, ,03 24,0 Aug 20,6 18,3 846,01 24,7 548,64 21,7 846,01 23,3 Sep 20,6 14,4 846,01 21,8 548,64 18,6 846,01 20,2 Okt 20,3 9,1 707,89 11,3 633,71 14,7 707,89 15,1 Nov 19,9 4,7 345,31 6,4 309,13 9,4 345,31 9,6 Dez 19,7 1,3 293,51 3,2 262,76 6,4 293,51 6,5


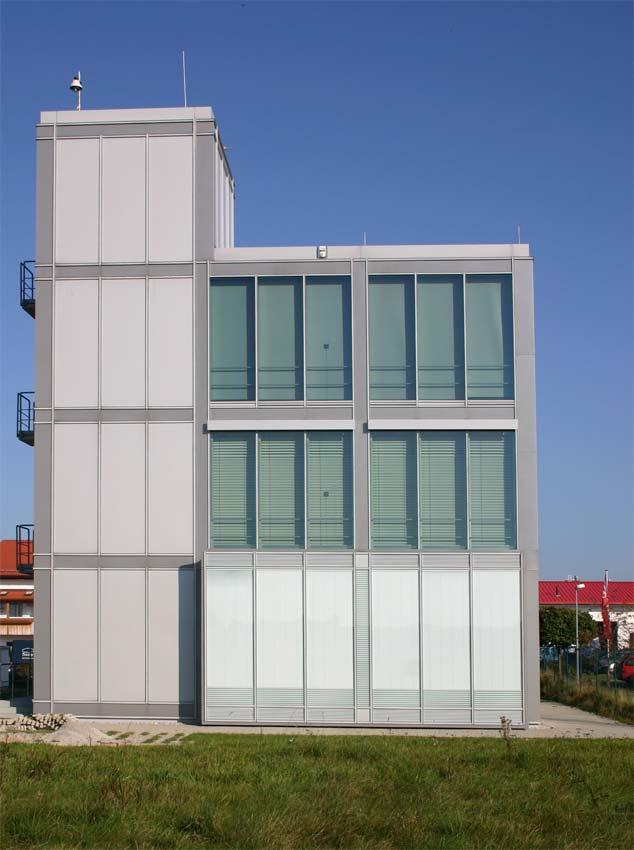
15 Basic measured datas from VERU

![Lüftungsklappen GDF Öffnungszeit [%] 60 50 40 30 20 10 0 Jan Feb Mrz](/docs-images/71/66024197/images/16-2.jpg "April Mai Jun Jul Aug Sept Okt Nov Validationperiode May 2005 to March")
16 Validation Control criteria ventilation wings: ϑ outside < 10 C: Wings closed ϑ outside > 10 C: Wings opened Öffnungszeiten Lüftungsklappen GDF Öffnungszeit [%] Jan Feb Mrz April Mai Jun Jul Aug Sept Okt Nov Validationperiode May 2005 to March 2006 Dez
17 Validation Comparison of the measured daily mean values of air temperatures in the GDF gap versus the outside Außenluft GDF Temperatur [ C] 10 0 Summer mode -10 Winter mode Zeit [d] Investigation period May 2005 to March 2006
18 Validation Monthly mean values of outside air temperature and air temperature in the gap of the GDF (measurements versus DIN V 18599) Messung n = 10 h -1 n win =30h -1, n Som =2h -1 n win=0h -1, n Som =15h -1 ϑ e ϑu Φu ϑu ϑu ϑu [ C] [ C] [W] [ C] [ C] [ C] Jan -6,20 4,90 463,69 1,4-1,8 5,7 Feb -3,10 7,00 525,52 4,3 1,2 8,4 Mrz -0,10 9,70 772,82 8,0 4,6 12,6 Apr 699,80 15,4 17,8 14,5 Mai 12,30 17,20 710,99 17,8 20,0 16,9 Jun 16,30 19,10 772,58 21,3 23,4 20,6 Jul 16,70 18,90 655,01 21,0 22,8 20,4 Aug 14,50 16,80 548,64 18,7 20,4 18,0 Sep 13,80 17,10 548,64 18,1 19,8 17,4 Okt 8,80 13,90 633,71 14,5 12,1 17,7 Nov 1,60 9,00 309,13 6,9 4,7 9,9 Dez -2,60 5,70 262,76 3,3 0,8 6,5
19 Main results so far - The DIN/CEN approach fits well the measured data if ventilation rates are known - few information on ventilation rates is available - project investigations has to be concentrated on this issue - some extra validation for different facades should be done (WIS versus DIN/CEN)
20 Planned validation (WIS vs. DIN/CEN) Monthly mean values of air temperature in the gap of the GDF s
21 Rough estimations from experiences VERU - monthly mean space temperature 3 (Summer) to 10 K (Winter) above monthly mean outside temperature - maximal space temperature appr. 15 to 20 K above max. outside temperature - minimum space temperature slightly above minimum outside temperature Baden - Autumm periode: mean space temperature 2 to 3 K above mean outside temperature, mean air velocity in the space appr. 0,2 m/s - Summer periods: mean space temperature 4 to 8 K above mean outside temperature, mean air velocity in the space appr. 0,3 to 0,4 m/s
22 Rough estimations from experiences Müller et. alli: - monthly mean space temperature and air velocity not recorded - maximal space temperature appr. 15 to 20 K above max. outside temperature - minimum space temperature not recorded RWE-Tower Essen Victoria Versicherung Düsseldorf Temperatur [ C] Te_mess Tg_mess Ti_mess Tg_model Temperatur [ C] Uhrzeit [h] Te_mess Tg_mess Ti_mess Tg_model Uhrzeit [h]
23 Basic data from the PhD-work Ziller 150 bis 250 h -1 2 bis 5 K Approximation (per m length): 3m height x 0,5 m depth = 1,5 m³ 0,3 m/s x 0,5 m² = 0,15 m³/s Air change rate: 0,15/1,5 = 0,1 s -1 = 360 h -1
24 Other existing useful basic datas and contributions - BBRI: mechanical ventilated DSF and natural ventilated multi-storey DSF - Aalborg university: measurements at testing facility provided by ULUND - IWT: school in Baden sporadic measurements (already analysed) - Who is responsible for an approximation approach of the air flow rate in the gap (ULUND or IWT)??? - BBRI and IBP will work on some validations (CEN vs. WIS)


25 Energy design guide Innovative building concepts should be optimized by an integrated planning process. High performance facades in combination with regenerative energy service systems results in low demands
26 Additional to the heating & cooling calculation approach we need an integration of (day)-lighting effects P(t) Q = t Ende P () t dt P max t Anfang t 1 t äq t 2 t Q = P max t äq
27 Calculations approach Q Licht = N [ pn [ A TL,n (t n + t eff, Nacht, n ) + A KTL,n (t n + t eff, Nacht, n )] + Q n ] eff, Tag, eff, Tag, KTL, par, n = 1 Installed power Daylighthours incl. Control system Presens sensor Parasitary effects Daylight zone Zone without daylight influence
28 Daylighting indicated by an effective operation time Q Licht = N [ pn [ A TL,n (t eff,tag,n + t n ) + A KTL,n (t eff,tag,ktl,n + t n )] + Qpar,n ] eff,nacht, eff,nacht, n= 1 t t eff, Tag, KTL, eff, Tag, TL, n n = = t t Tag,n Tag,n F F TL,n Pr ä,n F Pr ä,n F Pr ä,n = 1 C A,n C Pr ä,kon,n Absensefractionin thezone Effectiveness of an absense control system t eff, Nacht, n F = 1 C C = tnacht,n FPr ä,n TL,n TL,Vers,n TL,kon, n Daylight delivery factor Factor of effectiveness for the control system
")
29 The interactive internet tool (an approach) E:\Hans\Fassadenauslegungstool\index.html
30 Expected contributions According to the contract: - coordination + presentation of results to CEN: FhG-IBP - assistance in approximation of airflow + temperatures in the facade interspace: IWT, ULUND, BBRI - validation tasks (existing monitoring results), functional trend scenarios dependent on the external influence parameters (temperature, solar radiation, wind) to be integrated as rules of thumb where required, documentation of application of method at selected test examples: MAB, NKUA, ISQ, DIMGLASS, ENTPE, ULUND, WSP, Skanska - provision of monitoring data of built examples: industry partners Manpower (Ph): IBP 600; ISQ 600; NKUA 350; LASH 350; BBRI 350; IWT 300 ULUND 150; MCE 100; Dimglass 50; WSP 50; SKANSKA 50 Themes: IBP procedure; ITW & ULUND approximation airflow; BBRI validation ISQ & NKUA & LASH design guide; industry partners informations
BESTFAÇADE Best Practice for Double Skin Façades EIE/04/135/S
 BESTFAÇADE Best Practice for Double Skin Façades EIE/04/135/S07.38652 WP 4 Report Simple calculation method Reporting Period: 1.7.2005 30.6.2007 Deliverable date: 30.6.2007 Editor: Hans Erhorn, Fraunhofer-Institute
GAMINGRE 8/1/ of 7
 FYE 09/30/92 JULY 92 0.00 254,550.00 0.00 0 0 0 0 0 0 0 0 0 254,550.00 0.00 0.00 0.00 0.00 254,550.00 AUG 10,616,710.31 5,299.95 845,656.83 84,565.68 61,084.86 23,480.82 339,734.73 135,893.89 67,946.95
Experimental measurements and analysis of the indoor conditions in Italian museum storerooms: a study case
 Experimental measurements and analysis of the indoor conditions in Italian museum storerooms: a study case F. Cappelletti, P. Romagnoni and A. Birra University Iuav of Venezia, Italy Aims and methods Analysis
TREES Training for Renovated Energy Efficient Social housing
 TREES Training for Renovated Energy Efficient Social housing Intelligent Energy -Europe programme, contract n EIE/05/110/SI2.420021 Section 2 Tools 2.1 Simplified heating load calculation Tamas CSOKNYAI
C L I M A T E R E S P O N S I V E U R B A N D E S I G N F O R G R E E K P U B L I C S P A C E
 C L I M A T E R E S P O N S I V E U R B A N D E S I G N F O R G R E E K P U B L I C S P A C E Prepared by: Ioannis Karakounos With the guidance of: Raphael Lafargue Kristina Von Bomhard Concept Make public
Climatography of the United States No
 Climate Division: AK 5 NWS Call Sign: ANC Month (1) Min (2) Month(1) Extremes Lowest (2) Temperature ( F) Lowest Month(1) Degree s (1) Base Temp 65 Heating Cooling 90 Number of s (3) Jan 22.2 9.3 15.8
Site Description: Tower Site
 Resource Summary for Elizabeth Site Final Report Colorado Anemometer Loan Program Monitoring Period: 7/3/06 /26/07 Report Date: January, 0 Site Description: The site is.6 miles northeast of the town of
Climatography of the United States No
 Climate Division: ND 8 NWS Call Sign: BIS Month (1) Min (2) Month(1) Extremes Lowest (2) Temperature ( F) Lowest Month(1) Degree s (1) Base Temp 65 Heating Cooling 100 Number of s (3) Jan 21.1 -.6 10.2
Regents Earth Science Unit 7: Water Cycle and Climate
 Regents Earth Science Unit 7: Water Cycle and Climate Name Section Coastal and Continental Temperature Ranges Lab # Introduction: There are large variations in average monthly temperatures among cities
Site Description: Tower Site
 Resource Summary for Fort Collins Site Final Report Colorado Anemometer Loan Program Monitoring Period: /0/00 11/03/007 Report Date: January 1, 00 Site Description: The site is located adjacent to the
Time Series Model of Photovoltaic Generation for Distribution Planning Analysis. Jorge Valenzuela
 Time Series Model of Photovoltaic Generation for Distribution Planning Analysis Jorge Valenzuela Overview Introduction: The solar problem and our limitations Modeling What information do we have? Solar
Local Ctimatotogical Data Summary White Hall, Illinois
 SWS Miscellaneous Publication 98-5 STATE OF ILLINOIS DEPARTMENT OF ENERGY AND NATURAL RESOURCES Local Ctimatotogical Data Summary White Hall, Illinois 1901-1990 by Audrey A. Bryan and Wayne Armstrong Illinois
Future Weather in Toronto and the GTA
 Future Weather in Toronto and the GTA Due to Climate Change Electrical Sector Meeting, Nov. 23 rd, 2011 Christopher Ll. Morgan, PhD Toronto Environment Office Contents 2 Introduction (Why We Did What We
Exercise 6. Solar Panel Orientation EXERCISE OBJECTIVE DISCUSSION OUTLINE. Introduction to the importance of solar panel orientation DISCUSSION
 Exercise 6 Solar Panel Orientation EXERCISE OBJECTIVE When you have completed this exercise, you will understand how the solar illumination at any location on Earth varies over the course of a year. You
Climatography of the United States No
 Temperature ( F) Month (1) Min (2) Month(1) Extremes Lowest (2) Lowest Month(1) Degree s (1) Base Temp 65 Heating Cooling 100 Number of s (3) Jan 32.8 21.7 27.3 62 1918 1 35.8 1983-24 1950 29 10.5 1979
A PRELIMINARY MODEL OF USER BEHAVIOUR REGARDING THE MANUAL CONTROL OF WINDOWS IN OFFICE BUILDINGS
 Ninth International IBPSA Conference Montréal, Canada August 15-18, 2005 A PRELIMINARY MODEL OF USER BEHAVIOUR REGARDING THE MANUAL CONTROL OF WINDOWS IN OFFICE BUILDINGS Sebastian Herkel, Ulla Knapp and
Climatography of the United States No
 Month (1) Min (2) Month(1) Extremes Lowest (2) Temperature ( F) Lowest Month(1) Degree s (1) Base Temp 65 Heating Cooling 100 Number of s (3) Jan 63.9 39.3 51.6 86 1976 16 56.6 1986 20 1976 2 47.5 1973
Agricultural Science Climatology Semester 2, Anne Green / Richard Thompson
 Agricultural Science Climatology Semester 2, 2006 Anne Green / Richard Thompson http://www.physics.usyd.edu.au/ag/agschome.htm Course Coordinator: Mike Wheatland Course Goals Evaluate & interpret information,
Projekt Vorlage. Klima-Herausforderung WM 2022 in Katar Nachhaltige Konzepte zwischen Klimaanlage und künstlicher Wolke
 TRANSSOLAR KLIMAENGINEERING Technologies for energy efficient design and thermal comfort in buildings Stuttgart - Munich - New York Dipl.-Ing. Martin Engelhardt Dr. Wolfgang Kessling Projekt Vorlage Klima-Herausforderung
Climatography of the United States No
 Climate Division: CA 2 NWS Call Sign: Month (1) Min (2) Month(1) Extremes Lowest (2) Temperature ( F) Lowest Month(1) Degree s (1) Base Temp 65 Heating Cooling 100 Number of s (3) Jan 55.6 38.8 47.2 81
Climatography of the United States No
 Climate Division: CA 1 NWS Call Sign: Month (1) Min (2) Month(1) Extremes Lowest (2) Temperature ( F) Lowest Month(1) Degree s (1) Base Temp 65 Heating Cooling 100 Number of s (3) Jan 52.4 35.4 43.9 69
Climatography of the United States No
 Climate Division: CA 2 NWS Call Sign: Month (1) Min (2) Month(1) Extremes Lowest (2) Temperature ( F) Lowest Month(1) Degree s (1) Base Temp 65 Heating Cooling 100 Number of s (3) Jan 53.5 37.6 45.6 78
Climatography of the United States No
 Climate Division: CA 1 NWS Call Sign: Month (1) Min (2) Month(1) Extremes Lowest (2) Temperature ( F) Lowest Month(1) Degree s (1) Base Temp 65 Heating Cooling 1 Number of s (3) Jan 56.2 4.7 48.5 79 1962
Climatography of the United States No
 Climate Division: CA 1 NWS Call Sign: Month (1) Min (2) Month(1) Extremes Lowest (2) Temperature ( F) Lowest Month(1) Degree s (1) Base Temp 65 Heating Cooling 100 Number of s (3) Jan 50.2 31.2 40.7 65+
Climatography of the United States No
 Climate Division: CA 4 NWS Call Sign: Month (1) Min (2) Month(1) Extremes Lowest (2) Temperature ( F) Lowest Month(1) Degree s (1) Base Temp 65 Heating Cooling 100 Number of s (3) Jan 61.9 42.0 52.0 89
Climatography of the United States No
 Climate Division: CA 6 NWS Call Sign: Month (1) Min (2) Month(1) Extremes Lowest (2) Temperature ( F) Lowest Month(1) Degree s (1) Base Temp 65 Heating Cooling 100 Number of s (3) Jan 66.1 38.3 52.2 91
Climatography of the United States No
 Climate Division: CA 6 NWS Call Sign: Month (1) Min (2) Month(1) Extremes Lowest (2) Temperature ( F) Lowest Month(1) Degree s (1) Base Temp 65 Heating Cooling 100 Number of s (3) Jan 51.5 35.0 43.3 80
Climatography of the United States No
 Climate Division: CA 4 NWS Call Sign: Month (1) Min (2) Month(1) Extremes Lowest (2) Temperature ( F) Lowest Month(1) Degree s (1) Base Temp 65 Heating Cooling 100 Number of s (3) Jan 61.4 33.1 47.3 82+
Changing Hydrology under a Changing Climate for a Coastal Plain Watershed
 Changing Hydrology under a Changing Climate for a Coastal Plain Watershed David Bosch USDA-ARS, Tifton, GA Jeff Arnold ARS Temple, TX and Peter Allen Baylor University, TX SEWRU Objectives 1. Project changes
Climatography of the United States No
 Climate Division: CA 4 NWS Call Sign: Month (1) Min (2) Month(1) Extremes Lowest (2) Temperature ( F) Lowest Month(1) Degree s (1) Base Temp 65 Heating Cooling 100 Number of s (3) Jan 55.6 39.3 47.5 77
Climatography of the United States No
 Climate Division: CA 1 NWS Call Sign: Month (1) Min (2) Month(1) Extremes Lowest (2) Temperature ( F) Lowest Month(1) Degree s (1) Base Temp 65 Heating Cooling 100 Number of s (3) Jan 57.9 38.9 48.4 85
Climatography of the United States No
 Climate Division: CA 5 NWS Call Sign: Month (1) Min (2) Month(1) Extremes Lowest (2) Temperature ( F) Lowest Month(1) Degree s (1) Base Temp 65 Heating Cooling 100 Number of s (3) Jan 56.6 36.5 46.6 81
Jackson County 2013 Weather Data
 Jackson County 2013 Weather Data 61 Years of Weather Data Recorded at the UF/IFAS Marianna North Florida Research and Education Center Doug Mayo Jackson County Extension Director 1952-2008 Rainfall Data
Climatography of the United States No
 Climate Division: CA 6 NWS Call Sign: Month (1) Min (2) Month(1) Extremes Lowest (2) Temperature ( F) Lowest Month(1) Degree s (1) Base Temp 65 Heating Cooling 100 Number of s (3) Jan 69.4 46.6 58.0 92
Climatography of the United States No
 Climate Division: CA 5 NWS Call Sign: Month (1) Min (2) Month(1) Extremes Lowest (2) Temperature ( F) Lowest Month(1) Degree s (1) Base Temp 65 Heating Cooling 100 Number of s (3) Jan 44.8 25.4 35.1 72
Climatography of the United States No
 Climate Division: CA 4 NWS Call Sign: Month (1) Min (2) Month(1) Extremes Lowest (2) Temperature ( F) Lowest Month(1) Degree s (1) Base Temp 65 Heating Cooling 1 Number of s (3) Jan 58.5 38.8 48.7 79 1962
Climatography of the United States No
 Climate Division: CA 1 NWS Call Sign: Month (1) Min (2) Month(1) Extremes Lowest (2) Temperature ( F) Lowest Month(1) Degree s (1) Base Temp 65 Heating Cooling 1 Number of s (3) Jan 57.8 39.5 48.7 85 1962
Climatography of the United States No
 Climate Division: CA 4 NWS Call Sign: Month (1) Min (2) Month(1) Extremes Lowest (2) Temperature ( F) Lowest Month(1) Degree s (1) Base Temp 65 Heating Cooling 100 Number of s (3) Jan 49.4 37.5 43.5 73
Climatography of the United States No
 Climate Division: CA 6 NWS Call Sign: Month (1) Min (2) Month(1) Extremes Lowest (2) Temperature ( F) Lowest Month(1) Degree s (1) Base Temp 65 Heating Cooling 1 Number of s (3) Jan 67.5 42. 54.8 92 1971
2018 Annual Review of Availability Assessment Hours
 2018 Annual Review of Availability Assessment Hours Amber Motley Manager, Short Term Forecasting Clyde Loutan Principal, Renewable Energy Integration Karl Meeusen Senior Advisor, Infrastructure & Regulatory
Climatography of the United States No
 Climate Division: SC 7 NWS Call Sign: CHS Month (1) Min (2) Month(1) Extremes Lowest (2) Temperature ( F) Lowest Month(1) Degree s (1) Base Temp 65 Heating Cooling 100 Number of s (3) Jan 58.9 36.9 47.9
Climatography of the United States No
 Climate Division: TN 1 NWS Call Sign: Month (1) Min (2) Month(1) Extremes Lowest (2) Temperature ( F) Lowest Month(1) Degree s (1) Base Temp 65 Heating Cooling 100 Number of s (3) Jan 47.6 24.9 36.3 81
Climatography of the United States No
 Climate Division: CA 5 NWS Call Sign: FAT Month (1) Min (2) Month(1) Extremes Lowest (2) Temperature ( F) Lowest Month(1) Degree s (1) Base Temp 65 Heating Cooling 1 Number of s (3) Jan 53.6 38.4 46. 78
Climatography of the United States No
 Climate Division: CA 6 NWS Call Sign: 1L2 N Lon: 118 3W Month (1) Min (2) Month(1) Extremes Lowest (2) Temperature ( F) Lowest Month(1) Degree s (1) Base Temp 65 Heating Cooling 1 Number of s (3) Jan 63.7
Climatography of the United States No
 Climate Division: CA 5 NWS Call Sign: BFL Month (1) Min (2) Month(1) Extremes Lowest (2) Temperature ( F) Lowest Month(1) Degree s (1) Base Temp 65 Heating Cooling 1 Number of s (3) Jan 56.3 39.3 47.8
Climatography of the United States No
 Climate Division: TN 3 NWS Call Sign: BNA Month (1) Min (2) Month(1) Extremes Lowest (2) Temperature ( F) Lowest Month(1) Degree s (1) Base Temp 65 Heating Cooling 100 Number of s (3) Jan 45.6 27.9 36.8
DEFINING THE PERFORMANCE OF THE DOUBLE SKIN FAÇADE WITH THE USE OF THE SIMULATION MODEL
 Eighth International IBPSA Conference Eindhoven, Netherlands August -4, 003 DEFINING THE PERFORMANCE OF THE DOUBLE SKIN FAÇADE WITH THE USE OF THE SIMULATION MODEL Wojtek Stec & Dolf van Paassen Energy
BRADSHAW'S RAILWAY GUIDE : accessible copies
 BRADSHAW'S RAILWAY GUIDE : accessible copies Y = copy held; YS = copy held with supplement; R = reprint held; I = incomplete copy held; F = fragile copy (not available for general public - access limited);
Climatography of the United States No
 Climate Division: CA 5 NWS Call Sign: Elevation: 6 Feet Lat: 37 Month (1) Min (2) Month(1) Extremes Lowest (2) Temperature ( F) Lowest Month(1) Degree s (1) Base Temp 65 Heating Cooling 1 Number of s (3)
Climatography of the United States No
 Climate Division: CA 4 NWS Call Sign: Elevation: 2 Feet Lat: 37 Month (1) Min (2) Month(1) Extremes Lowest (2) Temperature ( F) Lowest Month(1) Degree s (1) Base Temp 65 Heating Cooling 1 Number of s (3)
Climatography of the United States No
 Climate Division: CA 4 NWS Call Sign: Elevation: 13 Feet Lat: 36 Month (1) Min (2) Month(1) Extremes Lowest (2) Temperature ( F) Lowest Month(1) Degree s (1) Base Temp 65 Heating Cooling 1 Number of s
Climatography of the United States No
 Climate Division: CA 5 NWS Call Sign: Elevation: 1,14 Feet Lat: 36 Month (1) Min (2) Month(1) Extremes Lowest (2) Temperature ( F) Lowest Month(1) Degree s (1) Base Temp 65 Heating Cooling 1 Number of
CLIMATE OVERVIEW. Thunder Bay Climate Overview Page 1 of 5
 CLIMATE OVERVIEW The climate in the Thunder Bay area is typical of a mid-latitude inland location with a Great Lake Moderating influence. The moderating effect of Lake Superior results in cooler summer
Climatography of the United States No
 Climate Division: CA 6 NWS Call Sign: LAX Elevation: 1 Feet Lat: 33 Month (1) Min (2) Month(1) Extremes Lowest (2) Temperature ( F) Lowest Month(1) Degree s (1) Base Temp 65 Heating Cooling 1 Number of
Climatography of the United States No
 Climate Division: CA 6 NWS Call Sign: TOA Elevation: 11 Feet Lat: 33 2W Temperature ( F) Month (1) Min (2) Month(1) Extremes Lowest (2) Lowest Month(1) Degree s (1) Base Temp 65 Heating Cooling 1 Number
Summary of Seasonal Normal Review Investigations CWV Review
 Summary of Seasonal Normal Review Investigations CWV Review DESC 31 st March 2009 1 Contents Stage 1: The Composite Weather Variable (CWV) An Introduction / background Understanding of calculation Stage
Climatography of the United States No
 No. 2 1971-2 Asheville, North Carolina 2881 COOP ID: 4792 Climate Division: CA 6 NWS Call Sign: Month (1) Min (2) Month(1) Extremes Lowest (2) Temperature ( F) Lowest Month(1) Degree s (1) Base Temp 65
Climatography of the United States No
 No. 2 1971-2 Asheville, North Carolina 2881 COOP ID: 46646 Climate Division: CA 4 NWS Call Sign: 8W Month (1) Min (2) Month(1) Extremes Lowest (2) Temperature ( F) Lowest Month(1) Degree s (1) Base Temp
ENGINE SERIAL NUMBERS
 ENGINE SERIAL NUMBERS The engine number was also the serial number of the car. Engines were numbered when they were completed, and for the most part went into a chassis within a day or so. However, some
2003 Moisture Outlook
 2003 Moisture Outlook Nolan Doesken and Roger Pielke, Sr. Colorado Climate Center Prepared by Tara Green and Odie Bliss http://climate.atmos.colostate.edu Through 1999 Through 1999 Fort Collins Total Water
Climatography of the United States No
 No. 2 1971-2 Asheville, North Carolina 2881 COOP ID: 43417 Climate Division: CA 4 NWS Call Sign: N Lon: 121 Month (1) Min (2) Month(1) Extremes Lowest (2) Temperature ( F) Lowest Month(1) Degree s (1)
Drought in Southeast Colorado
 Drought in Southeast Colorado Nolan Doesken and Roger Pielke, Sr. Colorado Climate Center Prepared by Tara Green and Odie Bliss http://climate.atmos.colostate.edu 1 Historical Perspective on Drought Tourism
Determine the trend for time series data
 Extra Online Questions Determine the trend for time series data Covers AS 90641 (Statistics and Modelling 3.1) Scholarship Statistics and Modelling Chapter 1 Essent ial exam notes Time series 1. The value
Climatography of the United States No
 No. 2 1971-2 Asheville, North Carolina 2881 COOP ID: 4795 Climate Division: CA 6 NWS Call Sign: SBA Month (1) Min (2) Month(1) Extremes Lowest (2) Temperature ( F) Lowest Month(1) Degree s (1) Base Temp
INVESTIGATIONS ON SOLAR THERMAL PROCESS HEAT INTEGRATION WITH PARABOLIC TROUGH COLLECTORS
 INVESTIGATIO ON SOLAR THERMAL PROCESS HEAT INTEGRATION WITH PARABOLIC TROUGH COLLECTORS Heinz Marty and Elimar Frank HSR University of Applied Science of Rapperswil, Institut fuer Solartechnik SPF, 8640
Climatography of the United States No
 No. 2 1971-2 Asheville, North Carolina 2881 COOP ID: 46175 Climate Division: CA 6 NWS Call Sign: 3L3 Elevation: 1 Feet Lat: 33 Month (1) Min (2) Month(1) Extremes Lowest (2) Temperature ( F) Lowest Month(1)
Climatography of the United States No
 No. 2 1971-2 Asheville, North Carolina 2881 COOP ID: 42713 Climate Division: CA 7 NWS Call Sign: Elevation: -3 Feet Lat: 32 Month (1) Min (2) Month(1) Extremes Lowest (2) Temperature ( F) Lowest Month(1)
Colorado s 2003 Moisture Outlook
 Colorado s 2003 Moisture Outlook Nolan Doesken and Roger Pielke, Sr. Colorado Climate Center Prepared by Tara Green and Odie Bliss http://climate.atmos.colostate.edu How we got into this drought! Fort
Aerosol Measurements at Sonnblick
 Aerosol Measurements at Sonnblick Anne Kasper-Giebl Dietmar Wagenbach (per pro.) Institut für Umweltphysik, Univ. Heidelberg, Presently at Klima und Umweltphysik, Univ. Bern I Time series of aerosol measurements
Climatography of the United States No
 Month (1) Min (2) Month(1) Extremes Lowest (2) Temperature ( F) Lowest Month(1) Degree s (1) Base Temp 65 Heating Cooling 100 Number of s (3) 42.6 24.2 33.4 79 1950 25 44.2 1974-16 1994 19 18.8 1977 977
Increasing Transmission Capacities with Dynamic Monitoring Systems
 INL/MIS-11-22167 Increasing Transmission Capacities with Dynamic Monitoring Systems Kurt S. Myers Jake P. Gentle www.inl.gov March 22, 2012 Concurrent Cooling Background Project supported with funding
UWM Field Station meteorological data
 University of Wisconsin Milwaukee UWM Digital Commons Field Station Bulletins UWM Field Station Spring 992 UWM Field Station meteorological data James W. Popp University of Wisconsin - Milwaukee Follow
Climatography of the United States No
 Month (1) Min (2) Month(1) Extremes Lowest (2) Temperature ( F) Lowest Month(1) Degree s (1) Base Temp 65 Heating Cooling 100 Number of s (3) Jan 54.3 40.1 47.2 75 1998 17 53.0 1995 18 1949 11 41.7 1972
OVERVIEW OF IMPROVED USE OF RS INDICATORS AT INAM. Domingos Mosquito Patricio
 OVERVIEW OF IMPROVED USE OF RS INDICATORS AT INAM Domingos Mosquito Patricio domingos.mosquito@gmail.com Introduction to Mozambique /INAM Introduction to AGRICAB/SPIRITS Objectives Material & Methods Results
Climatography of the United States No
 Climate Division: CA 6 NWS Call Sign: Month (1) Min (2) Month(1) Extremes Lowest (2) Temperature ( F) Lowest Month(1) Degree s (1) Base Temp 65 Heating Cooling 100 Number of s (3) 68.5 45.7 57.1 90 1971
Climatography of the United States No
 Climate Division: CA 5 NWS Call Sign: Month (1) Min (2) Month(1) Extremes Lowest (2) Temperature ( F) Lowest Month(1) Degree s (1) Base Temp 65 Heating Cooling 100 Number of s (3) 59.3 31.5 45.4 80 1976
Climatography of the United States No
 Climate Division: CA 7 NWS Call Sign: Month (1) Min (2) Month(1) Extremes Lowest (2) Temperature ( F) Lowest Month(1) Degree s (1) Base Temp 65 Heating Cooling 100 Number of s (3) 44.5 29.3 36.9 69 1951
Climatography of the United States No
 Climate Division: CA 7 NWS Call Sign: Month (1) Min (2) Month(1) Extremes Lowest (2) Temperature ( F) Lowest Month(1) Degree s (1) Base Temp 65 Heating Cooling 1 Number of s (3) 64.8 45.4 55.1 85 1971
Climatography of the United States No
 Climate Division: CA 2 NWS Call Sign: Month (1) Min (2) Month(1) Extremes Lowest (2) Temperature ( F) Lowest Month(1) Degree s (1) Base Temp 65 Heating Cooling 100 Number of s (3) 53.3 37.1 45.2 77 1962
Climatography of the United States No
 Climate Division: CA 7 NWS Call Sign: Month (1) Min (2) Month(1) Extremes Lowest (2) Temperature ( F) Lowest Month(1) Degree s (1) Base Temp 65 Heating Cooling 100 Number of s (3) 70.4 44.2 57.3 95 1971
Climatography of the United States No
 Climate Division: CA 7 NWS Call Sign: Month (1) Min (2) Month(1) Extremes Lowest (2) Temperature ( F) Lowest Month(1) Degree s (1) Base Temp 65 Heating Cooling 1 Number of s (3) 65.5 38.7 52.1 87 1962
Climatography of the United States No
 Climate Division: CA 7 NWS Call Sign: Month (1) Min (2) Month(1) Extremes Lowest (2) Temperature ( F) Lowest Month(1) Degree s (1) Base Temp 65 Heating Cooling 100 Number of s (3) 56.0 35.7 45.9 83 1975
Climatography of the United States No
 Climate Division: CA 2 NWS Call Sign: Month (1) Min (2) Month(1) Extremes Lowest (2) Temperature ( F) Lowest Month(1) Degree s (1) Base Temp 65 Heating Cooling 100 Number of s (3) 53.7 32.7 43.2 79 1962
Climatography of the United States No
 Climate Division: CA 2 NWS Call Sign: Month (1) Min (2) Month(1) Extremes Lowest (2) Temperature ( F) Lowest Month(1) Degree s (1) Base Temp 65 Heating Cooling 100 Number of s (3) 53.3 31.8 42.6 74+ 1975
Climatography of the United States No
 Climate Division: CA 7 NWS Call Sign: Month (1) Min (2) Month(1) Extremes Lowest (2) Temperature ( F) Lowest Month(1) Degree s (1) Base Temp 65 Heating Cooling 100 Number of s (3) 58.8 34.3 46.6 81+ 1948
In this activity, students will compare weather data from to determine if there is a warming trend in their community.
 Overview: In this activity, students will compare weather data from 1910-2000 to determine if there is a warming trend in their community. Objectives: The student will: use the Internet to locate scientific
Atmospheric circulation analysis for seasonal forecasting
 Training Seminar on Application of Seasonal Forecast GPV Data to Seasonal Forecast Products 18 21 January 2011 Tokyo, Japan Atmospheric circulation analysis for seasonal forecasting Shotaro Tanaka Climate
The Climate of Bryan County
 The Climate of Bryan County Bryan County is part of the Crosstimbers throughout most of the county. The extreme eastern portions of Bryan County are part of the Cypress Swamp and Forest. Average annual
The Climate of Marshall County
 The Climate of Marshall County Marshall County is part of the Crosstimbers. This region is a transition region from the Central Great Plains to the more irregular terrain of southeastern Oklahoma. Average
peak half-hourly New South Wales
 Forecasting long-term peak half-hourly electricity demand for New South Wales Dr Shu Fan B.S., M.S., Ph.D. Professor Rob J Hyndman B.Sc. (Hons), Ph.D., A.Stat. Business & Economic Forecasting Unit Report
Climatography of the United States No
 Climate Division: CA 4 NWS Call Sign: Month (1) Min (2) Month(1) Extremes Lowest (2) Temperature ( F) Lowest Month(1) Degree s (1) Base Temp 65 Heating Cooling 100 Number of s (3) Jan 56.4 43.6 50.0 77
Lessons Learned From Labs 21. Retrofitting of Chemistry Laboratories University of Toronto
 Lessons Learned From Labs 21 Retrofitting of Chemistry Laboratories University of Toronto Presented by: Mike Dymarski, PhD Technical and Administrative Manager Department of Chemistry University of Toronto.
Climatography of the United States No
 Climate Division: CA 7 NWS Call Sign: Month (1) Min (2) Month(1) Extremes Lowest (2) Temperature ( F) Lowest Month(1) Degree s (1) Base Temp 65 Heating Cooling 100 Number of s (3) Jan 54.4 36.9 45.7 77+
GTR # VLTs GTR/VLT/Day %Δ:
 MARYLAND CASINOS: MONTHLY REVENUES TOTAL REVENUE, GROSS TERMINAL REVENUE, WIN/UNIT/DAY, TABLE DATA, AND MARKET SHARE CENTER FOR GAMING RESEARCH, DECEMBER 2017 Executive Summary Since its 2010 casino debut,
Long-term Water Quality Monitoring in Estero Bay
 Long-term Water Quality Monitoring in Estero Bay Keith Kibbey Laboratory Director Lee County Environmental Laboratory Division of Natural Resource Management Estero Bay Monitoring Programs Three significant
Time Series Analysis
 Time Series Analysis A time series is a sequence of observations made: 1) over a continuous time interval, 2) of successive measurements across that interval, 3) using equal spacing between consecutive
Enhancements to the CTBTO IDC radionuclide processing pipeline for particulate samples achieving significant improvement of automatic products
 Enhancements to the CTBTO IDC radionuclide processing pipeline for particulate samples achieving significant improvement of automatic products Hakim Gheddou, Martin Kalinowski, Elena Tomuta International
The Climate of Pontotoc County
 The Climate of Pontotoc County Pontotoc County is part of the Crosstimbers. This region is a transition region from the Central Great Plains to the more irregular terrain of southeast Oklahoma. Average
The Climate of Payne County
 The Climate of Payne County Payne County is part of the Central Great Plains in the west, encompassing some of the best agricultural land in Oklahoma. Payne County is also part of the Crosstimbers in the
SYSTEM BRIEF DAILY SUMMARY
 SYSTEM BRIEF DAILY SUMMARY * ANNUAL MaxTemp NEL (MWH) Hr Ending Hr Ending LOAD (PEAK HOURS 7:00 AM TO 10:00 PM MON-SAT) ENERGY (MWH) INCREMENTAL COST DAY DATE Civic TOTAL MAXIMUM @Max MINIMUM @Min FACTOR